Mobile Game Ad Spend by Platform: A 2026 UA Budget Guide (Meta, Google, TikTok, DSP)
A practitioner's guide to mobile game ad spend by platform: how UA budgets really split across Meta, Google, TikTok, and DSPs; the mechanism behind each platform's role; how privacy-era measurement, creative systems, and genre fit change the split; a budget-allocation framework; a reallocation cadence; and the honest limits of what competitor spend data can and cannot tell you.
Updated June 21, 2026 — written and reviewed by the AdMapix Research team.
Mobile Game Ad Spend by Platform: A 2026 UA Budget Guide (Meta, Google, TikTok, DSP)

If you run mobile-game user acquisition (UA), the hardest question is not "which channel works?" It is "where should the next marginal dollar go?" Understanding mobile game ad spend by platform is really about answering that question with discipline rather than convenience. Meta still absorbs a large share of spend for many teams. Google remains critical, but for different reasons than before Apple's App Tracking Transparency (ATT). TikTok keeps taking budget in genres that can sell the game in seconds. Demand-side platforms (DSPs) become more relevant once the core channels begin to saturate. This guide breaks down mobile game ad spend by platform the way practitioners actually need it — not as fake market-wide percentages, but as a practical framework for deciding how much of your budget belongs in Meta, Google, TikTok, and DSPs.
This is for UA managers, growth leads, and studio founders who own a media budget and have to justify its split. We will explain the mechanism behind each platform's role, show how privacy-era measurement, creative systems, and genre fit reshape the split, give you an allocation framework and a reallocation cadence, and be honest about the one thing no external tool can give you — a competitor's real spend. For neighboring reading, see the mobile game marketing strategy overview, the best mobile game ad formats playbook, and ad spend tracking.
TL;DR — Mobile Game Ad Spend by Platform
- The real question is marginal, not absolute. Not "which channel is best" but "where does the next dollar earn the most." That answer changes with saturation, creative supply, and genre.
- Each platform plays a specialized role. Meta is the core scale layer, Google the core-or-conditional layer (Android, YouTube explanation, Play), TikTok the creative-led growth and discovery layer, and DSPs the selective diversification layer once core channels saturate.
- Teams rarely lose to a "bad" channel. They lose by asking the right channel to do the wrong job — scaling cheap TikTok installs too early, over-feeding Meta past fatigue, or treating Google as one black box.
- Privacy-era measurement broke surface metrics. Post-ATT, platform-reported efficiency and real downstream value can diverge, especially on iOS. Judge channels on cohort value, not reported cost per install.
- Creative supply now gates spend more than targeting does. The platforms that gain share reward fast creative iteration; a slow creative pipeline caps how much any channel can absorb profitably.
- Genre maps to mechanism. Casual, hybrid-casual, mid-core, and live-service titles do not scale through the same discovery engine, so the right split is genre-specific.
- You cannot see a competitor's real spend. Any "competitor spend" figure is a model, not a measurement. Use creative evidence to read what rivals are running; use your own analytics to decide where your budget goes.
Why Budget Allocation Goes Wrong
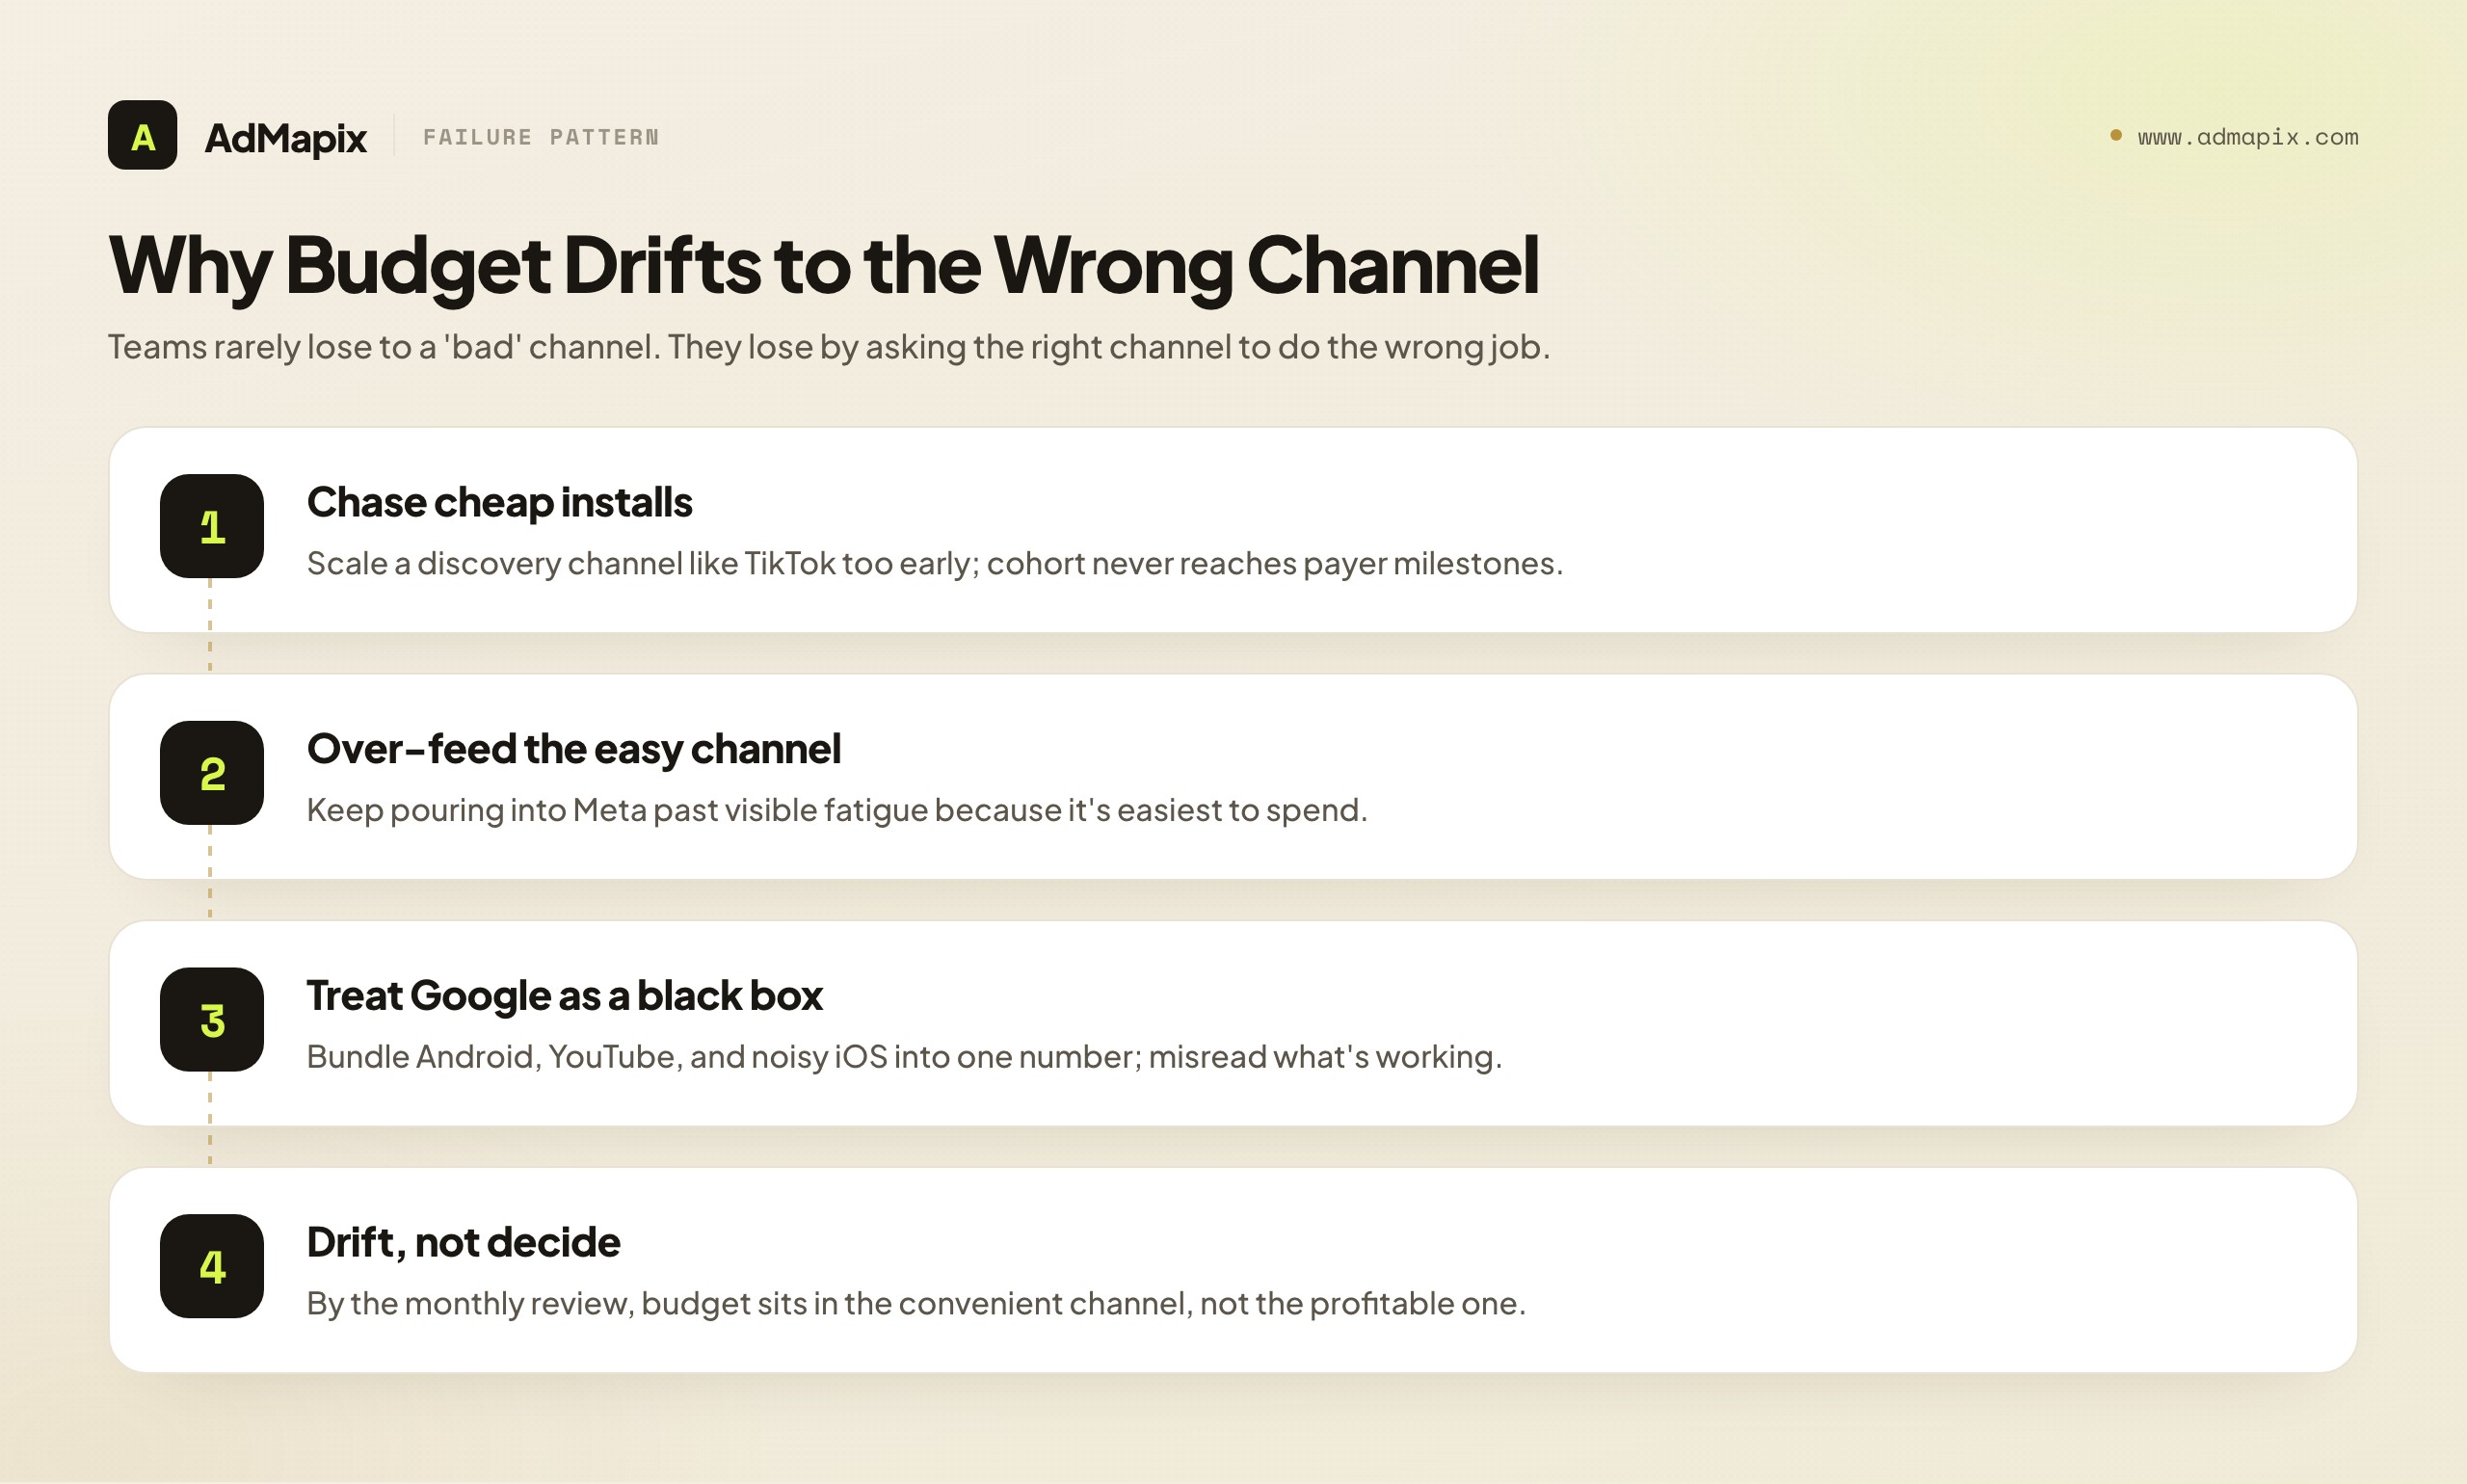
Most UA teams do not lose efficiency because they picked a "bad" channel. They lose it because they ask the wrong channel to do the wrong job. The failure is rarely dramatic; it is a slow drift of budget toward whatever is most convenient to spend, dressed up as a data-driven decision.
A common example: a team sees cheap TikTok installs and scales too early, only to discover those users never reach meaningful progression or payer milestones. The top-of-funnel number looked great; the cohort value did not. Another team keeps pouring money into Meta because it is the easiest place to spend, even though creative fatigue is already visible and incremental returns are flattening — the channel is not bad, the marginal dollar there is. A third team judges Google as one black box, instead of separating Android strength, YouTube's explanatory value, and iOS measurement noise, and so misreads which part of Google is actually working. By the time the monthly review happens, budget has already drifted toward the most convenient channel, not the most profitable one.
The underlying error is treating channels as interchangeable buckets of "installs" rather than as distinct discovery mechanisms with distinct strengths and ceilings. Once you internalize that each platform wins a different kind of user through a different mechanism, the allocation question stops being "which is cheapest this week" and becomes "which mechanism does my next dollar of growth actually need." That reframing is the whole game.
The Marginal Dollar: The Only Allocation Concept That Matters
Almost every budgeting mistake above reduces to one analytical error: judging a channel by its average return instead of its marginal return. The distinction is the single most important idea in this guide, so it deserves a careful treatment.
A channel's average return is the blended performance of everything you spend on it — total value divided by total spend. Its marginal return is the value of the next dollar you add. These two numbers diverge dramatically as a channel scales. Early dollars on a channel often find the cheapest, most qualified users; later dollars reach into less efficient inventory and more fatigued audiences. So a channel can show a healthy average return while its marginal return has already collapsed — and if you allocate on the average, you keep feeding a channel whose next dollar is now unprofitable, because the historical average still looks fine.
This is precisely why teams over-feed Meta past fatigue. The blended Meta number stays acceptable because it is dragged up by the efficient early spend, while the dollars you are currently adding are returning far less. The only way to see this is to look at the margin — what is the incremental cost and value of the spend you added this week, this month — rather than the comforting blended average. When the marginal return on a channel drops below the marginal return available elsewhere, the next dollar should move, even if that channel's average still leads the pack.
The marginal lens also explains why diversification is not about loyalty to "having a balanced mix." You diversify because each channel has a ceiling — a point where its marginal return falls below another channel's. DSPs become relevant not because variety is virtuous but because the core channels' marginal return has flattened and a DSP's marginal dollar now beats it. Allocation, properly understood, is a continuous reallocation of the marginal dollar to wherever it currently earns the most — and that "wherever" moves with fatigue, saturation, seasonality, and your creative supply. Hold the marginal-dollar idea firmly and every other section of this guide becomes an application of it.
What Changed: Why the Split Got Harder
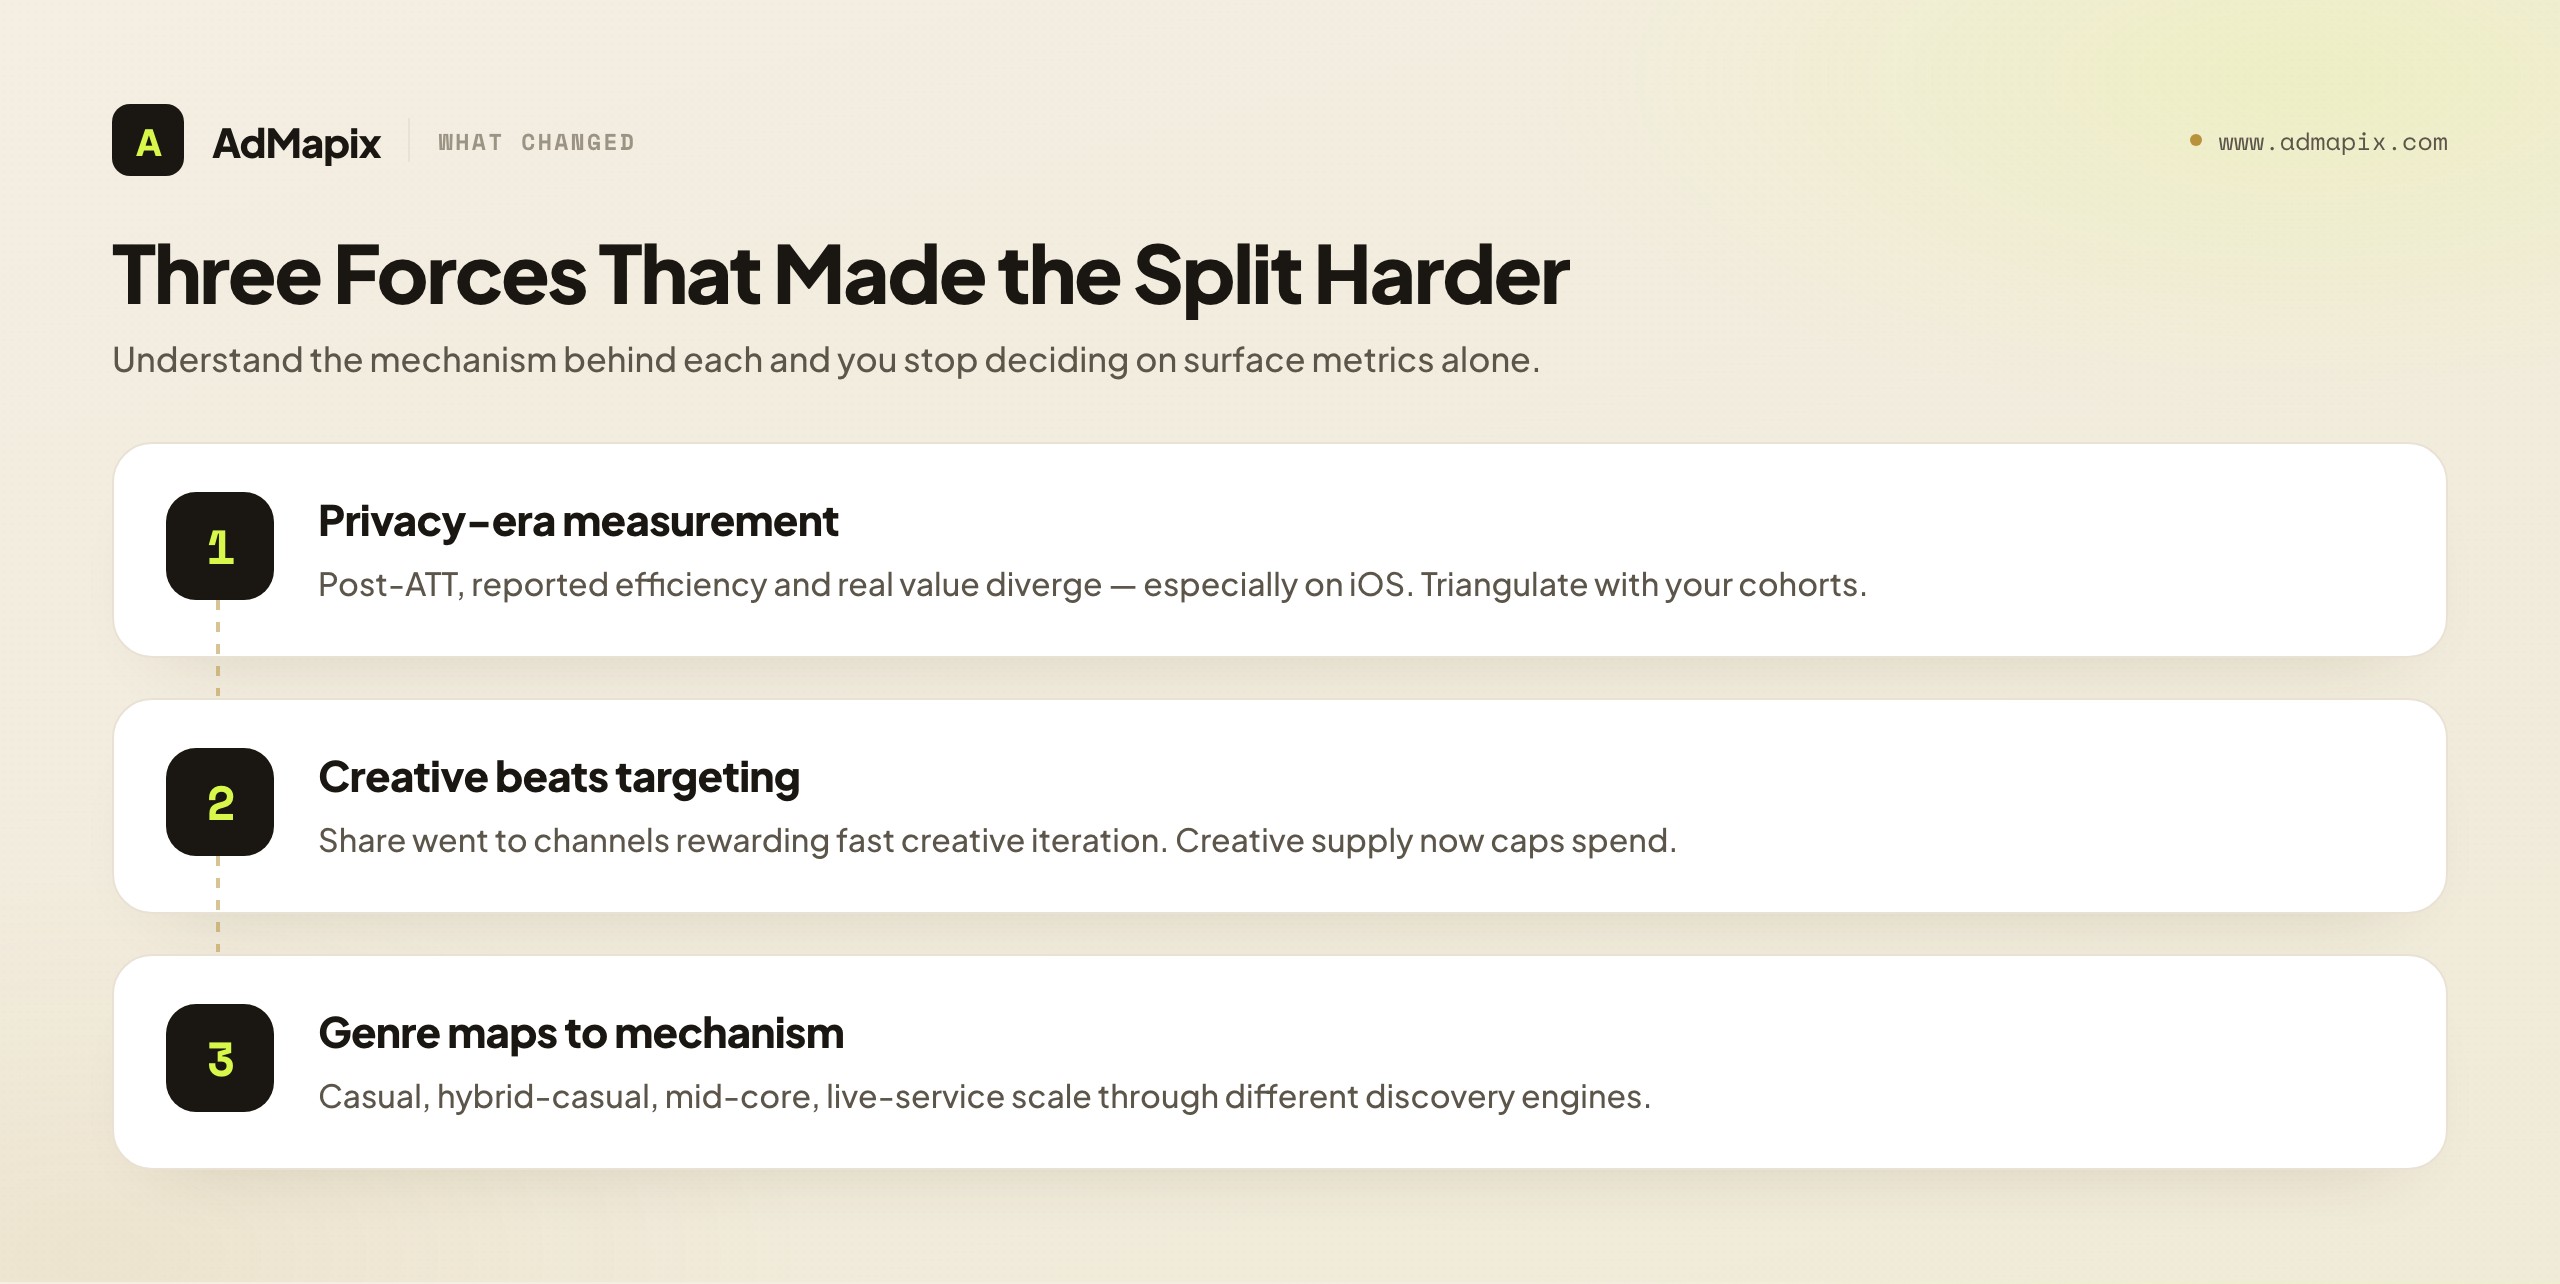
Three forces made the platform-split question sharper, and all three are still in force in 2026.
1. Privacy-era measurement changed what "good performance" looks like. Post-ATT, platform-reported efficiency and actual downstream value can diverge more than teams expect, especially on iOS. A channel can report an attractive cost per install while the users it brings monetize poorly — and because attribution is noisier, the gap is harder to see. The consequence for budgeting is that you cannot trust a single platform's self-reported numbers to compare channels; you have to triangulate with your own cohort and lifetime-value (LTV) data. Apple's App Tracking Transparency framework is the primary cause, and understanding it is now part of every UA budget conversation.
2. Creative systems matter more than targeting systems. The platforms that gained share were often the ones that rewarded fast creative iteration, not just audience selection. As targeting moved toward broad, system-driven delivery, the creative became the lever — which means the constraint on how much budget a channel can absorb is increasingly your creative supply, not the channel's inventory. A channel you cannot feed with fresh creative will fatigue and cap, no matter how much budget you have.
3. Genres map more clearly to channel strengths. Casual, hybrid-casual, mid-core, and live-service games do not scale through the same discovery mechanism. A game that can sell itself in two seconds thrives on discovery-led channels; a game whose appeal is depth and progression needs channels that allow explanation. The right split is therefore genre-specific, and a one-size template imported from another studio will misallocate.
If you understand the mechanism behind each platform's role, you stop making channel decisions based on surface metrics alone. That is the difference between scaling efficiently and just buying installs.
How Budgets Were Really Distributed
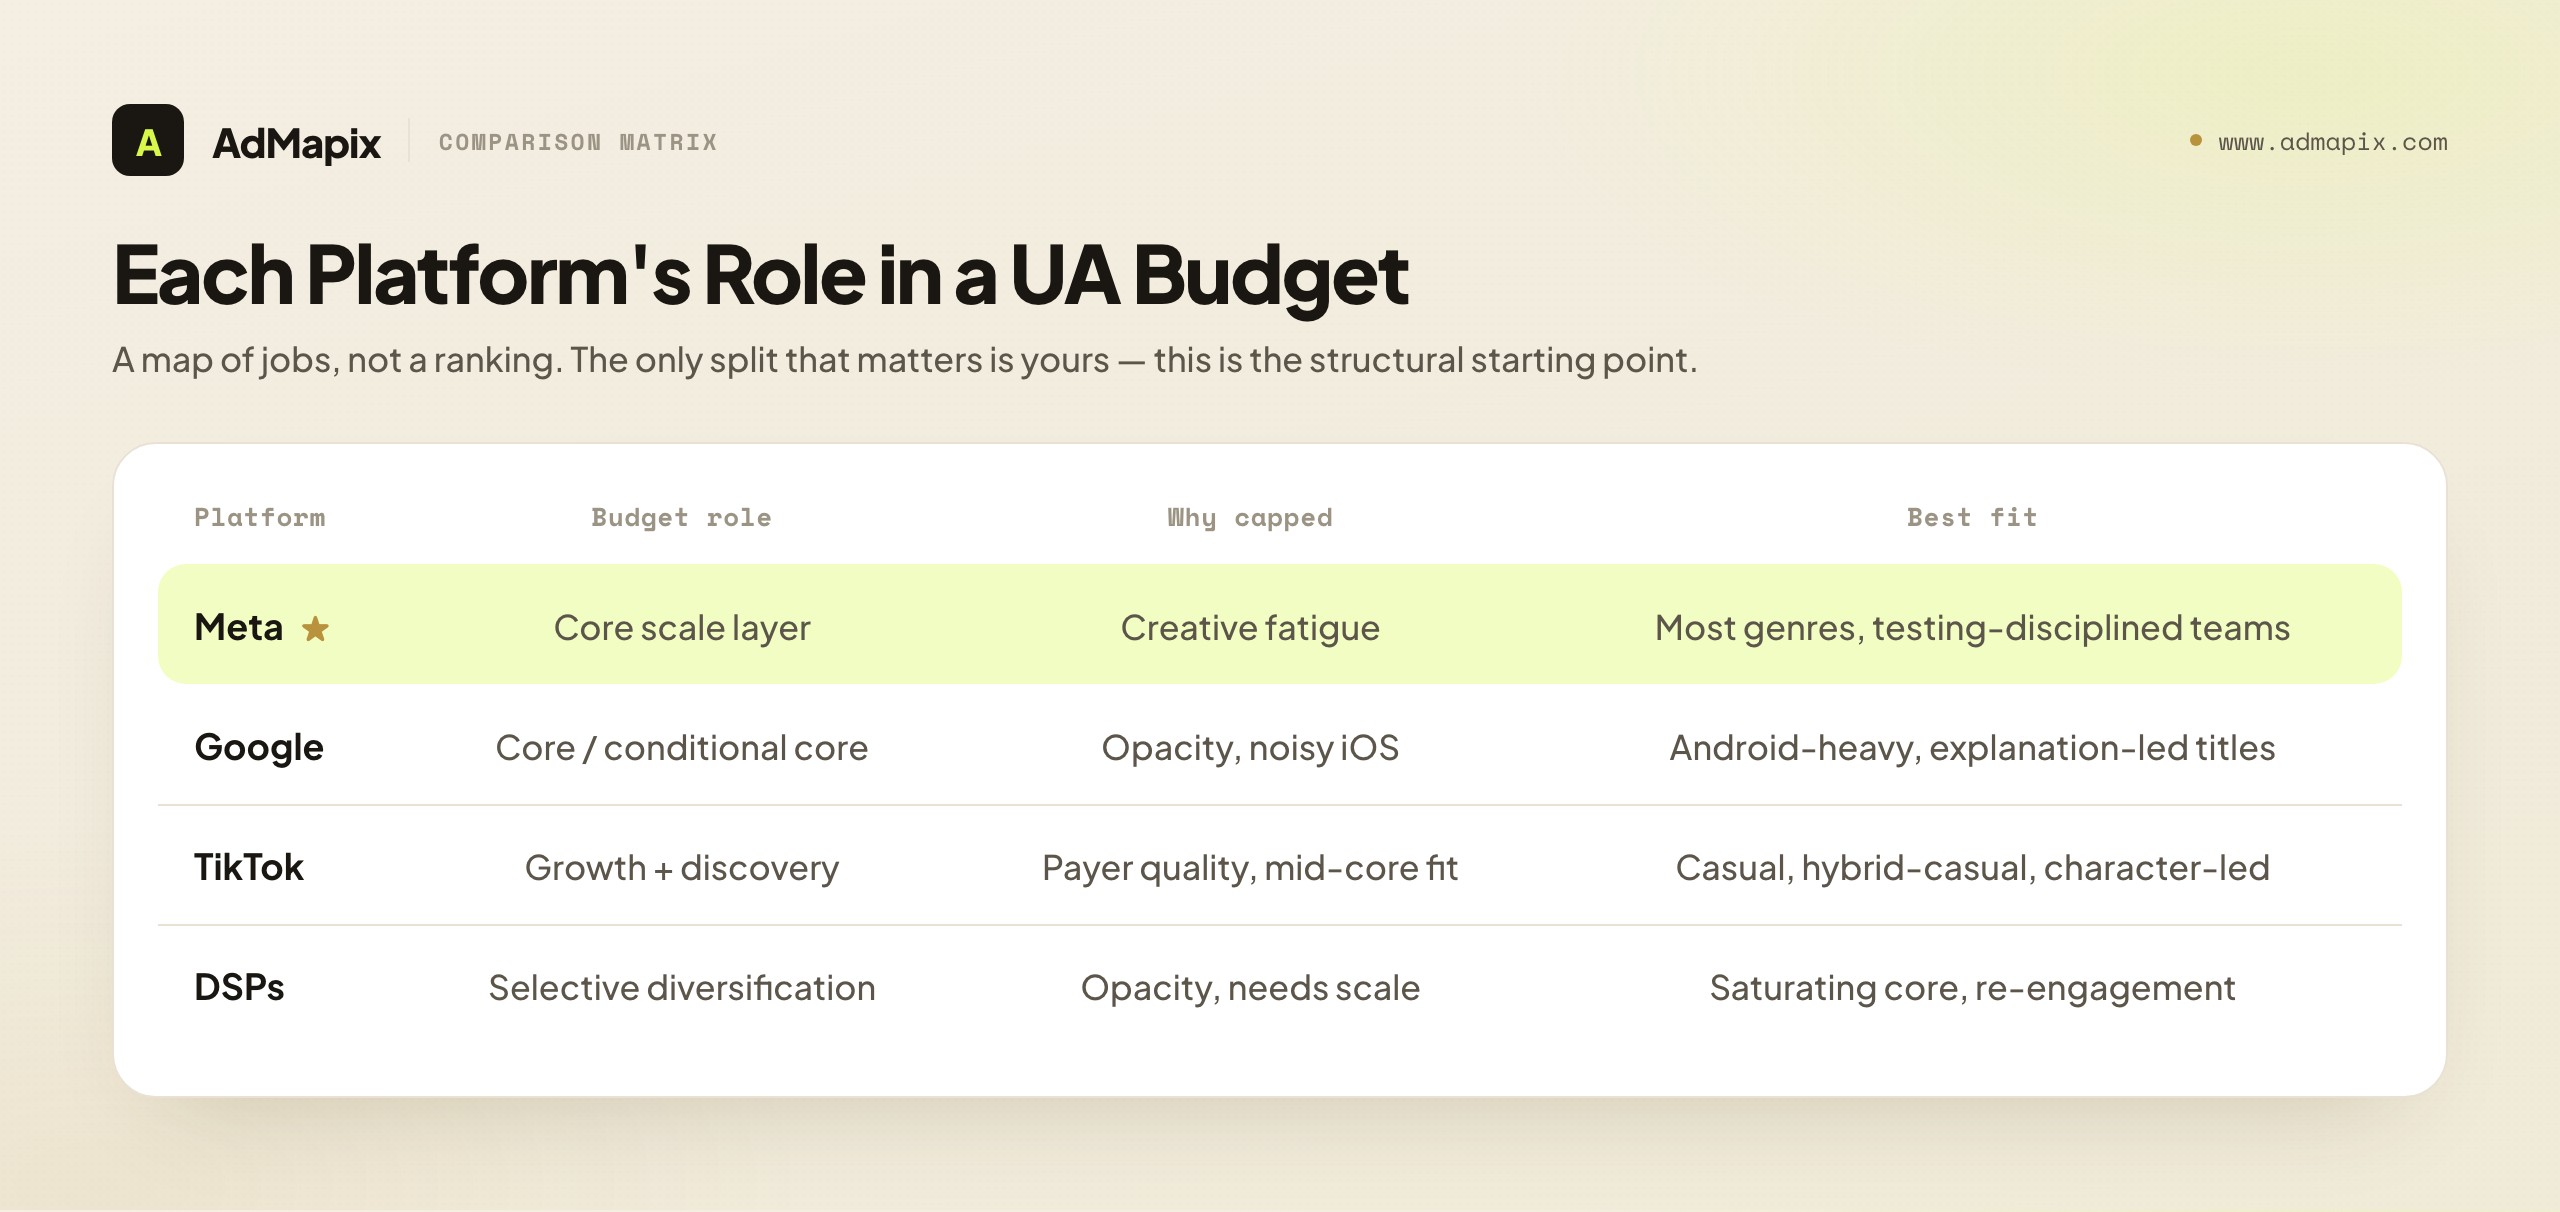
The most useful high-level view is this: Meta and Google remained the core budget layer, TikTok was the biggest share gainer in creative-led growth, and DSPs became the selective diversification layer. The shift was not about one platform replacing the others; it was about each platform becoming more specialized. The table below frames the role each plays, not a fake market-wide percentage — because the only split that matters is yours, and it depends on your genre, geos, and creative supply.
| Platform | Typical role | Why share holds or grows | Why share is capped | Best fit |
|---|---|---|---|---|
| Meta | Core scale budget | Broad reach, strong optimization, fast creative testing, reliable volume + quality mix | Creative fatigue, rising competition, weak returns when the creative pipeline is slow | Most genres, teams with testing discipline |
| Core or conditional core | Android strength, intent-rich inventory, YouTube for explanation, Play ecosystem | Less transparency inside App campaigns, noisier iOS measurement, slower feedback loop | Android-heavy titles, games needing explanation, global scale | |
| TikTok | Growth + discovery budget | Native short-form discovery, fast hook validation, broad reach, cheap concept testing | Lower payer quality in some genres, fatigue, harder mid-core qualification | Casual + hybrid-casual, character-led titles, concept discovery |
| DSPs | Selective diversification | Incremental reach once core saturates, in-app inventory, retargeting, specialized geos | Opacity, requires scale to justify, harder to evaluate, variable quality | Saturating core channels, mid-core/live-service re-engagement |
Read the table as a map of jobs, not a ranking. Meta and Google are core because they reliably absorb scale across most genres; TikTok is where creative-led discovery happens cheaply; DSPs are the layer you add deliberately once the core channels stop returning on the marginal dollar. The art of the split is matching each layer to the job your growth actually needs this quarter.
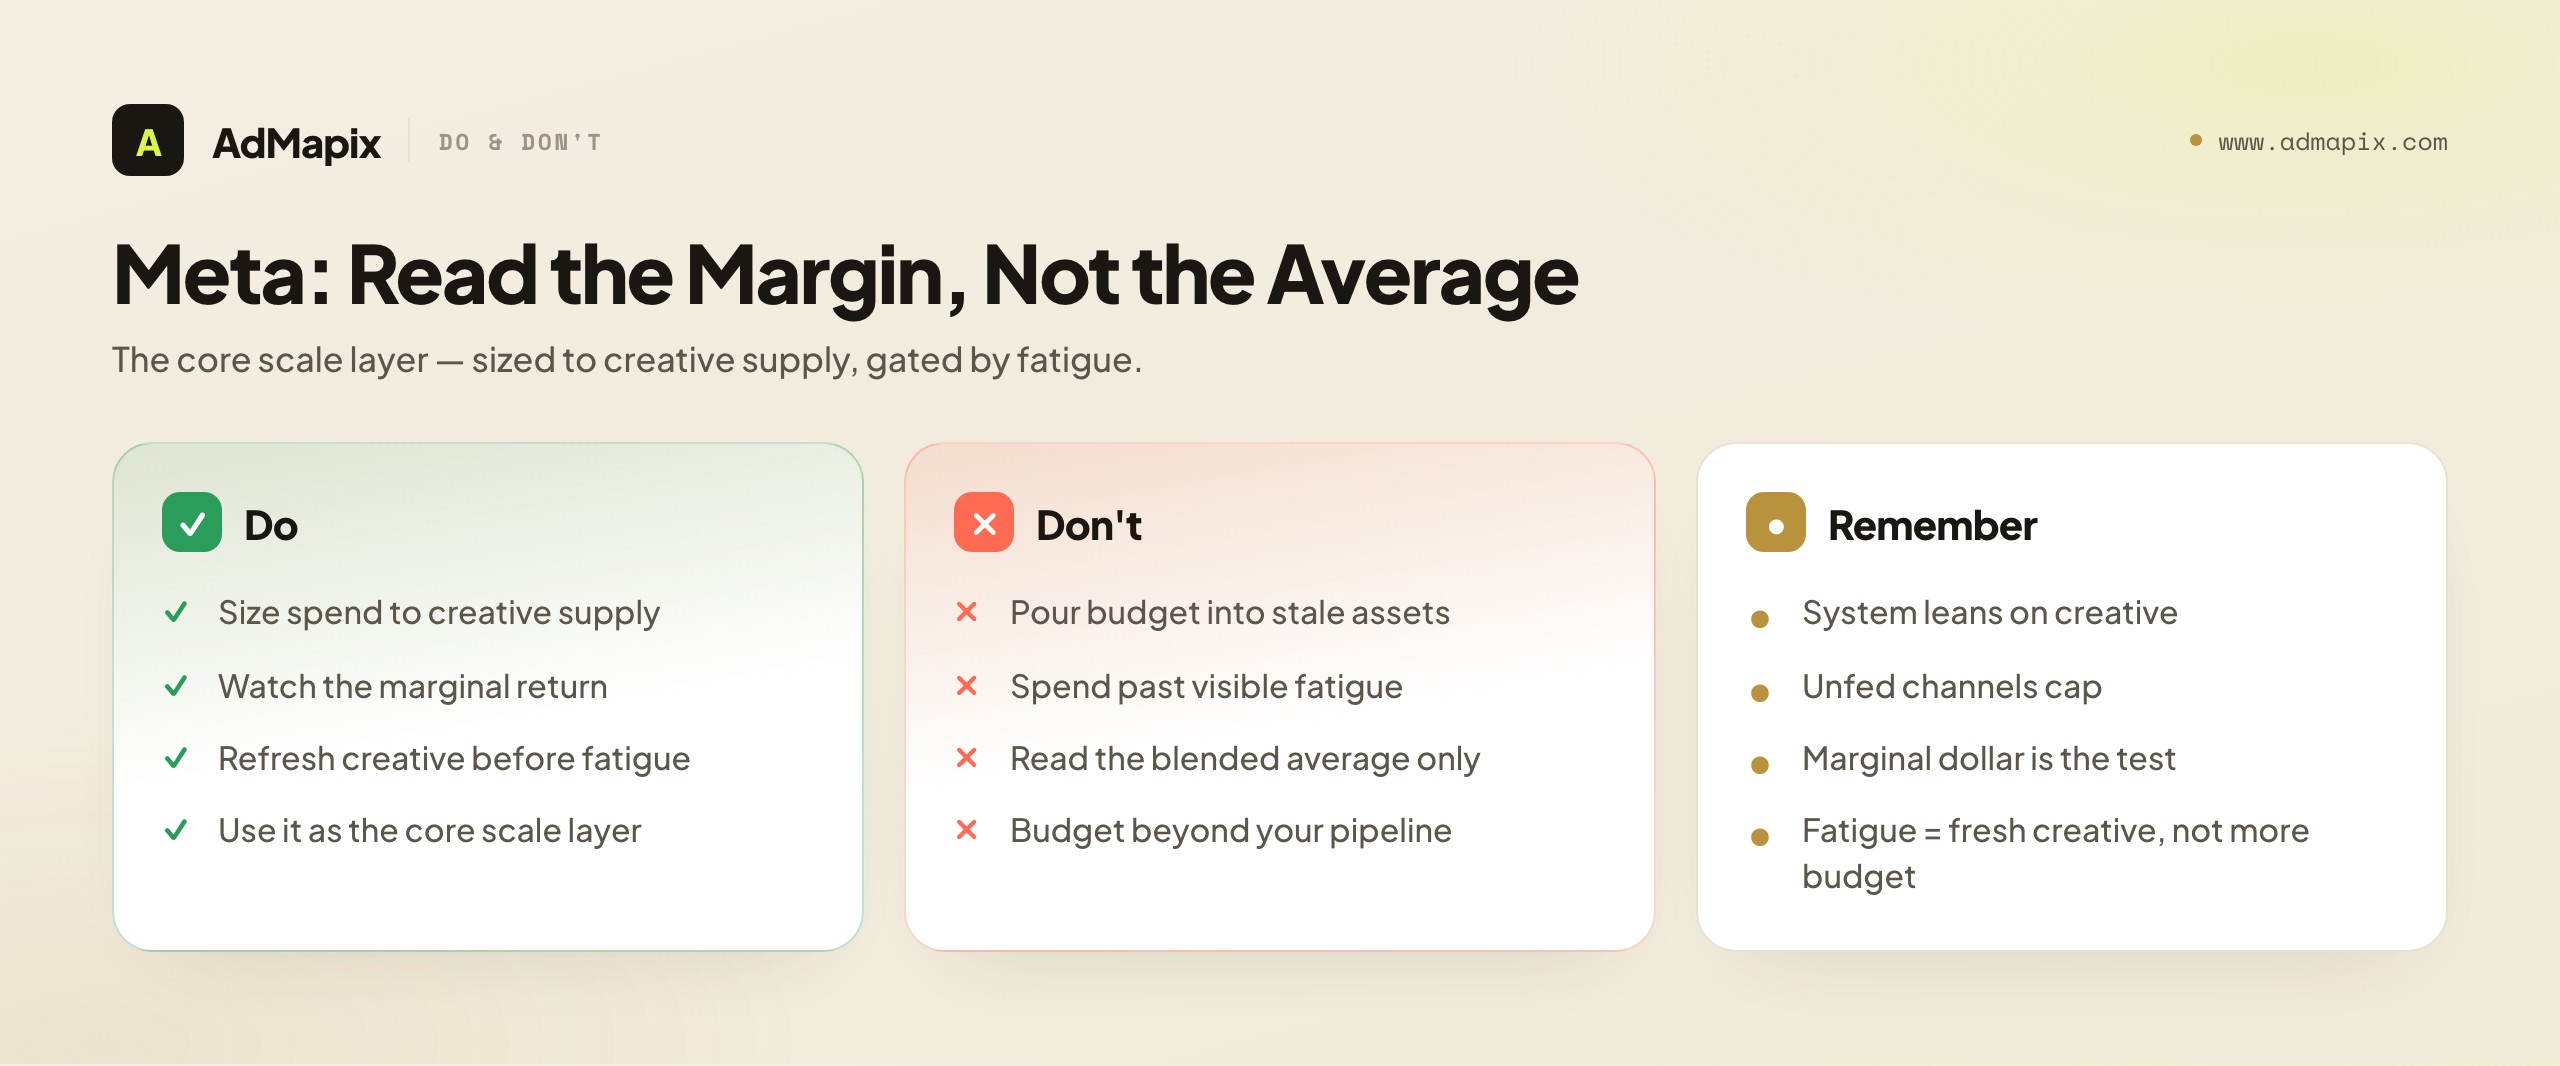
Meta: The Core Scale Layer
Meta is, for most mobile-game advertisers, the core scale budget — the channel that reliably absorbs volume while holding a workable mix of quantity and quality. Its strengths are broad reach, mature optimization, and a delivery system that rewards fast creative testing. For a team with a strong creative pipeline, Meta is usually where the first large tranche of budget goes, because it converts creative supply into installs efficiently across a wide range of genres.
The constraint on Meta is creative fatigue. Because the system leans heavily on creative to do the targeting work, the moment your creative pipeline slows, incremental returns flatten and the marginal dollar there stops earning. This is the single most common Meta budgeting mistake: continuing to pour budget into a channel showing visible fatigue because it is the easiest place to spend, rather than recognizing that the marginal return has collapsed even though the average still looks acceptable. The fix is to read Meta on the margin — is the next dollar still returning? — and to gate Meta spend on your creative refresh rate. A channel you cannot feed will not scale.
The practical budgeting rule for Meta: treat it as the core layer, size it to your creative supply, and watch the marginal return rather than the blended average. When fatigue appears, the answer is usually fresh creative, not more budget into stale assets — and if you cannot supply the creative, the honest move is to cap Meta and route the marginal dollar to a channel you can feed. For how fatigue shows up and how to manage it, see ad creative fatigue analysis.
There is a second Meta-specific dynamic worth budgeting around: the system's preference for broad, automated delivery. Modern Meta setups reward giving the algorithm room — broad targeting, varied creative, and consolidated campaign structures — rather than the granular manual targeting of years past. The budgeting consequence is that fragmenting spend across many narrow audiences often performs worse than concentrating it and letting the system optimize across a fleet of creatives. So on Meta, "how to spend" and "how much to spend" are linked: a consolidated structure fed with varied creative tends to scale the core budget more efficiently than a sprawl of small, micro-targeted campaigns. Teams migrating from old manual habits sometimes blame Meta for declining returns when the real culprit is a campaign structure that starves the system of the breadth it now needs.
Finally, remember that Meta's reliability across genres is exactly why it is the default place budget drifts. That reliability is a strength when you allocate deliberately and a trap when you allocate by inertia. The discipline is to keep asking whether Meta's marginal dollar still beats the alternatives — and to be willing to cap it the moment a fresh-creative shortage or a saturating audience makes the next dollar return less than it would elsewhere. Meta earns the core role; it does not earn an automatic claim on every incremental dollar.
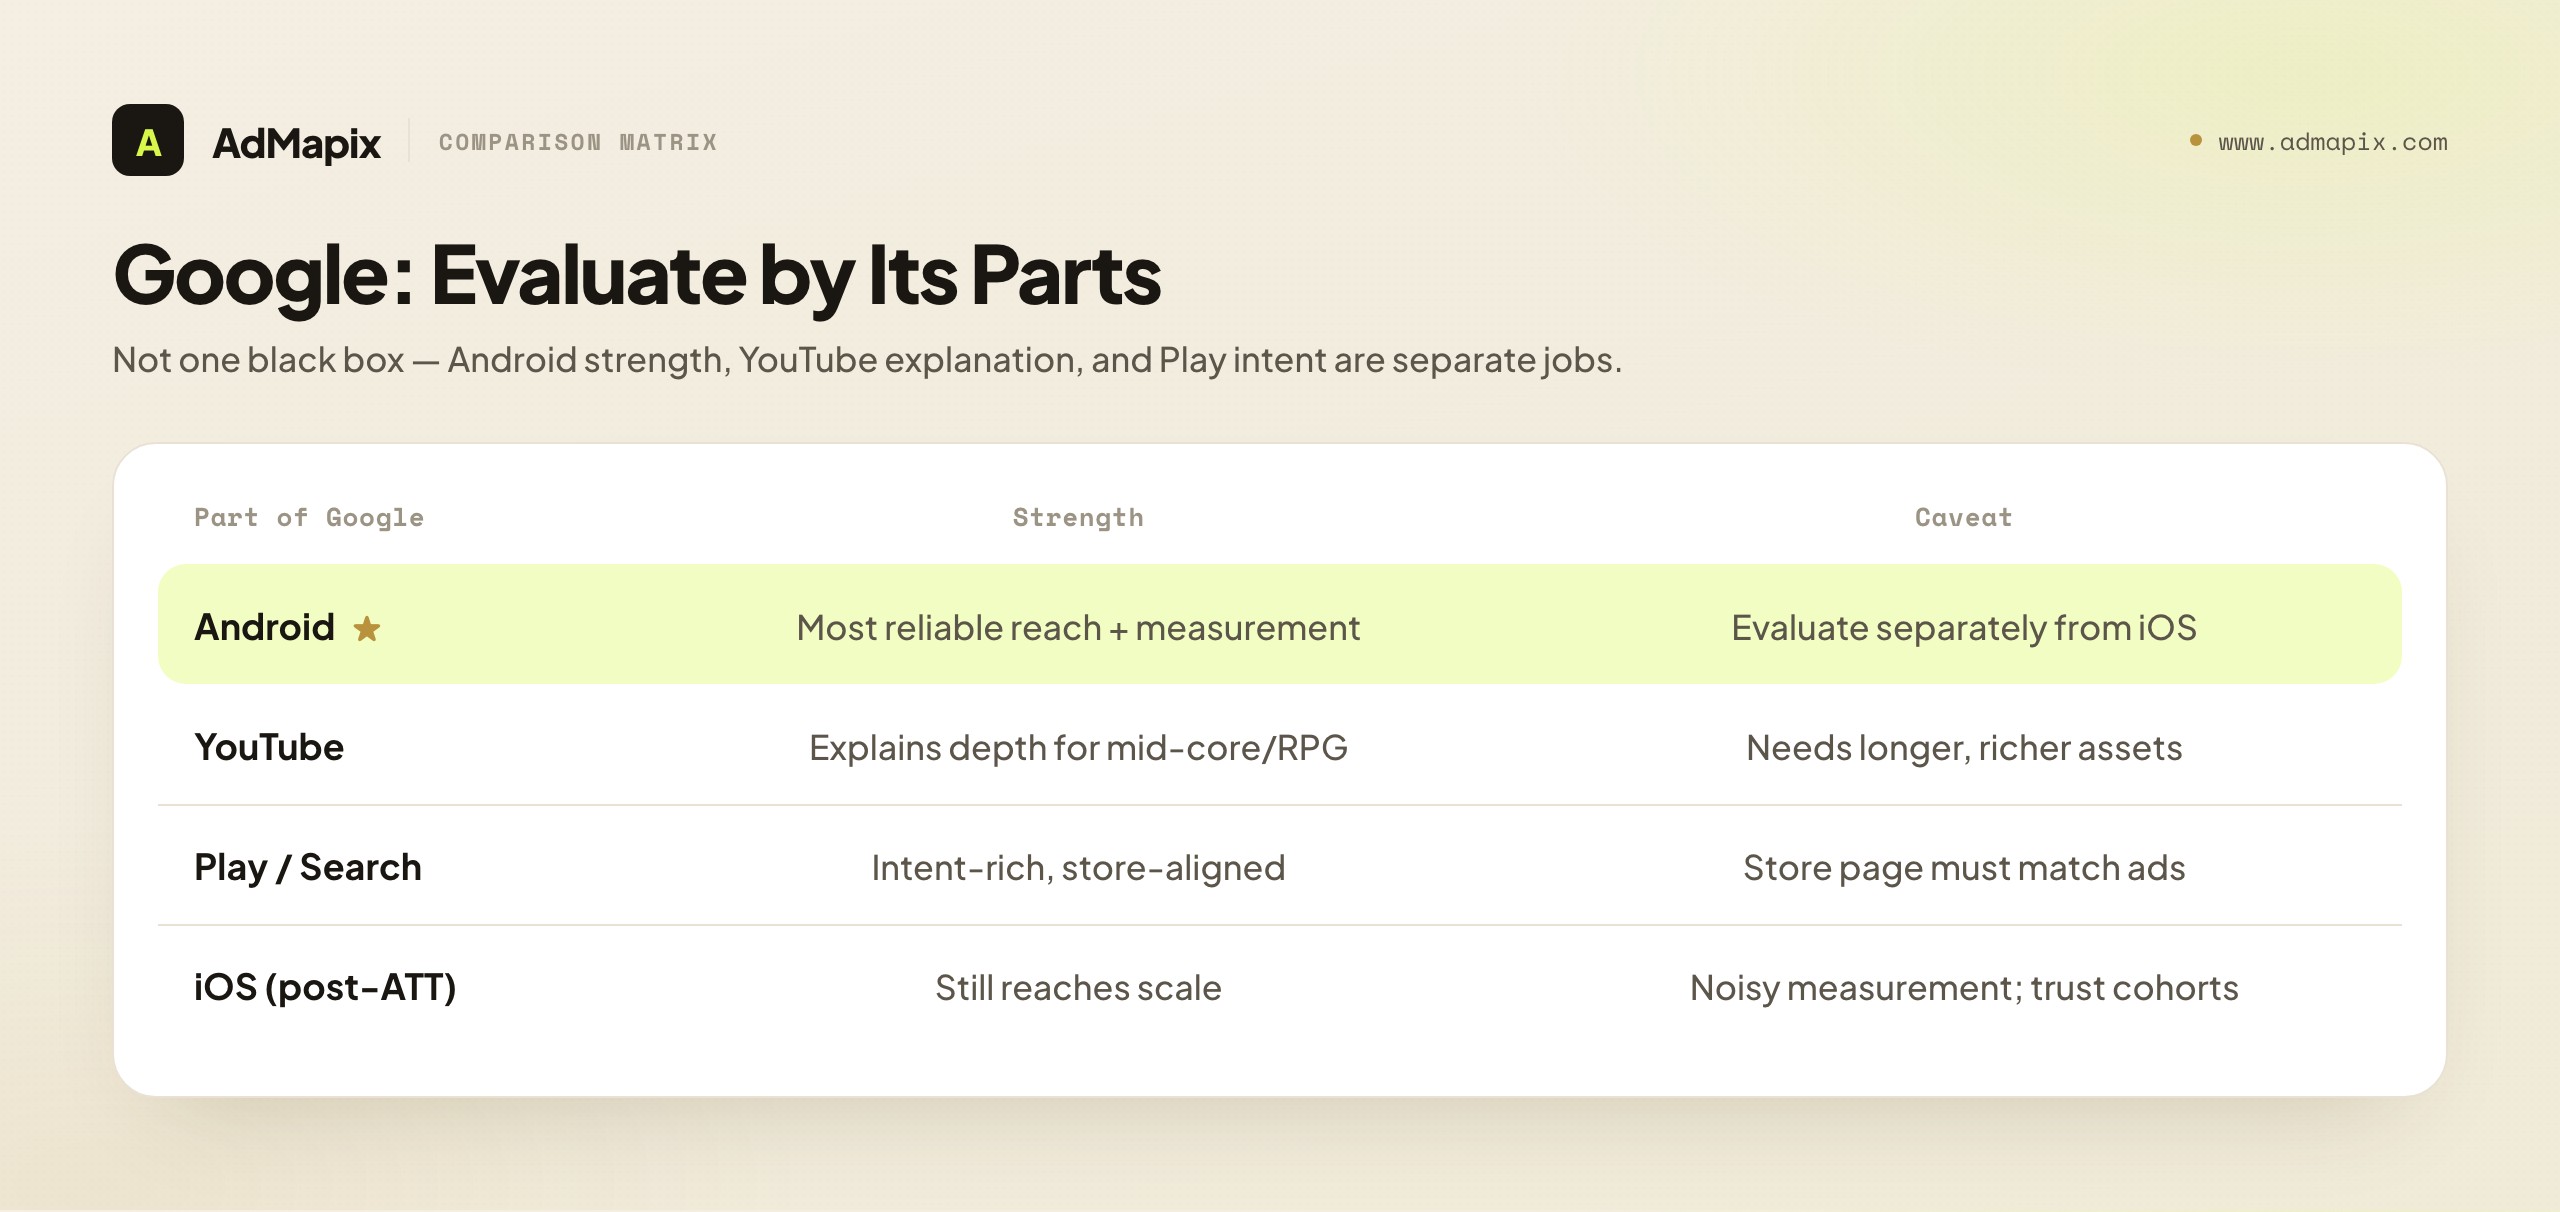
Google: Core or Conditional Core
Google is powerful but easy to misjudge, because teams treat it as one black box when it is really several distinct strengths bundled into App campaigns. The first is Android strength — Google's reach and measurement are most reliable on Android, so for Android-heavy titles Google is core, not optional. The second is YouTube's explanatory value — for games that need more than a one-second hook to communicate depth, YouTube is a uniquely good place to explain, which makes Google disproportionately valuable for mid-core, strategy, and RPG titles. The third is the Play ecosystem, where intent-rich Search and store surfaces capture users already looking.
The complications are also specific. App campaigns offer less transparency than a single-placement buy, so you see less about where and why delivery happens, which slows diagnosis. iOS measurement is noisier post-ATT, so Google's iOS efficiency is harder to trust than its Android efficiency. And the feedback loop is slower than Meta's or TikTok's, so learning takes longer. The budgeting consequence is that Google should be evaluated by its parts — Android performance separately from iOS, YouTube's explanatory role separately from Search intent — rather than as a single blended number that hides which part is carrying the channel.
The practical rule for Google: it is core for Android-heavy and explanation-dependent titles, conditional for iOS-heavy casual titles where measurement noise makes its value hard to confirm. Feed it a deep, varied asset set (breadth is the format on Google), keep the store page on-promise, and judge Android and iOS separately. Google's App campaign documentation is the primary source for how the system distributes and what it needs to perform.
A budgeting nuance unique to Google is the slow feedback loop. Because App campaigns learn across multiple surfaces and need volume before they stabilize, knee-jerk reallocation hurts Google more than it hurts the faster channels. A common mistake is treating Google like Meta — cutting budget the moment a week looks soft — which resets the learning and makes the next week worse. The discipline is patience: give Google enough sustained budget and stable assets to learn, judge it over a longer window than you judge Meta or TikTok, and resist the temptation to thrash it. This longer evaluation window is itself a budgeting decision, because it means Google's spend should be steadier and less reactive than the discovery layer's.
The other point is that Google's value is disproportionately about coverage and intent capture that the social channels do not provide. YouTube reaches users in an explanatory, lean-back context; Search and Play capture users already looking. For a game whose appeal needs explaining, or for capturing the demand your other channels create, Google is doing a job no other platform does as well — which is why for many mid-core and global titles it is genuinely core, not a supplement. Budgeting it as an afterthought because its dashboard is less transparent than Meta's underrates the specific, hard-to-replace coverage it provides.
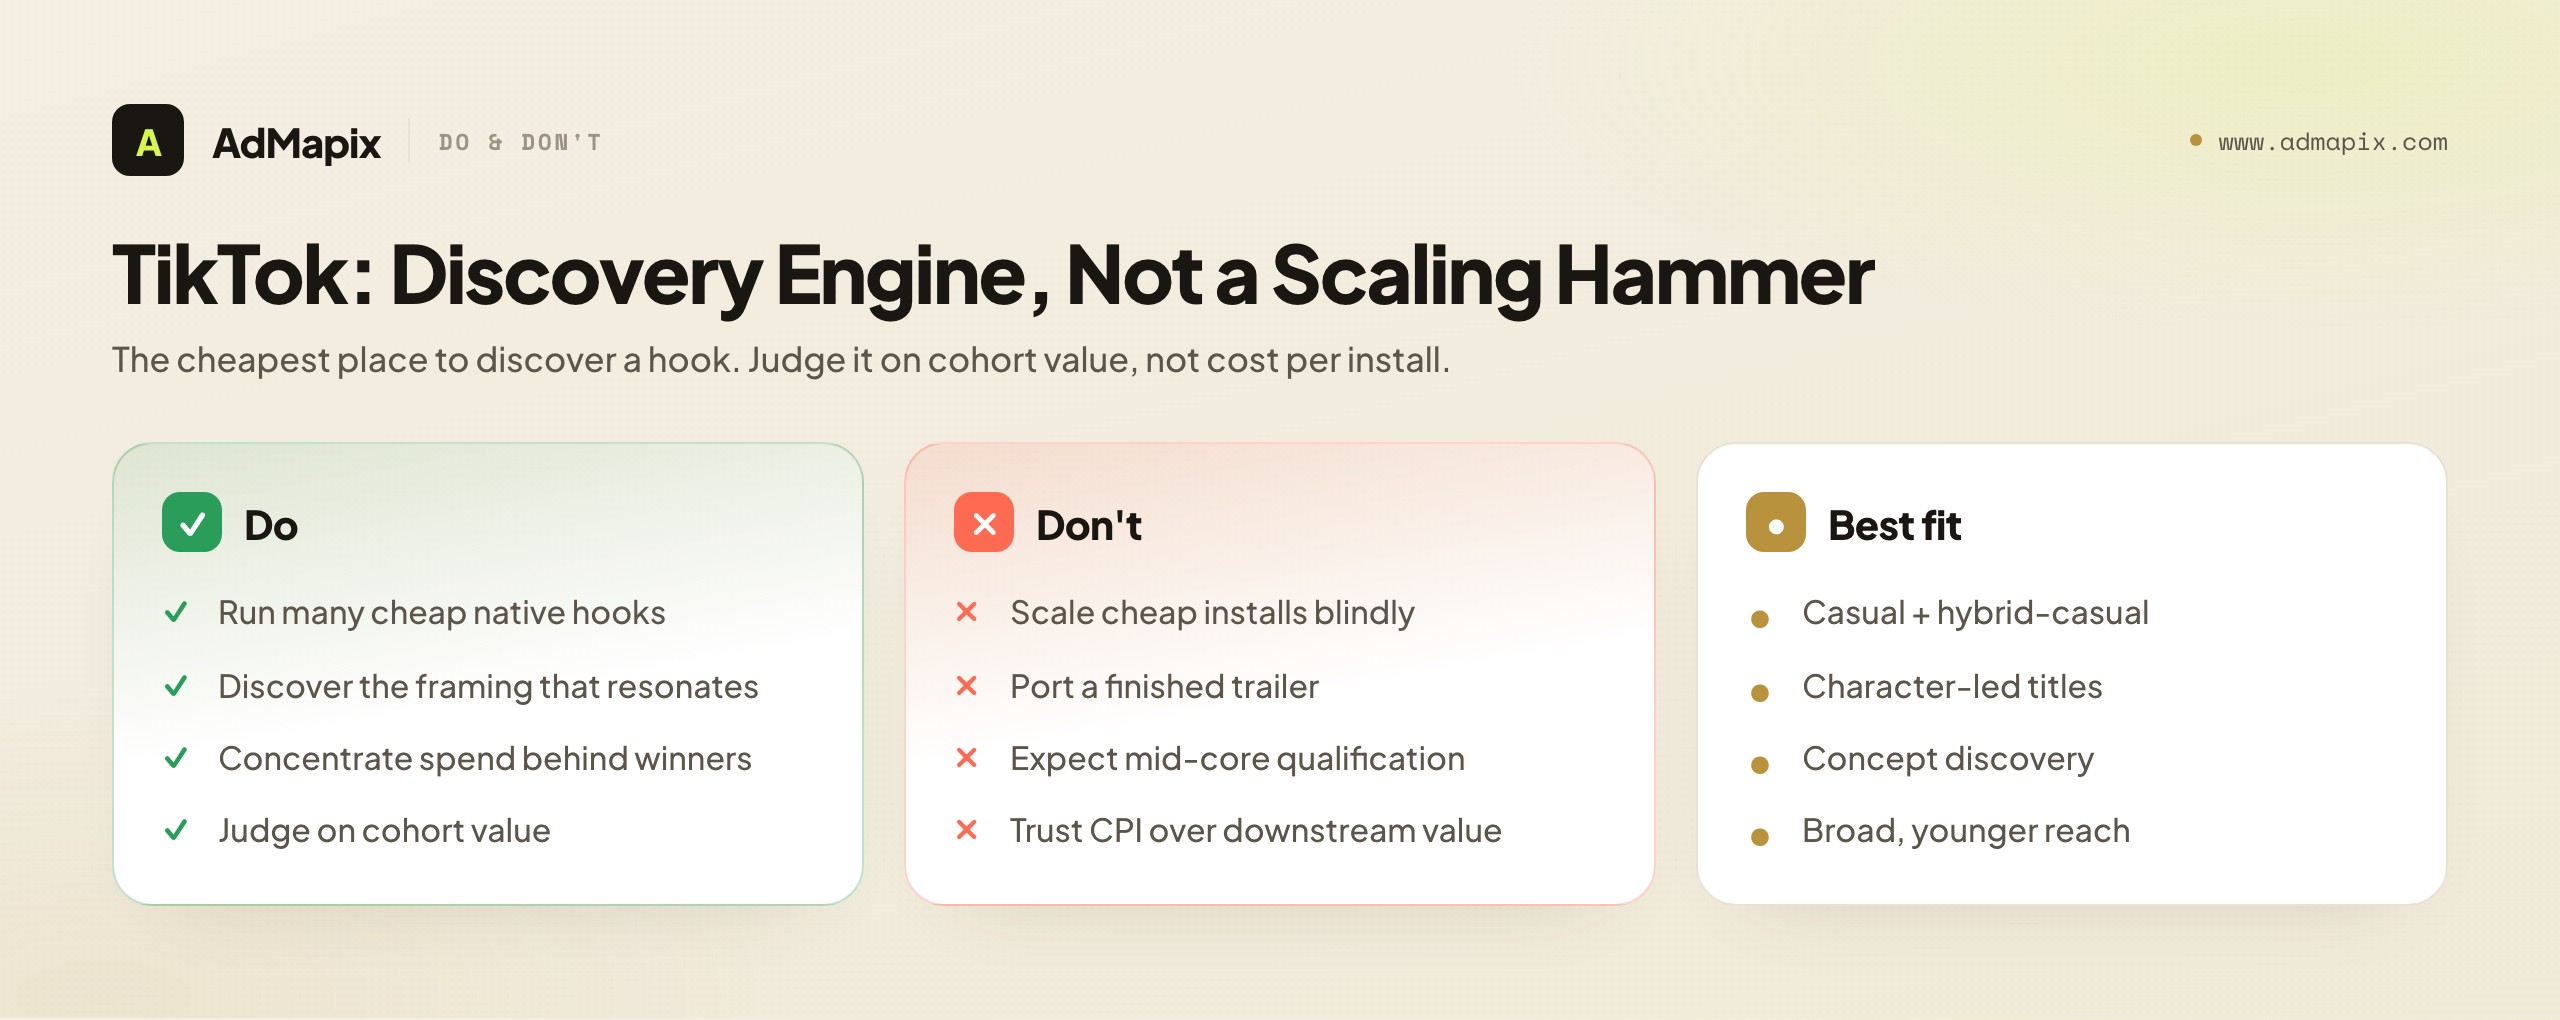
TikTok: The Creative-Led Growth Layer
TikTok is the biggest share gainer in creative-led growth, and its role in a budget is discovery and concept validation. Its mechanism is native short-form: the feed surfaces what resonates fast, so TikTok is the cheapest place to discover a hook before carrying it to more expensive channels. For casual, hybrid-casual, and character-led titles that can sell themselves in seconds, TikTok absorbs growth budget efficiently and reaches a broad, younger audience that the other core channels reach less natively.
The constraint is quality of install in some genres. Cheap TikTok installs can look excellent at the top of the funnel and disappoint downstream — the users may never reach progression or payer milestones — which is exactly the trap of scaling a discovery channel as if it were a qualification channel. TikTok is also harder for mid-core qualification, where a one-second native hook cannot communicate the depth that retains and monetizes those players. So TikTok's budget role is genre-sensitive: a large growth layer for fast-selling casual genres, a smaller discovery layer for deep games.
The practical rule for TikTok: use it as the discovery engine and a growth layer for genres that sell fast, but judge it on cohort value, not cost per install, and resist scaling cheap installs before the cohort proves out. Its biggest gift is iteration speed — run many cheap native hooks, find the framing the feed validates, then concentrate spend. TikTok's business help center documents the specs and creative guidance. For reverse-engineering what is working there, see best TikTok ad spy tools.
The most strategic way to budget TikTok is to treat its spend as partly a creative R&D line, not purely a UA line. The hooks you validate cheaply on TikTok are reusable across your whole channel mix — a framing that resonates natively often translates, adapted, into a Meta video or a Google YouTube asset. So a dollar spent discovering a winning hook on TikTok can return value far beyond the installs it directly buys, by feeding the creative supply that raises the ceiling on your core channels. Teams that account for this stop under-investing in TikTok discovery because the direct-response math looked marginal; the indirect value of the validated creative is part of the return.
That said, the discipline against premature scaling is non-negotiable. The classic TikTok failure is reading a flood of cheap installs as success and pouring budget in before the cohort has demonstrated retention or monetization — and then discovering the users churned. The correct sequence is discover cheaply, wait for the cohort signal, and only then scale the validated framing. On deep games especially, where TikTok's native hook cannot communicate the depth that retains and monetizes, the cohort check is the difference between a useful discovery channel and an expensive source of unqualified installs.
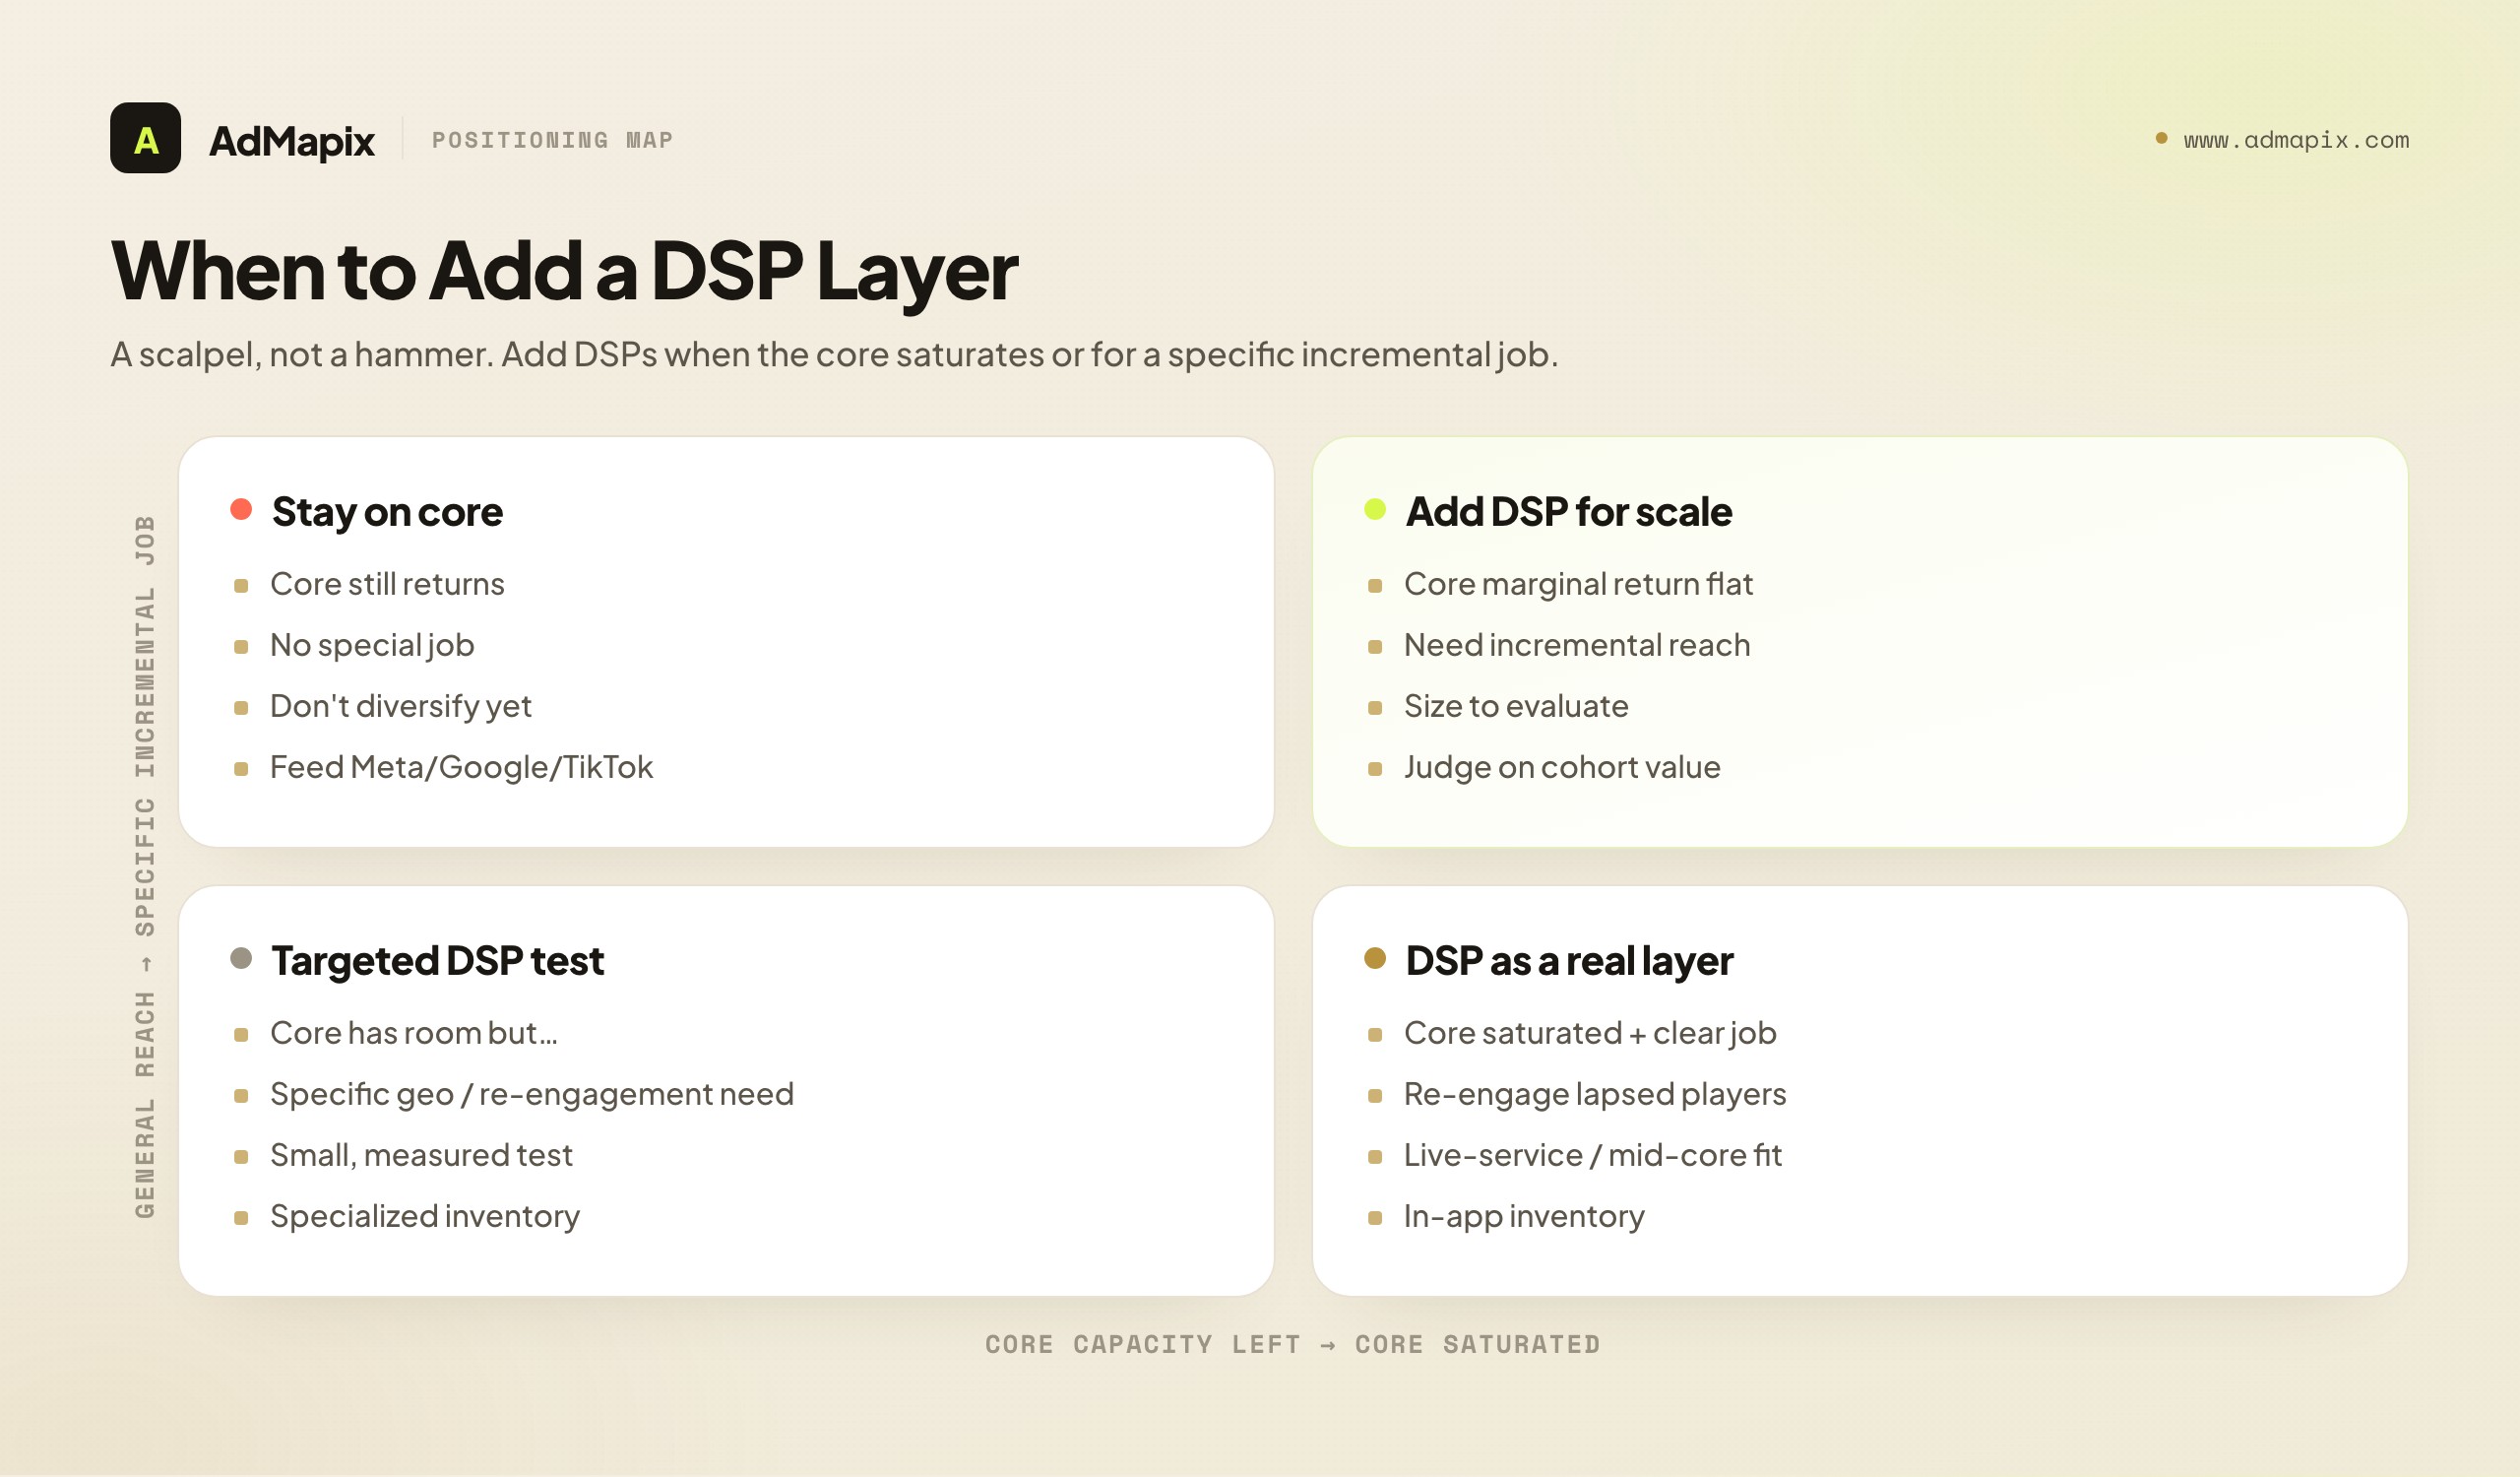
DSPs: The Selective Diversification Layer
Demand-side platforms — the programmatic and in-app networks that buy across exchanges and inside other apps — are the layer you add deliberately, not the layer you start with. Their role becomes relevant once the core channels begin to saturate and the marginal dollar in Meta, Google, or TikTok stops returning. At that point a DSP offers incremental reach: inventory the core channels do not efficiently cover, in-app placements inside other games, retargeting and re-engagement, and access to specialized geos.
The trade-offs are real. DSPs are typically more opaque than the self-serve giants, require enough scale to justify the setup and evaluation overhead, and vary more in quality, so they are harder to assess. This is why DSPs are a diversification layer rather than a core one: you turn to them when you have a saturation problem to solve or a specific incremental job (re-engaging lapsed mid-core players, reaching a geo the core channels under-serve), not as a default destination for new budget. For live-service and mid-core titles with retention-and-re-engagement needs, the in-app DSP layer can be especially valuable.
The evaluation challenge deserves emphasis, because it is where DSP budgets most often go wrong. Because a DSP's reporting is less transparent and its inventory more varied, you have less ability to diagnose why it is or is not working — which means you must lean even harder on your own first-party cohort data to judge it. A DSP that reports attractive costs but delivers users who do not retain is a familiar disappointment, and the only defense is holding it to the same cohort-value standard you apply to the core. Size a DSP test large enough to produce a readable cohort but small enough that a bad result is affordable, and give it a clear job to do — "re-engage lapsed payers in these geos" — rather than a vague mandate to "diversify." A DSP with a specific, measurable job is evaluable; a DSP added for the sake of variety is a budget you cannot defend.
The incrementality question is also sharper for DSPs than for the core. Some DSP and re-engagement spend risks paying for users who would have returned anyway, so the honest test is whether the spend is incremental — driving installs or re-engagements that would not have happened without it — not just whether it is attributed. This is hard to measure precisely, but the discipline of asking "is this incremental, or am I paying for organic behavior?" keeps DSP budgets honest in a way attribution alone does not.
The practical rule for DSPs: add them when the core channels saturate or when you have a specific incremental job, size them to a level where you can actually evaluate them, and judge them on the same cohort-value standard as everything else. They are a scalpel, not a hammer — most useful when the core layer's marginal return has clearly flattened. For the networks and intelligence sources in this space, see moloco ad intelligence, mintegral ad intelligence, and the in-game advertising overview.
Budgeting iOS and Android as Two Different Problems
One of the most consequential post-ATT realities is that iOS and Android have become distinct budgeting problems, even within the same channel. Treating them as one blended line is a recipe for misallocation, because the measurement reliability — and therefore your confidence in any spend decision — differs sharply between them.
On Android, attribution is generally cleaner, the feedback loop is faster, and platform-reported efficiency tracks actual value more closely. This makes Android the platform where you can trust the numbers most, optimize fastest, and scale with the least guesswork. For Android-heavy titles, that reliability is itself a reason to weight Google more heavily, because Google's Android strength compounds with measurement you can actually believe. Budget decisions on Android can lean harder on the channels' own signals because those signals are less distorted.
On iOS, ATT made measurement noisier, so platform-reported cost per install and even modeled value diverge more from reality. The practical consequence is not "spend less on iOS" — iOS users often monetize better in many genres — but "trust the platform numbers less and your own cohort data more." On iOS you lean harder on first-party measurement, cohort retention, and lifetime-value curves, and you treat reported install costs as a rough signal rather than a verdict. A channel that looks efficient on iOS by its own reporting may not be, and the only way to know is your own downstream data.
The budgeting implication is to split your evaluation, not just your spend. Pull cohort value for iOS and Android separately on each channel, and let the marginal-dollar logic run within each. It is entirely normal — and correct — to reach different platform splits for iOS and Android of the same game, because the channels' relative strengths and your measurement confidence differ by operating system. A single blended split papers over exactly the distinctions that should drive the decision.
Creative Supply Is the Real Spend Ceiling
It is worth stating plainly, because it inverts how many teams think about budget: in 2026, your creative supply is more often the ceiling on profitable spend than any channel's inventory is. The reason is the shift from targeting systems to creative systems. As delivery moved toward broad, automated audience selection, the creative became the thing the system optimizes with — which means a channel can only absorb as much budget as you can feed it with creative that has not yet fatigued.
This reframes a familiar problem. When a team says "Meta has stopped scaling," they usually mean "we have run out of fresh creative for Meta." The channel did not shrink; the creative pipeline did. So the question "how much should I spend on Meta?" is partly a question of "how much fresh creative can I produce for Meta?" A studio that can ship a high volume of new hooks weekly can profitably absorb far more spend on a creative-hungry channel than a studio shipping one new concept a month, regardless of budget size.
The budgeting consequences are concrete. First, size each core channel's spend to the creative you can supply, not to the budget you have — extra budget poured onto a starved channel just feeds fatigue. Second, treat creative production capacity as a growth investment, because increasing it raises the ceiling on profitable spend across every creative-hungry channel at once. Third, when allocating the marginal dollar, factor in which channel you can actually feed — a slightly less efficient channel you can supply with fresh creative may absorb the marginal dollar better than a more efficient one you have already exhausted. This is also why the discovery channels matter beyond their direct spend: a hook validated cheaply on TikTok becomes creative fuel you can carry to Meta and Google, effectively raising their ceilings. The flow of creative, not just budget, is part of the allocation. For how to read fatigue signals, see ad creative fatigue analysis; for building the testing engine, see the creative testing framework.
A Budget-Allocation Framework
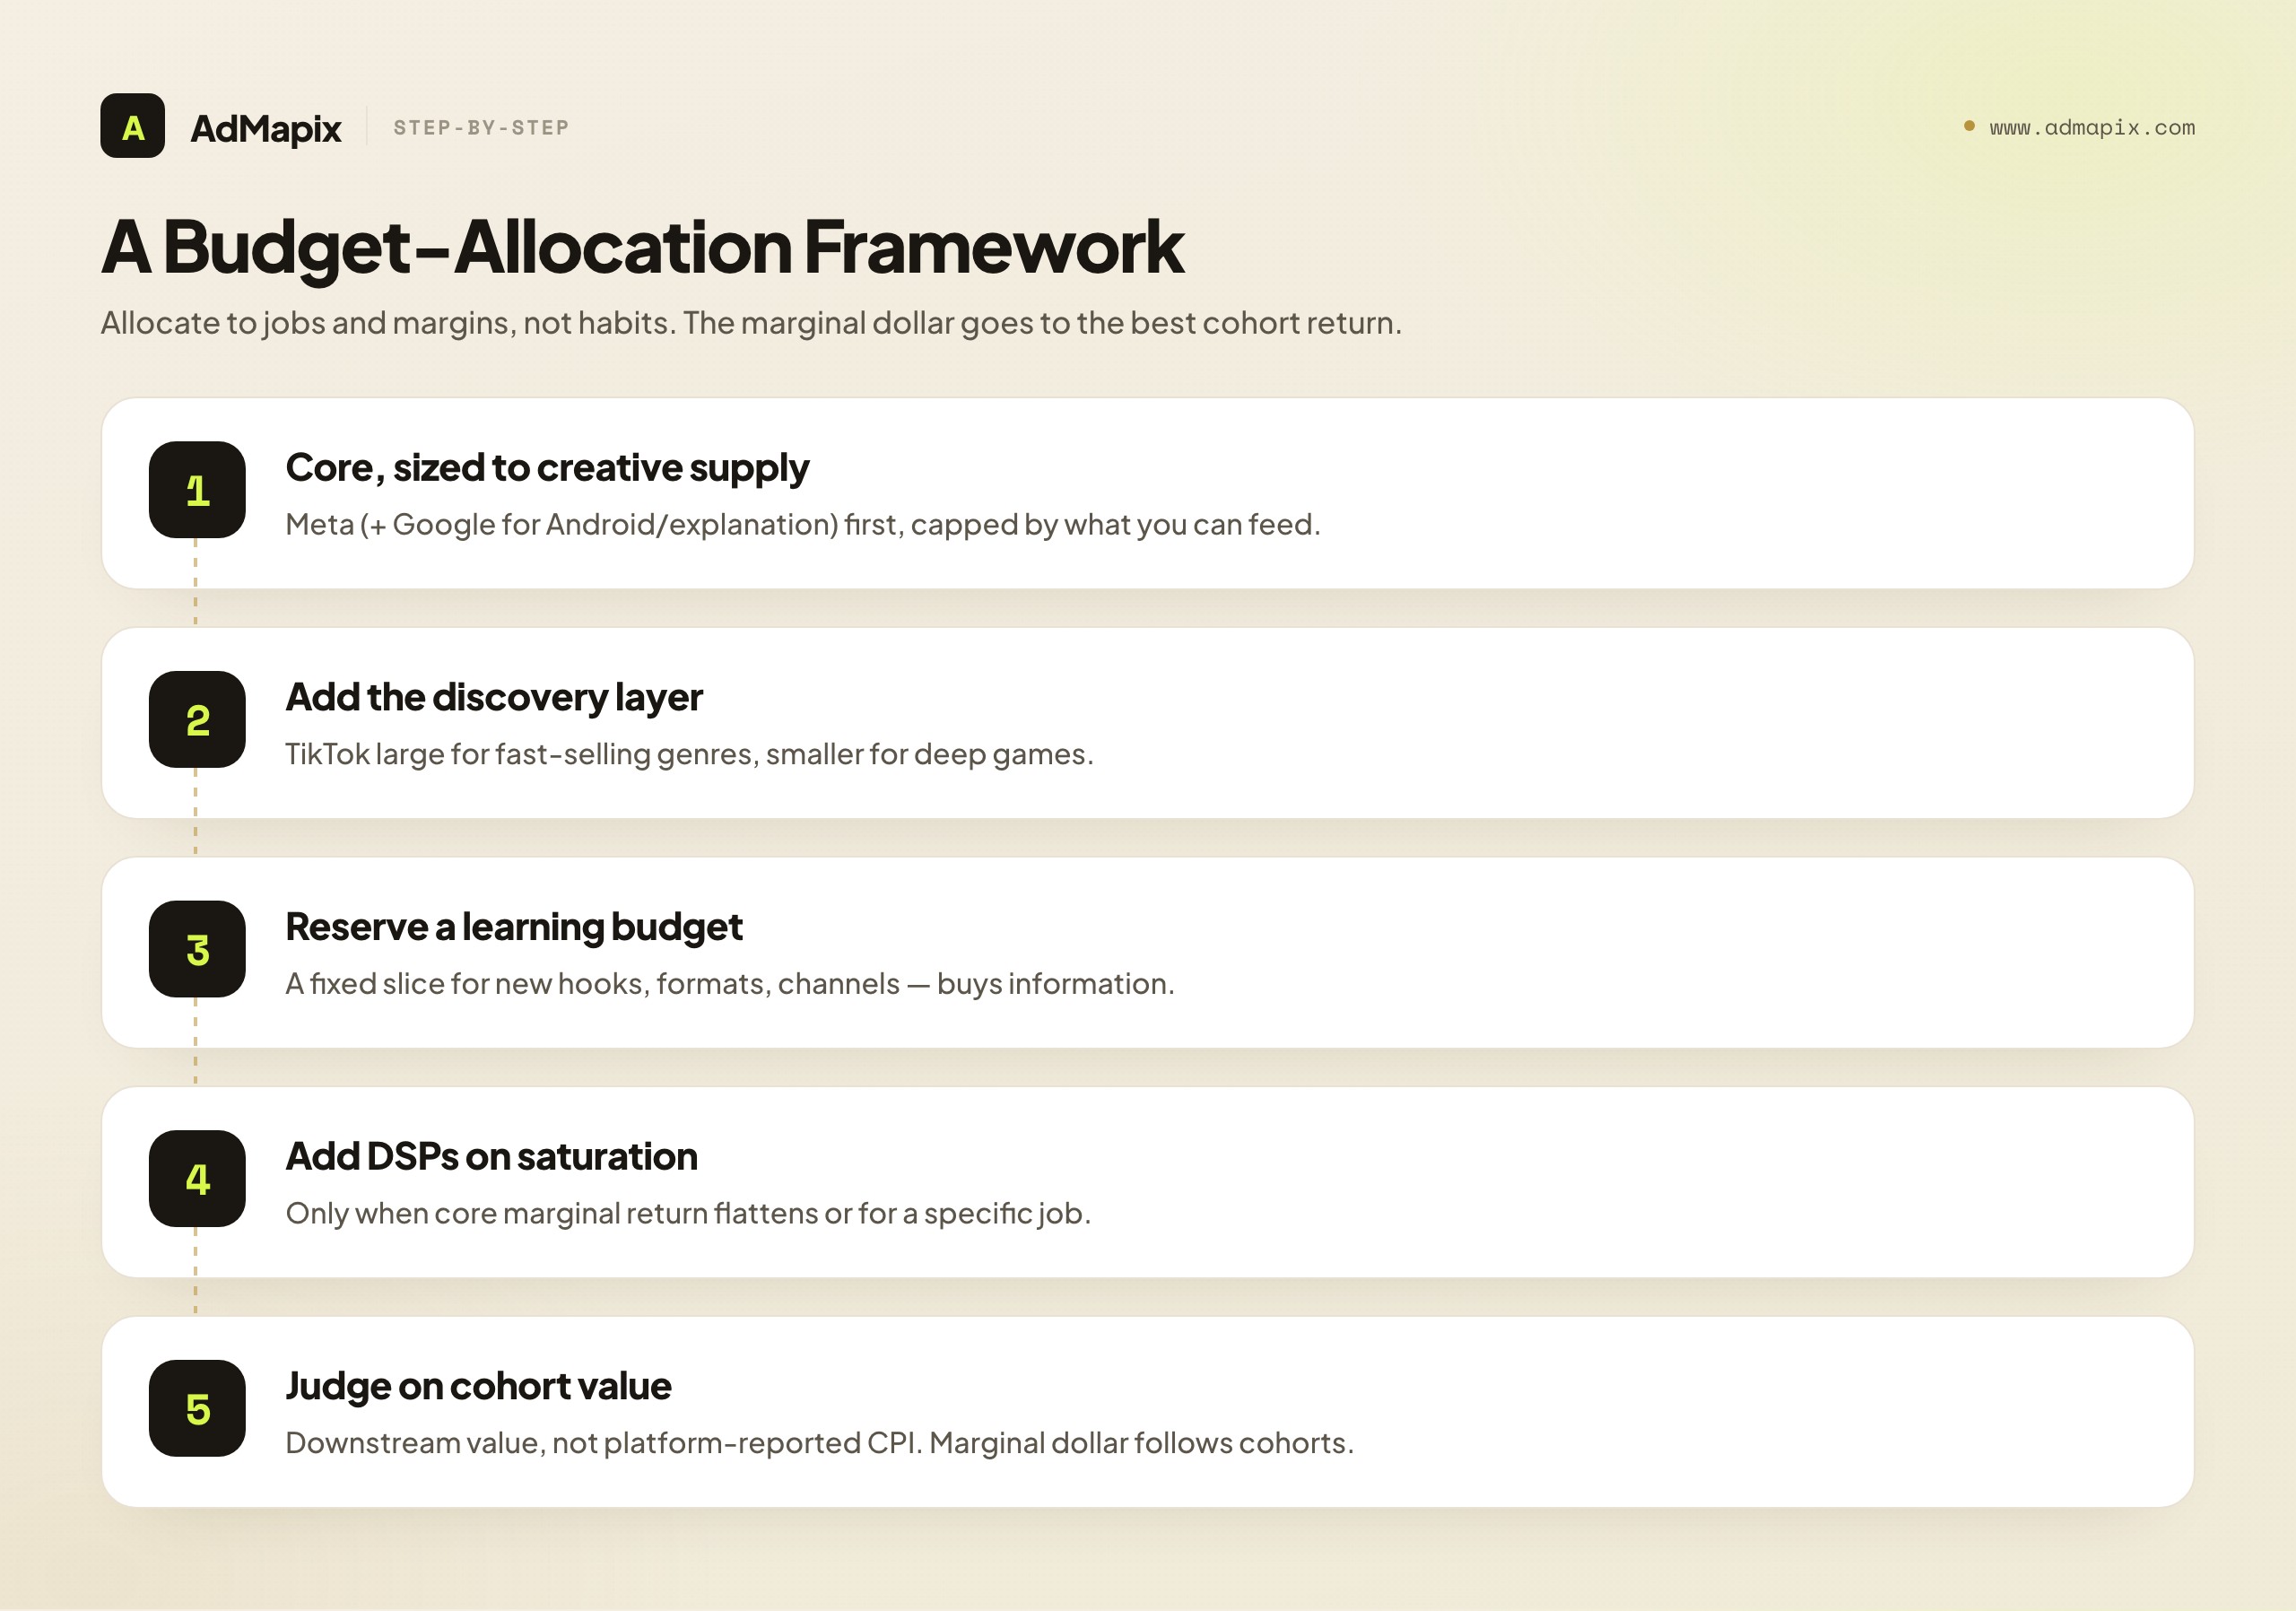
With the mechanisms mapped, here is how to actually build the split. The framework allocates to jobs and margins, not to habits.
Step 1 — Start with the core, sized to creative supply. Meta (and Google for Android-heavy or explanation-dependent titles) takes the first tranche, sized to how much fresh creative you can supply. Do not budget Meta beyond what your pipeline can feed; an unfed core channel fatigues and wastes the marginal dollar.
Step 2 — Add the discovery layer for your genre. If your genre sells fast (casual, hybrid-casual, character-led), TikTok takes a meaningful growth-and-discovery slice. If your genre is deep (mid-core, RPG, live-service), TikTok is a smaller discovery slice and Google's explanatory value gets more weight.
Step 3 — Reserve a learning budget. Carve out a fixed slice for testing new hooks, formats, and channels regardless of current efficiency. This is the budget that keeps you from drifting into the convenient channel; it buys information, not immediate return.
Step 4 — Add DSPs only on saturation or a specific job. When the core channels' marginal return flattens, or you have an incremental job (re-engagement, a specialized geo), introduce a DSP layer sized to a level you can evaluate.
Step 5 — Judge every layer on cohort value. Compare channels on downstream value — retention, payer milestones, LTV — not on platform-reported cost per install, which post-ATT can mislead. The marginal dollar goes to the layer with the best cohort return, not the best reported one.
A practical note on how this framework produces an actual number rather than a philosophy: start from the constraint, not the budget. Your creative supply sets how much the creative-hungry core can absorb; your measurement confidence (Android vs iOS) sets how aggressively you trust each channel's signals; your stage (discovery, scaling, mature) sets the tilt toward learning, volume, or diversification; and your live margins set where the marginal dollar moves week to week. The split that falls out of those four inputs is your split — defensible, specific, and different from any template you could borrow. When someone asks "what percentage should go to Meta?", the honest answer is "as much as your creative pipeline can feed while the marginal dollar there still beats the alternatives," which is a process, not a number. The framework's job is to make that process repeatable.
A Quarterly Reallocation Cadence
Allocation is not a one-time spreadsheet; it is a standing discipline, because saturation, fatigue, and seasonality keep moving the marginal return. A simple cadence keeps budget flowing to the most profitable mechanism rather than the most convenient one.
Weekly — read the margin. Check whether each channel's marginal dollar is still returning, not just its blended average. Flag any channel where incremental returns are flattening — that is an early fatigue or saturation signal.
Monthly — rebalance on cohort value. Pull cohort retention and monetization for each channel, not just install costs. Shift budget from layers whose cohort value is decaying toward those still returning. This is where the iOS measurement caveat bites — trust your cohorts over platform-reported efficiency.
Quarterly — revisit the structural split. Re-examine the core/discovery/DSP mix against genre and stage. Has a new genre meta emerged? Has a core channel structurally saturated? Has your creative supply grown enough to feed a bigger core? Reset the structural allocation deliberately, then let the weekly and monthly loops fine-tune within it.
Always — protect the learning budget. The fixed learning slice survives every rebalance. The fastest way to stop growing is to cut all testing in a tight month and end up with no validated next channel when the current one saturates.
The discipline is unglamorous but decisive: read margins weekly, rebalance on cohorts monthly, reset structure quarterly, and never raid the learning budget. Teams that follow it scale on the mechanism that is actually returning; teams that do not drift into whatever is easiest to spend.
Scaling and Seasonality: When the Right Split Changes
The platform split is not static even within a quarter, because two forces — your own scaling stage and the calendar — keep moving the marginal return. A budget guide that ignores them gives you a snapshot when you need a moving picture.
Scaling stage. A game in its first weeks of UA is in a discovery posture: the priority is information, so the mix tilts toward cheap learning (discovery-led TikTok, broad Meta testing, a reserved learning budget) and away from expensive qualification. A game in a scaling posture, with validated hooks and proven cohorts, tilts toward the channels and formats that absorb volume profitably — a larger Meta and Google core, playables and qualification formats built around winners. A mature title fighting saturation tilts toward diversification — DSPs, re-engagement, new geos — because the core channels' marginal return has flattened. The same game wants a different split at each stage, and budgeting on last stage's mix is a quiet drag on growth.
Seasonality. Auction dynamics shift with the calendar. Competition for inventory rises in high-demand periods (major shopping seasons, holidays), pushing up costs and compressing the marginal return on the channels everyone crowds into; quieter periods can offer cheaper, more efficient acquisition. The budgeting response is not to spend blindly more in peak season because "everyone does," but to read the marginal return through the seasonal cost change — sometimes the right move in a crowded, expensive auction is to lean into a less contested channel or geo where your marginal dollar still earns. Seasonality also interacts with genre: a title whose audience over-indexes on a particular season should weight its discovery and scaling around that calendar rather than a generic one.
The synthesis is that the "right" platform split is a function of stage, season, creative supply, and live margins all at once — which is exactly why the reallocation cadence above is continuous rather than a one-time plan. You are not setting a split; you are steering one.
What Competitor Spend Data Can and Cannot Tell You
This is the honesty section, and it matters most in a spend-focused article, because "competitor spend" is the most over-claimed number in the entire category. Be precise.
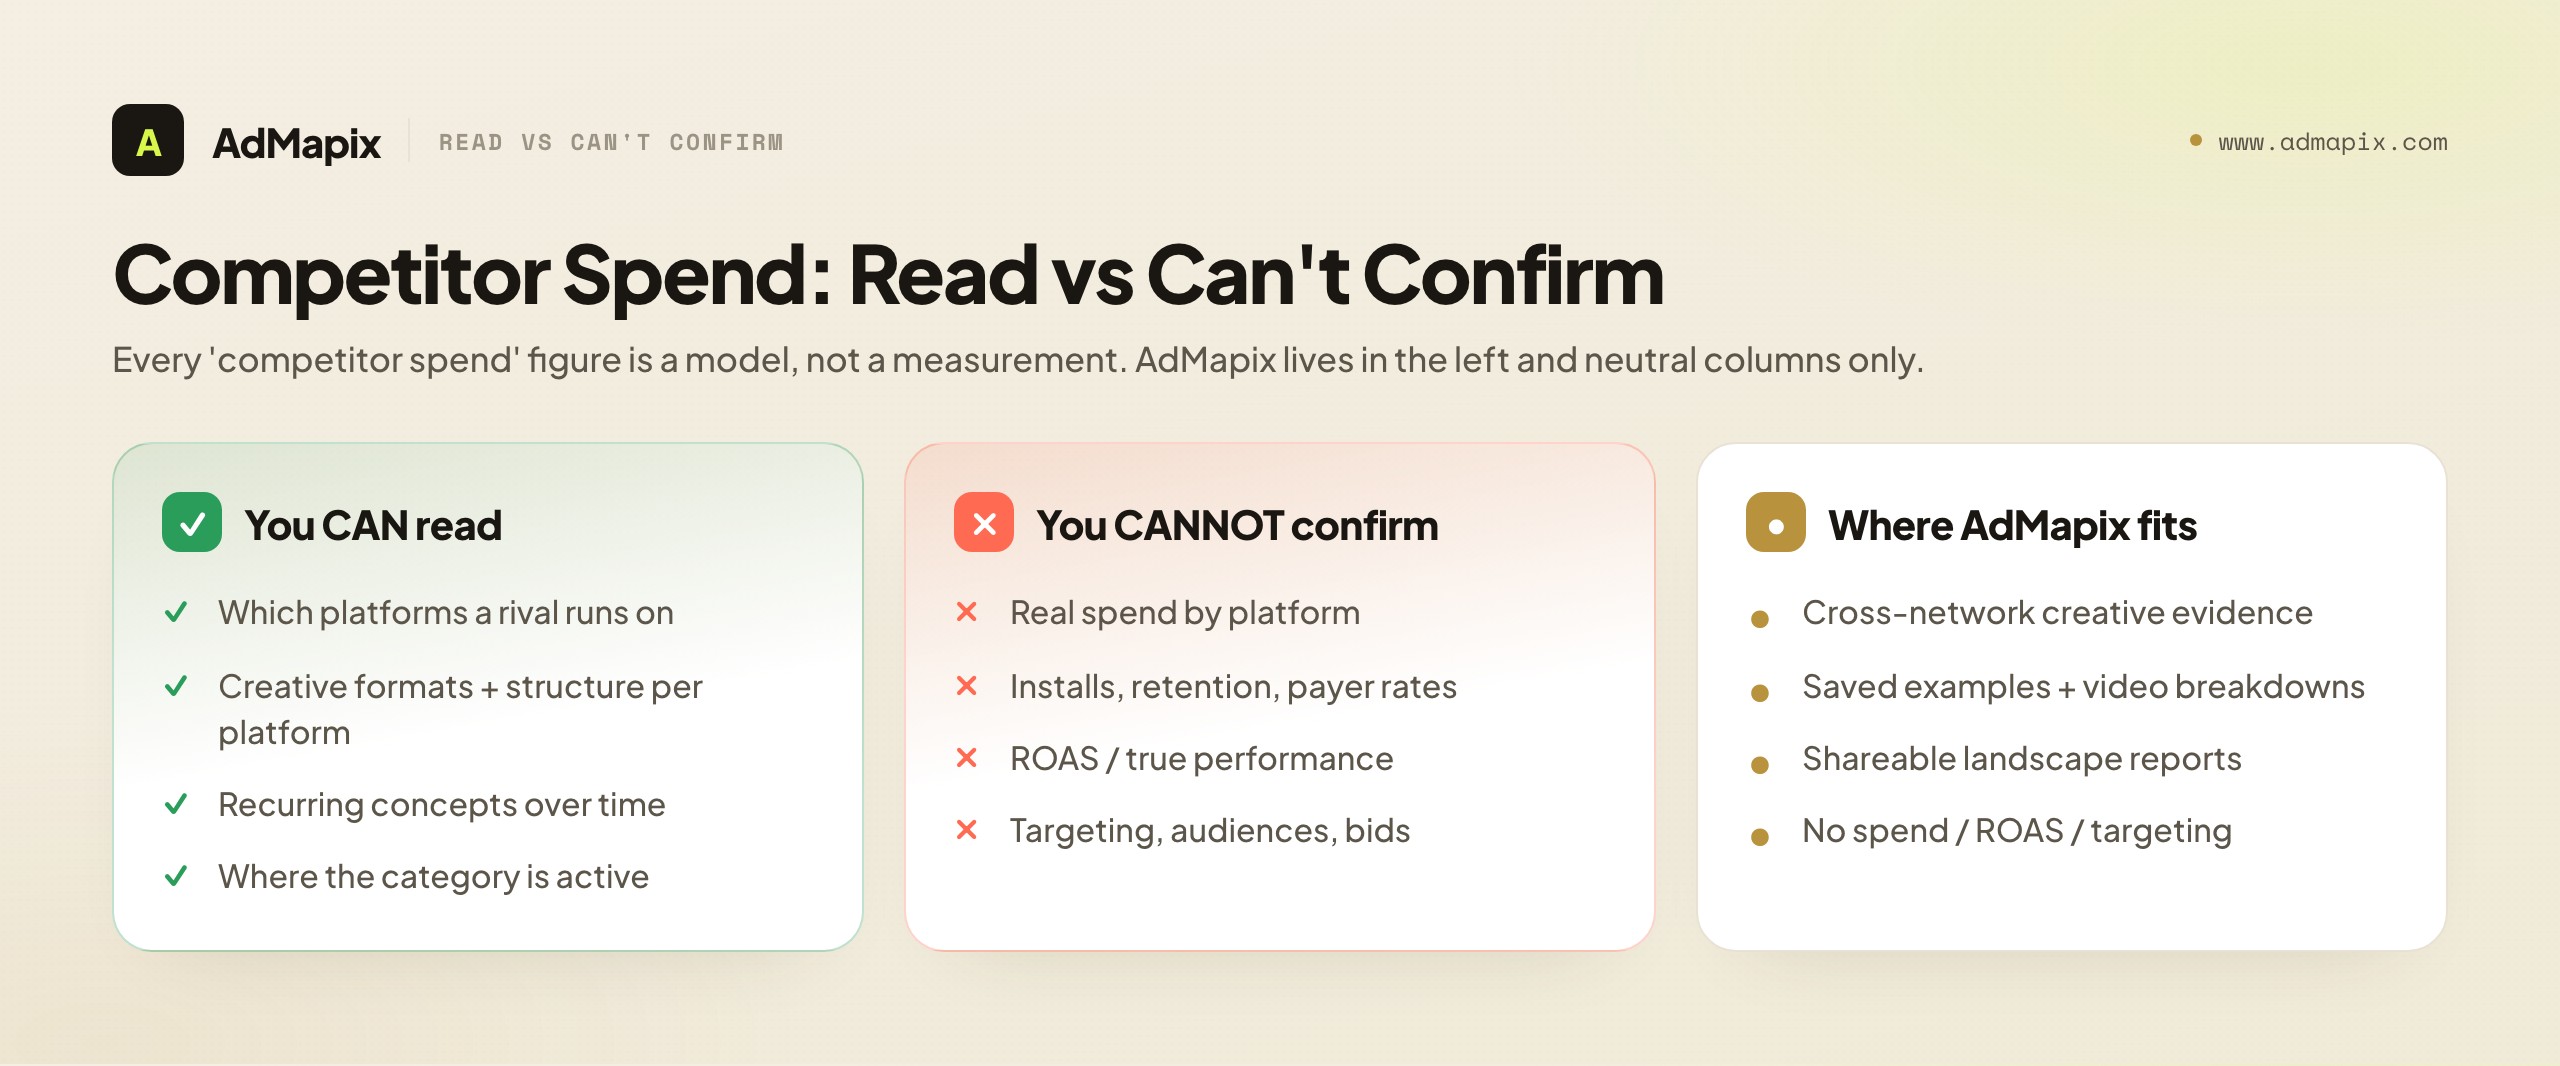
What you genuinely cannot see: any competitor's real ad spend by platform. It is not public. No external tool measures it. Every "competitor spend" figure you have ever seen — by platform, by campaign, by month — is a model, an estimate built from observed signals and assumptions, not a measurement of dollars spent. Models can be directionally useful, but treating a modeled spend number as fact is how teams build budgets on fiction. The same applies to a rival's install volume, retention, payer rates, and ROAS: none of it is public, and none of it can be confirmed from outside.
What you genuinely can read: which platforms a competitor is running creatives on, the kinds of creatives and formats they use per platform, how their creatives are structured, and — observed over time — which formats and concepts recur and persist. That is real, public creative evidence, and it is genuinely useful: it tells you where rivals are active and what they believe works, which shapes your hypotheses about where the category's attention and budget are flowing. But it tells you about presence and structure, not dollars.
The distinction matters because the two are routinely conflated. A vendor that shows you a rival's creatives and also prints a "spend per platform" figure has not measured that spend — it has modeled it, then placed it next to the real creative evidence so the whole thing inherits the creatives' credibility. Keep the two firmly apart in your own head: the creatives are evidence, the spend numbers are estimates, and a budget built on the latter is a budget built on a guess wearing a suit. This is exactly where a creative-evidence layer like AdMapix fits, described honestly. AdMapix is searchable, cross-network ad-creative evidence — saved examples, video breakdowns, and recurring reports — so you can see which platforms and formats advertisers are active on without opening multiple ad libraries by hand. It is fast for discovery and for packaging examples into a shareable report. It cannot show competitor spend, install volume, retention, ROAS, or targeting, because that data is not public — and any tool that claims a precise competitor-spend figure is selling a model dressed as a fact. Use the creative evidence to read where rivals are active; use your own cohort and LTV data to decide where your budget goes. For the broader toolkit and where each tool's data ends, see the advertising intelligence guide, competitor ad spend, and the ad creative database.
Common Budgeting Mistakes
A handful of budgeting errors recur across UA teams, almost all rooted in judging the wrong number or asking a channel to do the wrong job.
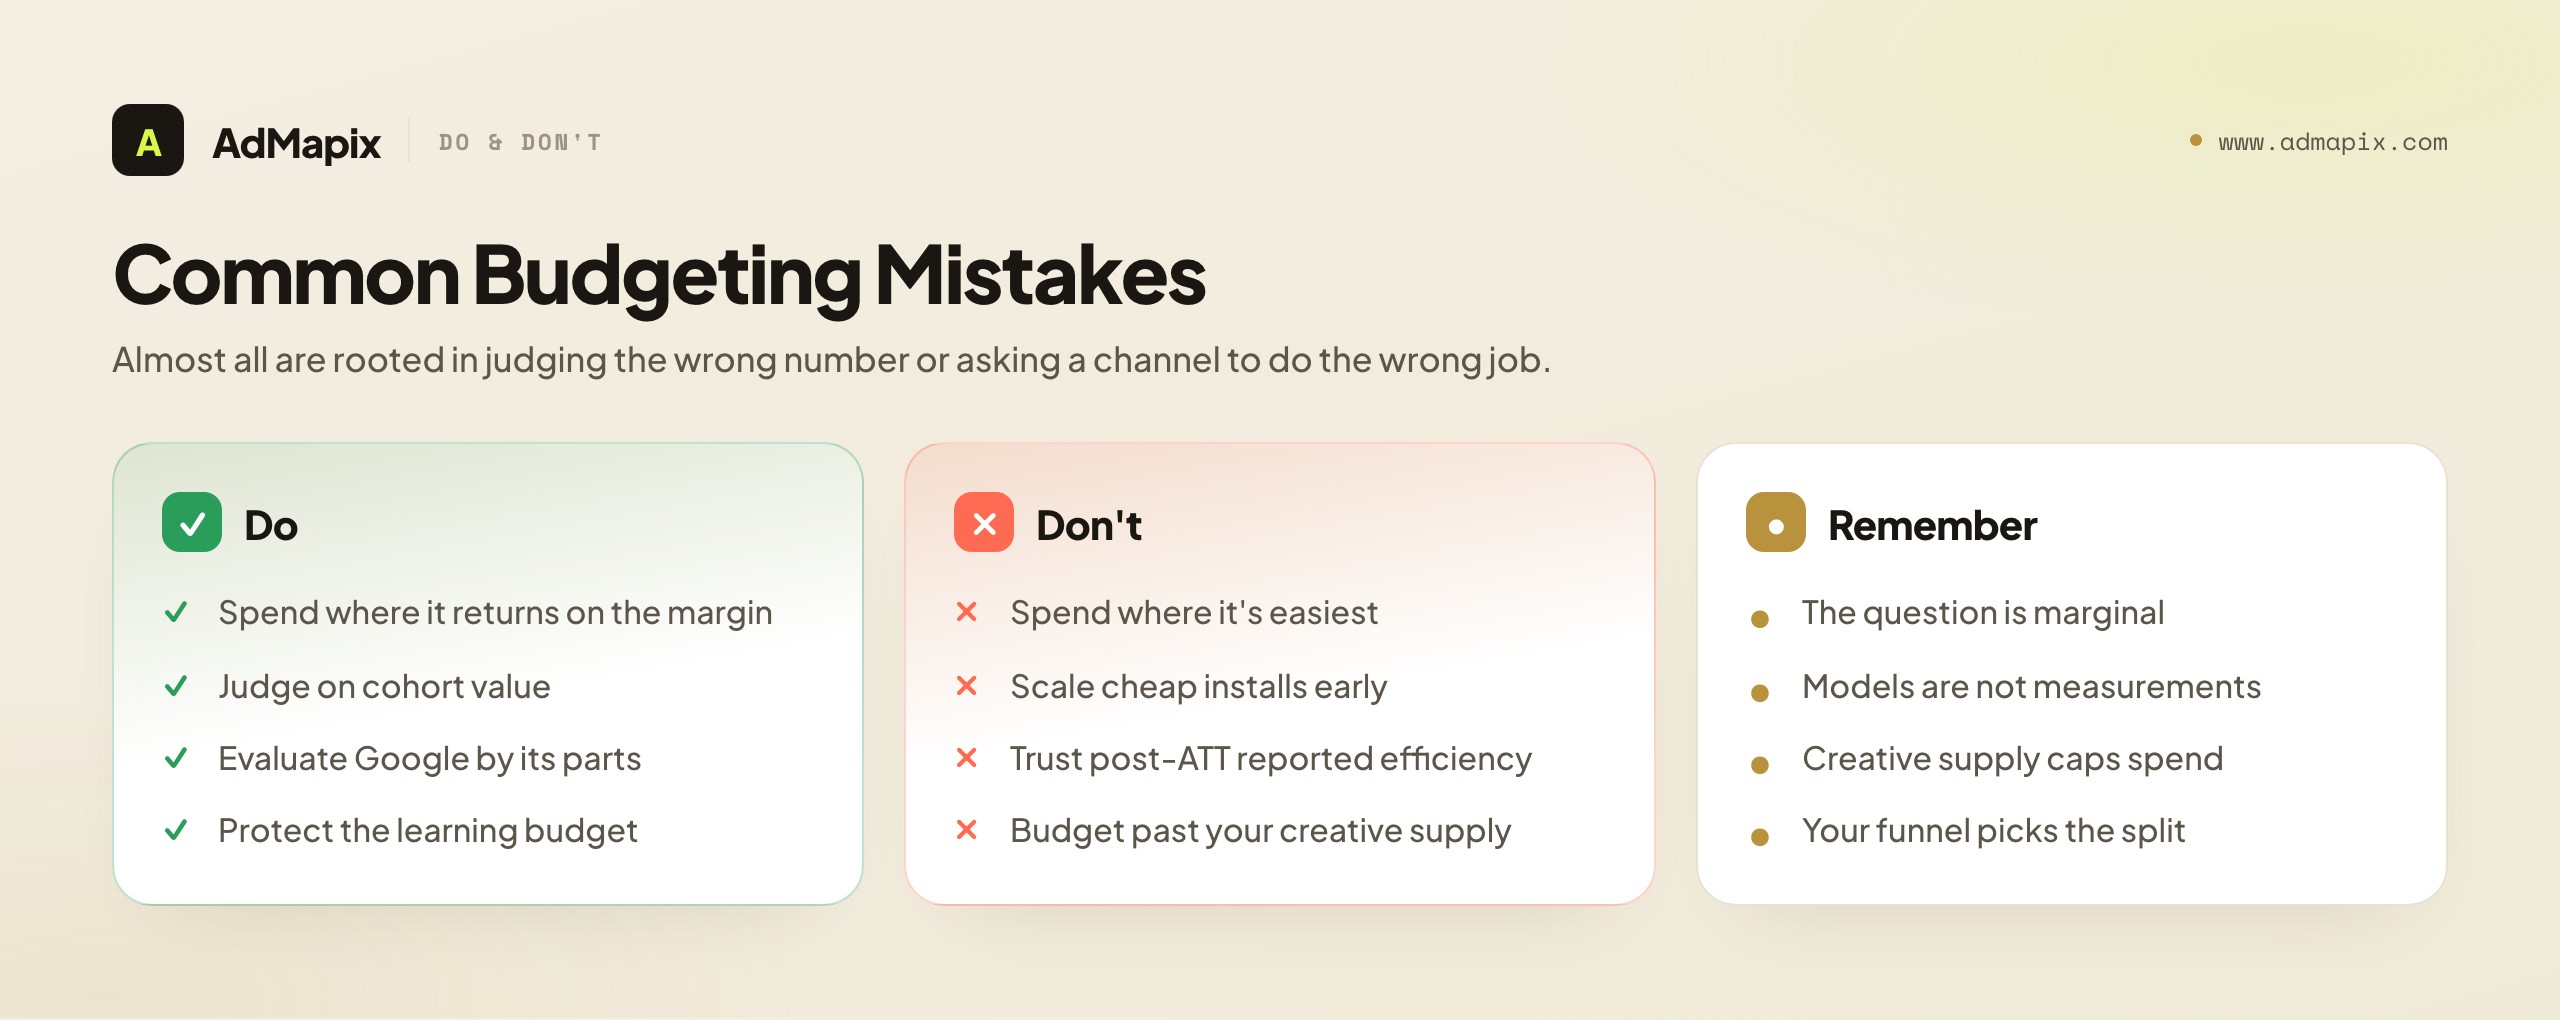
Spending where it is easiest, not where it returns. Budget drifts to the most convenient channel — usually Meta — even past visible fatigue. Read the margin, not the convenience.
Scaling cheap installs before the cohort proves out. Cheap TikTok or DSP installs that look great up top can disappoint downstream. Judge on cohort value before scaling.
Treating Google as one black box. Bundling Android strength, YouTube explanation, and noisy iOS into one number hides which part is working. Evaluate Google by its parts.
Trusting platform-reported efficiency post-ATT. Self-reported cost per install can diverge from real value, especially on iOS. Triangulate with your own cohorts.
Budgeting a channel beyond its creative supply. A core channel you cannot feed with fresh creative fatigues and caps. Size spend to your pipeline.
Cutting the learning budget in a tight month. Killing all testing leaves you with no validated next channel when the current one saturates. Protect the learning slice.
Treating a modeled competitor-spend number as fact. Competitor spend is never measured, only estimated. Never build a budget on a rival's modeled spend; build it on your own data.
How AdMapix Fits a Spend Decision
To be exact about the role of a creative-evidence layer in budgeting: AdMapix helps you read where competitors are active and what they are running, which informs your hypotheses about where the category's budget and attention are flowing — but it does not, and cannot, hand you a competitor's spend or pick your split for you. You can search cross-network to see which platforms and formats rivals are active on, study saved examples and video breakdowns without juggling separate ad libraries, and package the landscape into a shareable report that helps justify a budget conversation. That is the discovery-and-evidence half of the job.
The decision half — how much of your budget goes to Meta, Google, TikTok, and DSPs — depends entirely on your own cohort value, creative supply, genre, and saturation signals, none of which any external tool can see. The honest mental model is: creative evidence tells you where rivals are playing; your funnel tells you where your dollar earns. Keep those separate and you get useful market context without the trap of building a budget on a modeled spend number. The natural next reads are the mobile game marketing strategy guide and the mobile game monetization overview.
Concretely, the place creative evidence earns its keep in a budget conversation is at the hypothesis and communication stages. When you are deciding whether to open a new channel or genre, seeing which platforms competitors are active on — and whether the category is converging on a particular format or concept — gives you a defensible prior for where to run a test. And when you have to justify a proposed split to a studio lead or board, a tagged, packaged view of the competitive creative landscape makes a far stronger case than assertion. What it never does is substitute for your own numbers in the final allocation. The budget is yours to set from your data; the evidence simply helps you decide what to test and explain why. That clean line — public evidence for direction, private analytics for the decision — is what keeps a spend strategy both informed and honest, and it is the same discipline that runs through every section of this guide.
FAQ
How is mobile game ad spend actually split across platforms?
There is no single true split — it depends on your genre, geos, creative supply, and stage. As a structural map: Meta and Google are the core scale layer for most teams, TikTok is the creative-led growth and discovery layer (and the biggest recent share gainer), and DSPs are a selective diversification layer added once the core channels saturate. Treat published market-wide percentages with caution; the only split that matters is the one your own cohort data justifies.
Can I find out how much a competitor spends per platform?
No. Competitor ad spend by platform is not public and cannot be measured from outside — every figure you have seen is a model, an estimate with assumptions, not a record of dollars spent. The same is true of a rival's installs, retention, payer rates, and ROAS. What you can see is which platforms a competitor runs creatives on and what those creatives look like. Use that to read where they are active; never treat a modeled spend number as fact.
Why shouldn't I just put most of my budget into Meta?
Because the question is marginal, not absolute. Meta is the easiest place to spend, so budget drifts there — but once creative fatigue appears, the marginal dollar stops returning even while the blended average still looks fine. Reading the margin, and gating Meta spend on your creative refresh rate, prevents the most common UA mistake: over-feeding a fatiguing core channel because it is convenient.
How did ATT change platform budgeting?
Post-ATT, platform-reported efficiency and real downstream value can diverge, especially on iOS, and attribution is noisier, so the gap is harder to see. The budgeting consequence is that you cannot trust a single platform's self-reported cost per install to compare channels — you have to triangulate with your own cohort and lifetime-value data. Judge channels on cohort value, not reported efficiency.
When should I add DSPs to my mix?
When the core channels (Meta, Google, TikTok) begin to saturate and the marginal dollar there stops returning, or when you have a specific incremental job — re-engaging lapsed players, reaching a geo the core channels under-serve, or buying in-app inventory. DSPs are a diversification layer, not a default; they need enough scale to evaluate and are more opaque, so add them deliberately and judge them on the same cohort-value standard.
Does genre change how I should split budget?
Yes, significantly. Casual and hybrid-casual titles that sell in seconds thrive on discovery-led channels like TikTok and scale well on Meta. Mid-core, strategy, and RPG titles need explanation, so Google's YouTube value and longer formats carry more weight, and live-service titles lean more on re-engagement and DSP layers. A split copied from a different genre will misallocate; map the split to your game's discovery mechanism.
What metric should I use to compare channels?
Cohort value, not cost per install. Cost per install and click-through rate favor cheap-attention channels and hide downstream quality. Compare channels on the value of the cohorts they acquire — retention, payer milestones, and lifetime value — over a consistent window. The marginal dollar should flow to the channel with the best cohort return, which is frequently not the one with the lowest reported install cost.
Why does creative supply limit how much I can spend?
Because modern delivery systems lean on creative to do the targeting work, a channel you cannot feed with fresh creative fatigues and caps — the inventory exists, but stale creative stops converting. So your creative pipeline, not the channel's reach, is often the real ceiling on profitable spend. Size each core channel to the creative you can actually supply, and treat refresh capacity as a budgeting input, not an afterthought.
How often should I reallocate budget?
Read the margin weekly (is each channel's next dollar still returning?), rebalance on cohort value monthly (shift away from layers whose cohort value is decaying), and reset the structural core/discovery/DSP split quarterly against genre and saturation. Throughout, protect a fixed learning budget so a tight month does not leave you with no validated next channel when the current one saturates.
Where does AdMapix fit in a budget decision?
AdMapix is a cross-network creative-evidence layer: it makes it fast to see which platforms and formats competitors are active on and to package that landscape into a shareable report, without opening multiple ad libraries by hand. It informs your hypotheses about where the category's attention is flowing. It does not — and cannot — show competitor spend, installs, retention, or ROAS, and it does not pick your split. Use it for market context; use your own cohort data to decide where your budget goes. See competitor ad spend for more on the limits of spend estimation.
Related reading: Pair this with the mobile game marketing strategy guide, the best mobile game ad formats playbook, ad spend tracking and competitor ad spend, the ad creative fatigue analysis, and the broader advertising intelligence guide, in-game advertising, and mobile game monetization overviews.
See what competitors are really running
Search 6M+ ad creatives, landing pages, and weekly spend across 200+ countries. No credit card, no commitment.
Related Articles

2026 H2 Ad Market Outlook: Platform Shifts, AI Buying, and Budget Strategy
A compressed, decision-ready H2 2026 advertising outlook: platform share shifts, AI buying defaults, privacy pressure, format economics, regional budget moves, and a Q4 operating plan.
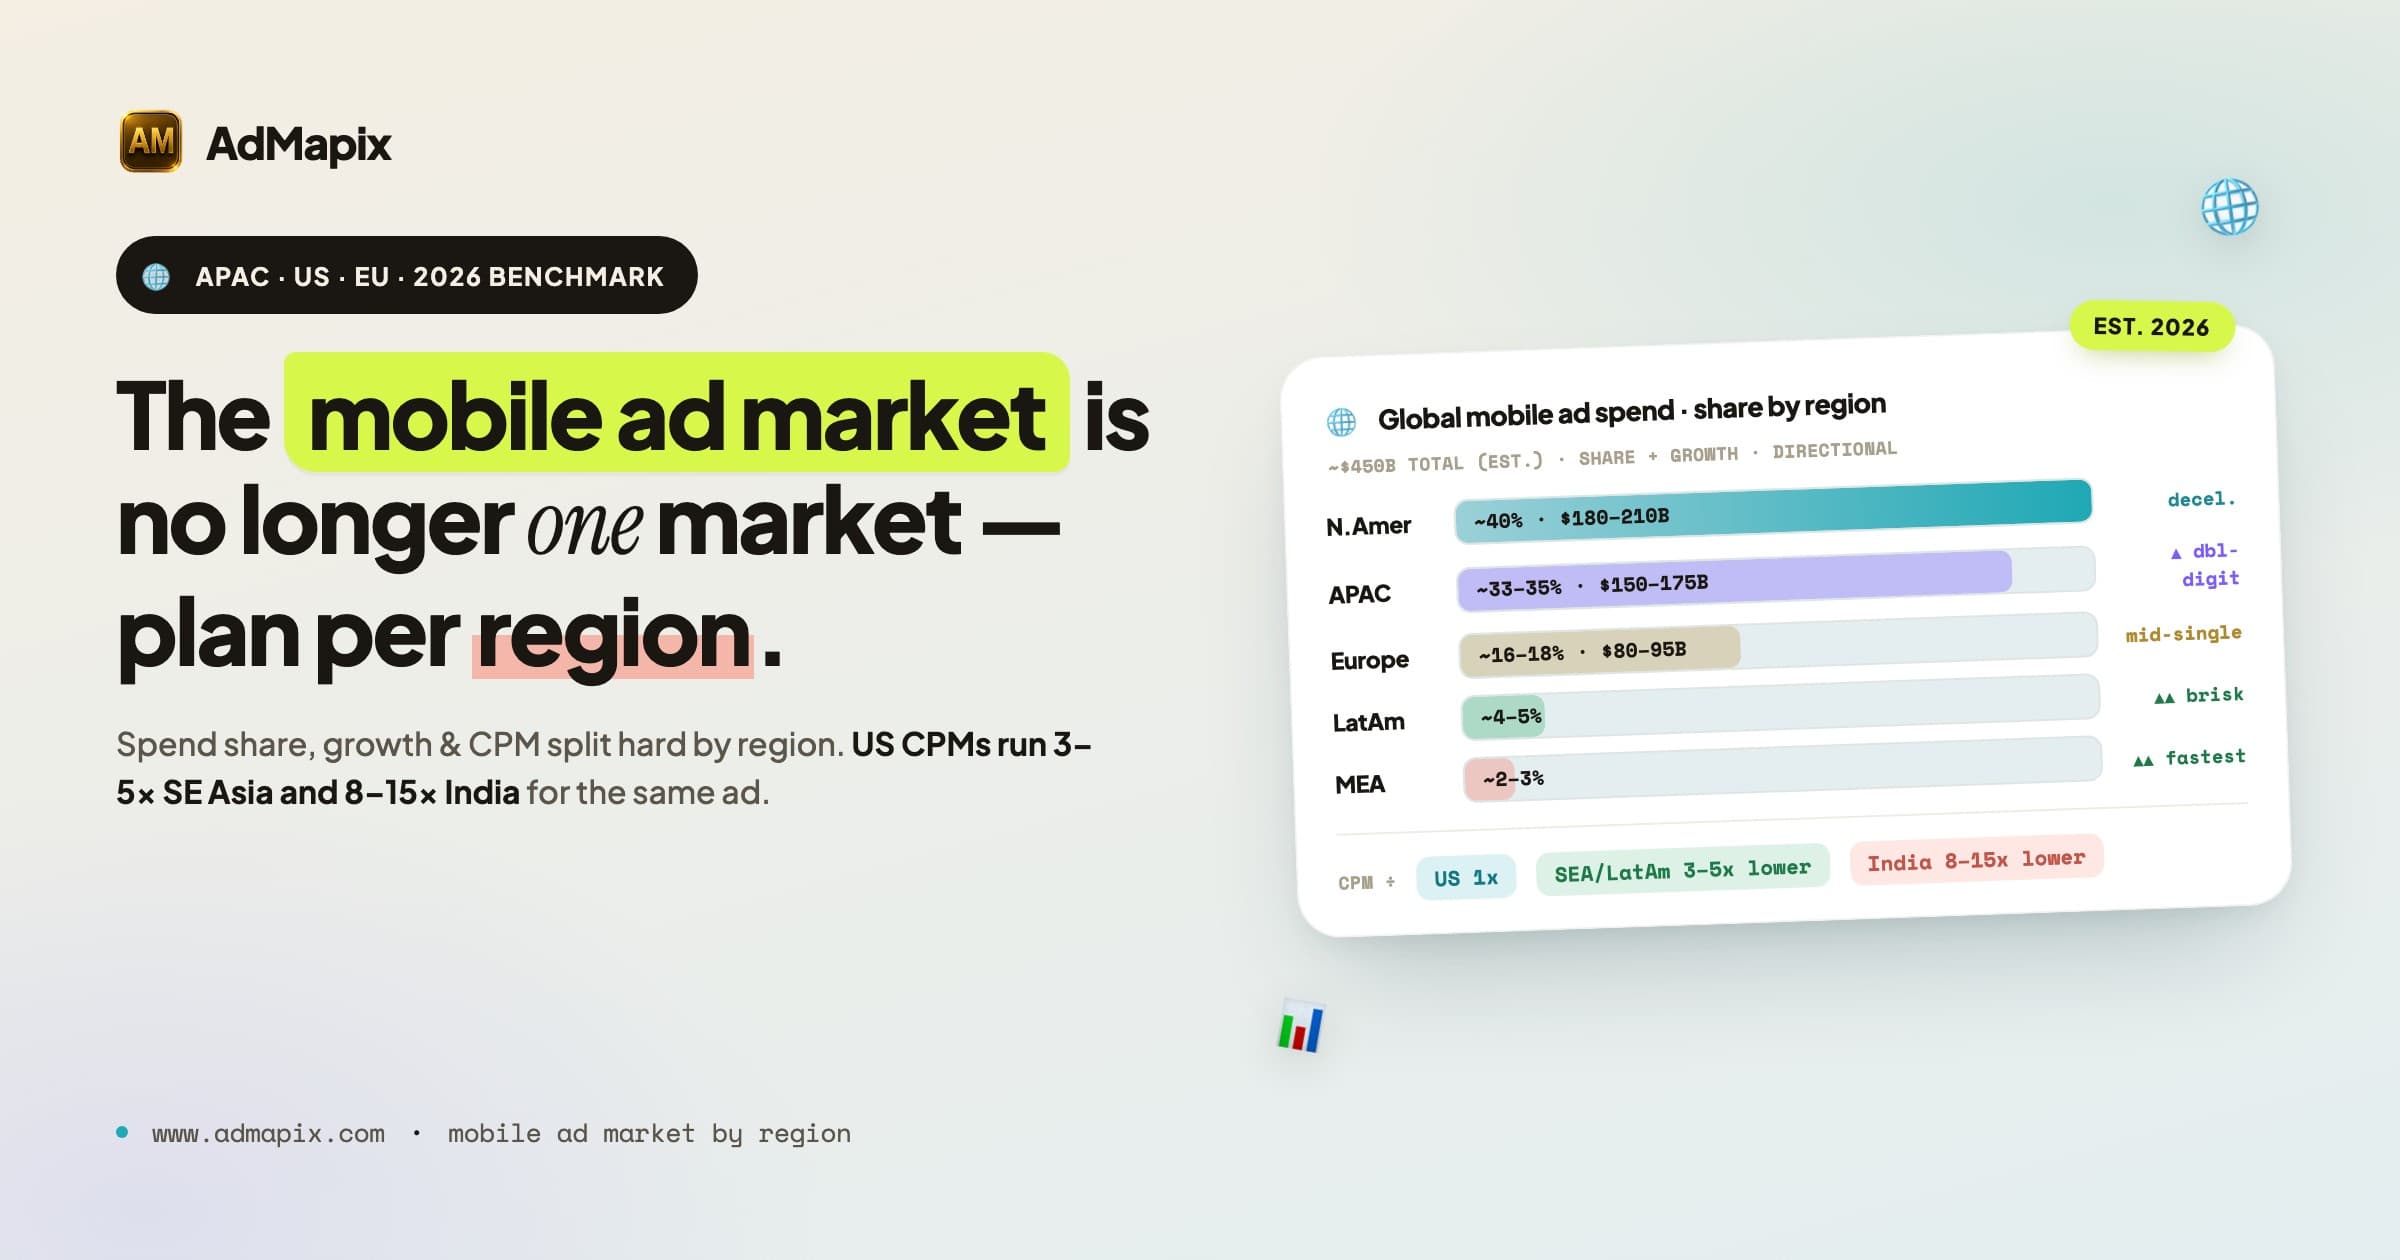
Mobile Ad Market by Region 2026: APAC vs US vs EU Spending, Formats, and Trends
A data-driven breakdown of the 2026 mobile ad market across North America, Europe, APAC, Latin America, and the Middle East & Africa — covering regional ad spend, format dominance, CPM economics, platform mix, and the regulatory shifts that now force separate media plans per region instead of one global strategy.

2026 Mobile Advertising Market Trends: Formats, Policies, Spend
A 2026-ready guide to mobile ad shifts: new formats, platform policies, spend trends, and emerging markets with actionable playbooks.