US Streaming & Entertainment App Advertising Report (Mid-2026): How FAST, Short-Drama, and Live Apps Buy Installs
A data-driven mid-2026 teardown of how US streaming and entertainment apps acquire users: the download-chart surge (Peacock, FOX One, Tubi, Love Island), the three UA engines — free ad-supported streaming, short-drama, and live social — and the real creatives, formats, run-lengths, and hooks winning attention, based on AdMapix tracking data as of June 29, 2026.
US Streaming & Entertainment App Advertising Report (Mid-2026): How FAST, Short-Drama, and Live Apps Buy Installs
As of June 29, 2026, the fastest-growing apps on the US download chart are not games or AI assistants — they are streaming and entertainment apps, and they are growing by buying attention at industrial scale. On the day we pulled this data, free ad-supported streaming services and reality-TV companion apps posted some of the steepest download jumps on the entire board: FOX One up 1,422%, Love Island USA up 9,570%, Peacock up 155%, and Tubi up 24% — while the AI apps that dominated headlines a year ago (ChatGPT, Claude, Gemini) all fell roughly 49–52% day over day. The single highest-impression entertainment creative we track in the US has been served an estimated 152 million times and has been running continuously for nearly eleven months.
This report maps how US entertainment apps actually grow in 2026 — not through organic discovery, but through paid user acquisition. We break the market into the three UA engines that define it today: free ad-supported streaming (FAST), short-drama, and live social streaming. For each, we show the real creatives, the formats, the run-lengths, and the hooks, using AdMapix tracking data current as of late June 2026. Every number below is real. Treat the estimates as directional market signal, not audited financials. The full, daily-updated data behind every chart — the actual video creatives, country splits, and named competitors — is available to AdMapix users; log in or create a free account to pull these leaderboards for your own category and markets.
What's inside:
- The mid-2026 US download chart, and why entertainment apps own the top of it
- Why streaming barely shows up on the IAP revenue chart (and what that means)
- The three UA engines: FAST, short-drama, and live social
- Creative teardowns with real impression counts and run-lengths
- The format split: 15-second title spots vs. 60-second melodrama
- Hook teardown: IP-led, cliffhanger-led, and "free forever" framing
- What FAST, short-drama, and live UA teams should each do next
1. Executive summary (TL;DR)
The headline: in mid-2026, US entertainment-app growth is a paid-acquisition story, and it splits cleanly into three engines that buy installs in completely different ways.
- Entertainment apps dominate the US download surge. On our June 29 snapshot, Peacock (+155%), FOX One (+1,422%), Tubi (+24%), Love Island USA (+9,570%), and Paramount+ all rank inside the US top 20 by daily downloads. AI assistants, by contrast, are cooling: ChatGPT −49%, Claude −52%, Gemini −51% day over day.
- Free ad-supported streaming (FAST) is the install-volume leader. Pluto TV and Tubi run short, IP-led video spots at massive scale — Pluto's top creative alone is at an estimated 21.3 million impressions, Tubi's at 7.95 million, each in a 15-second format built around a recognizable title.
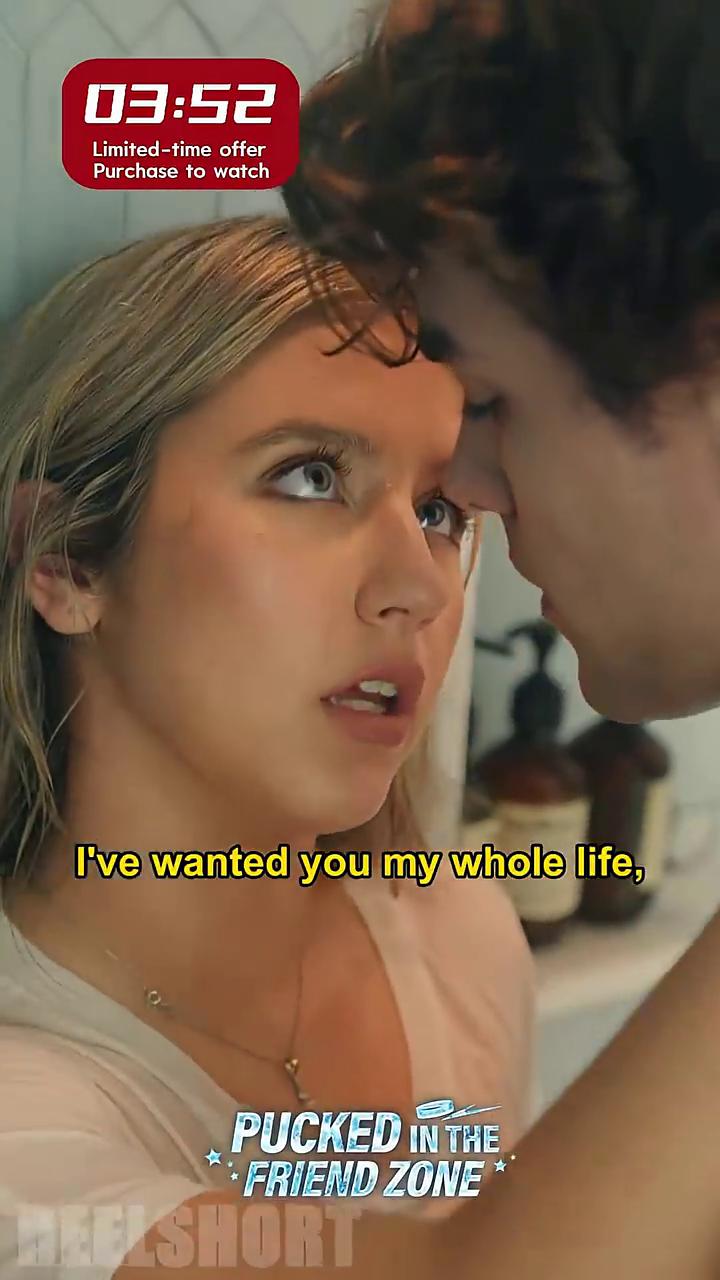
- Short-drama is the most aggressive creative buyer. Apps like ReelShort, DramaNova, DramaVibe, and Moj run long-form melodrama clips (40–115 seconds) plus playables, leaning on cliffhanger hooks. ReelShort's top playable has been live for roughly four months straight.
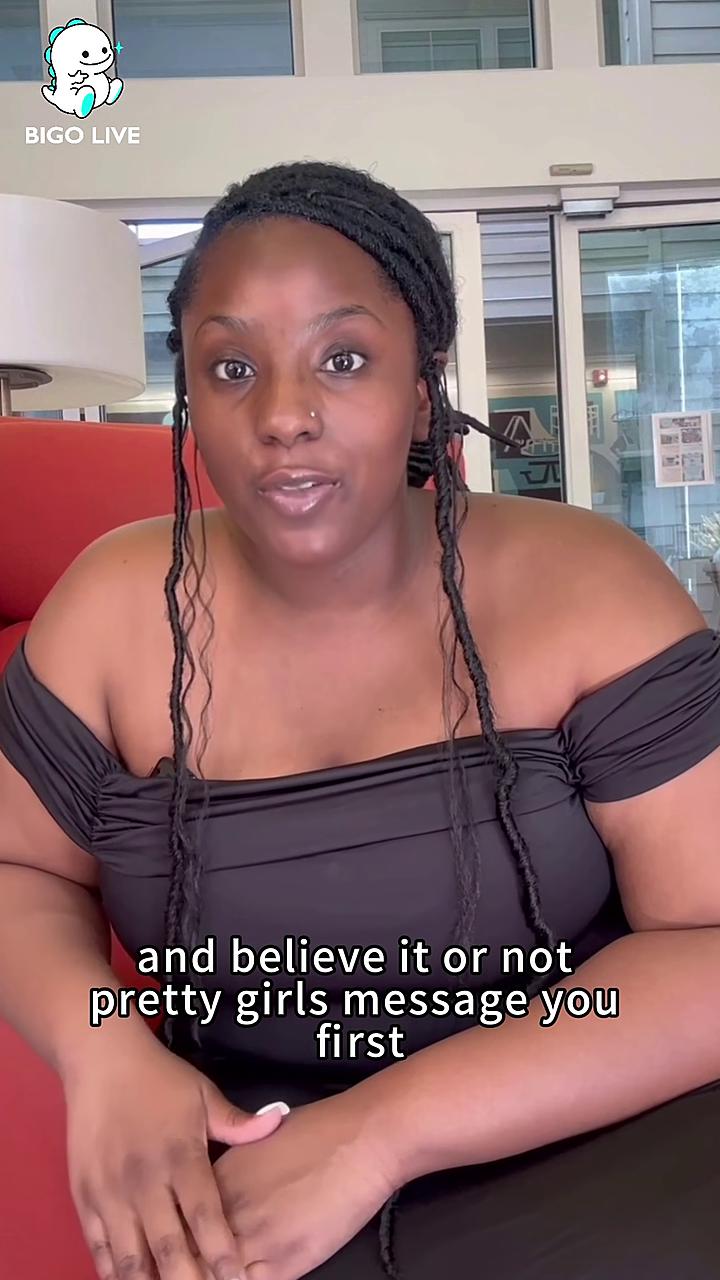
- Live social streaming buys the most raw impressions. Bigo Live's top creative sits at an estimated 152 million impressions and has run for nearly eleven months — the clearest "proven winner" signal on the entertainment board.
- Run-length is the most honest metric. The creatives still serving after 100+ days are the ones that work. We name them throughout.
- Streaming hides on the revenue chart. Because subscriptions increasingly bill outside the app stores, FAST and SVOD apps under-index on store IAP revenue — a structural reason the download chart and the revenue chart tell different stories.
If you run UA for an entertainment app, the rest of this report is a field guide to what your competitors are actually shipping right now.
2. The mid-2026 US download chart: entertainment eats the top
Here is the top of the US download chart from our June 29, 2026 snapshot, filtered to the entertainment and streaming apps and a few notable neighbors. Growth is day-over-day; downloads are AdMapix estimates.
| Rank | App | Developer | Est. daily downloads | Growth |
|---|---|---|---|---|
| 3 | Peacock TV: Stream TV & Movies | Peacock TV LLC | 3,556,672 | +155% |
| 4 | FOX One: Live News, Sports, TV | Fox Digital Services | 2,681,889 | +1,422% |
| 5 | YouTube | 2,449,950 | −5% | |
| 9 | Tubi: Movies & Live TV | Tubi, Inc | 1,901,318 | +24% |
| 11 | Love Island USA | ITV America | 1,873,282 | +9,571% |
| 17 | Paramount+ | CBS Interactive | 1,558,901 | −3% |
For contrast, the apps that fell hardest on the same day were the AI assistants and social utilities: ChatGPT (−49%), Gemini (−51%), Claude (−52%), WhatsApp (−41%), Instagram (−35%). That pattern — entertainment surging while AI cools — is the single clearest signal on the board this week.
Two forces are visible here. The first is event-driven demand: Love Island USA's +9,571% and FOX One's +1,422% are the fingerprints of a live season premiere and a sports/news launch window — the kind of spike that paid UA pours fuel on rather than creates from scratch. The second is structural cord-cutting: Peacock, Tubi, and Paramount+ are not one-week stories; they are the steady beneficiaries of US viewers moving from cable to streaming, a shift Nielsen has tracked for years through its monthly The Gauge measurement of TV viewership share.
The takeaway for marketers: entertainment is where the install volume is in mid-2026, and the apps capturing it are not waiting for organic discovery. They are running paid creatives — the ones we tear down below.
3. The revenue map: why streaming hides
If entertainment apps dominate downloads, you might expect them to dominate revenue too. They don't — at least not on the store IAP revenue chart. Here is the top of the US revenue board from the same snapshot:
| Rank | App | Developer | Est. revenue index | Growth |
|---|---|---|---|---|
| 1 | Google Maps | 2,102,591,892 | +99% | |
| 3 | YouTube | 1,017,398,995 | −41% | |
| 4 | WhatsApp Messenger | WhatsApp Inc. | 577,020,522 | −31% |
| 8 | Discord | Discord, Inc. | 268,203,510 | −3% |
| 14 | Spotify: Music and Podcasts | Spotify | 159,198,000 | +14% |
Revenue values are relative estimates (units undefined); read rank and growth, not absolutes.
Notice what is missing: Peacock, Tubi, Paramount+, and FOX One — the same apps surging on downloads — do not appear in the IAP revenue top 15 at all. The two entertainment names that do show up, YouTube and Spotify, are exactly the ones with large in-app subscription bases.
The reason is structural. Premium streaming services increasingly steer subscribers to web or off-store billing to avoid the 15–30% app-store commission, and FAST apps like Tubi and Pluto TV are monetized primarily through advertising, not in-app purchases — so almost none of their money flows through the store's revenue ledger. The result is a market where the download chart and the revenue chart describe two different realities: streaming wins installs, but its dollars are largely invisible to store-level revenue tracking.
For UA teams, this has a concrete consequence. You cannot benchmark streaming competitors on store revenue. The signal that actually reflects their spending intensity is their creative footprint — how many ads they run, at what scale, for how long. That is the lens for the rest of this report.
4. The three UA engines of US entertainment
Across the entertainment apps we track in the US, paid acquisition organizes into three distinct engines. Each has its own creative format, run-length profile, and hook style.
| Engine | Representative apps | Core format | Typical run-length | Hook style |
|---|---|---|---|---|
| FAST (free ad-supported) | Pluto TV, Tubi, Peacock | 15s title-led video | Short bursts, refreshed often | Recognizable IP / "watch free" |
| Short-drama | ReelShort, DramaNova, DramaVibe, Moj | 40–115s melodrama clip + playable | Long-running winners | Cliffhanger / forbidden romance |
| Live social | Bigo Live | Playable + 13–20s video | Very long-running | Social proof / interaction |
The rest of the report walks each engine in turn, with the real creatives behind it.
5. Engine one — FAST: short, IP-led, high frequency
Free ad-supported streaming (FAST) apps run the most "TV-like" creatives in entertainment UA: short, polished, and built entirely around a recognizable title. The job of a FAST ad is not to explain the app — everyone understands "free movies" — it is to surface a single show you already want to watch.
Pluto TV is the volume leader here. Its top US creative is a 15-second video spot that has accumulated an estimated 21.3 million impressions since first appearing on March 5, 2026 — roughly 116 days in market and still running. Pluto's next three creatives sit at 16.4M, 9.2M, and 8.5M impressions, all in the same tight 15-second format.
 Pluto TV's top US creative — a 15-second spot at an estimated 21.3M impressions, first seen March 5, 2026 and still serving (~116 days).
Tubi runs the same playbook with fresher creatives. Its top four US spots — all 15-second video, all first seen in early June 2026 — sit at an estimated 7.95M, 4.68M, 3.54M, and 2.86M impressions. The short time-in-market (under 30 days) paired with high impression velocity signals an active, well-funded burst rather than a long-tail evergreen.
 Tubi's top US creative — a 15-second free-streaming spot at an estimated 7.95M impressions, first seen June 1, 2026 (~28 days, fast burn).
Peacock is the clearest example of IP-led FAST creative. Its top US spot is a 15-second video built entirely around Yellowstone — the ad copy reads, verbatim, "Don't miss the Dutton family drama. Stream Yellowstone on Peacock now." — and has reached an estimated 3.84 million impressions since June 9, 2026. A parallel static creative leans on a different franchise: "Let's keep it peachy. Stream The Real Housewives of Atlanta Season 17 on Peacock now."
 Peacock's top US creative — a 15-second Yellowstone spot, est. 3.84M impressions, first seen June 9, 2026. The copy names the show, not the app.
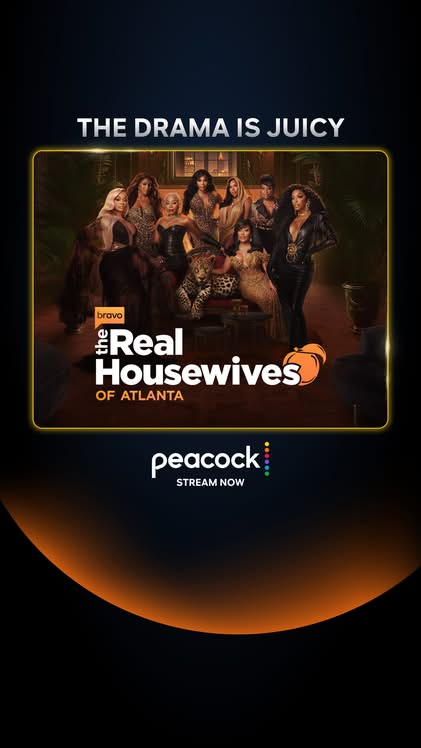 Peacock's static Real Housewives creative — a second franchise hook running in parallel, targeting a different audience with the same "stream now" structure.
The FAST pattern, summarized:
| App | Top creative impressions (est.) | Format | First seen | Days in market | Hook |
|---|---|---|---|---|---|
| Pluto TV | 21.3M | 15s video | 2026-03-05 | ~116 | Free movies + live TV |
| Tubi | 7.95M | 15s video | 2026-06-01 | ~28 | Free movies + live TV |
| Peacock | 3.84M | 15s video | 2026-06-09 | ~20 | Yellowstone (IP-led) |
The common thread: 15 seconds, one title, "free" front and center. FAST apps do not sell a product; they sell the single most clickable thing in their catalog this week.
One more pattern worth naming: portfolio depth. None of these apps rely on a single hero creative. Pluto TV's top four US spots stack to roughly 55 million combined impressions (21.3M + 16.4M + 9.2M + 8.5M), and Tubi's top four reach about 19 million (7.95M + 4.68M + 3.54M + 2.86M) — all in the same 15-second mold. The FAST playbook is not "find one perfect ad"; it is "run a deep bench of interchangeable title-led spots and let the algorithm allocate." For a category whose catalog refreshes constantly, that interchangeability is the point: when a new marquee title lands, the creative slot is already built and tested.
6. Engine two — short-drama: the long-form melodrama machine
If FAST is the most TV-like engine, short-drama is the most aggressive. Vertical short-drama apps — ReelShort, DramaNova, DramaVibe, Moj, and dozens of near-clones — run some of the longest video creatives in all of mobile UA, because the product is the ad: the creative is a clip of the actual melodrama, cut to end on a cliffhanger.
ReelShort (NewLeaf Publishing) is the category's reference point. Its top US creatives include a playable HTML unit that first appeared on February 26, 2026 and is still running as of June 29 — roughly four months (123 days) in market, an exceptional run-length that screams proven winner. Its top video creatives run 47 and 58 seconds — an eternity by mobile-ad standards — and lean on a forbidden-romance werewolf hook. The ad copy, verbatim: "Ten years ago, Elara was adopted by the Alpha of the Stormfang Pack and was destined to…" The on-creative overlay reads "Luna's Second Choice — FREE."
 ReelShort's "Luna's Second Choice" creative — a 58-second melodrama clip, est. 4.35M impressions, leaning on a forbidden-romance cliffhanger and a "FREE" overlay.
 A second ReelShort cut from the same series — a 47-second variant at an estimated 4.29M impressions. The apps run many cuts of one winning storyline.
DramaNova runs even longer. Its top US creative is a 60-second video at an estimated 5.61M impressions (first seen May 16, 2026), and it runs a second variant that stretches to a remarkable 115 seconds — essentially an entire mini-episode served as an ad.
 DramaNova's top US creative — a 60-second melodrama clip at an estimated 5.61M impressions. A parallel cut runs a full 115 seconds.
Moj (ShareChat) blends the format with a reels angle, running a tight 16-second spot with the copy "Trending reels + short dramas in one app. Start watching free." — positioning short-drama as a feed habit rather than a single story.
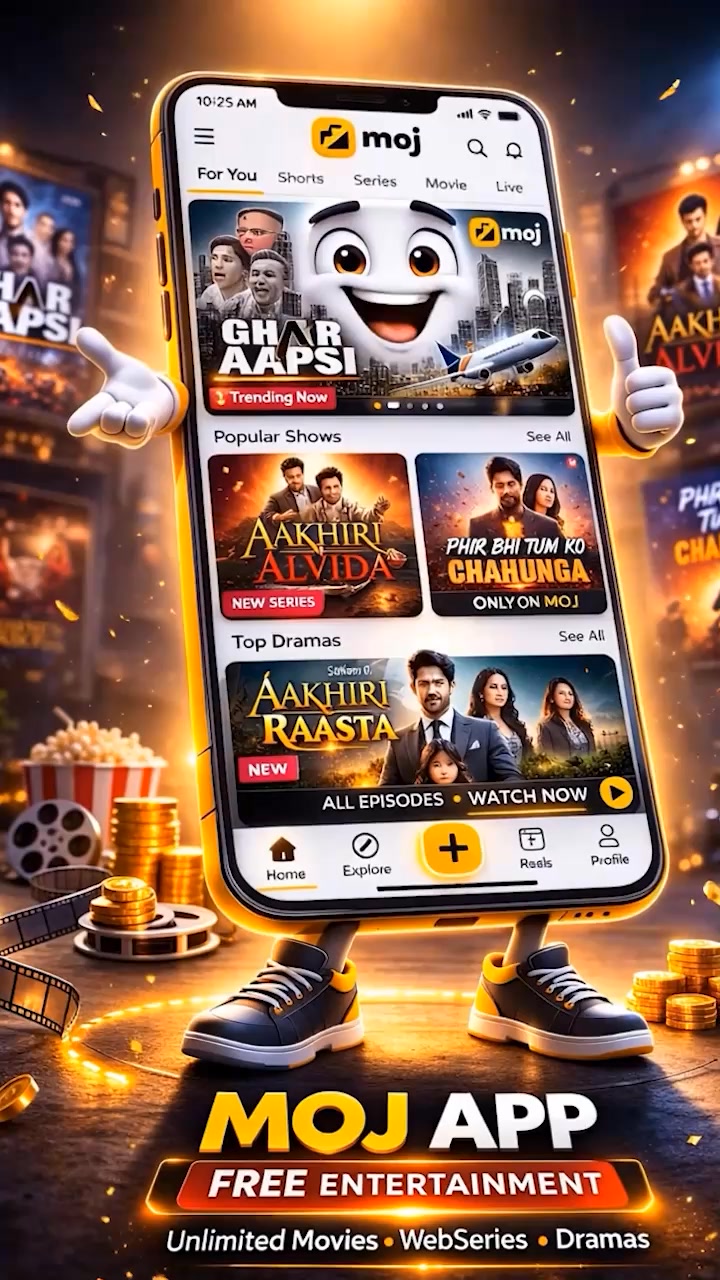 Moj's 16-second creative — positioning short-drama as a "trending reels + short dramas" feed habit, est. 2.03M impressions.
 DramaVibe's 26-second creative — a mid-length cut at an estimated 1.64M impressions, bridging the 15-second FAST and 60-second ReelShort extremes.
The short-drama pattern, summarized:
| App | Top creative impressions (est.) | Format / length | First seen | Hook |
|---|---|---|---|---|
| ReelShort | 5.68M (playable) | Playable HTML | 2026-02-26 | "Stream drama" / cliffhanger |
| DramaNova | 5.61M | 60s video (up to 115s) | 2026-05-16 | Melodrama clip |
| ReelShort | 4.35M | 58s video | 2026-06-05 | Forbidden romance ("Luna's Second Choice") |
| Moj | 2.03M | 16s video | 2026-05-04 | "Trending reels + short dramas, free" |
| DramaVibe | 1.64M | 26s video | 2026-04-11 | Melodrama clip |
The common thread: the ad is the product. Where a FAST app shows you a title card, a short-drama app shows you ninety seconds of the actual story and stops at the worst possible moment. The download is the only way to find out what happens next.
7. Engine three — live social: maximum scale, maximum longevity
The third engine buys the most raw impressions of any entertainment vertical we track. Bigo Live, the live-streaming social app, runs creatives at a scale that dwarfs the streaming and short-drama players.
Bigo's top US creative — a playable unit — sits at an estimated 152 million impressions and first appeared on August 6, 2025. As of June 29, 2026, it is still serving — a run-length of nearly eleven months (327 days). Almost nothing else in entertainment UA stays in rotation that long. When a creative survives that many media-buying optimization cycles, it is, by definition, a proven winner.
Its next creatives are nearly as large: an estimated 66.8M, 57.4M, 50.2M, and 42.1M impressions, mixing 13–20 second video with playable formats.
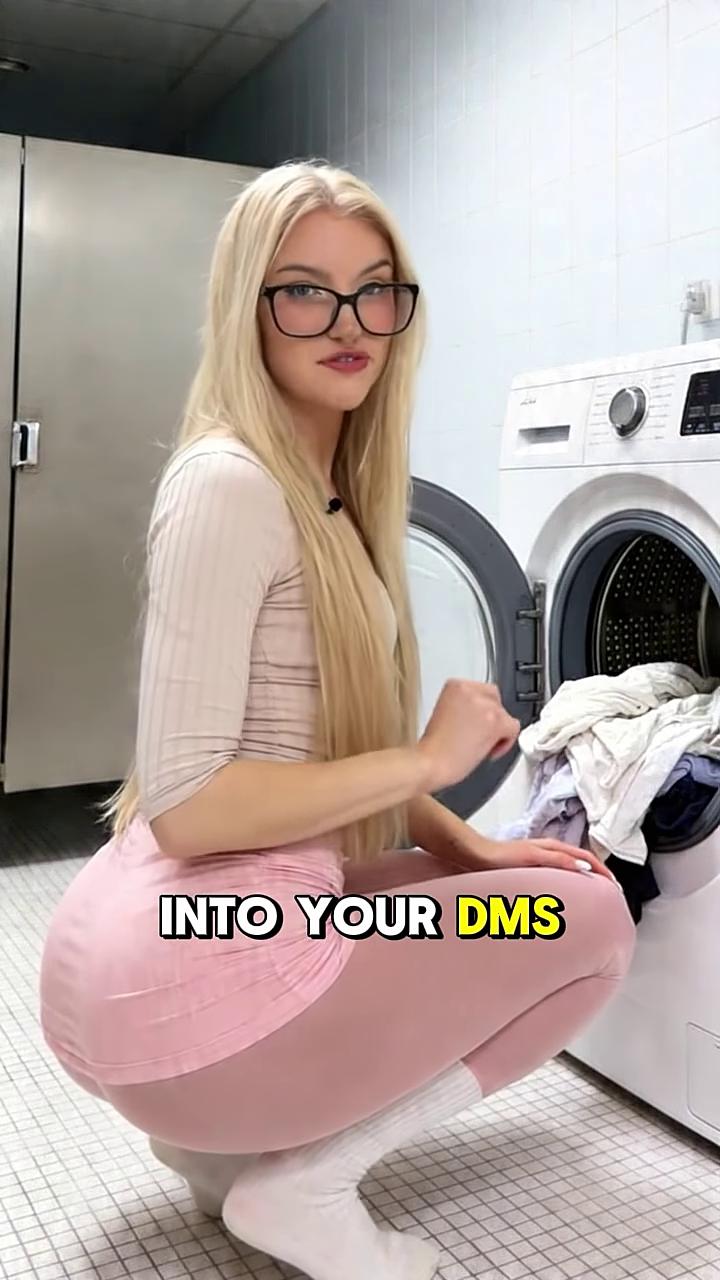 Bigo Live's 20-second video creative — est. 66.8M impressions. Live social apps sell interaction and presence, not a catalog.
 A second Bigo Live cut — a 13-second video at an estimated 57.4M impressions. The app runs a deep portfolio of high-volume creatives in parallel.
Live social UA is a different beast from streaming. There is no catalog to advertise and no cliffhanger to dangle; the product is people and real-time interaction. So the creatives sell social proof, presence, and the promise of connection — and they do it at a volume that only makes sense for an app monetizing through high-frequency virtual gifting rather than subscriptions.
The scale gap is worth sitting with. Bigo's fifth-ranked US creative, at an estimated 42.1 million impressions, still out-reaches the top creative of every FAST and short-drama app in this report by a wide margin — Pluto's leader is 21.3M, ReelShort's is 5.68M. In other words, a mid-tier Bigo creative is doing roughly double the volume of the best free-streaming spot on the board. That is the signature of a monetization model with very high lifetime value per paying user (virtual gifting whales), which can justify CPMs and budgets that subscription apps simply cannot match. When you benchmark across entertainment verticals, normalize for this — raw impression counts compare business models as much as creative quality.
The live-social pattern, summarized:
| App | Top creative impressions (est.) | Format | First seen | Days in market |
|---|---|---|---|---|
| Bigo Live | 152M | Playable | 2025-08-06 | ~327 |
| Bigo Live | 66.8M | 20s video | 2026-04-25 | ~65 |
| Bigo Live | 57.4M | 13s video | 2026-04-07 | ~83 |
8. The format wars: 15 seconds vs. 115 seconds
Stack the three engines side by side and the most striking difference is ad length — and it maps directly to what each app is selling.
| Engine | Typical length | Why |
|---|---|---|
| FAST | 15 seconds | The viewer already wants "free movies"; show one title and get out |
| Live social | 13–20 seconds | Sell presence and interaction; no story to tell |
| Short-drama | 40–115 seconds | The clip is the product; the cliffhanger needs runway |
This is one of the clearest format-strategy contrasts in mobile advertising. A FAST app and a short-drama app are both "video entertainment," yet one runs 15-second spots and the other runs creatives up to seven times longer. The reason is not budget or sophistication — it is the job the creative has to do. FAST sells recognition; short-drama sells suspense; live social sells belonging.
A second axis is format mix. Short-drama and live-social apps both lean heavily on playables alongside video — ReelShort's longest-running creative is a playable, and Bigo's 152M-impression flagship is a playable. FAST apps, by contrast, stay almost entirely in linear video. Playables reward products where trying the loop (swiping the next chapter, tapping into a live room) converts better than describing it.
9. Creative longevity: the most honest signal on the board
Impression counts tell you how much an app spent. Run-length tells you what worked. A creative that is still serving after 100+ days has survived dozens of optimization cycles in which the media buyer could have killed it — so its mere survival is the strongest endorsement available.
Here are the longest-running entertainment creatives we track in the US, ranked by days in market as of June 29, 2026:
| App | Engine | First seen | Days in market | Est. impressions |
|---|---|---|---|---|
| Bigo Live | Live social | 2025-08-06 | ~327 | 152M |
| ReelShort | Short-drama | 2026-02-26 | ~123 | 5.68M (playable) |
| Pluto TV | FAST | 2026-03-05 | ~116 | 21.3M |
| Bigo Live | Live social | 2026-04-07 | ~83 | 57.4M |
| DramaVibe | Short-drama | 2026-04-11 | ~79 | 1.64M |
The lesson for UA teams: do not just count impressions; track first-seen dates. A competitor's 100-day-old creative is a free A/B test they ran for you — it is the concept, hook, and format their dollars have already validated. Reverse-engineering a proven evergreen beats guessing at a brand-new one.
10. Hook teardown: three ways entertainment apps open
Strip the creatives down to their first three seconds and the entertainment market resolves into three repeatable hook archetypes.
1. IP-led ("you already love this"). Peacock's "Don't miss the Dutton family drama. Stream Yellowstone on Peacock now" names the show, not the app. The bet is that recognition does the persuading — the viewer is not deciding whether to try a streaming service, only whether to watch a show they already follow. This is the dominant FAST hook for premium services with marquee IP.
2. Cliffhanger-led ("what happens next?"). ReelShort's "Ten years ago, Elara was adopted by the Alpha of the Stormfang Pack and was destined to…" — and then the ad cuts. The entire conversion mechanism is the unfinished sentence. Short-drama lives or dies on the strength of the stop-point; the download is the resolution.
3. "Free forever" framing. Both FAST and short-drama lean on free as the load-bearing word — Tubi and Pluto's "free movies and live TV," Moj's "start watching free," ReelShort's "FREE" overlay. In a market where every premium service costs $8–18/month, "free" is the single most efficient differentiator, and the surging download leaders all use it.
Notice what these hooks have in common with the broader 2026 creative trend we documented in our mid-2026 US mobile advertising report: front-loading. The clickable thing — a famous show, a cliffhanger, the word free — lands in the first beat, not after a build-up. Entertainment apps just have unusually clear "clickable things" to lead with.
11. What this means for UA, creative, and growth teams
The three engines demand different playbooks. Here is the operational read for each role.
If you run a FAST or SVOD app:
- Lead with your single most recognizable title, not your brand. Peacock advertises Yellowstone, not Peacock.
- Keep it to 15 seconds and refresh frequently — Tubi's fast-burning June creatives suggest the category rewards freshness over evergreen.
- Run parallel IP hooks for distinct audiences (Peacock runs Yellowstone and Real Housewives simultaneously).
If you run a short-drama app:
- Make the ad the product. Serve 40–90 seconds of the actual story and cut on the cliffhanger.
- Test playables hard — the category's longest-running winners (ReelShort) include playable units.
- Build many cuts of one validated storyline rather than many storylines. ReelShort runs multiple variants of "Luna's Second Choice."
If you run a live-social app:
- Optimize for volume and longevity. Bigo's strategy is industrial: huge impression counts on creatives that run for the better part of a year.
- Sell presence and interaction, not a catalog. The hook is connection, and playables let viewers feel the loop.
For everyone: the single highest-leverage habit is watching your competitors' run-lengths. The creative still live after 100 days has been validated by someone else's budget. Build from it. AdMapix users can filter any category by first-seen date and impression volume to surface exactly these evergreen winners — log in or create a free account to pull the live entertainment leaderboards for your own app and markets, or see plans and pricing for team access.
12. The AI cooldown and the attention reallocation
The other half of the June 29 chart story is what fell. On the same snapshot where entertainment apps surged, the generative-AI assistants that owned 2025's headlines posted some of the steepest declines on the board:
| App | Developer | Est. daily downloads | Growth |
|---|---|---|---|
| ChatGPT | OpenAI | 4,657,947 | −49% |
| Claude by Anthropic | Anthropic | 2,127,253 | −52% |
| Google Gemini | 1,699,321 | −51% |
A single day's movement is not a trend — these are still the largest download numbers on the chart, and AI app demand is famously spiky around model launches. But the direction matters for entertainment marketers. Consumer attention and discretionary screen time are finite, and the mid-2026 picture is one of attention flowing back toward passive entertainment — free movies, reality TV, short-drama, live rooms — after an AI-app acquisition wave crested. For a UA team, the read is not "AI is dead"; it is "the entertainment category is in an expansion phase, install costs in entertainment are being bid up by event-driven demand, and the window to capture cheap installs around a surge is short." When FOX One jumps 1,422% in a day, the auction for entertainment impressions gets more expensive for everyone in adjacent categories — which is exactly when knowing your competitors' proven evergreen creatives (Section 9) pays off most.
13. Beyond the big three: outliers worth watching
Two non-streaming movers on the same chart are worth flagging because they represent adjacent attention plays that entertainment marketers increasingly compete with for the same eyeballs and ad inventory.
- Meowdoku! (+802%) — a casual puzzle game from Oakever Games, ranked #13 by US daily downloads at an estimated 1.83M. It is the lone game inside the top 20, and its surge is a reminder that casual games still break through occasionally — but, tellingly, by buying their way up rather than appearing organically, the same dynamic that defines the rest of the board.
- Kalshi (+102%) — a prediction-market / event-trading app ranked #10 at an estimated 1.88M downloads. Its "Trade the Cup" positioning ties it to a live sporting event, putting it in the same event-driven demand pool as FOX One and Love Island. Prediction markets are quietly becoming an entertainment-adjacent category, competing for the exact moments — big games, finales, news events — that streaming apps spike around.
The pattern across all of these is consistent with the rest of the report: in the US in 2026, the apps that surge are the apps that buy attention around moments. Whether the product is a streaming catalog, a melodrama series, a live room, a puzzle, or a prediction market, organic discovery is no longer the growth engine — paid creative is. The only question for a marketer is whether you can see what your competitors are running before they out-bid you on the next surge.
14. Methodology & data notes
All figures in this report come from AdMapix advertising-intelligence tracking and reflect the US market as of June 29, 2026.
- Download and revenue charts are AdMapix daily estimates for the US. Growth figures are day-over-day. Revenue values are relative indices with undefined units — read rank and growth direction, not absolute dollars.
- Creative impressions are AdMapix estimates of how many times a given ad creative has been served, accumulated since its first-seen date. They are directional market signal, not verified ad-server counts.
- Days in market is computed from each creative's first-seen date to the snapshot date (June 29, 2026); creatives described as "still running" were observed serving within the snapshot window.
- Ad copy and creative formats (video length, playable, static) are recorded as observed in the wild. Quoted ad copy is verbatim from the tracked creatives.
- App names, developers, and creative assets are reproduced as tracked. Third-party trademarks belong to their respective owners and are referenced here for market-analysis purposes only.
These are external estimates for competitive-intelligence purposes and should not be treated as audited financials or official platform metrics. For the live, daily-updated data behind every chart — including the full video creatives, country splits, and named competitor sets — create a free AdMapix account.
Frequently Asked Questions
Which apps are growing fastest on the US download chart in mid-2026? As of June 29, 2026, streaming and entertainment apps lead the US download surge: FOX One (+1,422% day over day), Love Island USA (+9,571%), Peacock (+155%), and Tubi (+24%) all rank in the US top 20 by daily downloads, while AI assistants like ChatGPT, Claude, and Gemini each fell roughly 49–52% on the same day.
Why don't streaming apps appear on the app-store revenue chart? Because most of their money does not flow through store in-app purchases. FAST apps like Tubi and Pluto TV monetize primarily through advertising, and premium services increasingly bill subscriptions through the web to avoid store commissions. So streaming apps win downloads but under-index on store IAP revenue — the two charts describe different realities.
What ad format do streaming apps use most? Free ad-supported streaming (FAST) apps run short, 15-second, title-led video spots built around a single recognizable show. Short-drama apps run much longer 40–115 second melodrama clips plus playables, and live-social apps like Bigo Live run 13–20 second video and playables at very high volume.
How long do entertainment ad creatives stay in market? The proven winners run for months. Bigo Live's top US creative has served an estimated 152 million impressions and run for roughly 327 days; ReelShort's top playable has run about 123 days; Pluto TV's top spot about 116 days. Run-length is the strongest signal that a creative is working.
What is short-drama UA and why are the ads so long? Short-drama apps (ReelShort, DramaNova, DramaVibe, Moj) advertise vertical melodrama series. Their ads are unusually long — 40 to 115 seconds — because the creative is the product: it shows an actual story clip and cuts on a cliffhanger, so the download becomes the only way to find out what happens next.
How can I see the real creatives behind these numbers? AdMapix tracks the live video creatives, impression estimates, first-seen dates, formats, and country splits for entertainment apps and every other category. Create a free account to pull the current US entertainment leaderboards for your own app and competitors.
See what competitors are really running
Search 6M+ ad creatives, landing pages, and weekly spend across 200+ countries. No credit card, no commitment.
Related Articles
US Social Casino Advertising Teardown — Mid-2026
A data-driven teardown of how social casino, poker, slots, and bingo apps buy users in the United States as of mid-2026 — the highest-impression creatives, the publishers behind them, the format playbook, and how sweepstakes-casino newcomers are reshaping the category. Based on AdMapix tracking data as of June 26, 2026.
US Mobile Advertising Intelligence Report — Mid-2026
A data-driven mid-2026 breakdown of the US mobile market: who tops the download and revenue charts, why mobile games depend on paid user acquisition, and which ad creatives, formats, and hooks are winning across puzzle, match-3, strategy, slots, and idle RPG — based on AdMapix tracking data as of June 26, 2026.
Mobile Game Ad Spend by Platform: A 2026 UA Budget Guide (Meta, Google, TikTok, DSP)
A practitioner's guide to mobile game ad spend by platform: how UA budgets really split across Meta, Google, TikTok, and DSPs; the mechanism behind each platform's role; how privacy-era measurement, creative systems, and genre fit change the split; a budget-allocation framework; a reallocation cadence; and the honest limits of what competitor spend data can and cannot tell you.