US Mobile Advertising Intelligence Report — Mid-2026
A data-driven mid-2026 breakdown of the US mobile market: who tops the download and revenue charts, why mobile games depend on paid user acquisition, and which ad creatives, formats, and hooks are winning across puzzle, match-3, strategy, slots, and idle RPG — based on AdMapix tracking data as of June 26, 2026.
US Mobile Advertising Intelligence Report — Mid-2026
As of June 26, 2026, the US mobile market has split into two economies that barely touch each other. At the top of the download and revenue charts sit AI assistants, streaming apps, and Google's utility suite — products that grow on brand, distribution, and word of mouth. Meanwhile, an entire parallel economy of mobile games never appears on those organic charts at all, because games do not get discovered; they get bought. The single highest-impression game ad creative we are tracking in the US has been served an estimated 191.2 million times in six weeks, and it does not even name the app it promotes.
This report maps both economies using AdMapix tracking data: the organic download and revenue leaderboards, and — more importantly for anyone running paid user acquisition — the creative strategies, formats, run-lengths, and hooks that define how mobile games actually win attention in 2026. Every number below is real and current as of late June 2026. Treat the estimates as directional market signal, not audited financials. The full, daily-updated data behind every chart — the actual video creatives, country splits, and named competitors — is available to AdMapix users; log in or create a free account to pull these leaderboards for your own genre and markets.
What's inside:
- The mid-2026 US download and revenue landscape, and why AI apps own the top
- Why mobile games play an entirely different acquisition game
- Genre-by-genre creative leaderboards (puzzle, match-3, strategy, slots, idle RPG) with real ad creatives
- The format wars: video vs. playable vs. static
- Creative longevity as the single most honest performance signal — with a worked example
- A teardown of the off-product "hook" creatives driving casual reach
- Geography, seasonality, and concrete takeaways for UA, creative, and growth teams
1. Executive summary (TL;DR)
Three patterns define the US mobile market in mid-2026.
First, the organic charts belong to AI and streaming. The top of the US download chart is now an AI-assistant battleground — ChatGPT, Claude, and Google Gemini all rank in the top ten by 30-day downloads, alongside TikTok, YouTube, and a surging wave of free streaming apps. Notably, almost all of them are declining month over month, suggesting the post-launch AI download boom is cooling into a retention-and-monetization phase.
Second, revenue concentrates around utility and subscription, not games. Google alone occupies multiple top-ten revenue positions (Maps, Gmail, YouTube, Chrome, Photos), and the fastest-growing revenue stories are utilities like Google Maps (+155%) and Life360 (+165%) — not entertainment.
Third, games live or die on paid creative. Because games are largely absent from the organic top of the charts, their visibility is manufactured through advertising. That makes ad-creative intelligence — what's running, in what format, for how long — the most reliable lens into which games are actually scaling. The genre data shows casual titles buying enormous single-creative reach, while strategy advertisers win quietly on creative longevity, with top ads still live after 300 to 490 days.
The rest of this report unpacks each pattern with the underlying data.
2. The 2026 US download landscape: AI eats the top of the chart
Start with raw downloads. Across all categories, here are the most-downloaded apps in the United States over the trailing 30 days, per AdMapix estimates:
| Rank | App | Est. 30-day downloads | MoM growth | Publisher |
|---|---|---|---|---|
| 1 | ChatGPT | 5,620,472 | −37.3% | OpenAI |
| 2 | TikTok | 4,303,144 | −23.7% | ByteDance |
| 3 | Peacock TV | 3,700,472 | +167.7% | Peacock TV LLC |
| 4 | WhatsApp Messenger | 2,812,400 | −30.5% | WhatsApp Inc. |
| 5 | YouTube | 2,727,032 | +7.4% | |
| 6 | CapCut | 2,715,200 | −28.3% | ByteDance |
| 7 | FOX One | 2,699,917 | +1,460.6% | Fox Digital Services |
| 8 | Claude | 2,587,568 | −40.6% | Anthropic |
| 9 | 2,180,949 | −23.4% | Instagram, Inc. | |
| 10 | Google Gemini | 2,061,753 | −40.6% |
Two things jump out.
The AI cohort is cooling in unison. ChatGPT (−37%), Claude (−41%), and Gemini (−41%) are the three largest assistants in the US, and all three are shedding downloads at almost exactly the same rate. When three direct competitors decline in lockstep, it usually points to a category-level effect — saturation of the early-adopter base — rather than any one product losing a head-to-head. The AI assistant land grab is moving from "acquire everyone" to "retain and monetize," which is a very different growth phase and changes how each of them will spend on marketing in the back half of the year.
Streaming is the surprise mover. Peacock TV (+168%) and FOX One (+1,461%) are the two standout climbers, both riding live-sports and event-driven install spikes. FOX One's four-figure growth rate is the kind of number that only appears when a new app hits a seasonal catalyst — a major sports window, a marquee live event — and it's exactly the kind of breakout that competitors should be studying for creative and timing cues. Tubi (+34%) reinforces the pattern: free, ad-supported streaming is having a genuine moment in the US install charts.
What's conspicuously absent from this list? Games. Not a single mobile game appears in the US top ten by downloads. That is not because games aren't being installed in volume — it's because their installs are distributed across thousands of titles, none of which can match a single dominant utility app on the organic chart. Which brings us to the core asymmetry of mobile.
3. The revenue map: where the money actually concentrates
Downloads are attention. Revenue is the scoreboard. Here is the US top ten by estimated trailing-30-day revenue (shown as AdMapix revenue index units; focus on rank and growth rather than absolute figures):
| Rank | App | Revenue trend | Publisher |
|---|---|---|---|
| 1 | Google Maps | +155.2% | |
| 2 | Gmail | −28.6% | |
| 3 | YouTube | −39.8% | |
| 4 | WhatsApp Messenger | −25.5% | WhatsApp Inc. |
| 5 | Life360: Family Safety & GPS | +164.7% | Life360 |
| 6 | Chrome | −18.8% | |
| 7 | Google Search | −18.0% | |
| 8 | Discord | −7.8% | Discord, Inc. |
| 9 | −41.2% | Instagram, Inc. | |
| 10 | Google Photos | +0.4% |
The revenue chart tells a blunter story than downloads: Google owns it. Six of the top ten revenue positions are Google properties. This is the gravitational reality every other publisher operates inside — the default apps that ship on or near every device capture a structural share of in-app spend that no amount of marketing can dislodge.
The interesting movement is at the edges. Google Maps (+155%) and Life360 (+165%) are the two breakout revenue gainers, and both are location/safety utilities monetizing subscriptions — a reminder that the most durable mobile revenue in 2026 increasingly comes from recurring utility value, not one-time entertainment. Meanwhile, social and entertainment incumbents (YouTube −40%, Instagram −41%) are in revenue retreat over this window, even as they retain enormous user bases. The signal there is monetization pressure: big audiences are not automatically translating into growing per-period revenue right now.
Again: no games in the top ten. And again, that absence is the whole point — it is the single most important fact about how the games business actually works.
4. Why mobile games play an entirely different game
If games barely register on the organic download and revenue charts, how does a mobile game become a hit?
The answer is paid user acquisition, and it is not a footnote to the strategy — it is the strategy. A casual game's growth engine is a flywheel: buy installs with high-reach video creative, monetize through ads and in-app purchases, and reinvest the return back into more installs. The entire business lives or dies on the efficiency of that loop, and the most visible, measurable part of the loop is the ad creative itself.
This is why ad-creative intelligence is the single most useful lens into mobile gaming. You cannot see a competitor's ROAS, their retention curves, or their lifetime-value models. But you can see exactly which creatives they are running, in which format, in which countries, and — crucially — for how long they keep running them. A creative that stays live for months is a creative that is paying for itself. Run-length is the closest thing the open market has to a public confession of "this works."
There is a second-order benefit to reading the market this way. Because creative production is expensive and creative testing is disciplined at scale, a competitor's active creative set is effectively a published summary of everything they have already learned about what converts. You get the distilled output of their entire testing budget for free, simply by watching what survives. For the rest of this report, we stop looking at organic charts and start reading those paid-creative tea leaves, genre by genre. The data covers five of the most competitive US mobile-game verticals: puzzle, match-3, strategy, slots, and idle RPG.
5. Genre creative leaderboards
5.1 Puzzle — the reach machine
The puzzle category produces some of the highest single-creative impression counts in all of mobile. The current US leader is Block Color Mania by Brainteaser Puzzle Game Studio, whose top creative pairs a 55-second video with a playable unit.
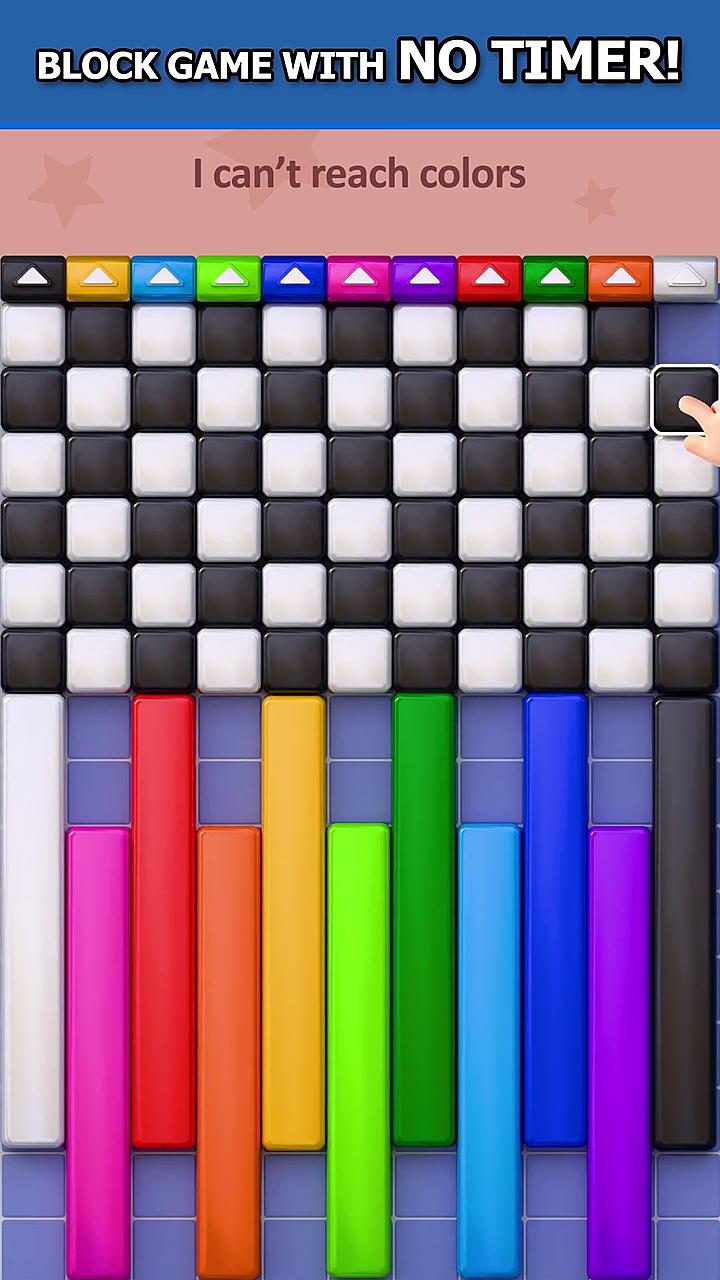 Block Color Mania's top US video creative — an estimated 158.5M impressions, live since May 21, 2026.
The numbers are staggering for a single creative: an estimated 158.5 million impressions in roughly five weeks. What makes puzzle creatives so efficient at reach is their universality — block-sorting and color-matching require zero context to understand, so a three-second clip communicates the entire value proposition to any viewer in any feed, in any country, with no localization beyond the UI. The format choice reinforces this: a long-form video to hook, plus a playable to let high-intent users "try before they install."
The trade-off is depth. Puzzle creatives optimize for the widest possible top of funnel, which means they tend to over-promise simplicity and attract a broad, lightly-committed audience. The reach is real; the retention burden is also real. The publishers who win in puzzle are the ones who pair this enormous front-of-funnel with an onboarding and monetization system tuned to convert a small, valuable slice of an enormous, casual install base.
5.2 Match-3 — reach with off-product framing
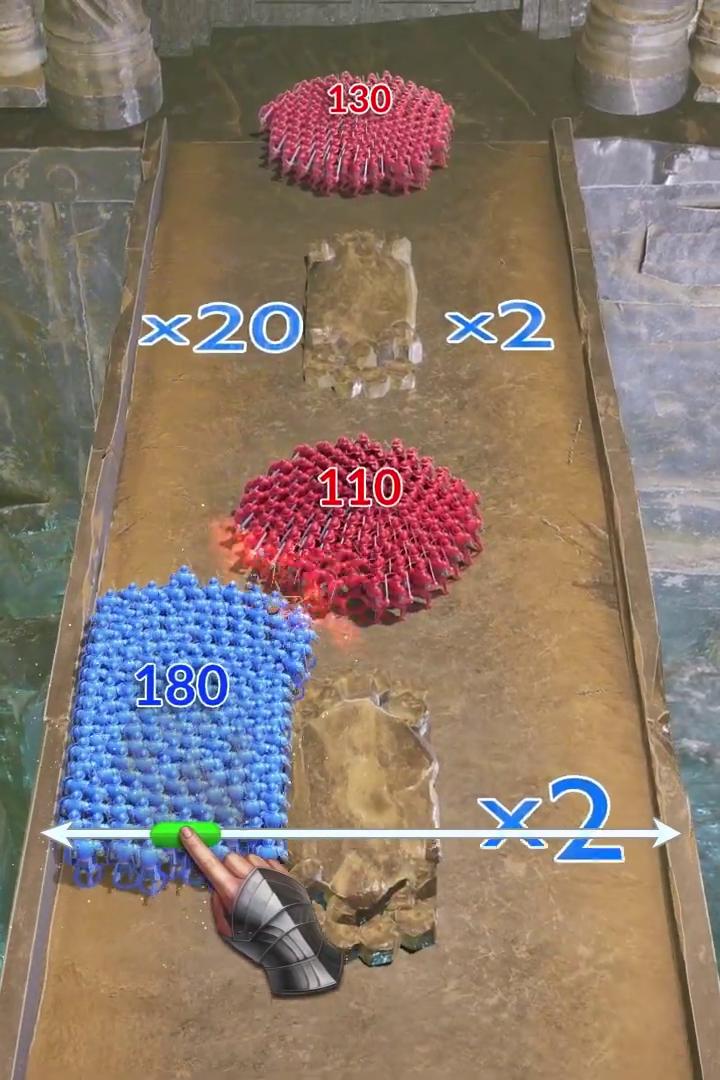
If puzzle is the reach machine, match-3 is the reach machine with a marketing disguise. The single highest-impression game creative in our entire US dataset is a match-3 video at an estimated 191.2 million impressions — and its on-screen promise is telling:
 The #1 US game creative by impressions — a match-3 video whose hook promises "exclusive 4K wallpapers and secret videos."
The ad copy reads: "Match 3 to unlock exclusive 4K wallpapers and secret videos!" — and a second high-reach variant in the same campaign promises "clear the board, claim your goddess." This is off-product framing: the creative sells a reward (wallpapers, "secret" content) that is, at best, peripheral to the actual match-3 loop. It's a deliberate top-of-funnel tactic — the hook is engineered to maximize click-through among an audience far broader than "people who want a match-3 game."
It clearly works for reach. Whether it works for retention is the eternal question with this tactic — installs acquired on a mismatched promise tend to churn fast, because the product the user downloaded is not the product they were sold. But at 191 million impressions, the advertiser has clearly decided the volume justifies the funnel leakage. We tear this pattern apart in detail in Section 9.
5.3 Strategy — winning on longevity, not peak reach
Strategy is where the data gets genuinely instructive, because the winners look like losers if you only read impression counts. The two leaders are Kingdom Clash (Casual Azur Games) and Total Battle (Scorewarrior).
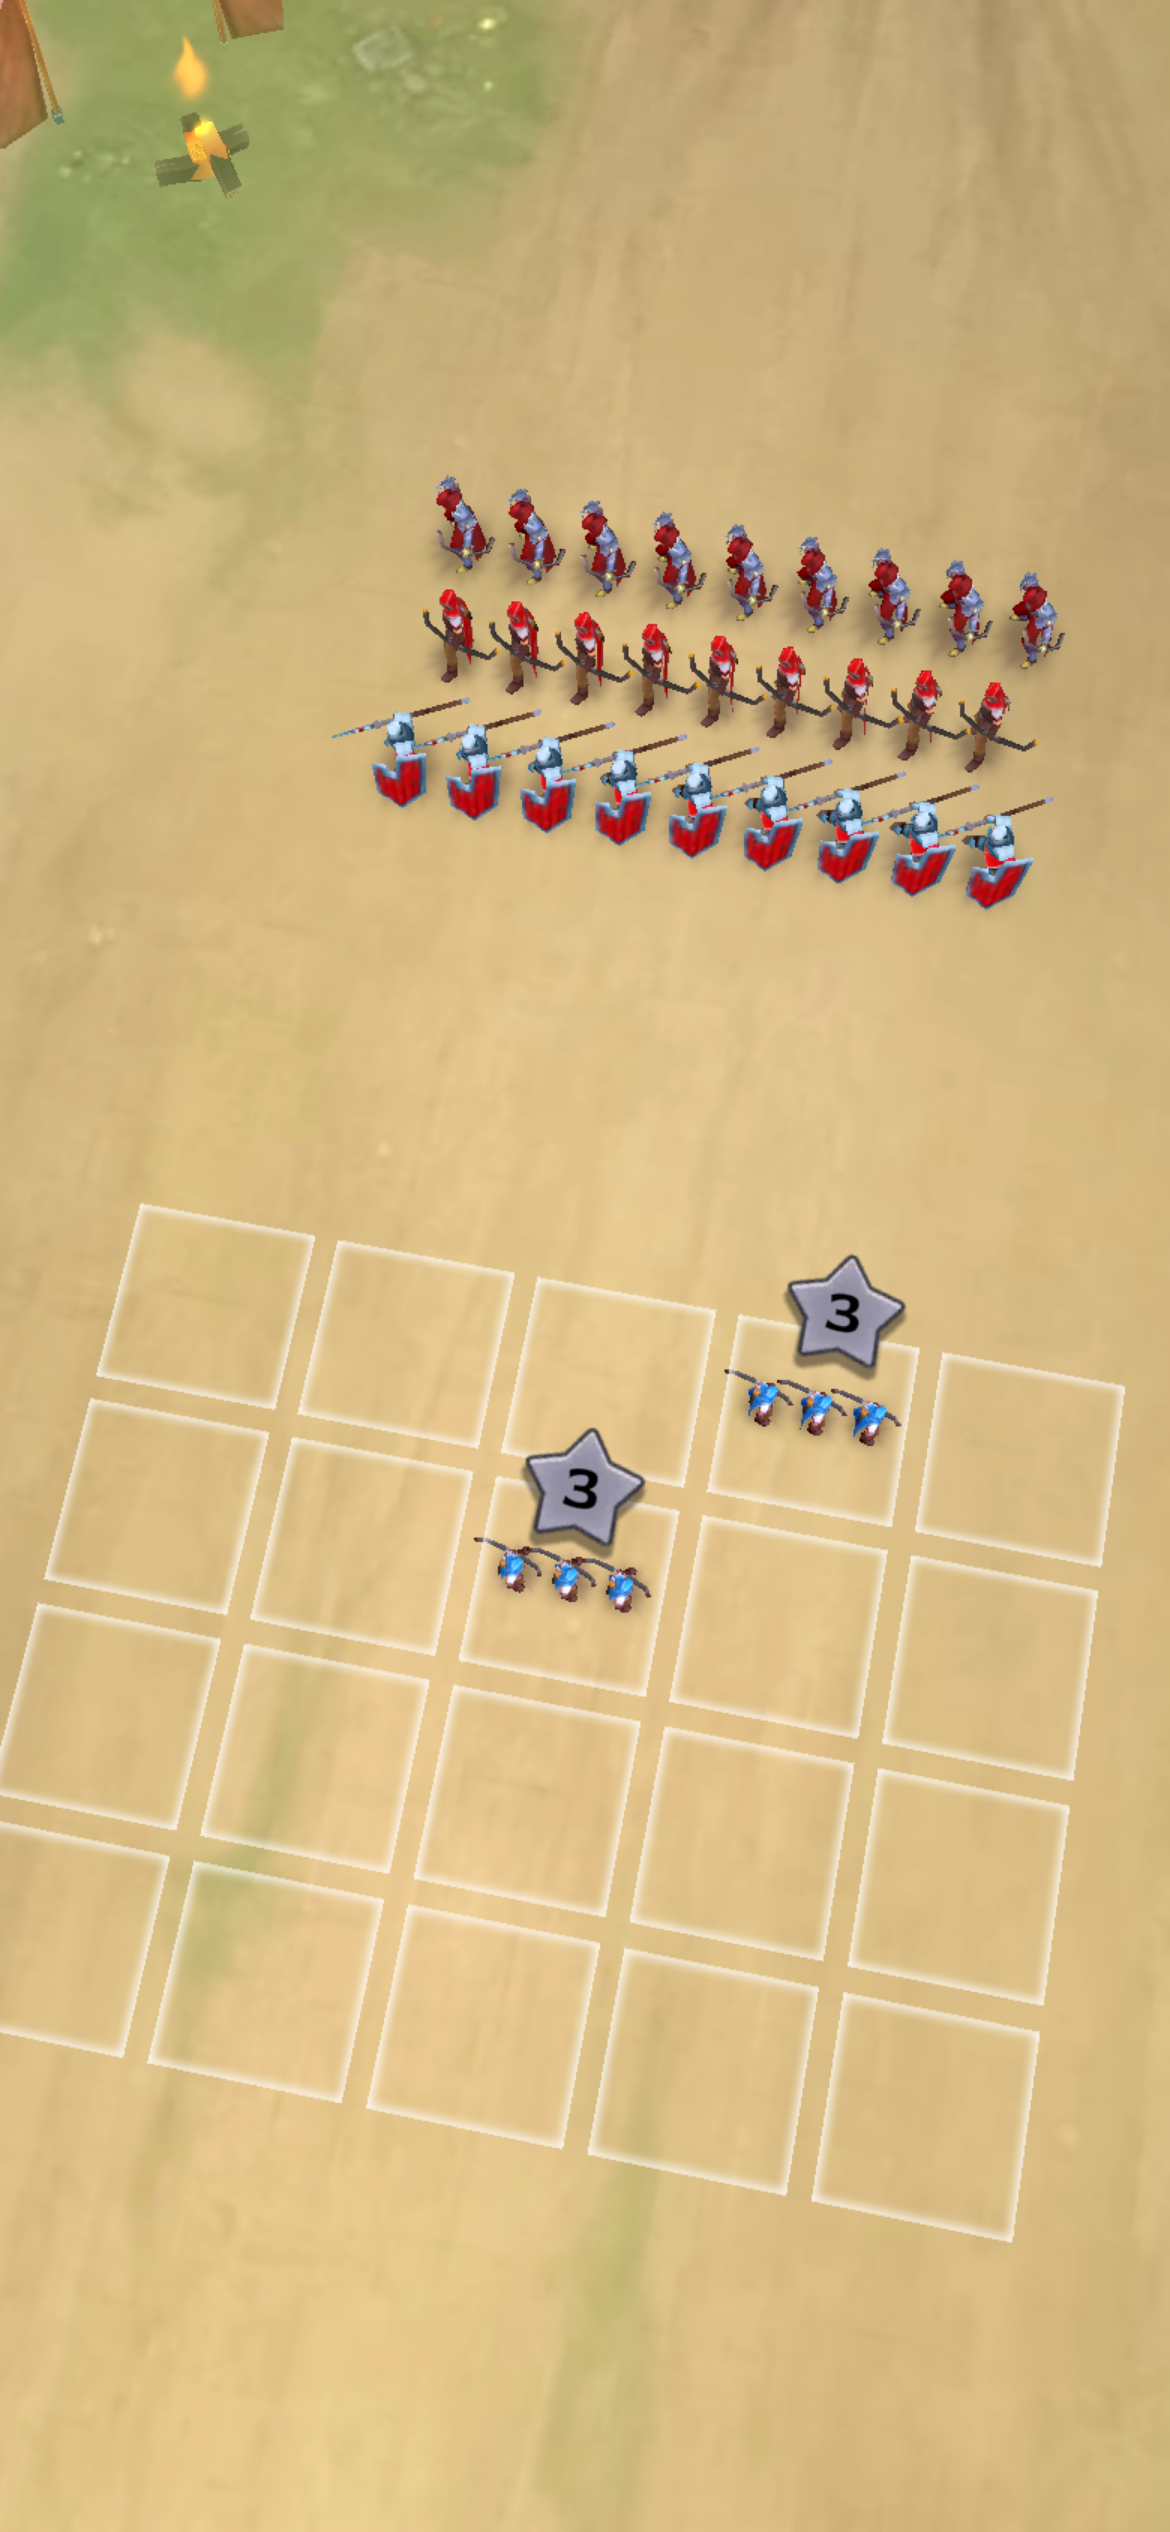 Kingdom Clash's playable creative — live since July 2025, 337 days and counting.
Kingdom Clash's top creative sits at a respectable ~62.7M impressions, and Total Battle's at just ~6.1M — an order of magnitude below the casual leaders. But look at the run-lengths: Kingdom Clash has kept that creative live since July 25, 2025 (337 days), and Total Battle's has been running since February 19, 2025 — over 490 days.
 Total Battle's flagship video creative has been in continuous rotation for 490+ days — the clearest "this works" signal on the board.
No advertiser pays to keep a creative in rotation for 16 months unless it is returning more than it costs. This is the single most honest performance signal on the entire board. Strategy games operate on deep monetization and long player lifetimes, which means they can afford to acquire users at a higher cost-per-install and recover it slowly — and their creative strategy reflects that. They are not chasing a viral reach spike; they are running a proven, durable creative for as long as it keeps converting profitable players.
For anyone benchmarking midcore UA, the lesson is explicit: stop measuring creative success by peak impressions and start measuring it by survival. A creative's age, not its reach, is the number that correlates with profit.
5.4 Slots — disciplined short-form video
The social-casino category is a study in restraint. The two leaders, MONOPOLY Slots (Phantom EFX) and Dancing Drums Slots (SciPlay), both run video-only — no playables, no exotic formats.
 MONOPOLY Slots — a disciplined 40-second video creative, ~29.2M impressions, running since February 2026.
MONOPOLY Slots sits at ~29.2M impressions (live since February 2026), Dancing Drums at ~28.2M (live since December 2025). Their reach is steady, their run-lengths are multi-month, and their format is uniform: short video, 25–40 seconds.
 Dancing Drums Slots — ~28.2M impressions on a 25-second video, live since December 2025.
Social casino is a mature, heavily-tested category with sophisticated LTV models and an older, higher-spending audience. The creative strategy mirrors that maturity — these advertisers are not experimenting their way to a breakout; they are running disciplined, proven video at consistent volume. If you compete in this category, that consistency is the bar to clear before you test anything unconventional. The absence of playables is itself a signal: a slot machine's core loop is chance-based and doesn't "demo" in a meaningful interactive snippet, so the production cost of a playable wouldn't pay back.
5.5 Idle RPG — a long-tail genre still searching for its formula
Idle RPG rounds out the picture as the genre still looking for its breakout creative. The leader, Forge Master (Lessmore GmbH), tops the slice at just ~3.5M impressions — a full two orders of magnitude below the casual leaders.
 Forge Master leads idle RPG at ~3.5M impressions — the genre's ceiling sits far below casual.
The idle-RPG creatives we track skew newer, lower-reach, and more fragmented across advertisers, with no single dominant creative formula. Forge Master's leading creative also ships an unusually high count of distinct playable variants, a sign of a publisher actively testing into the format rather than running a settled winner. That's characteristic of a genre still in its creative-discovery phase — lots of testing, no runaway template. For a UA team, that's actually an opportunity signal: in a genre without a dominant creative formula, the cost of finding one first is lower, and the upside of owning it is higher.
6. The format wars: video, playable, and static
Stepping back from individual genres, a clear format hierarchy emerges across the US game-creative landscape in mid-2026.
Video is the universal base layer. Every top creative in every genre we examined runs video as its primary format, with run-times clustering in two bands: short (24–40 seconds) for slots, match-3, and idle RPG, and long (50–60 seconds) for puzzle and strategy. The longer formats appear where the product needs more on-screen explanation or where a narrative hook drives the install.
Playables cluster in casual and strategy. The puzzle and strategy leaders both ship playable (demoad) units alongside video. Playables are expensive to produce and only pay off when the core loop is genuinely demonstrable in 15–30 seconds — which is exactly true of block-sorting puzzles and tap-to-battle strategy snippets. Slots and idle RPG, whose loops are either chance-based or time-based, largely skip playables, because there is no satisfying interactive moment to compress into a 20-second demo.
Static and image creatives are nearly absent from the top. Across the genres we tracked, the highest-impression creatives are overwhelmingly video. Static images still have a role in retargeting and certain placements, but they no longer compete for top-of-funnel reach in competitive game categories.
The strategic implication: if you are entering a competitive game category in the US, video is table stakes, and a playable is the differentiator worth the production cost only if your core loop demos cleanly. Spend the playable budget where the loop is showable; spend it on stronger video hooks where it isn't.
7. Creative longevity: the most honest signal on the board
It is worth isolating the single most important pattern in this entire report, because it is the one most often missed: creative run-length is a better performance signal than impression volume.
Consider the contrast. A casual match-3 creative can rack up 191 million impressions in six weeks and then disappear — a bright, brief burn typical of broad-reach casual UA. Meanwhile, a strategy creative with a fraction of that reach quietly stays live for 16 months. Which one is "winning"?
If you only read impressions, you'd pick the match-3 ad. But run-length tells you the strategy creative has been continuously profitable for over a year — an advertiser kept paying to serve it, day after day, because it kept returning more than it cost. That is a far stronger statement about creative effectiveness than a one-time reach spike, which can be driven by a temporary budget surge that says nothing about efficiency.
| Signal | What it tells you | What it doesn't |
|---|---|---|
| Peak impressions | Budget and reach ambition at a moment | Whether the spend was efficient |
| Run-length (days live) | Sustained profitability of the creative | Absolute scale of the campaign |
| First-seen date | Creative freshness and testing cadence | Current spend level |
| Format mix | Funnel design and production investment | Conversion outcome |
The practical takeaway for competitive analysis: when you study a rival's creatives, sort by days live, not by impressions. The ads that have survived longest are the ads they have proven. Those are the ones worth learning from — and, where appropriate, worth testing your own variations against.
A worked example: reading Total Battle's 490-day creative
Make this concrete. Total Battle's flagship video first appeared in our US tracking on February 19, 2025. As of June 26, 2026, it is still live — more than 490 continuous days. Over that window we observe it being re-detected hundreds of times across networks, which tells us it isn't a dormant leftover; it is actively, continuously served.
Now reason about what that requires. Ad networks decay creative performance over time as audiences saturate and fatigue sets in. For a single creative to remain economically viable for 16 months, one of two things must be true: either Total Battle's audience is large and slowly-refreshing enough that the creative never fully fatigues, or the creative's conversion quality is high enough that even at reduced efficiency it still clears the advertiser's ROAS bar. Both interpretations point to the same conclusion — this is a deeply validated creative backed by a monetization model that rewards patient acquisition. If you compete with Total Battle, that 490-day creative is not just an ad to admire; it is a documented answer to the question "what hook, pacing, and offer actually convert paying strategy players in the US?" Reverse-engineering its structure is worth more than any amount of brainstorming from scratch.
 Total Battle (Scorewarrior) anchors its US strategy with a single creative running well past the one-year mark.
It's worth naming what kind of advertiser sustains a creative this long. Studios that run year-plus creatives are almost always operating mature, deep-monetization titles where a single paying player is worth tens or even hundreds of dollars across their lifetime. That economic structure is precisely what makes patient, durable creative viable in the first place — and it's why a new entrant cannot simply copy the creative and expect the same result. The ad is downstream of the lifetime-value model that funds it. If your monetization cannot support a high cost-per-install recovered slowly over months, then a 490-day creative is a strategy you can admire but not yet afford to run. Read longevity, in other words, as a joint signal about both the creative and the business behind it: the ad survived because the unit economics let it. This is also why benchmarking across genres is a trap — a slots creative, a puzzle creative, and a strategy creative are each answering a different financial question, and only make sense judged against their own category's economics.
8. Hook teardown: the rise of off-product framing
The match-3 leader deserves a closer look, because its tactic is spreading. The hook — "unlock exclusive 4K wallpapers and secret videos" — is a textbook example of off-product framing, where the creative advertises a reward that is tangential to the actual gameplay loop.
Why does this work well enough to drive 191 million impressions? Because it widens the addressable audience far beyond people actively seeking a match-3 game. A "free 4K wallpapers" promise pulls in anyone who likes the imagery, and the match-3 mechanic is positioned as a trivial gate to the "real" reward. The click-through population is enormous, and at a low enough cost-per-impression, even a low conversion rate produces a large absolute number of installs.
The risk is equally clear, and any UA lead should weigh it honestly:
- Install-to-retention mismatch. Users who installed for wallpapers and "secret videos" did not install for a match-3 game. Day-1 and day-7 retention on this cohort is typically poor, because the product they downloaded is not the product they were sold.
- Platform policy exposure. Creatives that materially misrepresent the app risk store and ad-network policy scrutiny, especially as networks tighten creative-accuracy enforcement and user-reported "misleading ad" signals feed back into account standing.
- Brand erosion. Repeated bait-style framing trains an audience to distrust the brand, which compounds over time and quietly raises the cost of every future campaign.
None of this means off-product hooks are irrational — at sufficient volume and low enough CPI, even a leaky funnel can pencil out. But it does mean the tactic is a volume play, not a quality play, and it should be modeled as such. If you adopt it, instrument retention ruthlessly, segment the off-product cohort separately, and know your break-even before you scale. The advertisers who get burned are the ones who read the impression count as success without ever checking what happened on day 7.
9. Geography, seasonality, and why timing matters
Every figure in this report is US-specific, and that scoping is deliberate. Creative performance does not travel cleanly across borders. A puzzle hook that dominates the US feed may underperform in Japan or Germany, where creative conventions, localization expectations, and competitive density differ sharply. The single most common mistake in cross-market UA is assuming a winning US creative is a winning global creative; the data rarely supports it. Reading creative leaderboards country by country — rather than globally averaged — is the only way to see what actually wins in each market.
Seasonality is the second timing dimension, and the download chart shows it vividly. FOX One's +1,461% surge and Peacock TV's +168% climb are not steady-state growth; they are event-driven spikes tied to live programming windows. For game advertisers, the lesson is adjacent but real: install costs and competitive auction pressure move with the calendar. When streaming and shopping apps flood the same ad inventory during a seasonal peak, game UA gets more expensive. The advertisers who plan creative refreshes and budget around those windows — rather than reacting to them — protect their efficiency. Continuous monitoring is what turns these patterns from hindsight into foresight.
10. Cross-genre patterns: what the whole board reveals
Pulling the five genres together, four structural patterns define US game UA in mid-2026:
-
Reach is a casual phenomenon. The two highest-impression single creatives (match-3 at 191.2M, puzzle at 158.5M) each out-reach the top strategy, slots, and idle-RPG creatives combined. If your KPI is raw reach, casual mechanics with universal hooks are the structural winners.
-
Profitability hides in longevity. The most proven creatives — strategy ads live for 300–490 days — generate a fraction of casual's peak reach. Durable value and viral reach are different goals served by different creative strategies, and conflating them is how UA budgets get misallocated.
-
Format follows loop. Video is universal; playables appear only where the loop demos in seconds (puzzle, strategy); static is effectively retired from top-of-funnel. Your format choice should be dictated by whether your core loop is showable, not by what's fashionable.
-
Maturity shows in discipline. Mature categories (slots) run uniform, proven creatives at steady volume. Emerging categories (idle RPG) run fragmented, lower-reach experiments. Where a category sits on that maturity curve tells you how much room there is to win with a novel creative — and how hard the incumbents will be to dislodge.
11. What this means for UA, creative, and growth teams
Translating the data into action, by role:
For user-acquisition managers. Benchmark competitors by days live, not impressions. Build a watchlist of the longest-running creatives in your category — those are your rivals' proven winners, and they are the strongest starting point for your own creative testing. Track first-seen dates to detect when a competitor starts testing a new angle, often the earliest signal of a strategy shift you can act on before it scales.
For creative teams. Match your format to your loop. If your core mechanic demos cleanly in 15–30 seconds, invest in a playable; if it doesn't, put that budget into stronger video hooks instead. Study the run-length leaders in your genre for structural patterns — pacing, hook timing, reward framing — rather than copying surface aesthetics that won't transfer.
For growth and strategy leads. Read the organic charts and the paid charts together. The organic download/revenue data tells you where attention and money concentrate (AI, streaming, utilities); the paid-creative data tells you how games manufacture visibility in a market that won't hand it to them for free. The gap between those two pictures is exactly where game UA strategy lives.
For everyone. Set up continuous monitoring rather than one-time snapshots. Creative leaderboards shift daily as campaigns rotate; a static report is stale within a week. The teams that win are the ones watching the board in near-real-time and reacting to what survives. You can track competitor ad creatives on AdMapix and filter these leaderboards by your own genre, country, and named competitors.
12. Methodology & data notes
All figures in this report are third-party estimates from AdMapix, derived from observed ad placements and store-ranking signals across US mobile networks. They are not official, advertiser-reported numbers. Specifically:
- Impressions are estimated reach for the single highest-impression creative tracked per advertiser within each genre, US placements, as of June 26, 2026.
- Downloads and revenue are 30-day trailing estimates for the US market; revenue is expressed as relative index/trend rather than audited financials.
- Run-length ("days live") is measured from a creative's first-seen date through June 26, 2026.
- Rankings shift daily as campaigns rotate, budgets change, and new creatives enter testing.
Treat every number as directional market signal for competitive and creative strategy — not as a precise spend or revenue figure.
Frequently Asked Questions
What was the highest-impression US mobile game ad creative in mid-2026? A match-3 video creative with an estimated 191.2 million impressions, per AdMapix data as of June 26, 2026 — narrowly ahead of a Block Color Mania puzzle creative at 158.5 million.
Which apps top the US download chart in mid-2026? ChatGPT leads US 30-day downloads (~5.6M), followed by TikTok, Peacock TV, WhatsApp, and YouTube. The three largest AI assistants — ChatGPT, Claude, and Gemini — are all declining month over month, signaling a cooling of the early AI-adoption boom.
Why don't mobile games appear on the organic download or revenue charts? Game installs are spread across thousands of titles, none of which can match a single dominant utility or AI app on the organic chart. Games manufacture visibility through paid user acquisition instead, which is why ad-creative data is the most reliable lens into which games are scaling.
What's the best signal that a competitor's ad creative is working? Run-length. A creative that stays live for months — like the strategy ads running 300 to 490 days — is one the advertiser keeps paying to serve because it remains profitable. That's a stronger signal than a one-time impression spike.
Which ad format wins in 2026 mobile game UA? Video is the universal base layer across every genre. Playables add lift specifically in categories where the core loop demos in seconds (puzzle, strategy). Static image creatives have largely disappeared from top-of-funnel in competitive game categories.
Want the live, daily-updated version of these leaderboards — filtered by your genre, country, and named competitors, with the actual video creatives behind every number? Explore competitor ad intelligence on AdMapix →
See what competitors are really running
Search 6M+ ad creatives, landing pages, and weekly spend across 200+ countries. No credit card, no commitment.
Related Articles
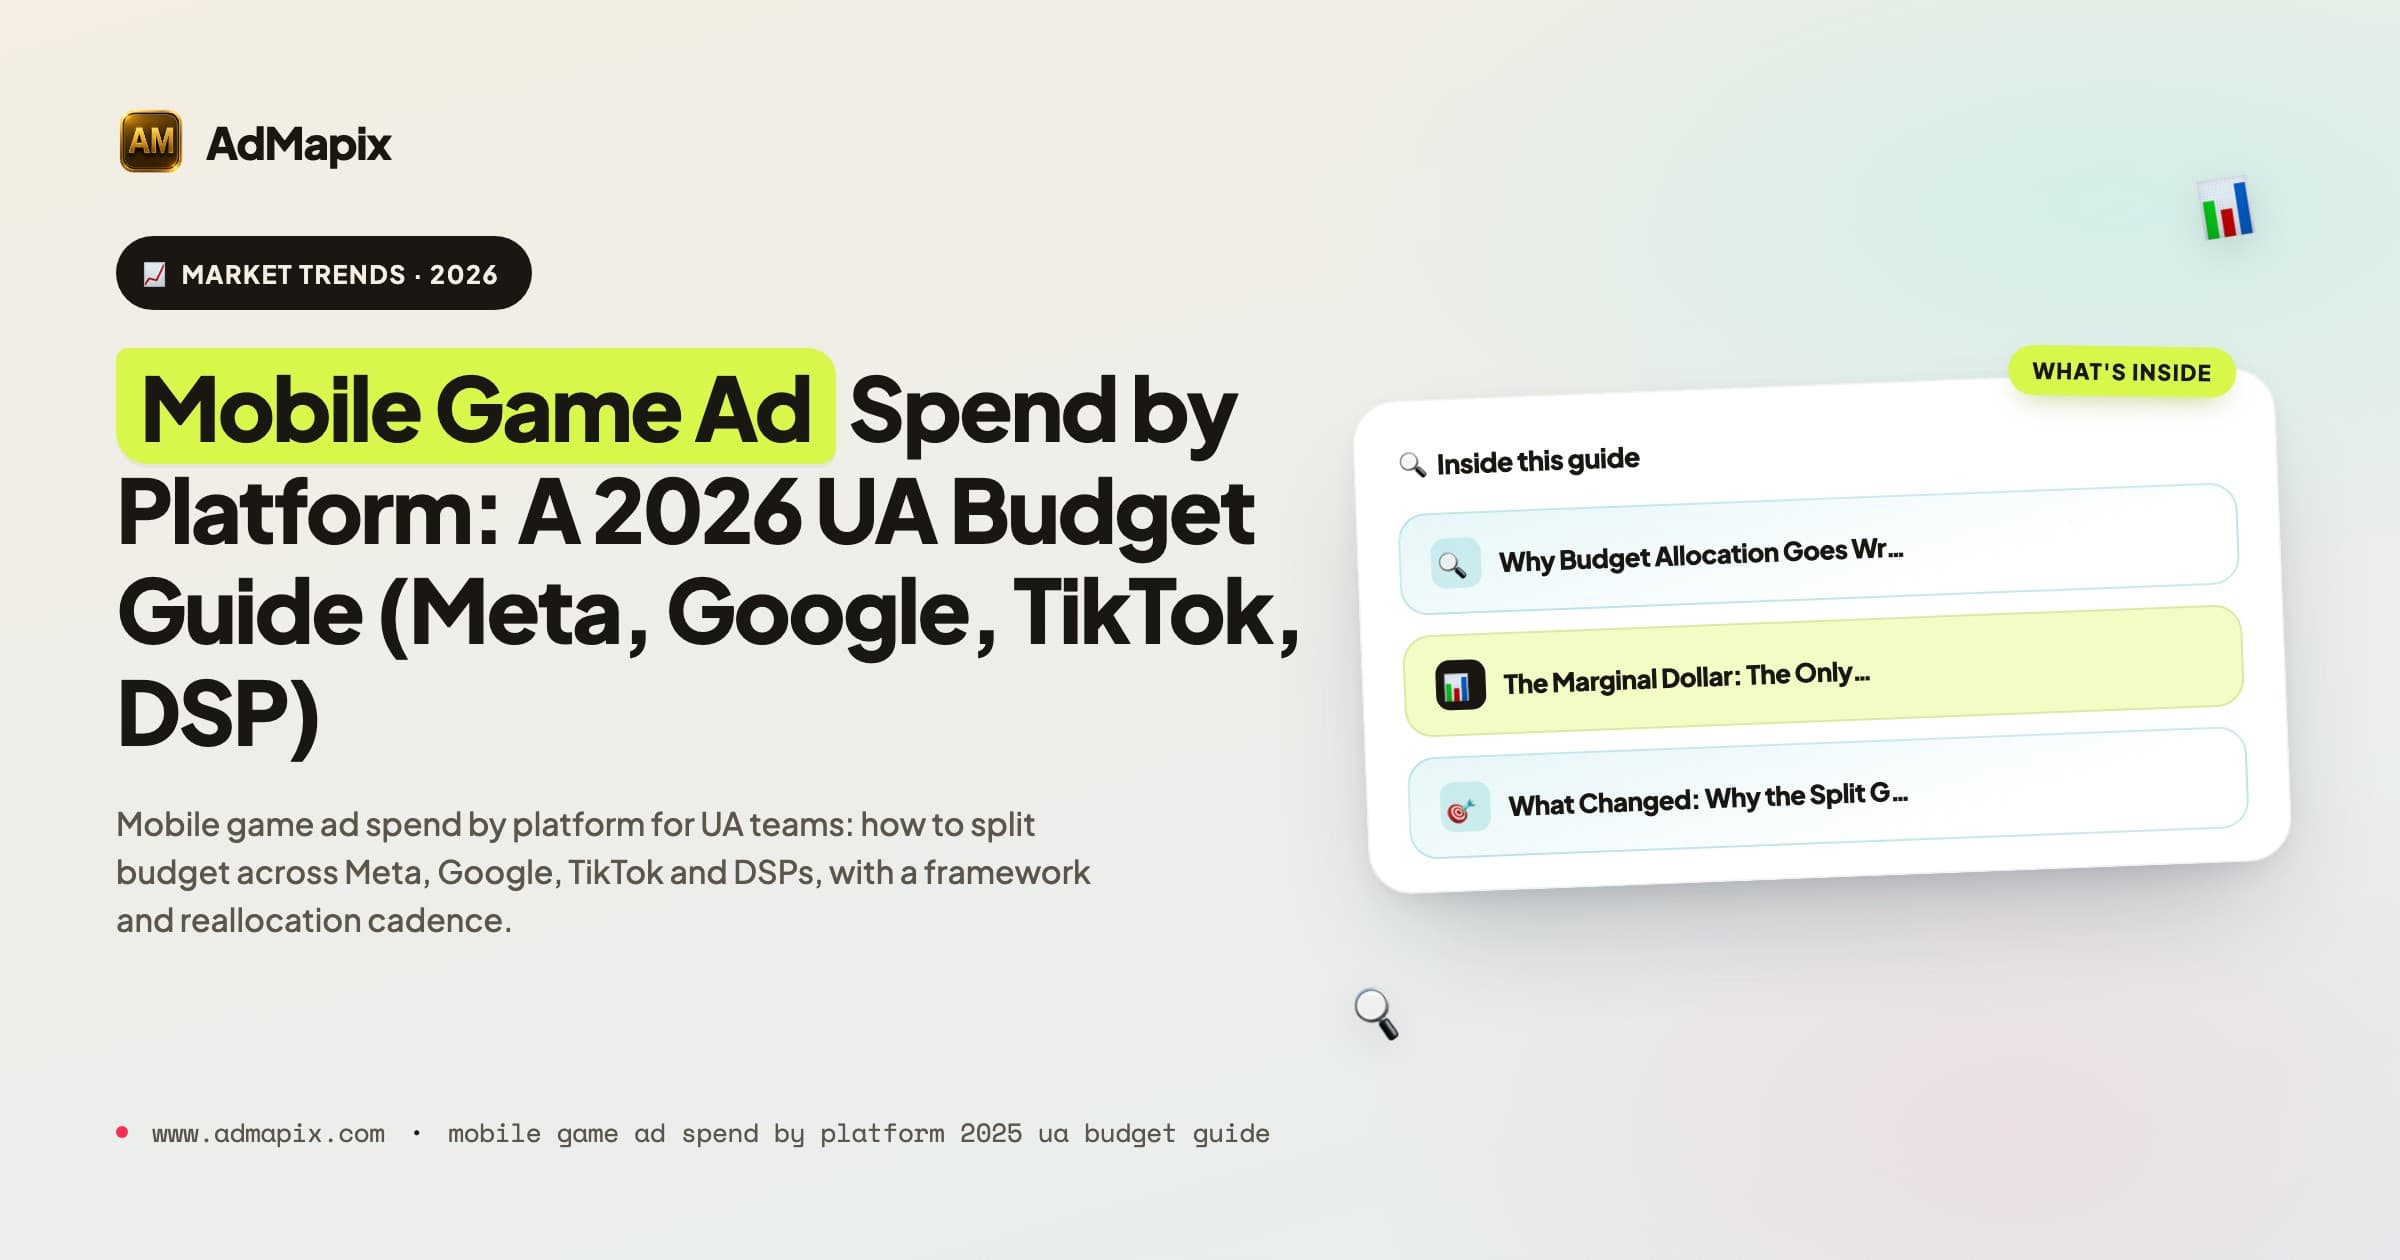
Mobile Game Ad Spend by Platform: A 2026 UA Budget Guide (Meta, Google, TikTok, DSP)
A practitioner's guide to mobile game ad spend by platform: how UA budgets really split across Meta, Google, TikTok, and DSPs; the mechanism behind each platform's role; how privacy-era measurement, creative systems, and genre fit change the split; a budget-allocation framework; a reallocation cadence; and the honest limits of what competitor spend data can and cannot tell you.

2026 H2 Ad Market Outlook: Platform Shifts, AI Buying, and Budget Strategy
A compressed, decision-ready H2 2026 advertising outlook: platform share shifts, AI buying defaults, privacy pressure, format economics, regional budget moves, and a Q4 operating plan.
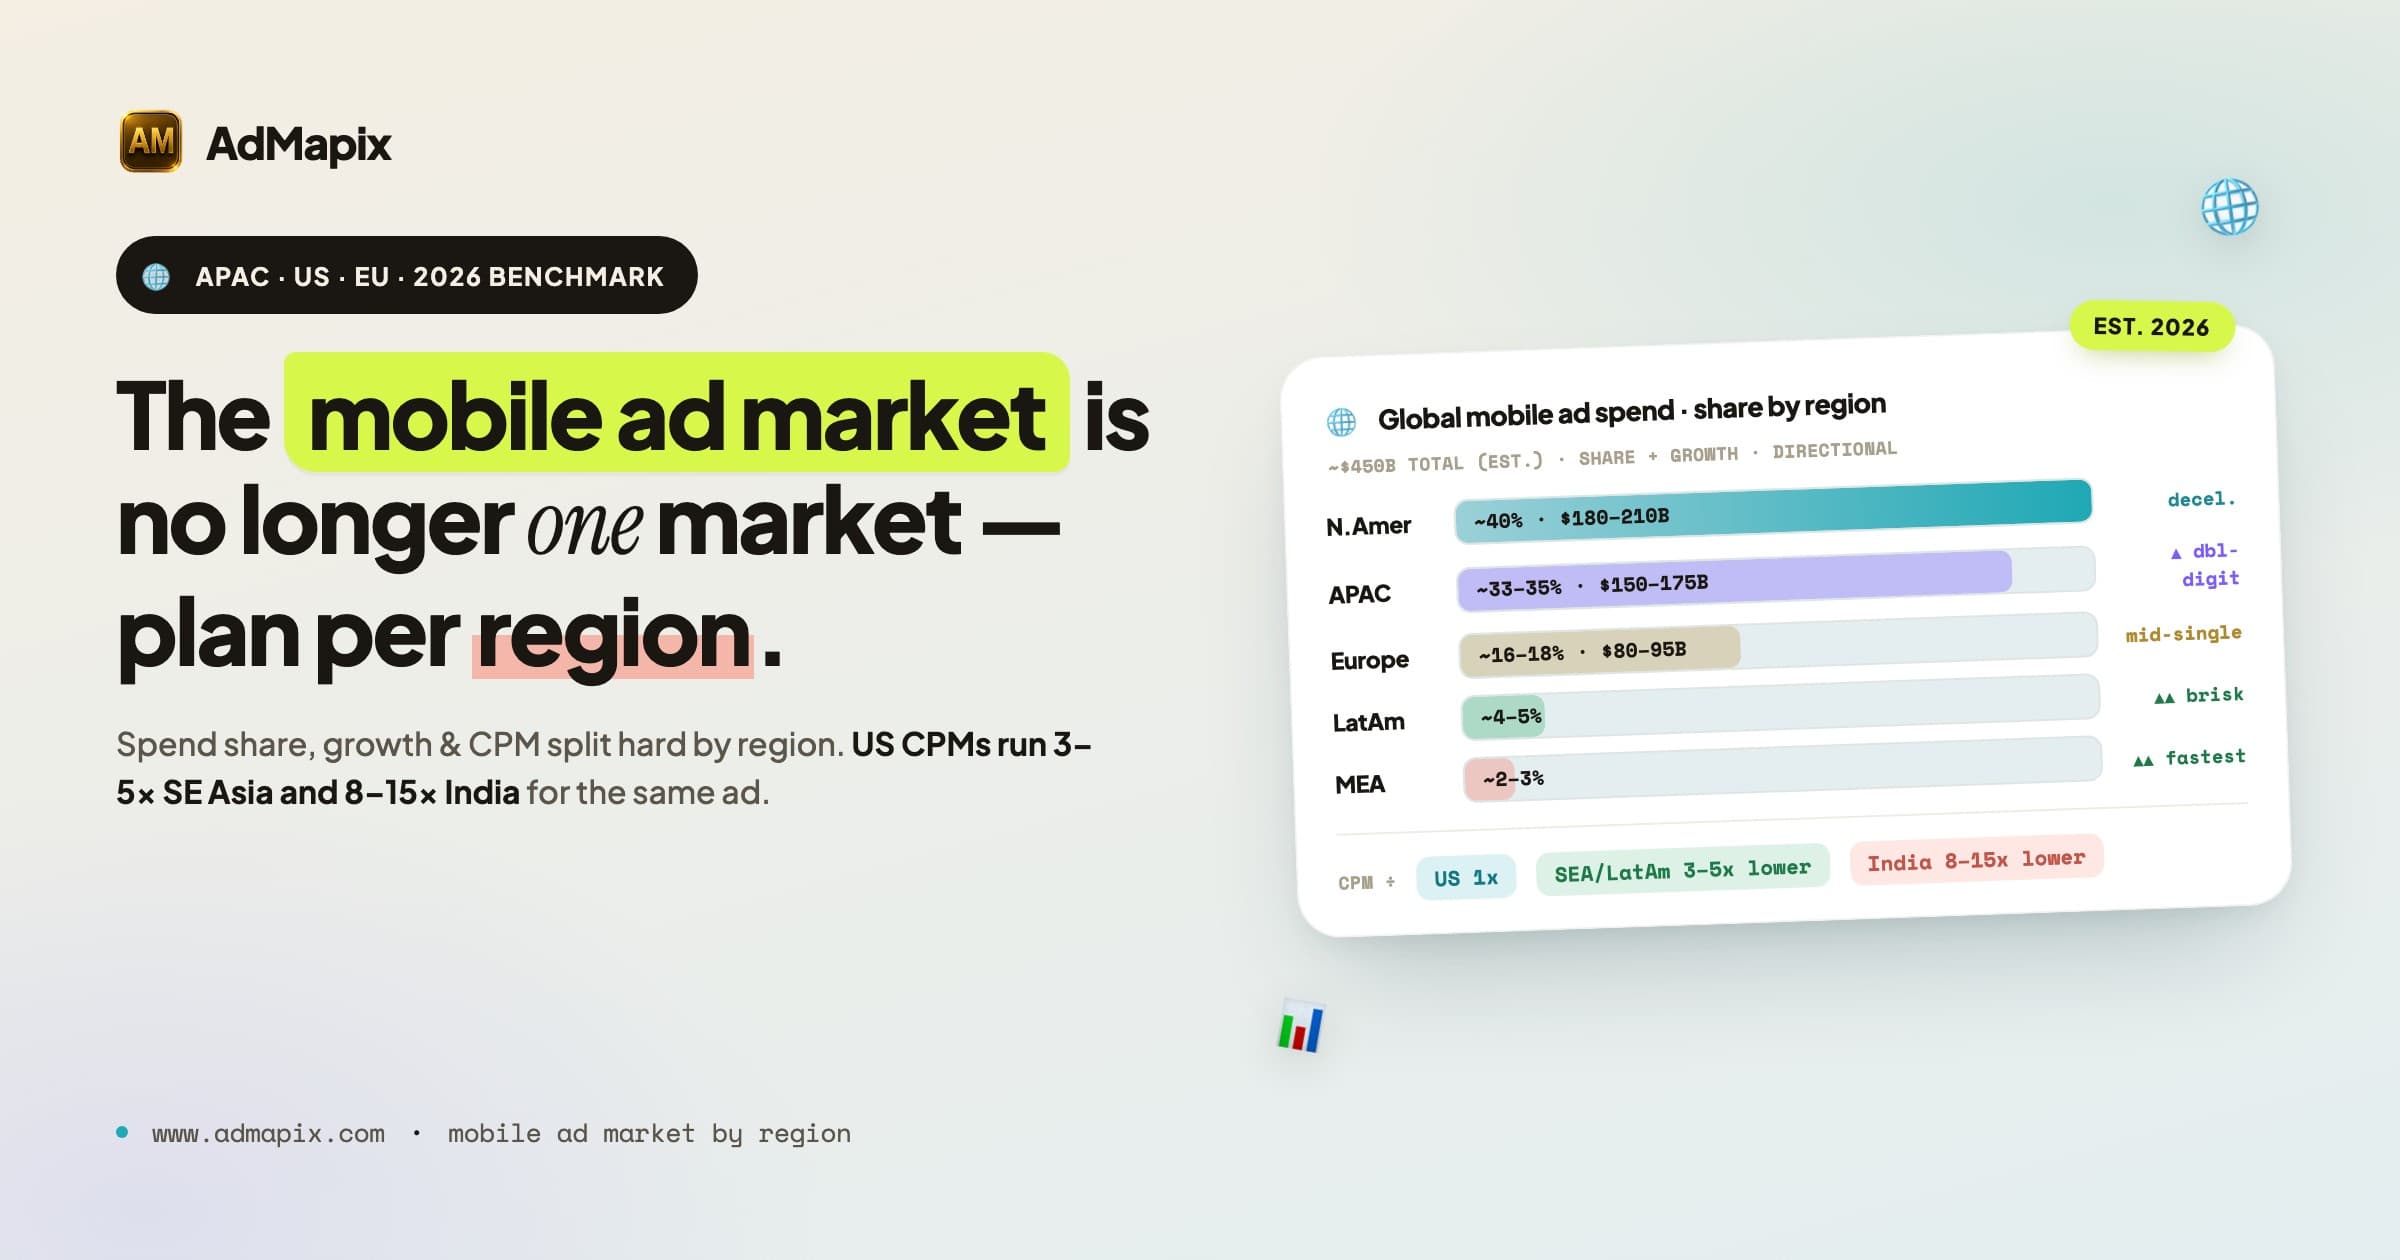
Mobile Ad Market by Region 2026: APAC vs US vs EU Spending, Formats, and Trends
A data-driven breakdown of the 2026 mobile ad market across North America, Europe, APAC, Latin America, and the Middle East & Africa — covering regional ad spend, format dominance, CPM economics, platform mix, and the regulatory shifts that now force separate media plans per region instead of one global strategy.