
State of Mobile Advertising H2 2026: 16M Creatives a Month, a 7-Billion-Impression Ad, and the Verticals Buying Growth
Index data from H1 2026: monthly creative volume grew 18% and stepped up sharply in May, e-commerce giants now run creative libraries 70x larger than US incumbents, playable ads remain an 81% games monopoly, and the US download chart is being reshaped by World Cup season. The benchmarks advertisers need for H2 planning.
Mobile advertising entered H2 2026 producing more creative than at any point in history: the AdMapix index observed 16.2 million distinct image and video creatives active in June alone, up 18% from January's 13.8 million, with a decisive step-change in May. Behind that curve sit three facts most H2 media plans have not priced in: e-commerce overtook every other vertical in the last 30 days, a single MONOPOLY GO! video accumulated 7.05 billion modeled impressions in two months, and the best-performing game creative in the US is now more than 14 months old. This report lays out the H1 2026 numbers — creative volume, vertical shares, country benchmarks, advertiser leaderboards, and the download chart — so you can calibrate your H2 plan against the market instead of against your own history.
What's inside: monthly creative-production data for H1 2026, vertical and country benchmarks, creative-library sizes for the advertisers that define each category, the playable-format landscape, the current US download chart with growth rates, and what all of it implies for budgeting, creative production, and competitive research in H2.
TL;DR — Executive Summary
- Creative volume set a new baseline in H1 2026. Active image/video creatives grew from 13.75M (January) to 16.23M (June), an 18% increase, with May marking the step-change at +23.8% month over month. Over the most recent 30-day window the index observed 32.6M active image/video creatives and 86.9M active creative combinations.
- Entertainment led H1, but e-commerce owns the summer. Across January–June, entertainment was the largest vertical (16.9M creatives), ahead of games (13.0M) and e-commerce (9.1M). In the last 30 days, e-commerce jumped to #1 (8.85M active creatives) — mid-year sales season compressed nearly a half-year of e-commerce creative volume into a single month.
- The creative gap between cross-border challengers and US incumbents is roughly 70:1. Temu's tracked library stands at 8.13M unique creatives and SHEIN's at 4.42M, versus 154K for Walmart and 117K for Amazon Shopping.
- Games run the opposite playbook: fewer creatives, longer lives. Royal Match's top US creative has been running since May 2025 — over 440 days — and still leads with 50.5M modeled impressions. Playables remain a games monopoly: 81% of the 305K playable ads active in the last 30 days are game ads.
- The US download chart is being reshaped by two forces: World Cup season (Kalshi +36%, the fastest riser in the top 10) and paid creative blitzes (puzzle newcomer Meowdoku cracked the top 10 behind a single 296M-impression video). Meanwhile ChatGPT, still #2 by downloads, runs one of the smallest ad libraries we track — 1,776 creatives.
- "Impressions per creative" cleanly separates the market's three operating models. Industrial breadth (Temu: 348K per creative across 8.13M creatives), disciplined performance scaling (games: 3–17M), and brand-media weight (ChatGPT: 85M — the heaviest in this report). Benchmark a competitor's model before copying its tactics.
Creative Volume: H1 2026 Set a New Baseline
The clearest macro signal in our data is production velocity. Month by month, here is the number of distinct image/video creatives the AdMapix index observed active worldwide:
| Month (2026) | Active image/video creatives | Newly observed that month |
|---|---|---|
| January | 13.75M | 8.33M |
| February | 12.06M | 6.85M |
| March | 13.97M | 8.77M |
| April | 13.56M | 8.28M |
| May | 16.79M | 11.11M |
| June | 16.23M | 10.85M |
Two observations matter for planning:
First, the step-change happened in May, not gradually. Volume was flat-to-choppy from January through April (12–14M), then jumped 23.8% in May and held in June. Whatever mix of AI-assisted production, seasonal ramp, and new-entrant spend drove it, the market's "normal" creative output is now ~16M+ per month — roughly one-fifth higher than the level your Q1 competitive benchmarks were built on.
Second, roughly two-thirds of each month's active creatives are new that month. In June, 10.85M of the 16.23M active creatives were first observed in June. Creative shelf life is short and getting shorter; a competitor snapshot from eight weeks ago describes a library that has already been mostly replaced.
Over the most recent 30-day window (June 23 – July 23), the index observed 32.6M active image/video creatives and 86.9M active creative combinations — the rolling window runs hotter than calendar months because it captures the mid-year sales surge described next. (The two figures use different counting units and should not be summed; see Methodology.)
The Vertical Map: Entertainment Led H1, E-commerce Owns the Summer
Across the full first half, entertainment — streaming, short drama, social and media apps — was mobile advertising's largest creative producer:
| Vertical | Active image/video creatives, H1 2026 (Jan 1 – Jun 30) |
|---|---|
| Entertainment | 16.95M |
| Games | 12.99M |
| E-commerce | 9.07M |
| Tools | 6.54M |
| Life services | 3.58M |
| Finance | 2.25M |
| Business | 1.21M |
| Education | 0.66M |
| Health & fitness | 0.55M |
But the last 30 days tell a different story — and it is the one that matters for Q3 budgets:
| Vertical | Active creatives, last 30 days | Note |
|---|---|---|
| E-commerce | 8.85M | #1 — nearly matching its entire H1 total (9.07M) |
| Entertainment | 6.99M | 41% of its H1 volume |
| Games | 6.05M | 47% of its H1 volume |
| Tools | 2.09M | — |
| Life services | 1.72M | — |
| Finance | 0.81M | — |
E-commerce compressed almost a half-year of creative output into one month. The timing maps cleanly onto mid-year sales season — Prime Day and the competing mid-July sales events it now anchors across every major retailer. For anyone advertising in or against the e-commerce vertical, July auction pressure is not an anomaly to wait out; it is the new seasonal structure, and Q4 will be bigger.
Entertainment's H1 lead deserves a note of its own. At 16.95M creatives it out-produced even games — a position streaming services, short-drama apps, and social platforms built through the same industrial-volume methods e-commerce pioneered: episodic content chopped into thousands of hook variants, tested continuously. The vertical's 41% thirty-day share suggests its creatives also turn over fast, just not at e-commerce's seasonal extremes. Games, by contrast, pair the second-largest volume (12.99M) with the discipline documented later in this report — which is why per-creative delivery in games runs an order of magnitude heavier than in the volume verticals.
Where the Ads Run: Country Benchmarks
Creative volume by market over the last 30 days gives a working map of where competition is heaviest:
| Market | Active image/video creatives (30 days) |
|---|---|
| United States | 4.81M |
| Japan | 2.28M |
| Germany | 2.14M |
| Brazil | 1.90M |
| United Kingdom | 1.88M |
| India | 1.55M |
| France | 1.53M |
| Australia | 1.47M |
| South Korea | 1.40M |
| Mexico | 1.39M |
| Indonesia | 1.28M |
| Philippines | 1.23M |
| Thailand | 0.94M |
| Saudi Arabia | 0.89M |
| Vietnam | 0.88M |
The US runs at more than twice the creative volume of any other single market — but the more useful reading is the middle of the table. Japan and Germany at ~2.2M and Brazil at 1.9M are within striking distance of each other. And treat Southeast Asia as a bloc: Indonesia, the Philippines, Thailand, and Vietnam together carry 4.33M active creatives — 90% of the US total. These are real, contested markets rather than cheap-reach afterthoughts; Saudi Arabia alone, at 0.89M, now runs close to Vietnam. If your H2 plan treats "international" as one line item, this table is the argument for splitting it.
The Arms Race in E-commerce: Temu, SHEIN, and the 70:1 Creative Gap
Vertical totals hide the most extreme fact in mobile advertising: how concentrated e-commerce creative production is among cross-border challengers. Cumulative unique creatives tracked by the index, per advertiser:
| Advertiser | Unique creatives tracked | Modeled impressions (cumulative) | Impressions per creative |
|---|---|---|---|
| Temu | 8.13M | 2.83 trillion | 348K |
| SHEIN | 4.42M | 3.12 trillion | 707K |
| Coupang | 1.65M | 24.6 billion | 15K |
| AliExpress | 885K | 488 billion | 552K |
| Walmart | 154K | 857 billion | 5.6M |
| Amazon Shopping | 117K | 803 billion | 6.8M |
| eBay | 96K | 10.1 billion | 104K |
Temu's tracked library is roughly 70 times the size of Amazon Shopping's. But read the last column before concluding the incumbents are absent: Walmart and Amazon deliver 5.6M and 6.8M modeled impressions per creative — sixteen to twenty times Temu's 348K. These are not two levels of effort; they are two different industrial models. The challengers run breadth (millions of lightly-delivered variants, testing as the product), while the incumbents run weight (small, heavily-scaled libraries behind broad brand campaigns). Korea's Coupang is a third pattern — challenger-scale breadth (1.65M creatives) at feather-light delivery, blanketing its home market with micro-targeted variants.
What that industrial process looks like on the ground is often not glossy brand work but high-volume UGC and affiliate-style video:
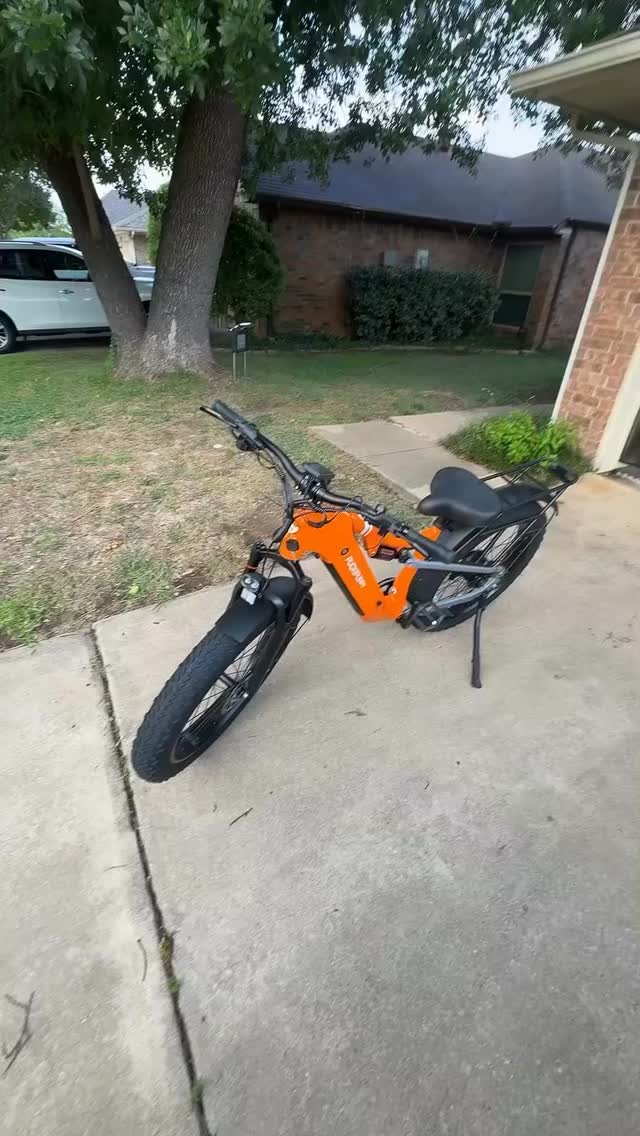
Temu, US — creator-style e-bike video with an in-app discount code, 57s, 415K modeled impressions in the recent US window. First seen 2026-04-14.

SHEIN, US — 14-second fashion cut that accumulated 74.4M modeled impressions since first seen on 2026-04-21. Short, product-dense, and disposable by design.
The takeaway for merchants competing anywhere near this vertical: you will not out-produce this machine, so you must out-target it — narrower audiences, deeper offers, and creative angles the volume players' pipelines cannot personalize.
Games: Fewer Creatives, Longer Lives
Game advertisers run the exact opposite playbook. Their tracked libraries are hundreds of times smaller than e-commerce's:
| Game advertiser | Unique creatives tracked | Modeled impressions (cumulative) | Impressions per creative |
|---|---|---|---|
| Royal Match (Dream Games) | 72.5K | 427B | 5.9M |
| Whiteout Survival (Century Games) | 54.5K | 153B | 2.8M |
| MONOPOLY GO! (Scopely) | 46.6K | 768B | 16.5M |
| Coin Master (Moon Active) | 34.4K | 105B | 3.1M |
| Gardenscapes (Playrix) | 34.0K | 6.6B | 194K |
Yet those smaller libraries carry some of the largest individual creatives in all of mobile advertising. The single most instructive example in our US data:
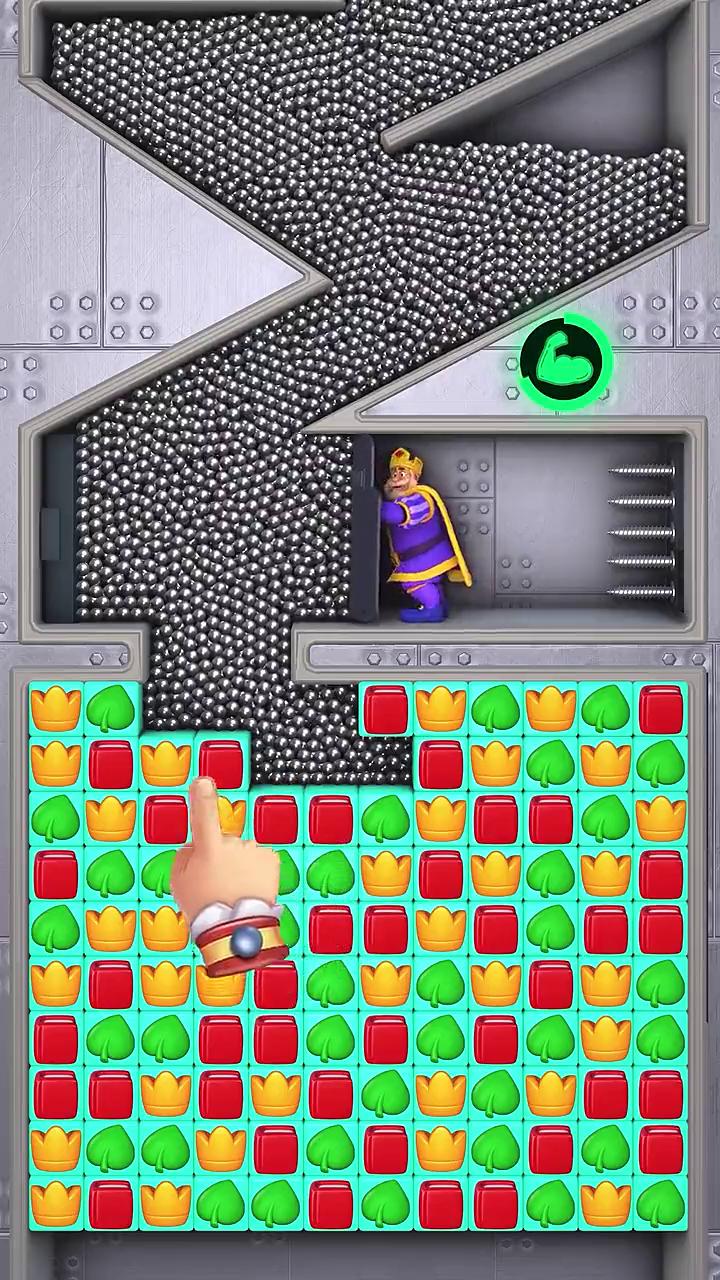
Royal Match, US — 60-second gameplay video first seen 2025-05-09. More than 440 days later it is still the game's top US creative with 50.5M modeled impressions and an attached playable.
A 14-month-old creative leading a top-grossing game's US mix is not nostalgia — it is unit economics. When a creative clears the bar, games scale it for as long as it converts, which means days-active is a stronger signal than impressions when you are mining competitor libraries for what works: a moderate-impression ad that has run for 300 days has survived hundreds of kill decisions.
The other end of the spectrum is the blitz. Scopely's MONOPOLY GO! shows what maximum-force scaling looks like:
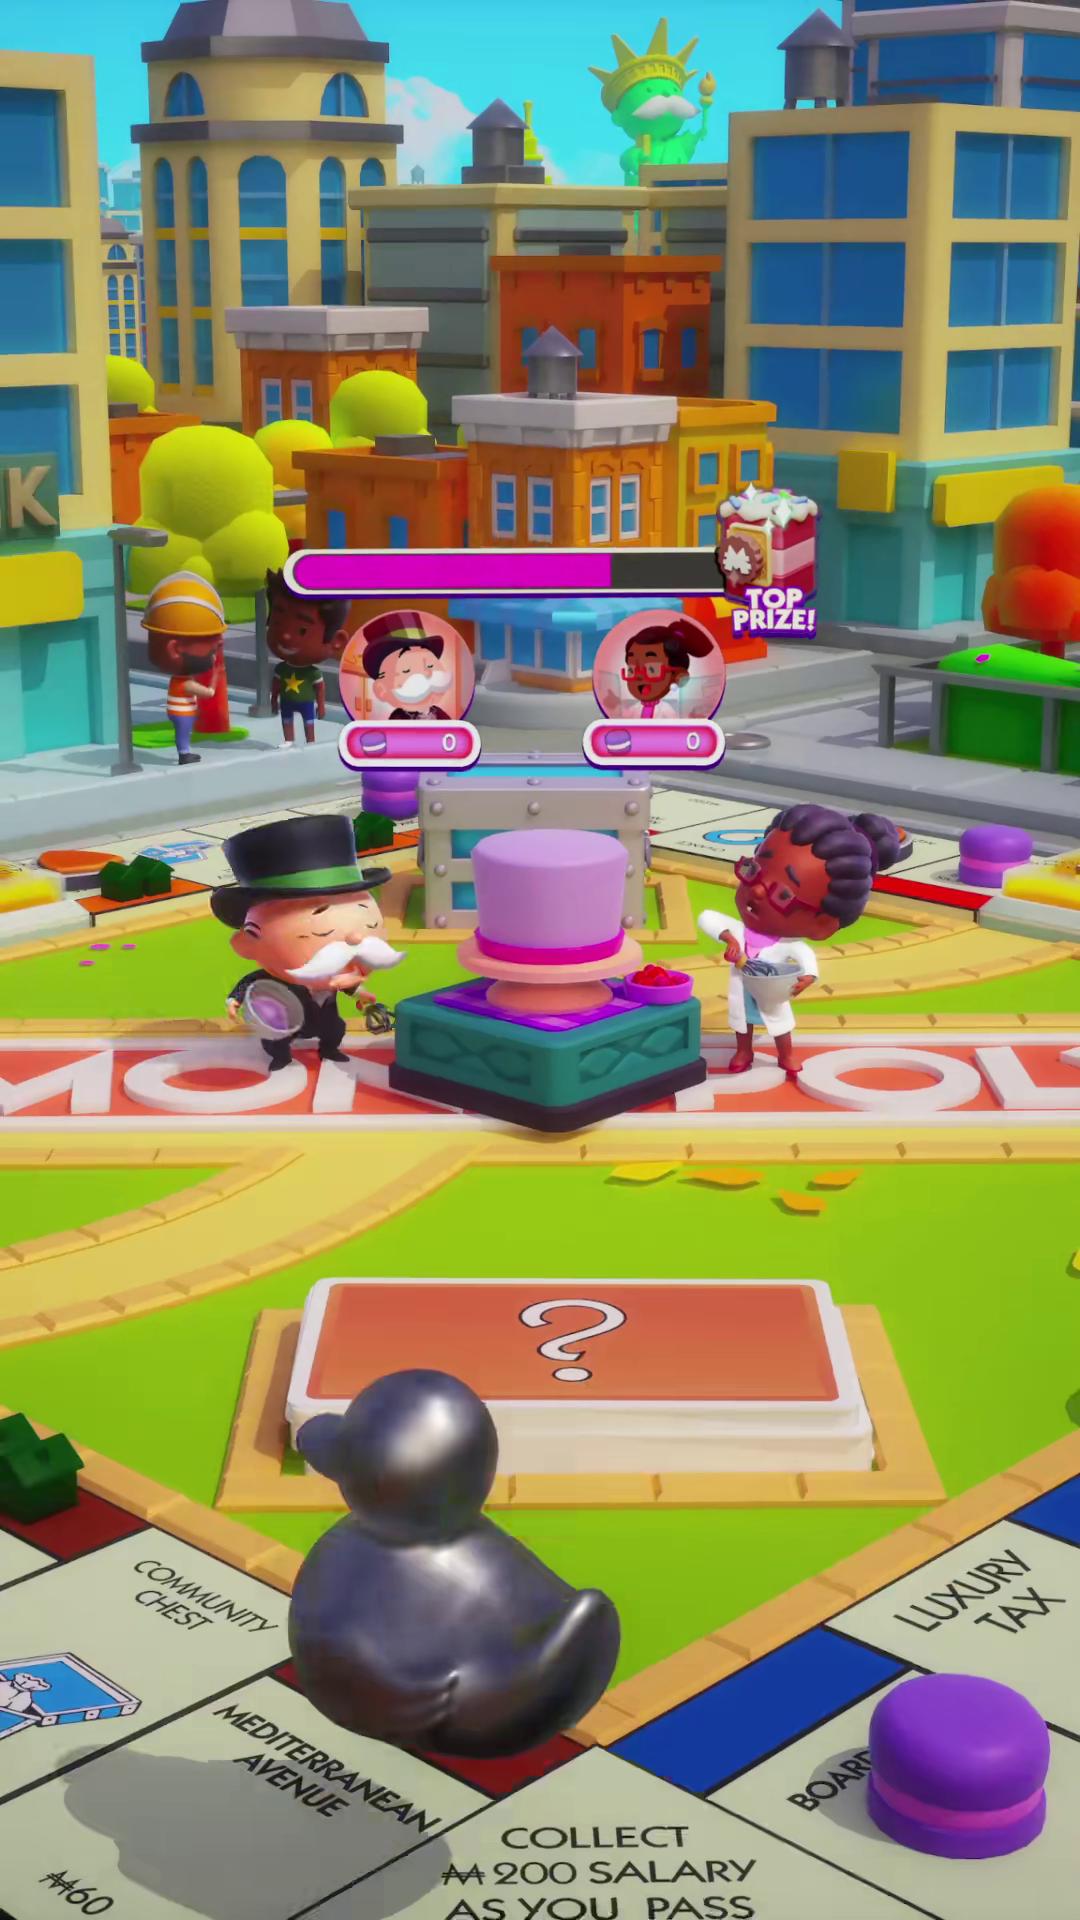
MONOPOLY GO!, US — a 28-second video first seen 2026-05-23 that accumulated 7.05 billion modeled impressions in two months: the single largest creative in this report's dataset.
One ad, 7.05 billion modeled impressions, two months. Both strategies — the 440-day marathon and the 7-billion blitz — come from the same discipline: relentless testing at moderate volume, then total commitment to proven winners.
Delivery Weight: The One Metric That Separates the Models
Divide any advertiser's cumulative modeled impressions by its unique creatives and you get delivery weight — how hard the average creative is scaled. Across every advertiser in this report, the metric sorts the market into clean strategic archetypes:
| Advertiser | Creatives | Impressions per creative | Model |
|---|---|---|---|
| ChatGPT | 1.8K | 85M | Product-demand moat, minimal creative ops |
| Duolingo | 13.1K | 71M | Brand-creative weight |
| Google Gemini | 3.1K | 64M | Brand-creative weight |
| MONOPOLY GO! | 46.6K | 16.5M | Disciplined scaling |
| Amazon Shopping | 117K | 6.8M | Incumbent weight |
| Royal Match | 72.5K | 5.9M | Disciplined scaling |
| Walmart | 154K | 5.6M | Incumbent weight |
| TikTok (self-promotion) | 2.99M | 1.6M | Hybrid: breadth and weight |
| SHEIN | 4.42M | 707K | Industrial breadth |
| Temu | 8.13M | 348K | Industrial breadth |
| Coupang | 1.65M | 15K | Domestic micro-targeting |
Three bands emerge. Above ~50M impressions per creative sit apps whose ads are essentially brand media — few creatives, each pushed to enormous reach (ChatGPT, Duolingo, Gemini). The 1M–20M band is the performance-marketing mainstream: games and US retail incumbents scaling proven winners hard. Below ~1M is industrial testing, where the creative itself is the experiment and most variants die young (Temu, SHEIN, Coupang).
The practical use: when you benchmark a competitor, compute their delivery weight before copying their tactics. A 70K-creative library at 6M weight (Royal Match) and a 1.65M-creative library at 15K weight (Coupang) demand completely different production budgets, testing infrastructure, and team shapes — mistaking one model for the other is how creative teams burn out or underspend.
Creative Churn: How Fast Each Vertical Replaces Its Ads
Comparing each vertical's last-30-day active volume against its full-H1 volume yields a churn fingerprint — the share of a vertical's half-year creative footprint that was live in just the most recent month:
| Vertical | H1 total | Last 30 days | 30-day share of H1 |
|---|---|---|---|
| E-commerce | 9.07M | 8.85M | 98% |
| Education | 0.66M | 0.39M | 60% |
| Health & fitness | 0.55M | 0.30M | 55% |
| Life services | 3.58M | 1.72M | 48% |
| Games | 12.99M | 6.05M | 47% |
| Entertainment | 16.95M | 6.99M | 41% |
| Finance | 2.25M | 0.81M | 36% |
| Business | 1.21M | 0.43M | 36% |
| Tools | 6.54M | 2.09M | 32% |
E-commerce's 98% is the seasonal surge discussed above — its entire H1 footprint essentially reproduced itself in one month. The more durable signal is the bottom half: finance, business, and tools creatives live the longest (roughly a third of H1 volume still active), consistent with compliance-reviewed creative pipelines and longer consideration cycles. If you operate in a low-churn vertical, competitor research stays valid for months; in e-commerce, a two-week-old snapshot is already history.
The Playable Format Is Still a Games Monopoly
Playable ads keep being predicted to break out of gaming. The data says they have not:
| Playable ads, last 30 days | Count | Share |
|---|---|---|
| All verticals | 305K | 100% |
| Games | 248K | 81% |
| Tools | 11.0K | 3.6% |
| E-commerce | 542 | 0.2% |
E-commerce — the vertical producing 8.85M image/video creatives in the same window — ran barely five hundred playables. For game advertisers this means the playable auction remains a specialists' arena where the craft bar is set by other games. For non-game advertisers it cuts both ways: the format is unproven outside gaming (little competitive infrastructure, unclear benchmarks), but it is also an almost uncontested creative surface if your product has anything worth letting a user try — configurators, quizzes, calculators, try-ons.
The US Download Chart: What Growth Looks Like Right Now
Estimated US downloads for the latest tracked period, with period-over-period growth:
| Rank | App | Developer | Est. downloads | Growth |
|---|---|---|---|---|
| 1 | TikTok | ByteDance | 6.02M | +3.9% |
| 2 | ChatGPT | OpenAI | 5.12M | −33.2% |
| 3 | Kalshi: Trade the World Cup | KalshiEX | 3.69M | +36.1% |
| 4 | Peacock TV | Peacock TV LLC | 3.55M | −20.0% |
| 5 | CapCut | ByteDance | 2.97M | −18.4% |
| 6 | Netflix Game Controller | Netflix | 2.65M | +20.2% |
| 7 | YouTube | 2.63M | −24.3% | |
| 8 | FOX One | Fox Digital | 2.60M | −12.9% |
| 9 | Meta | 2.53M | −30.4% | |
| 10 | Meowdoku! | Oakever Games | 2.40M | +6.6% |
| 11 | Meta | 2.32M | −18.1% | |
| 12 | Meta AI | Meta | 2.07M | +4.6% |
Note the pattern in the growth column before the storylines: seven of the twelve are shrinking, most by 15–35%. The post-holiday, post-World-Cup-group-stage normalization is broad — which makes the four growers (TikTok, Kalshi, Netflix Game Controller, Meowdoku, plus Meta AI at #12) genuinely informative rather than noise. Meta AI's presence deserves its own line: a standalone AI assistant app from Meta growing +4.6% into the top 12 confirms that the assistant distribution war has moved to the app stores, and Meta — unlike OpenAI — has both the ad inventory and the incentive to spend heavily on it.
Three storylines stand out.
World Cup season is repricing the chart. The 2026 FIFA World Cup — hosted across the US, Canada, and Mexico through mid-July (fifa.com) — put an event-prediction app in the US top 3: Kalshi, growing +36.1%, the fastest riser in the top 10. Sports-adjacent media (FOX One, Peacock) holds four of the top 10 slots. Advertisers in betting-adjacent, streaming, and sports categories are living through a compressed super-cycle; everyone else is paying elevated auction prices for the same eyeballs. The creative fallout spreads well beyond official partners:

World Cup Block, US — a football-themed puzzle creative first seen 2026-04-29, riding tournament attention to 27.8M modeled impressions.
A paid creative blitz can still buy a chart position. Meowdoku!, a cat-themed sudoku game from Oakever Games, sits at #10 nationally — powered by creative volume, including a single 55-second video with 295.8M modeled impressions since May 21:
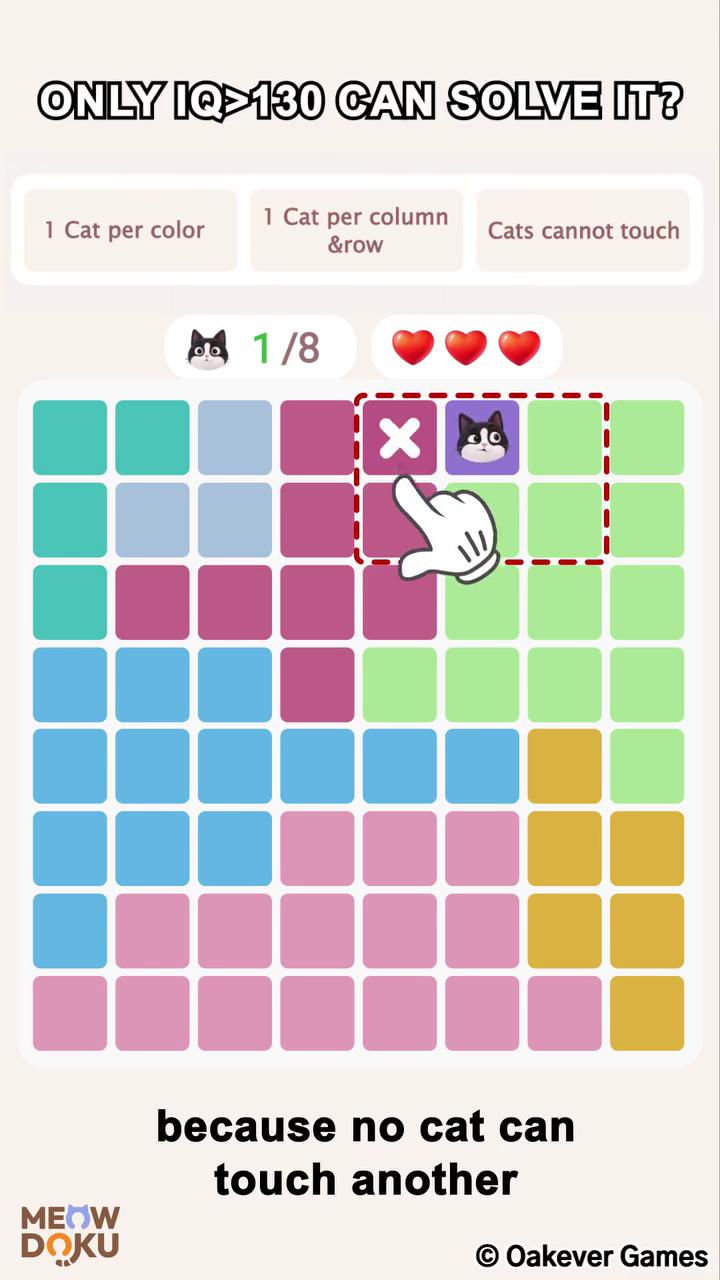
Meowdoku!, US — 55s gameplay video first seen 2026-05-21, 295.8M modeled impressions in two months. A textbook paid-blitz path into the top 10.
Streaming's bundling war has gone mobile. Peacock's downloads (−20% after its surge), Netflix shipping a dedicated Game Controller app growing +20%, and FOX One's launch all mark the streaming bundle fight moving onto the app stores — with the attendant ad spend:

Peacock TV, US — 15-second promo first seen 2026-06-09, 3.8M modeled impressions, part of the streaming bundle war's mobile front.
ByteDance: Both the Prize and the Player
One company sits on both sides of the market. TikTok is the most-downloaded app in the US (+3.9% while most of the top 10 declines) — and simultaneously one of the heaviest advertisers we track: 2.99 million unique creatives promoting TikTok itself, carrying 4.65 trillion modeled impressions — the largest single-advertiser impression pool in this report, ahead of even SHEIN's 3.12 trillion. Separate libraries run for CapCut (9.8K creatives) and Lemon8 (19.0K). Uniquely, ByteDance combines both industrial models at once: challenger-grade breadth (about 1.6M impressions per creative across three million creatives) at incumbent-grade total reach.

TikTok Lite, US — 29-second ad first seen 2025-12-05, 8.3M modeled impressions. ByteDance advertises its own family at e-commerce-platform scale.
The strategic read: ByteDance treats user acquisition as a permanent industrial function, not a launch phase. Its 2.99M-creative self-promotion library is larger than every game advertiser's library in this report combined, times ten. When the #1 app by downloads is also a top-tier ad buyer, "organic growth" at the top of the app economy is largely a myth — which reframes what everyone else should expect paid acquisition to do.
AI Apps Advertise Less Than You Think
The counter-intuitive entry in our advertiser data is the AI category. Cumulative creatives tracked:
| App | Unique creatives tracked | Modeled impressions | Impressions per creative |
|---|---|---|---|
| Canva | 14.7K | 23.1B | 1.6M |
| Duolingo | 13.1K | 933B | 71M |
| Spotify | 9.7K | 103B | 10.6M |
| Telegram | 6.1K | 10.4B | 1.7M |
| Google Gemini | 3.1K | 198B | 64M |
| ChatGPT | 1.8K | 151B | 85M |
ChatGPT is the #2 most-downloaded app in the US with the smallest paid-creative library in this table — 1,776 creatives, versus 8.13M for Temu. But note the delivery weight: each of those creatives averages 85M modeled impressions, the heaviest scaling of any advertiser in this report. OpenAI barely runs a creative operation, yet what it does run, it runs as mass-reach brand media. Duolingo and Gemini follow the same pattern at 71M and 64M per creative. The AI-era acquisition playbook visible in this data is not "no ads" — it is a handful of creatives treated like TV spots, layered on top of category demand that does the real work. ChatGPT's US ads are minimal in every sense:
ChatGPT, US — a 10-second minimal creative first seen 2025-04-22, 2.7M modeled impressions. The #2 app by downloads barely buys ads at all.
Two readings coexist. Bullish for AI apps: category demand is still so strong that distribution comes free, and the −33% download decline at ChatGPT is normalization from an extraordinary base, not lost ground to a paid competitor. Cautionary for everyone else: this is what a true product-demand moat looks like in the data, and if your app needs 50K creatives to grow while a competitor grows on 1.8K, the difference is not your media buying.
What the Winning Creatives Share: Notes From the Sample
Beyond the aggregates, the highest-delivery creatives in our US sample show recurring craft patterns worth stealing:
Duration tracks intent, not attention spans. The top creatives in this report run 10 seconds (ChatGPT), 14s (SHEIN), 28s (MONOPOLY GO!), 55s (Meowdoku), and 60s (Royal Match) — and the longest formats belong to the most performance-driven buyers. Games hold users for a full minute of gameplay proof; fashion needs 14 seconds of product density; a brand with existing demand needs 10. The "everything must be 6 seconds" era is over wherever the ad has to demonstrate rather than remind.
The affiliate-code UGC format has become e-commerce infrastructure. Both high-delivery Temu creatives in our sample are creator-style videos anchored on personal discount codes ("search code dzj5678 on the Temu App") — turning paid media, influencer attribution, and promo mechanics into a single unit. This format is cheap to produce at industrial volume, which is precisely why the breadth players standardized on it.
Winners ship with a playable attached. Royal Match's 440-day champion is not just a video: the creative unit carries an attached playable and two landing variants. The marathon creatives are rarely a single asset — they are small bundles that give the auction multiple ways to convert the same interest.
Event-jacking spreads far beyond rights holders. The World Cup creative wave in our data comes mostly from apps with no official connection to the tournament — a block-puzzle game wrapped in football imagery collected 27.8M impressions on borrowed attention. Seasonal moments reprice everyone's auctions, not just sponsors'.
Five Takeaways for H2 Planning
- Re-baseline your competitive volume assumptions upward by ~20%. The market's monthly creative output stepped up in May and held. Benchmarks built on Q1 data understate what "normal" competition now produces.
- Plan e-commerce seasonality as structure, not spikes. E-commerce's last-30-day volume (8.85M) nearly equals its entire H1 total. If July looks like this, budget Q4 auctions accordingly — and if you are not in e-commerce, schedule around its surges.
- Mine competitor libraries by days-active, not just impressions. The Royal Match example — 440+ days, still #1 — is the pattern: longevity encodes hundreds of positive kill decisions. Sorting by "longest running" surfaces proven mechanics faster than sorting by reach.
- Treat playables as either a specialist arena or open ground. If you are a game, the bar is high and rising (248K active game playables). If you are not, 542 e-commerce playables worldwide means the format is effectively unclaimed in your category.
- Set realistic expectations for paid UA by archetype. The market now contains three proven models: industrial volume (Temu, 8.13M creatives), disciplined scaling (games, ~50K libraries with long-lived winners), and product-demand moats (ChatGPT, 1.8K). Know which game you are actually in before you budget like the wrong one.
What We'll Be Watching in H2
Five open questions this data sets up for the second half:
- Does the 16M-creative monthly baseline hold, or was May the start of another leg up? If AI-assisted production is the driver, there is no obvious ceiling; watch whether Q4 seasonal output lands closer to 18M or 22M.
- How high does Q4 e-commerce go? July's mid-year surge put e-commerce at 98% of its H1 footprint in a single month. Black Friday season starts from that elevated base — auction planning for non-retail advertisers in October–November should assume the most crowded creative environment ever recorded.
- Does the World Cup hangover flatten the sports-adjacent chart? Kalshi, FOX One, and Peacock rode the tournament; the final whistle tests which download gains were events and which were habits.
- Do playables finally escape gaming? At 542 e-commerce playables versus 248K for games, any meaningful move by a major retailer into interactive formats would show up in this data within weeks.
- Does OpenAI start buying? ChatGPT's −33% download normalization plus Meta AI's paid push creates the first real test of whether the product-demand moat needs performance-marketing reinforcement. A shift in ChatGPT's 1,776-creative library will be one of the clearest tells in the entire dataset.
We will revisit each of these with updated numbers in the year-end edition of this report.
Methodology & Data Notes
- Source. All figures come from the AdMapix creative index and app-market estimates, queried July 23, 2026. The index's verified July 2026 snapshot spans 91M+ creative combinations, 27M+ image/video records, 306K+ playable records, and 174 country/territory filter labels. Coverage definitions: AdMapix methodology.
- Units. "Creative combinations" and "image/video creatives" are different counting units and are never summed in this report. Monthly figures count creatives observed active within that calendar month; the "last 30 days" window is rolling and not directly comparable to calendar months.
- Growth caveat. Index coverage expands over time; month-over-month growth reflects both market activity and index observation. Directional trends (the May step-change, vertical mix shifts) are robust; treat precise percentages as index-observed rather than census values.
- Estimates. Impressions, downloads, and growth rates are modeled third-party estimates, not platform-reported figures, and should be used for relative comparison. Advertiser creative-library sizes are cumulative unique creatives tracked by the index to date.
- Named advertisers. All advertiser data reflects publicly observable ad activity aggregated by the index. Market context: industry-wide ad revenue benchmarks are published annually by the IAB.
Frequently Asked Questions
How fast is mobile ad creative volume growing in 2026?
Active image/video creatives observed by the AdMapix index grew 18% across H1 2026, from 13.75M in January to 16.23M in June, with a one-time step-change of +23.8% in May 2026 that established a new monthly baseline around 16M+.
Which vertical produces the most mobile ad creatives?
Entertainment led H1 2026 with 16.95M active image/video creatives, ahead of games (12.99M) and e-commerce (9.07M). In the most recent 30 days e-commerce took #1 with 8.85M active creatives, driven by mid-year sales season.
Who are the biggest mobile advertisers by creative volume?
Temu leads all advertisers tracked by the AdMapix index with 8.13M unique creatives, followed by SHEIN (4.42M), TikTok's self-promotion (2.99M), and Coupang (1.65M). The largest game advertiser library, Royal Match, is roughly 70.5K creatives — two orders of magnitude smaller.
Are playable ads used outside of gaming?
Barely. Of the 305K playable ads active in the last 30 days, 81% were game ads; e-commerce ran just 542 playables worldwide. Outside gaming, the playable format remains effectively uncontested.
How long do winning mobile ad creatives run?
Longer than most advertisers assume. The top Royal Match creative in the US has run continuously since May 2025 — over 440 days — and still leads the game's US mix with 50.5M modeled impressions. Days-active is one of the strongest signals of a proven creative when researching competitor libraries.
Which advertiser has the most ad impressions?
Among advertisers tracked in this report, TikTok's self-promotion carries the largest cumulative impression pool at 4.65 trillion modeled impressions across 2.99M creatives, ahead of SHEIN (3.12T) and Temu (2.83T).
How much does ChatGPT spend on mobile ads?
The AdMapix index tracks just 1,776 unique ChatGPT creatives — the smallest library among major apps in this report — but with 151B modeled impressions they average 85M impressions per creative, the heaviest per-creative delivery in the dataset. OpenAI runs few ads, scaled like brand media.
Every number in this report is a snapshot of a moving market — the index that produced them updates continuously. To run the same queries live — any advertiser, any market, any format, including the competitors this report could not name — create a free AdMapix account and pull the current numbers for your category before you lock your H2 plan.
Data: AdMapix creative index and modeled market estimates, observed 2026-07-23. Third-party estimates; figures are for relative comparison and research purposes.
Turn these observations into your next creative study
Open the creative library and select samples for your market, network and research question.
Related Articles
US Streaming & Entertainment App Advertising Report (Mid-2026): How FAST, Short-Drama, and Live Apps Buy Installs
A data-driven mid-2026 teardown of how US streaming and entertainment apps acquire users: the download-chart surge (Peacock, FOX One, Tubi, Love Island), the three UA engines — free ad-supported streaming, short-drama, and live social — and the real creatives, formats, run-lengths, and hooks winning attention, based on AdMapix tracking data as of June 29, 2026.
US Social Casino Advertising Teardown — Mid-2026
A data-driven teardown of how social casino, poker, slots, and bingo apps buy users in the United States as of mid-2026 — the highest-impression creatives, the publishers behind them, the format playbook, and how sweepstakes-casino newcomers are reshaping the category. Based on AdMapix tracking data as of June 26, 2026.
US Mobile Advertising Intelligence Report — Mid-2026
A data-driven mid-2026 breakdown of the US mobile market: who tops the download and revenue charts, why mobile games depend on paid user acquisition, and which ad creatives, formats, and hooks are winning across puzzle, match-3, strategy, slots, and idle RPG — based on AdMapix tracking data as of June 26, 2026.