Competitor Ad Spend in 2026: How to Track and Estimate a Rival's Ad Budget
A complete 2026 framework for competitor ad spend: read Meta Ad Library impressions and spend ranges, decode Google Auction Insights, run a weekly ad spend monitoring SOP, score confidence, and turn signals into action.
Competitor Ad Spend in 2026: How to Track and Estimate a Rival's Ad Budget
By the AdMapix research team. Updated June 21, 2026. Information only — not financial or legal advice.
Competitor ad spend is one of the most tempting numbers in all of competitive research. Marketing leads want to know whether a rival just raised budget, whether they are defending a launch, whether they are quietly testing a new channel, and whether they are outspending you on the queries that actually convert. The instinct to chase a single dollar figure is understandable — and it is also the fastest way to get the analysis wrong.
Here is the honest truth that most "competitor ad spend tool" landing pages will not tell you: you cannot see a competitor's exact ad budget from the outside. Their real bids, daily and lifetime budgets, conversion rates, ROAS, target CPA, and finance-approved media plan all live inside ad accounts you do not have access to. No tool, scrape, or screenshot changes that.
What has changed in 2026 is how much public signal now exists. Meta's Ad Library now shows impressions ranges on every ad (not just political), EU transparency rules expose spend bands and reach for ads delivered in the EU, advertiser profile pages publish rolling 12-month cumulative spend for tens of thousands of brands, and Google Auction Insights still quietly tells you exactly how much pressure a rival puts on the auctions you both enter. Stitch these signals together and you can answer the question that actually matters.
That question is not "What is their exact spend?" It is "Is their spend pressure increasing, decreasing, or stable — and how confident am I?"
This guide is the complete 2026 playbook for that question. It covers the public signals that exist today, how to read Meta Ad Library impressions and spend ranges line by line, how to decode every Google Auction Insights metric, a weekly ad spend monitoring SOP you can run with two analysts, a quantified confidence-scoring model, a tool comparison so you know what each category can and cannot show, and three full worked examples across SaaS, e-commerce, and mobile apps. For the recurring evidence-collection side of this, pair it with our broader ad spend tracking workflow; this article focuses on the estimation method and the decisions it should drive.
TL;DR — Competitor ad spend in 2026 at a glance
- You can't see exact budgets — and any tool that promises them is selling you a guess dressed as a fact. Bids, daily budgets, conversion rates, and ROAS stay private. Work with directional estimates and a confidence label instead.
- Meta Ad Library is the single hardest public signal now. Every ad shows an impressions range (under 1K → 1M+), and ads delivered in the EU expose spend bands and reach per ad under DSA rules. Sum the bands across a campaign's live ads to bound its magnitude.
- Google Auction Insights is your best account-side signal. Overlap rate, outranking share, position above rate, and top-of-page rate tell you how hard a rival is pushing in your shared auctions — the one place you see real competitive pressure.
- Run ad spend monitoring as a weekly SOP, not a one-off screenshot. Track the same fields, on the same query list, every week. Direction beats a fake dollar amount.
- Score every estimate. Assign each signal a weight, sum to a confidence score, and map the score to one of three actions: monitor, test, or defend.
- AdMapix snapshots the history Meta erases. Commercial ads vanish from the Library the moment they stop; week-over-week creative and spend-band history is exactly what an ad-intelligence layer preserves.
1. Why exact competitor ad spend is usually invisible
Before building an estimate, get crisp on what is genuinely out of reach. Advertising platforms expose public transparency surfaces, but they deliberately do not expose private account settings. Confusing the two is the root cause of almost every bad competitor-spend report.
| Private data (you cannot see this) | Why it matters | Closest public proxy |
|---|---|---|
| Exact bids / bid strategy | Determines auction participation and cost pressure | Auction Insights outranking share + position above rate |
| Daily and lifetime budgets | The actual financial commitment | EU spend bands + active-ad volume over time |
| Conversion rate | Whether the spend is profitable | None — never inferable from outside |
| ROAS / CAC / target CPA | Whether the campaign can scale | None — performance is invisible by design |
| Audience targeting (non-EU) | Why one user sees an ad and another does not | EU-only DSA targeting disclosure |
| Full creative inventory | The real scope of testing | Ad Library active-ad count + variants |
Notice the right-hand column. For two of these rows there is no public proxy at all — conversion rate and ROAS are simply unknowable from the outside. Any "competitor ad spend tool" that claims to surface ROAS or profitability is reverse-engineering a guess from CPM models, and you should treat that output as a hypothesis, never a fact.
The useful takeaway: stop trying to recover the private number. Start cataloguing the public evidence that correlates with it, and be ruthlessly honest about the gap.
2. The public signals that actually support an estimate
A good competitor ad spend estimate is built from many weak signals that agree, not one dramatic screenshot. A single screenshot of one ad tells you almost nothing. Five independent signals all pointing the same direction tells you a lot.
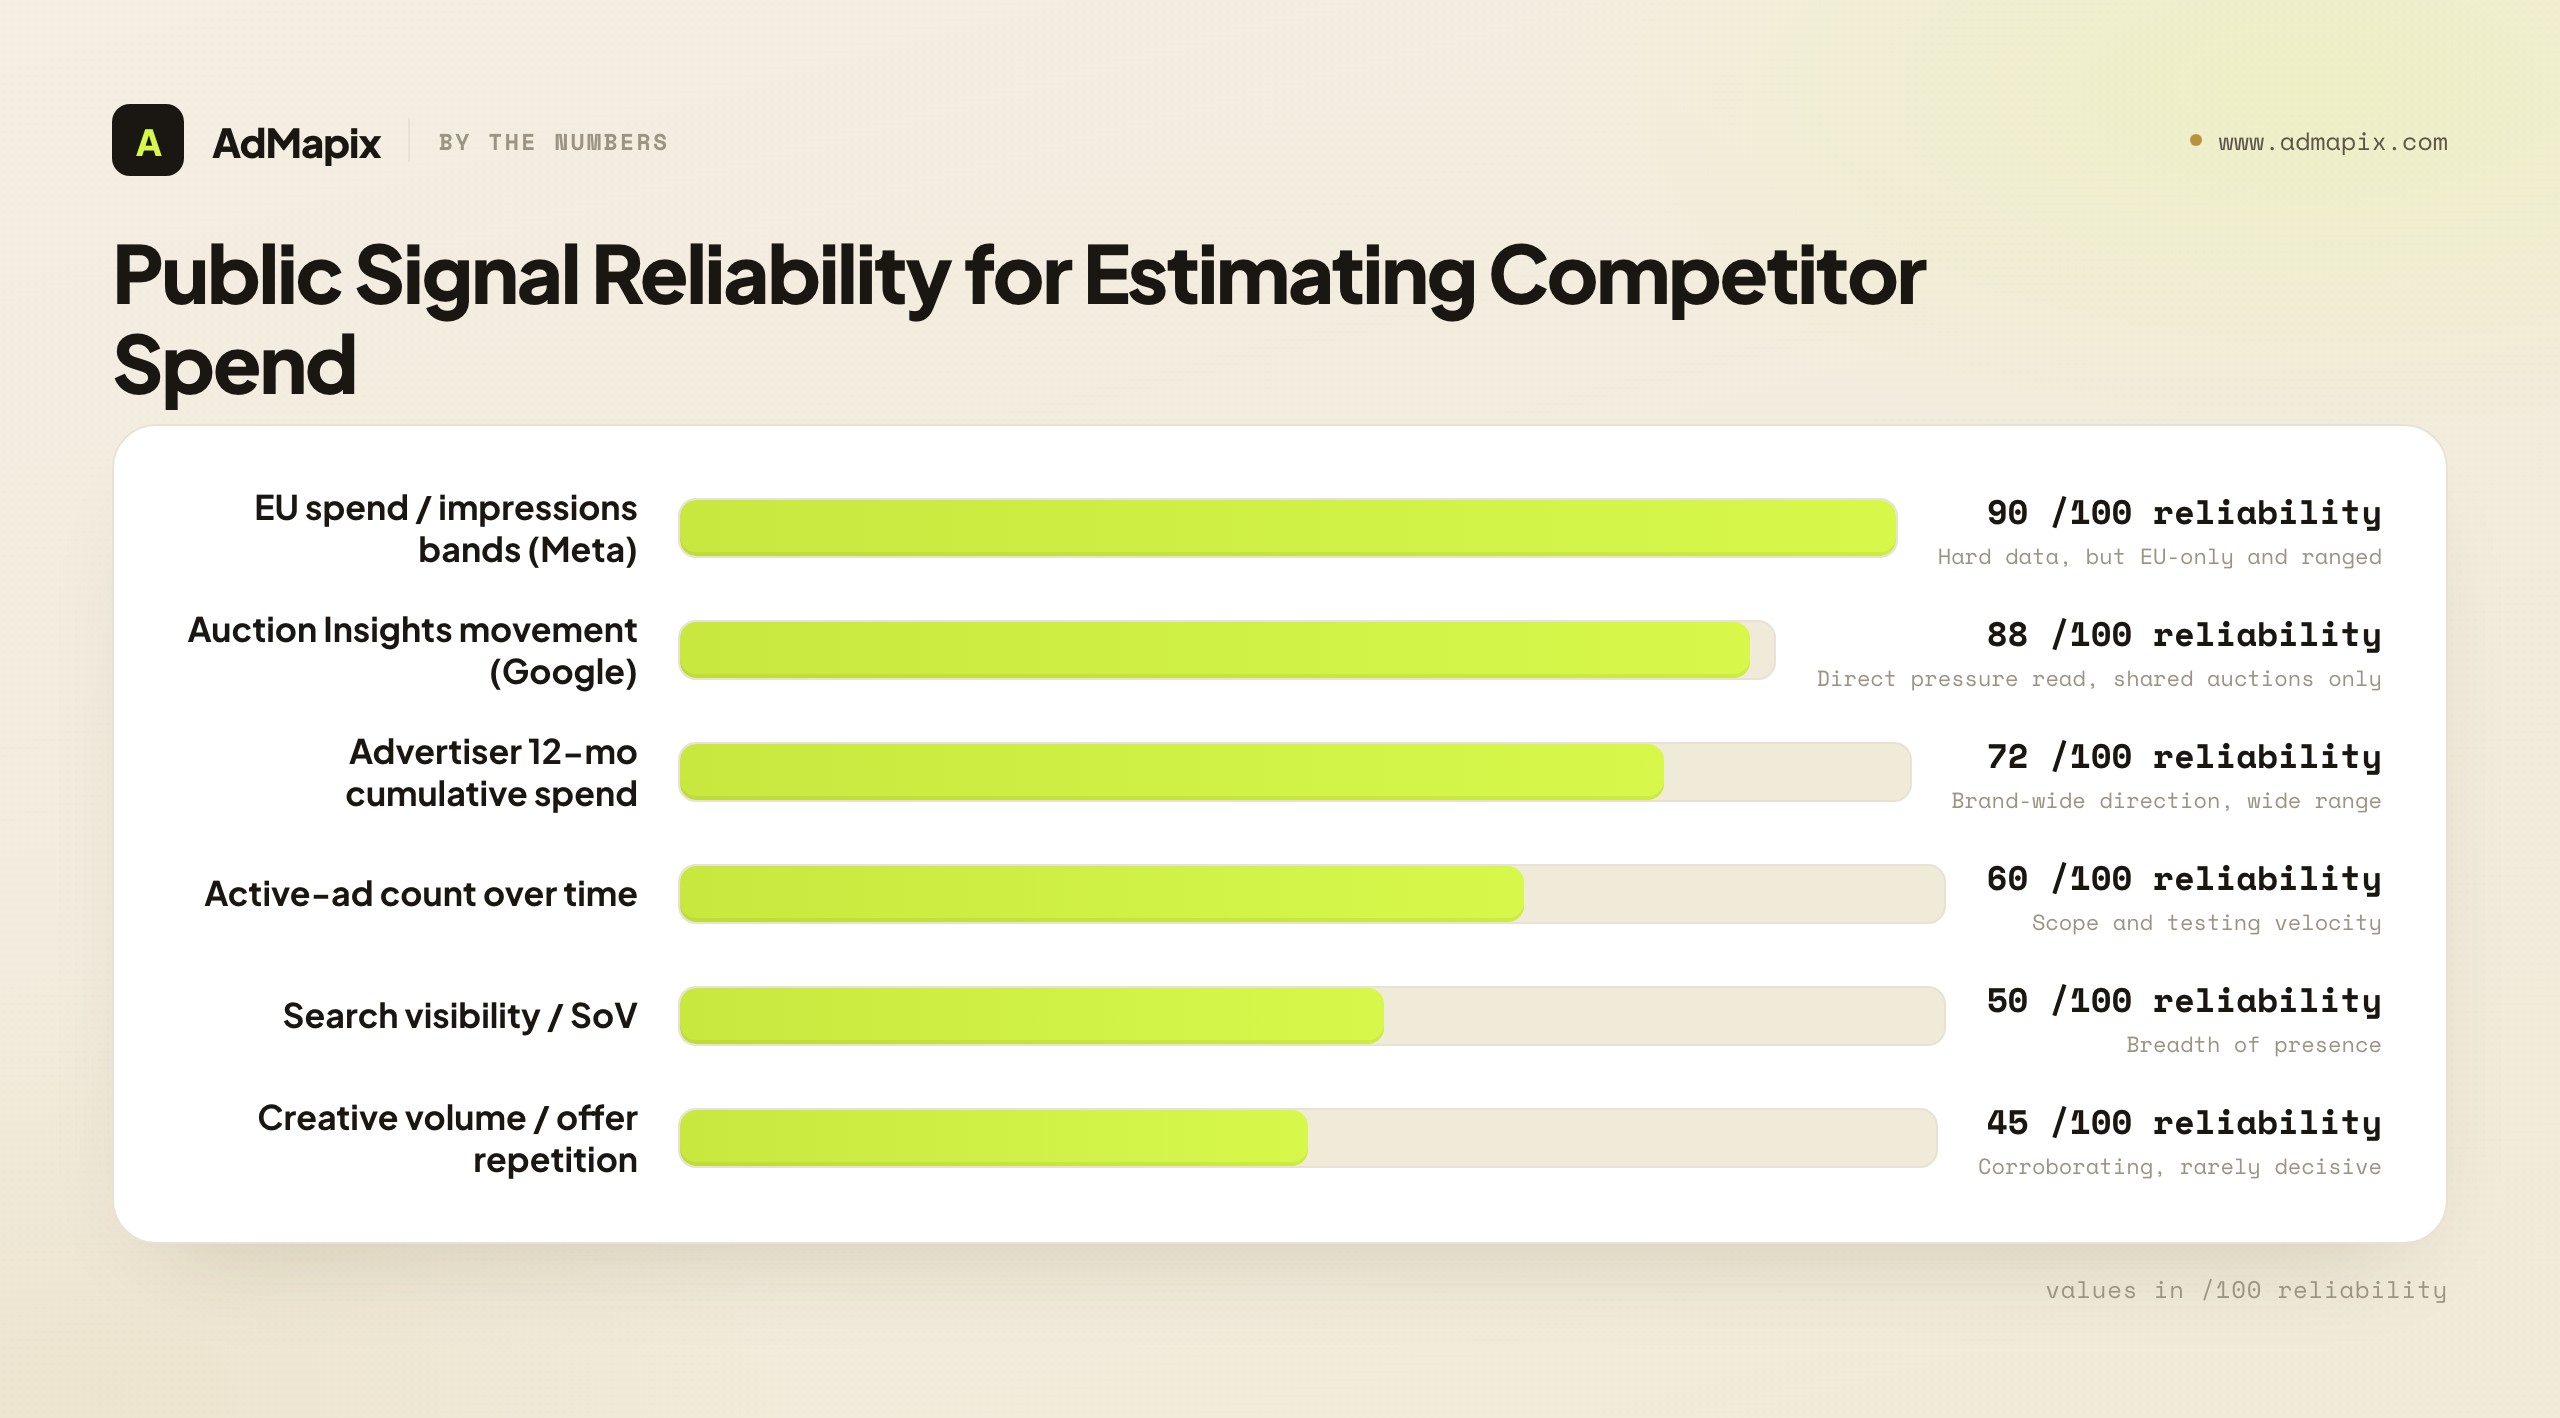
Here is the full signal inventory for 2026, ranked by how much weight each one deserves.
| Signal | What it can suggest | Reliability | Where to read it |
|---|---|---|---|
| EU spend / impressions bands (Meta) | Magnitude of spend on EU-delivered ads | High (but EU-only, ranges) | Each ad's EU transparency detail |
| Auction Insights movement (Google) | Rising/falling pressure in shared auctions | High (but only your auction set) | Your Google Ads account |
| Advertiser 12-month cumulative spend (Meta) | Overall scaling direction of a brand | Medium-high (range, ~37,991 brands) | Advertiser profile page |
| Active-ad count over time (Meta) | Campaign scope and testing velocity | Medium | Ad Library, Delivery status: Active |
| Search visibility / SoV | Repeated presence on high-intent queries | Medium | Query sampling, rank trackers |
| Display & social creative volume | Testing or scaling attention assets | Medium | Ad libraries, transparency centers |
| Landing-page investment | Campaign has dedicated funnel support | Medium | Manual review of destinations |
| Offer repetition across channels | The offer matters enough to keep funding | Medium | Cross-channel creative review |
| Channel expansion | Spend pressure spreading across surfaces | Medium-high | Multi-platform monitoring |
The two high-reliability signals — EU bands and Auction Insights — are the backbone of any serious estimate in 2026, and the next two sections cover each in full. Everything else is corroboration: useful for raising or lowering confidence, but rarely decisive on its own.
A few authoritative starting points before we go deep. Meta's Ad Library help explains how the public ad surface and EU disclosures work. Google's Auction Insights help defines every competitive metric. The Google Ads Transparency Center shows public ad examples by advertiser, and the EU Digital Services Act overview is why so much of this data exists at all.
3. The core 2026 signal: reading Meta Ad Library impressions and spend ranges
This is the single biggest upgrade to competitor ad spend research in years, and it is the section most guides skip entirely. If you read only one part of this article, read this one.
Why this data exists (and where it applies)
Meta's Ad Library is mandated under EU Digital Services Act (DSA) Article 39, which requires Very Large Online Platforms to maintain a searchable, transparent ad repository. For ads that deliver at least one impression in the EU or associated territories, Meta must disclose substantially more than it does elsewhere: estimated total impressions as a range, estimated spend as a range, reach demographics (age, gender, location of the audience reached), and targeting parameters. Those EU-delivered ads stay in the Library while active and are archived for one year after the last impression.
Two boundaries you must internalize before you use this data:
- It is EU-scoped. The spend and reach bands only exist for the EU-delivered portion of an ad's run. A US-only campaign shows you impressions ranges (since early 2026 those cover all ads globally) but no spend band. If a rival runs heavily in Germany, France, or Spain, you get gold; if they only run in the US, you get the impressions bucket and nothing more.
- Everything is a range, never an exact figure. Meta derives these numbers from CPM and frequency models, so you get bands like "€5,000–€9,999" rather than "€7,412." That is still enough to separate a €100/day test from a €2,000/day scaler — which is exactly the distinction that drives decisions.
Step by step: where to actually find it
The data is real but the UI buries it — it is not printed on the ad card where you would expect it. Here is the path.
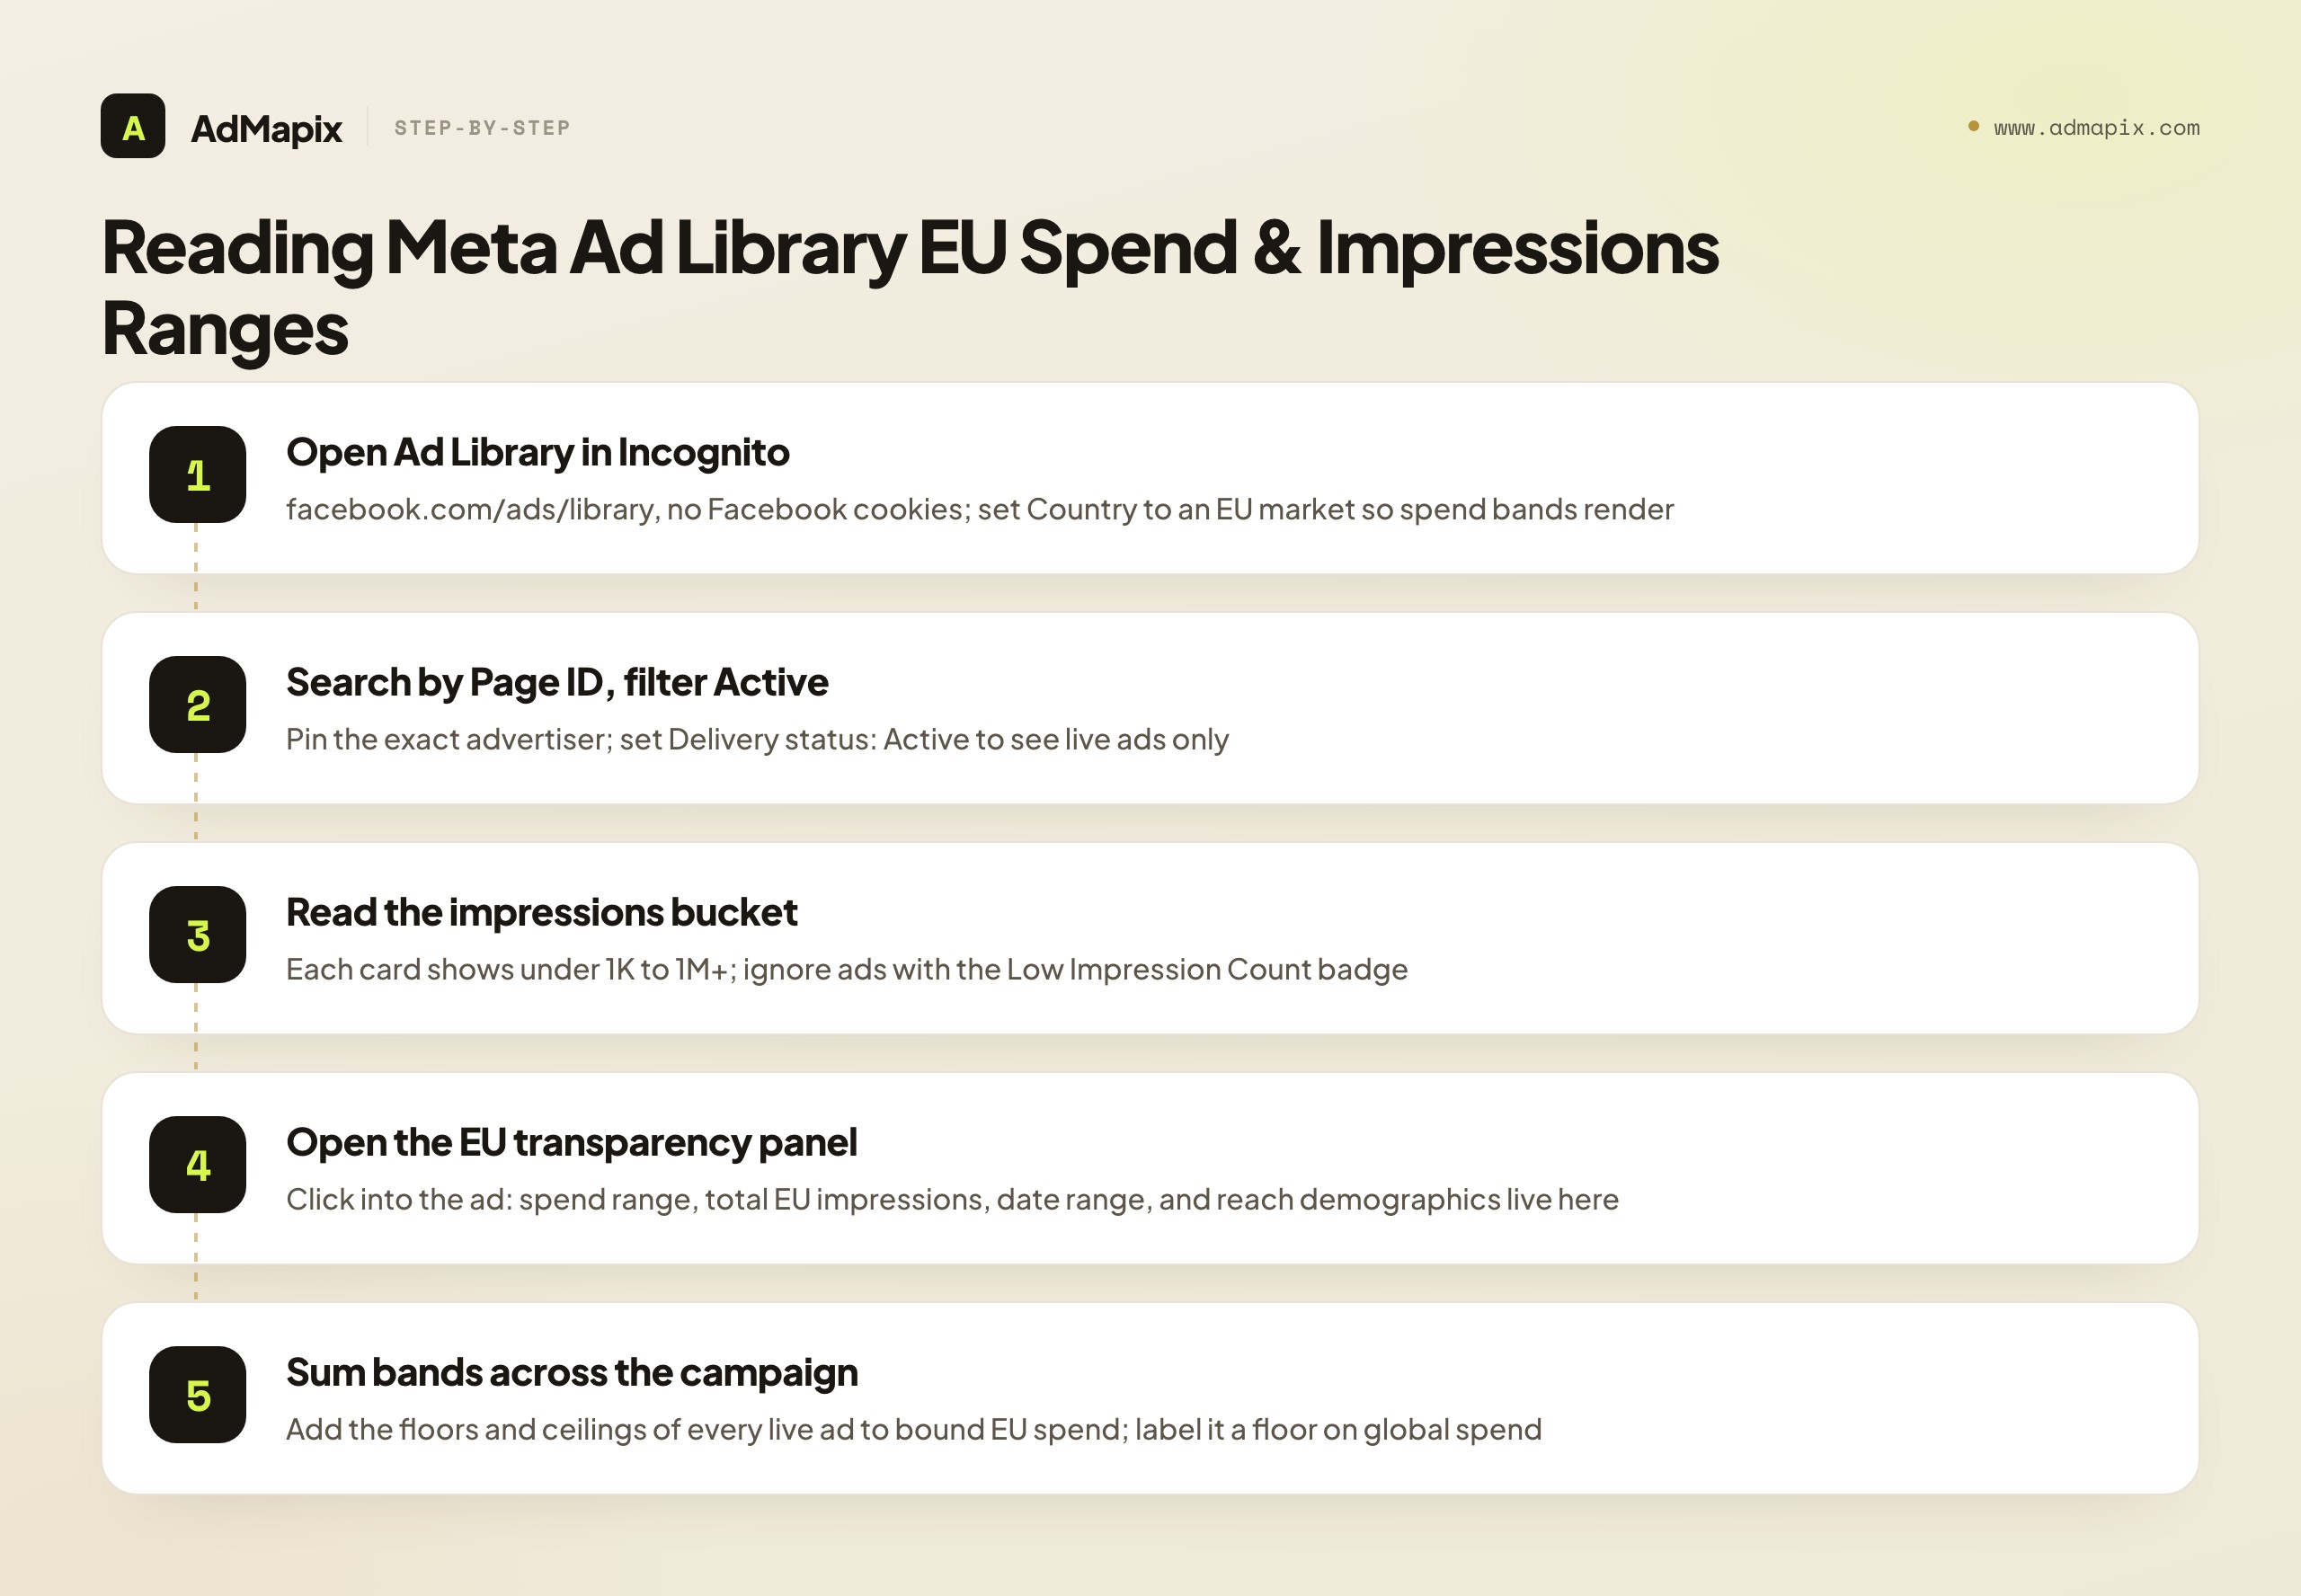
- Open the Ad Library in an Incognito window (no Facebook cookies — Meta personalizes results otherwise). Pick an EU country in the Country filter, since spend bands only render for EU-delivered ads.
- Search the advertiser by brand name or, better, by Page ID so a similarly-named brand cannot pollute your view. Set Delivery status: Active.
- Read the impressions range on the card. Every ad now shows a bucket: under 1K, 1K–5K, 5K–10K, 10K–50K, 50K–100K, 100K–500K, 500K–1M, or 1M+. The "Low Impression Count" badge (sub-100 impressions) flags tests and flops — de-prioritize those.
- Click into the individual ad → open the "EU transparency" / "See ad details" panel. This is the buried part. Here you find the per-ad spend range, total EU impressions, the date range it delivered, and the reach breakdown by age, gender, and country.
- Record it. Note the ad ID, spend band, impressions band, start date, and countries. You will sum these across the campaign in the next step.
How to turn per-ad ranges into a campaign-level magnitude
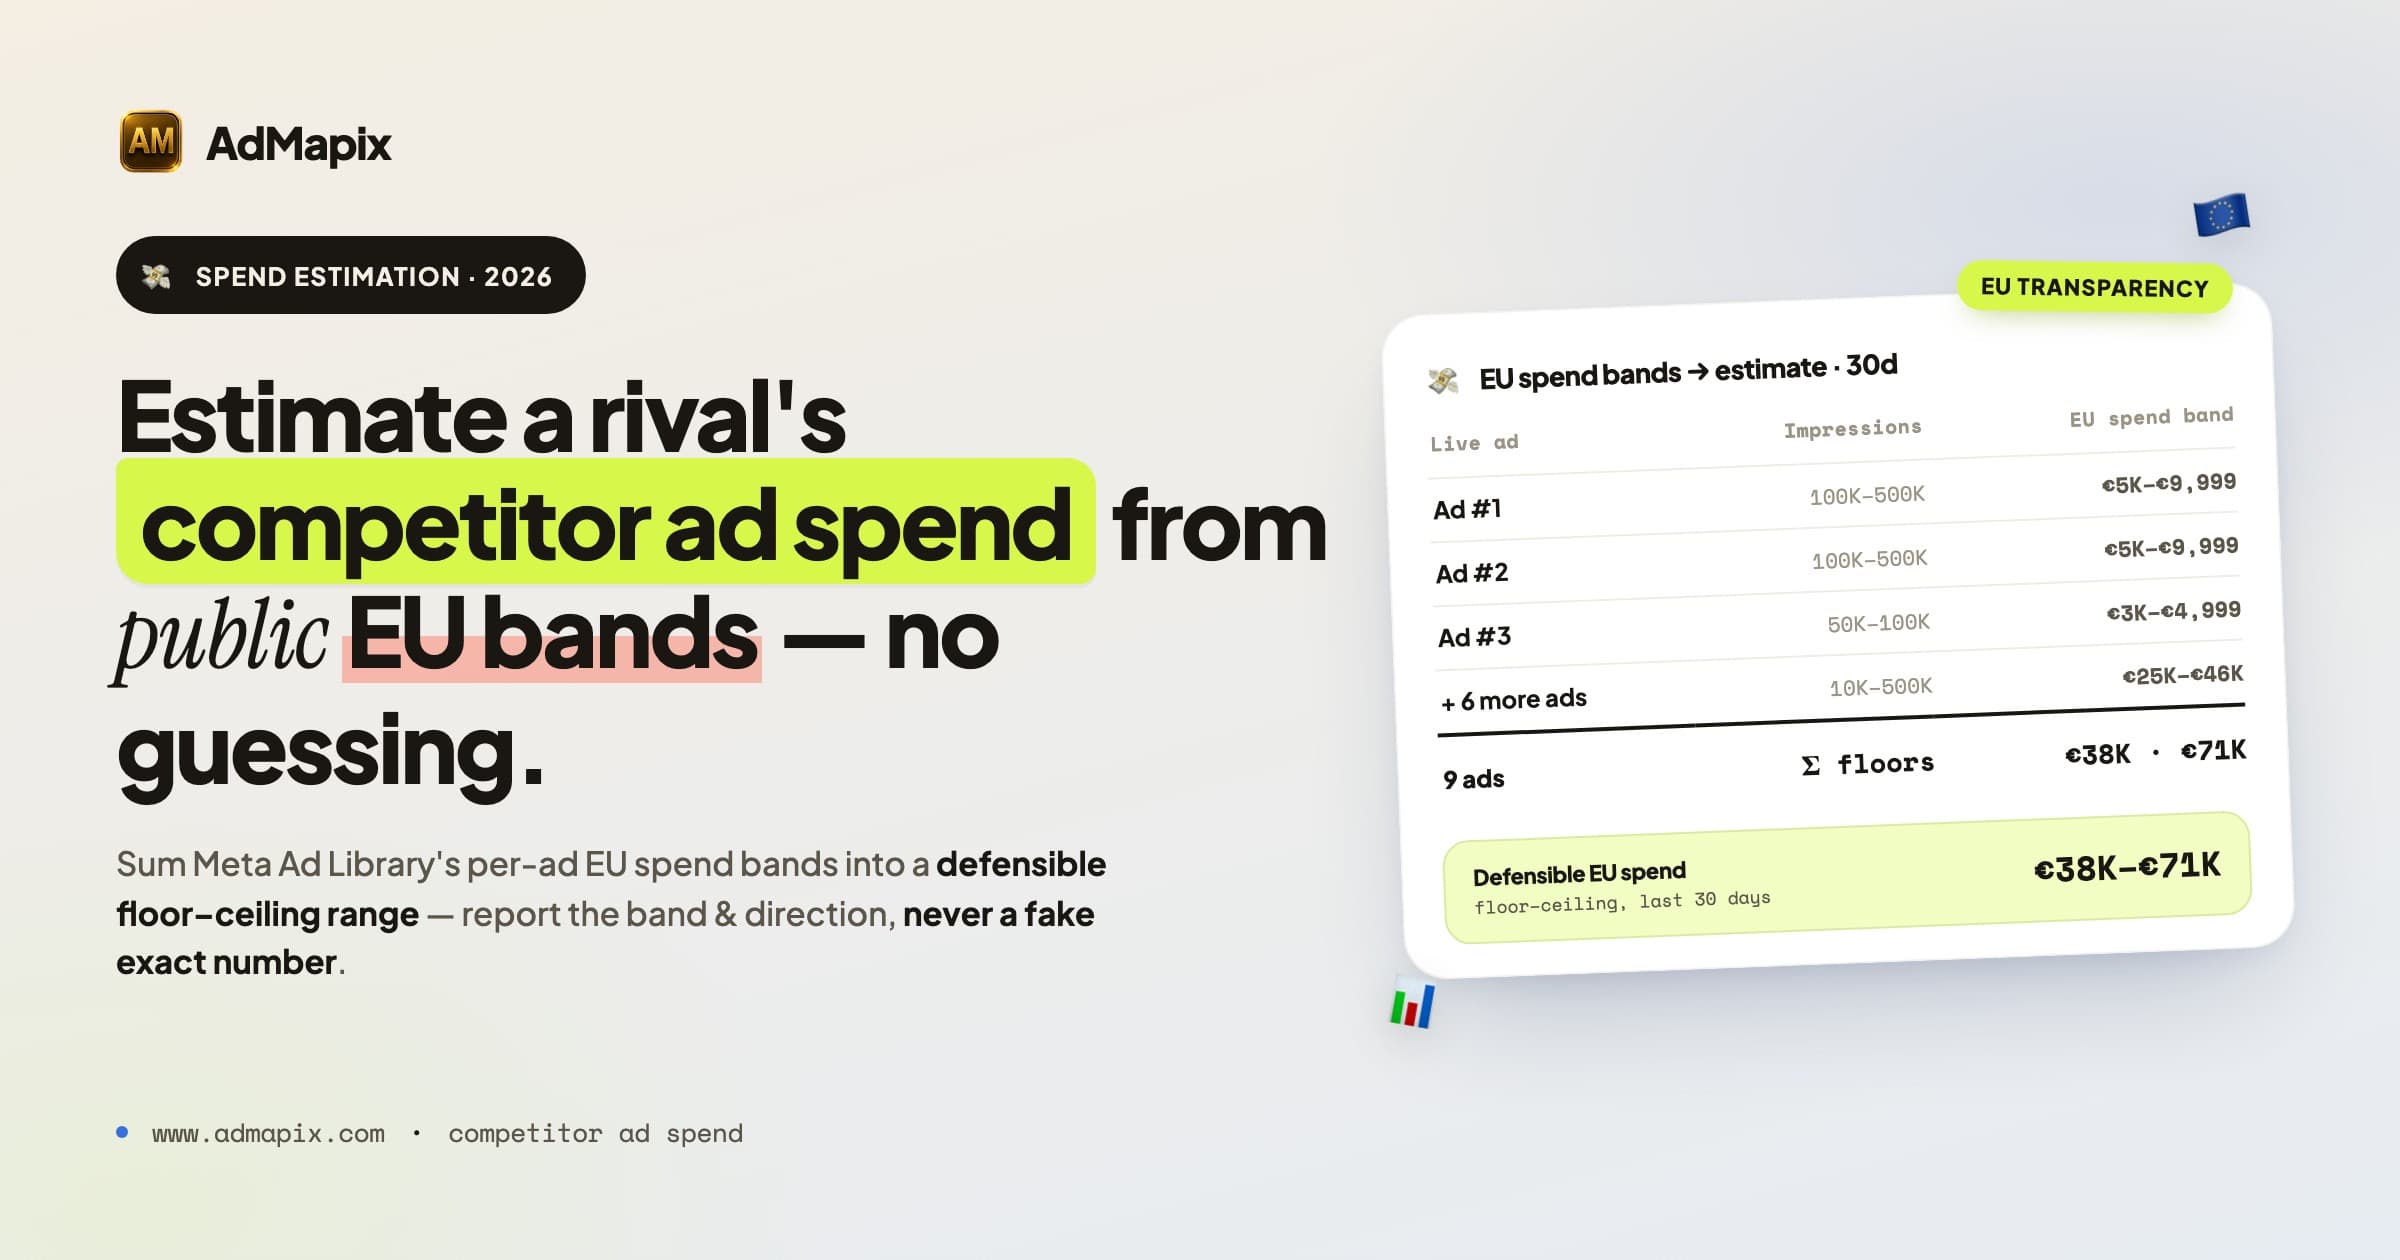
A single ad's "€5,000–€9,999" band is a data point. The power move is aggregating the bands across every live ad in a campaign to bound the campaign's total magnitude. Here is the method.
| Step | Action | Example |
|---|---|---|
| 1. Roster the live ads | List every active ad tied to one offer/landing page | 9 active ads pushing the same "2026 Benchmark Report" |
| 2. Sum the floors | Add the lower bound of each ad's EU spend band | 9 ads, floors sum to €38,000 |
| 3. Sum the ceilings | Add the upper bound of each band | Ceilings sum to €71,000 |
| 4. State the range | Report the campaign's EU spend as a band | "≈ €38K–€71K EU spend on this campaign, last 30 days" |
| 5. Annotate the gaps | Flag what is NOT counted | "Excludes all non-EU delivery; true global spend is higher" |
That last row is non-negotiable. Your aggregated band only covers EU delivery. If the brand also runs the US, UK (post-Brexit DSA-equivalent disclosure varies), Brazil, and India, the global figure is materially larger — you simply cannot see it. Report the EU band as a floor on global spend, never as the global total.
Reading spend + run-time together to spot winners
The ranges become far more powerful when you combine them with how long an ad has been running. The logic is simple and reliable: advertisers do not keep paying for ads that lose money.
- An ad in the 100K–500K impressions band that has been live for 90+ days is almost certainly profitable. Nobody funds a loser for three months. Treat it as a proven winner and study its angle.
- A single ad burning a €500–€1,000/day EU spend band for weeks is the closest thing to a "this works" signal you will ever get without account access.
- An ad that appears and vanishes inside a week, or that carries the Low Impression badge, is a test or a flop. Ignore it when modeling spend.
This run-time-plus-band reading is how you separate the two or three ads a rival is actually scaling from the dozen they are merely testing — and the scaled ones are where the real budget lives. For a deeper drill on the Library itself, see our Facebook Ads Library complete guide and the track competitor Facebook ad spend workflow.
4. Advertiser-level cumulative spend: the brand-wide direction signal
Separate from per-ad EU bands, Meta now publishes a rolling 12-month cumulative spend figure on advertiser profile pages, covering roughly 37,991 commercial advertisers as of April 2026 and expanding. This is a different lens: per-ad bands tell you about a campaign; cumulative spend tells you about the whole brand's trajectory.
The high-value move here is the month-over-month delta, not the absolute number. Because the figure rolls a 12-month window, old spend falls off the back as new spend enters the front. Log it weekly and watch the change:
| Pattern | Reading | Action |
|---|---|---|
| Rolling figure jumps a full band in a month | Brand is scaling something hard | Dig into newly-activated ads to find the winner |
| Figure flat across several weeks | Steady-state spend, no major shift | Maintain watchlist, focus elsewhere |
| Figure drops a band | Brand is pulling back | Look for efficient demand-capture opportunities |
Treat the absolute number as low-resolution (it is a wide range and brand-wide, not campaign-specific) but the direction as a genuinely useful brand-level signal. It is the cleanest answer to "is this competitor getting bigger or smaller overall?"
5. Google Auction Insights: your sharpest account-side signal
Meta gives you the rival's public ads. Google Auction Insights gives you something even more valuable: a measurement of how much pressure that rival puts on the exact auctions you both enter. It is the one place you see relative competitive strength directly, from your own account. The catch — and it is important — is that it only covers your shared auction set, and only renders when your own impression share on those terms is at least 10%.
Here is every Search-campaign metric, what it actually measures, and how to read it as a spend signal.
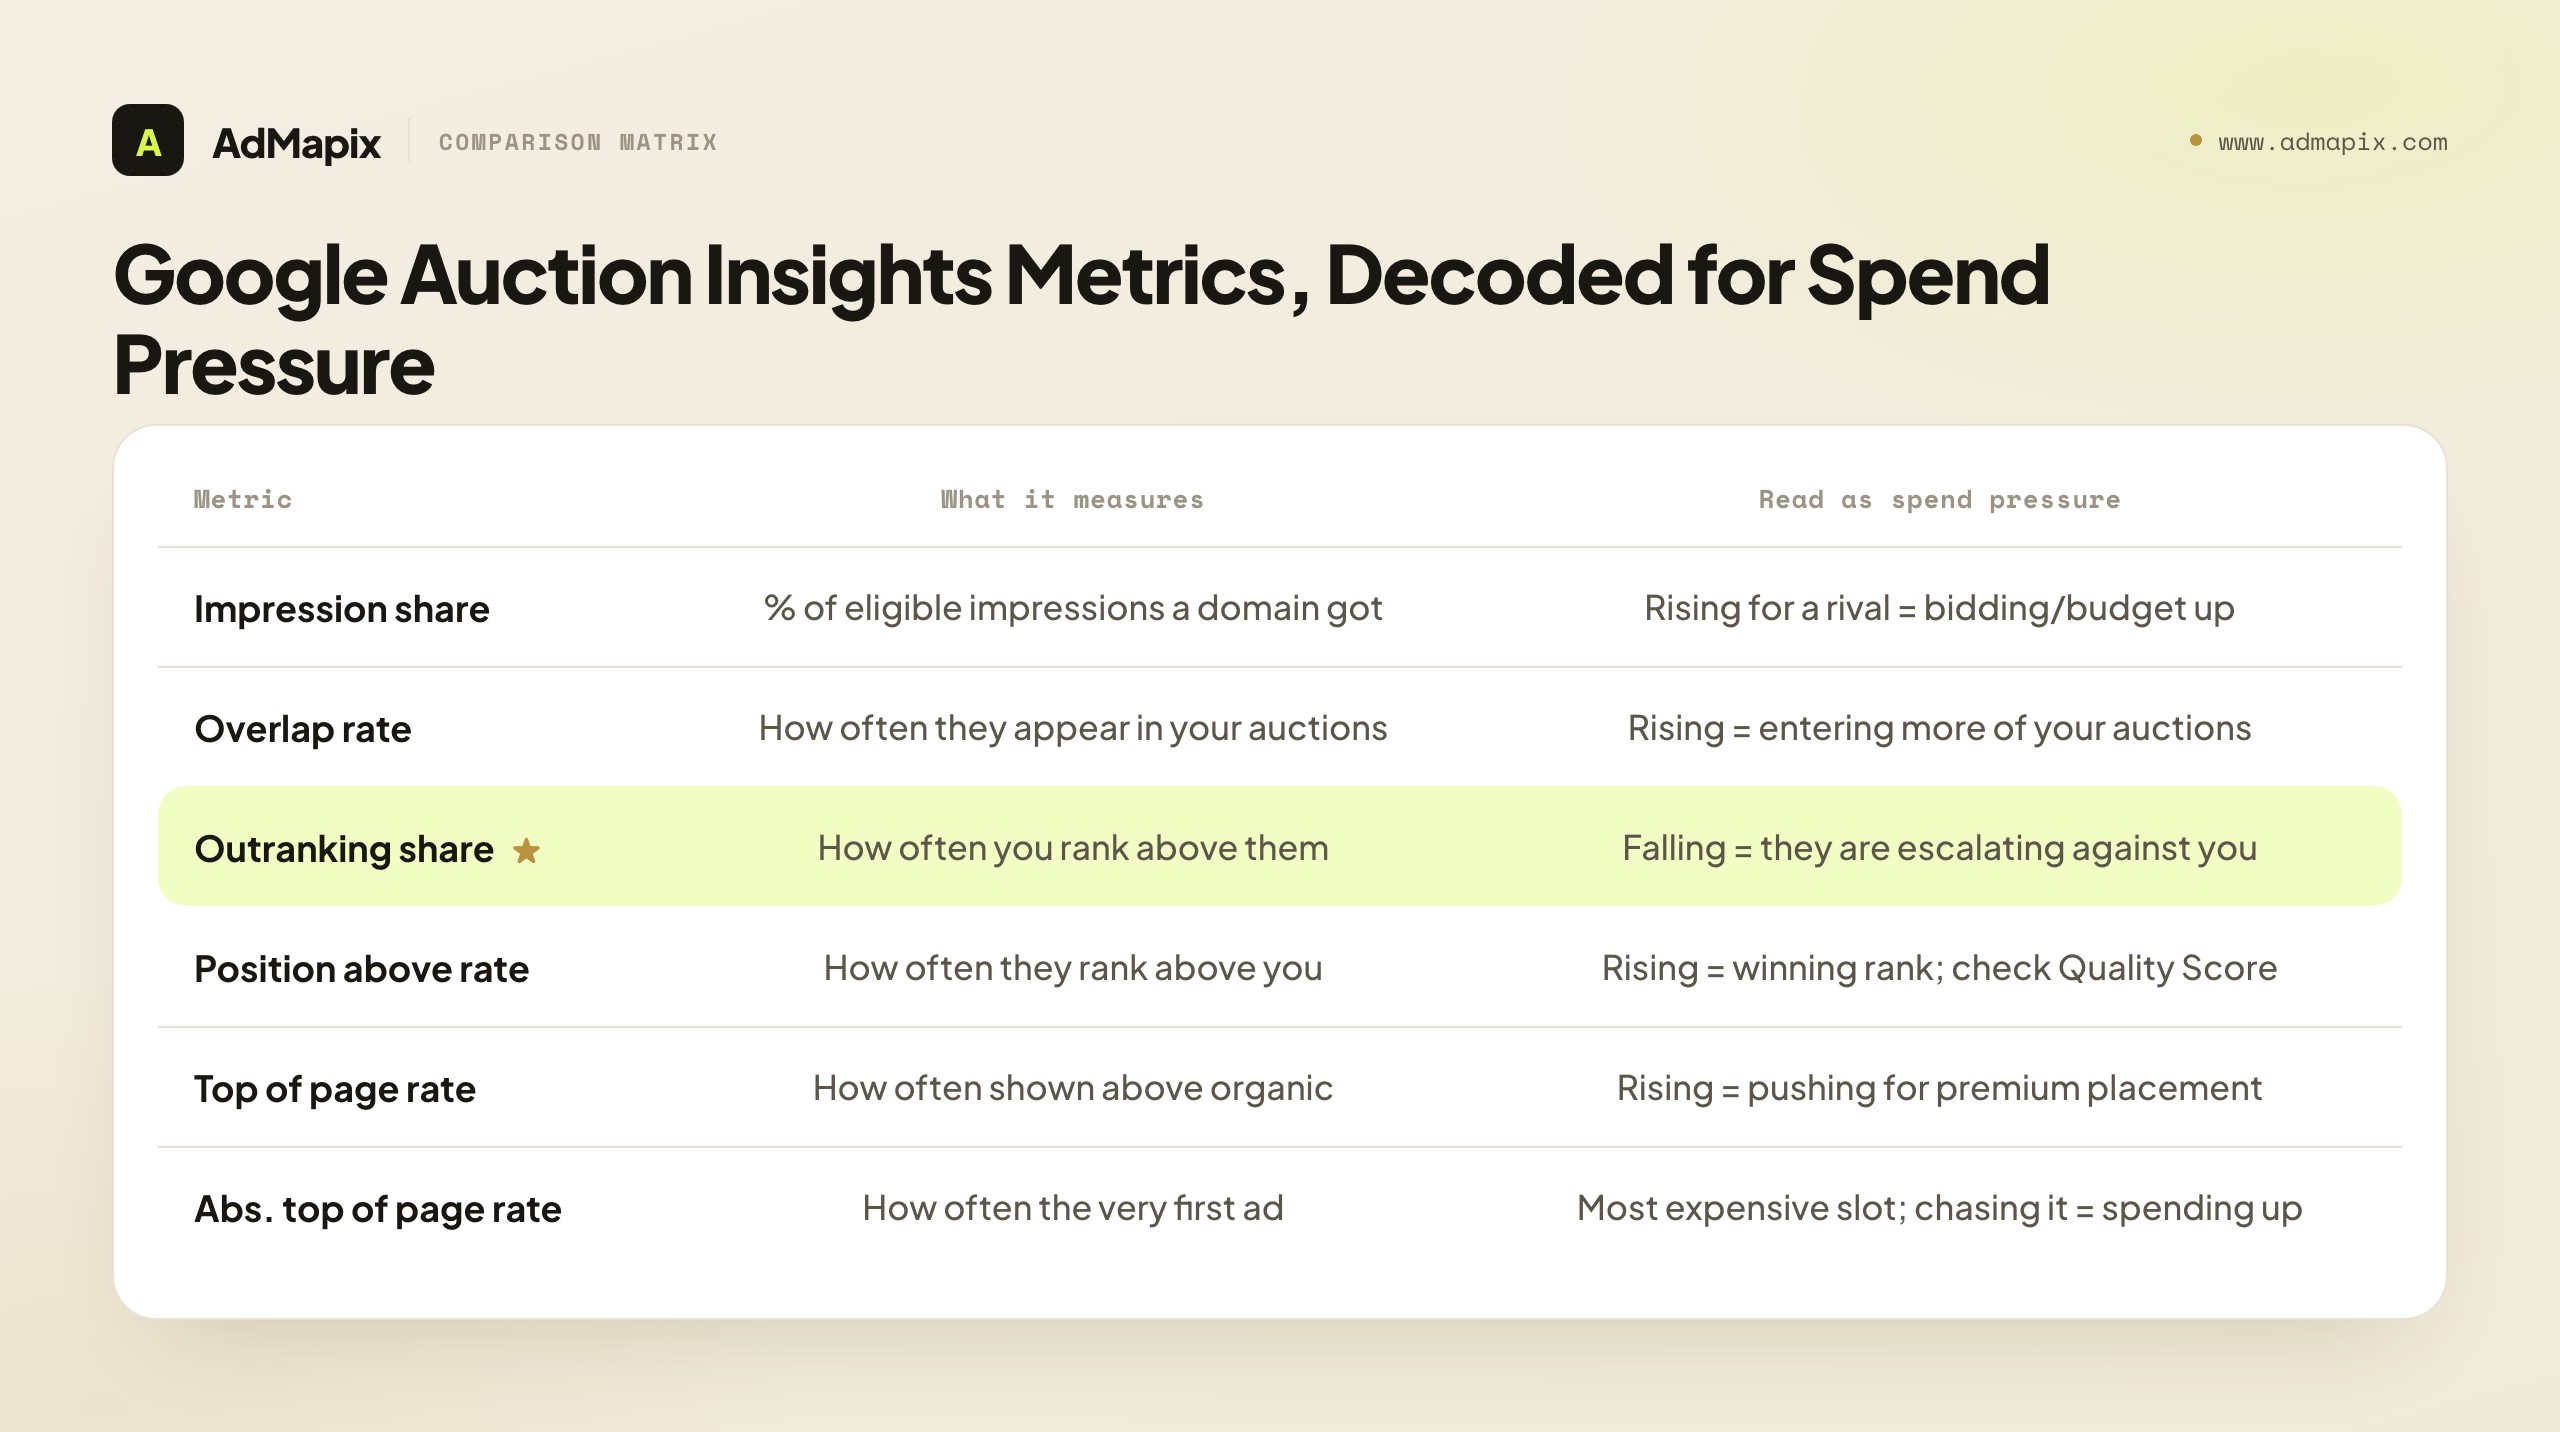
| Metric | What it measures | How to read it for spend pressure |
|---|---|---|
| Impression share | % of impressions a domain got out of those it was eligible for | A rival's rising impression share on shared terms = they are bidding more aggressively or lifting budget |
| Overlap rate | How often a competitor appeared in the same auction as you | "Who's fishing in the same pond." Rising overlap = they are entering more of your auctions |
| Outranking share | How often you ranked above them (or showed when they didn't) | Your competitive win rate vs. that rival. Falling = they are escalating bids/quality |
| Position above rate | How often their ad showed above yours when both appeared | Rising = they are winning the rank battle. Probe whether it's bid or Quality Score |
| Top of page rate | How often a domain showed at the top of the SERP (above organic) | Rising for a rival = they are pushing for premium placement, which costs more |
| Absolute top of page rate | How often a domain was the very first ad on the page | The most expensive real estate. A rival chasing this is spending up hard |
The interpretation discipline that separates pros from amateurs: never read one metric alone. The classic combination is overlap rate + position above rate read together.
- High overlap, low position-above (they enter your auctions a lot but rarely rank above you): a positive signal. You are beating an active rival.
- Rising overlap + rising position-above + falling outranking share (all three moving against you at once): a genuine escalation. The rival is putting more money and/or better quality behind shared terms. This is the pattern that justifies a defensive response.
Two caveats to bake into your process. First, position above rate can be driven by Quality Score, not just bid — a rival with better ad relevance and landing pages can outrank you without outspending you, so investigate their creative before assuming a budget increase. Second, since Google's August 24, 2024 update, Auction Insights data is no longer available outside the Google Ads interface — you cannot pipe it into Looker Studio or third-party BI tools. You have to read it natively and log it manually, which is exactly why the weekly SOP in the next section exists. For the search-specific deep dive, use our Google Ads competitor analysis and competitor PPC ads playbooks.
6. A weekly ad spend monitoring SOP
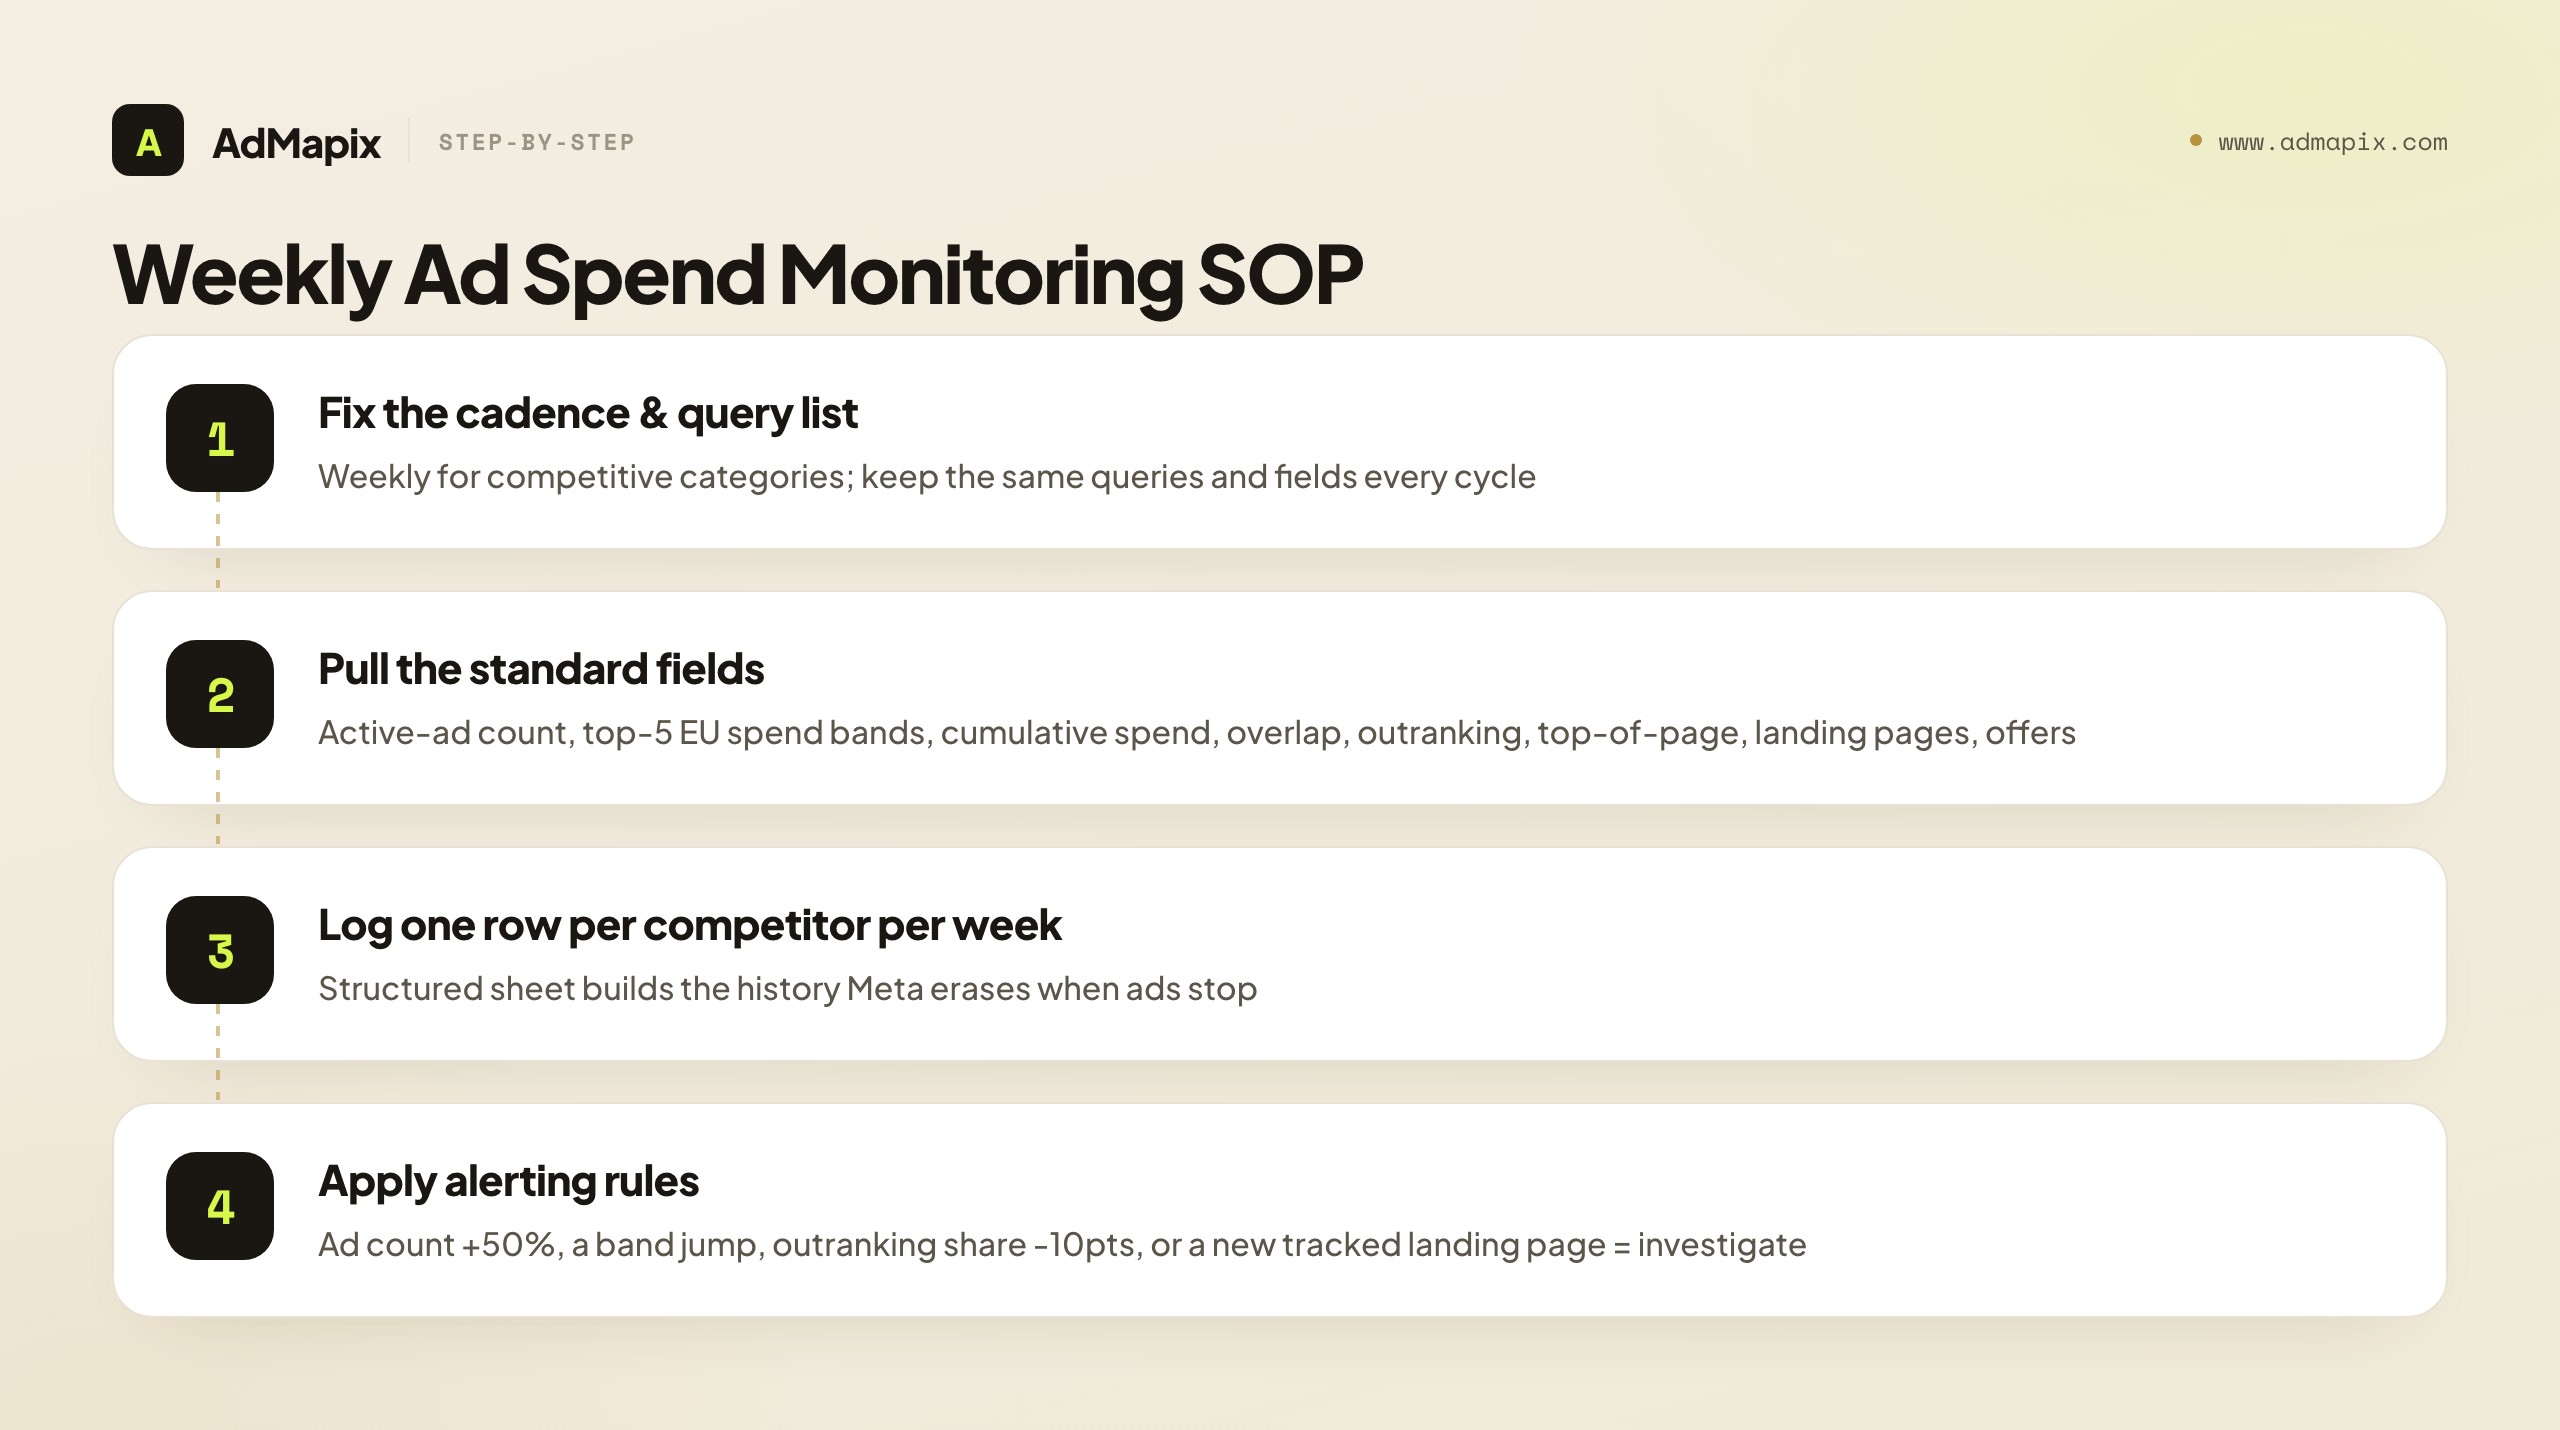
A one-time screenshot is competitor ad guessing. Ad spend monitoring is a repeatable process that tracks the same fields, on the same cadence, against the same query list — so that what you are measuring is change over time, which is the only thing that reliably maps to budget shifts. Here is an SOP two analysts can run in under two hours a week.
The cadence
| Frequency | Use when | Why |
|---|---|---|
| Weekly | Active, competitive categories | Catches launches, scaling, and channel moves while they're actionable |
| Bi-weekly | Moderate categories | Balances coverage against effort |
| Monthly | Slow-moving B2B / niche | Enough to catch real shifts without noise |
For most competitive teams, weekly is the right default. The discipline that matters more than the frequency: keep the same query list and the same evidence fields every single cycle. Changing your measurement set mid-stream destroys the comparison.
The fields to track every cycle
Track these for each priority competitor. Consistency is the whole game.
| Field | Source | What a change tells you |
|---|---|---|
| Active-ad count (Meta) | Ad Library, Active filter | 12 → 60 ads = scaling a campaign |
| Per-ad EU spend bands (top 5 ads) | Ad transparency detail | Magnitude shift on flagship ads |
| Advertiser 12-mo cumulative spend | Profile page | Brand-wide trajectory |
| Overlap rate (per rival) | Auction Insights | Are they entering more of your auctions? |
| Outranking share (per rival) | Auction Insights | Are you losing the head-to-head? |
| Top-of-page rate (per rival) | Auction Insights | Are they pushing for premium placement? |
| Tracked-query coverage | Manual query sampling | Breadth of search presence |
| New landing pages | Manual review | Dedicated funnels = campaign seriousness |
| Active offers | Cross-channel creative review | What they are actually funding |
The alerting rules
Define in advance what counts as an alert, so you react to signal and not to noise. Suggested triggers:
- Active-ad count up ≥ 50% week-over-week → investigate the new ads this week.
- A flagship ad jumps a full EU spend band → magnitude shift; re-score confidence.
- Outranking share falls ≥ 10 points against a key rival → defensive review of shared terms.
- A new dedicated landing page appears with paid-style tracking params → a real campaign is being funded; escalate.
- Cumulative 12-mo spend jumps a full band → brand-wide scaling; prioritize this competitor.
Log everything in a structured sheet (one row per competitor per week). Over a quarter, that history becomes the asset Meta itself does not keep — because commercial ads disappear from the Library the moment they stop running. Preserving that week-over-week creative-and-spend trail is exactly what an ad-intelligence layer automates so your analysts don't have to.
7. A quantified confidence-scoring model
Never publish a competitor ad spend estimate without a confidence label. A number with no confidence attached invites your team to either panic or ignore it — both wrong. This section turns the loose "low/medium/high" idea into a quantified model you can apply consistently.
Step 1 — Assign each signal a weight
Weight each signal by how reliable it is. These weights reflect the reliability ranking from Section 2.
| Signal | Weight (if present & pointing up) |
|---|---|
| EU spend band increase on flagship ads | 3 |
| Auction Insights: rising overlap + falling outranking share | 3 |
| Advertiser 12-mo cumulative spend up a band | 2 |
| Active-ad count up ≥ 50% | 2 |
| New dedicated landing page (paid tracking params) | 2 |
| Repeated search visibility across many queries | 1 |
| Display/social creative volume up | 1 |
| Same offer repeated across 3+ channels | 1 |
Step 2 — Sum the score and map to confidence
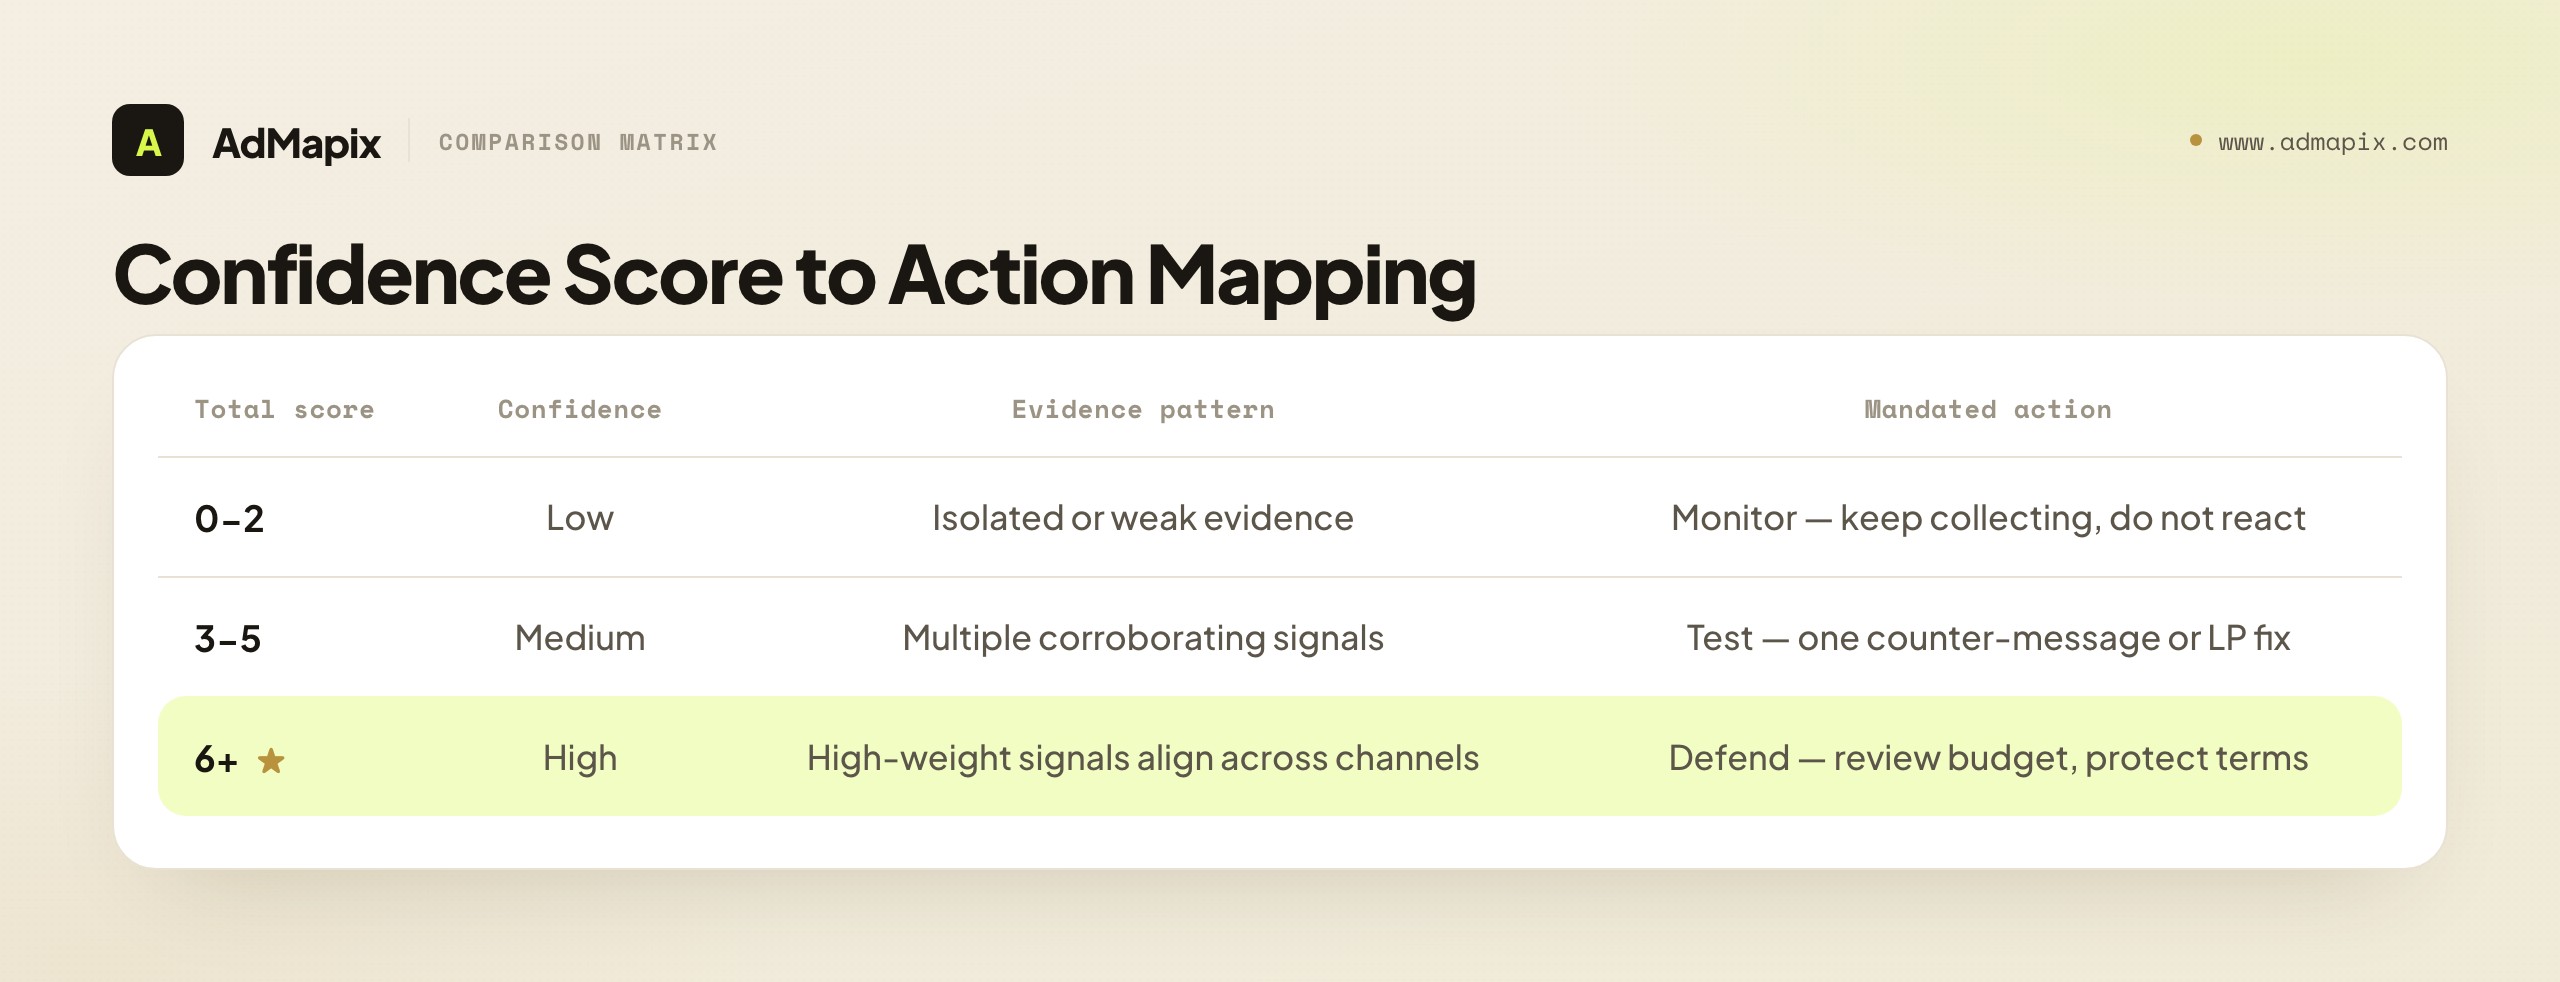
Add the weights of every signal you can actually evidence. Then map the total to a confidence band and a mandated action.
| Total score | Confidence | Reading | Mandated action |
|---|---|---|---|
| 0–2 | Low | Isolated or weak evidence | Monitor — keep collecting, do not react |
| 3–5 | Medium | Multiple corroborating signals | Test — run one counter-message or LP improvement |
| 6+ | High | High-weight signals align across channels | Defend — review budget allocation, protect strategic terms |
The model's job is not to make you certain. It is to make you clear enough to decide. A score of 2 means "interesting, keep watching." A score of 7 means "this is real, allocate a response." Writing the score down also forces honesty: if you cannot get past 2, you do not yet have a story, no matter how alarming one screenshot looked.
Step 3 — Classify the direction, not the dollar amount
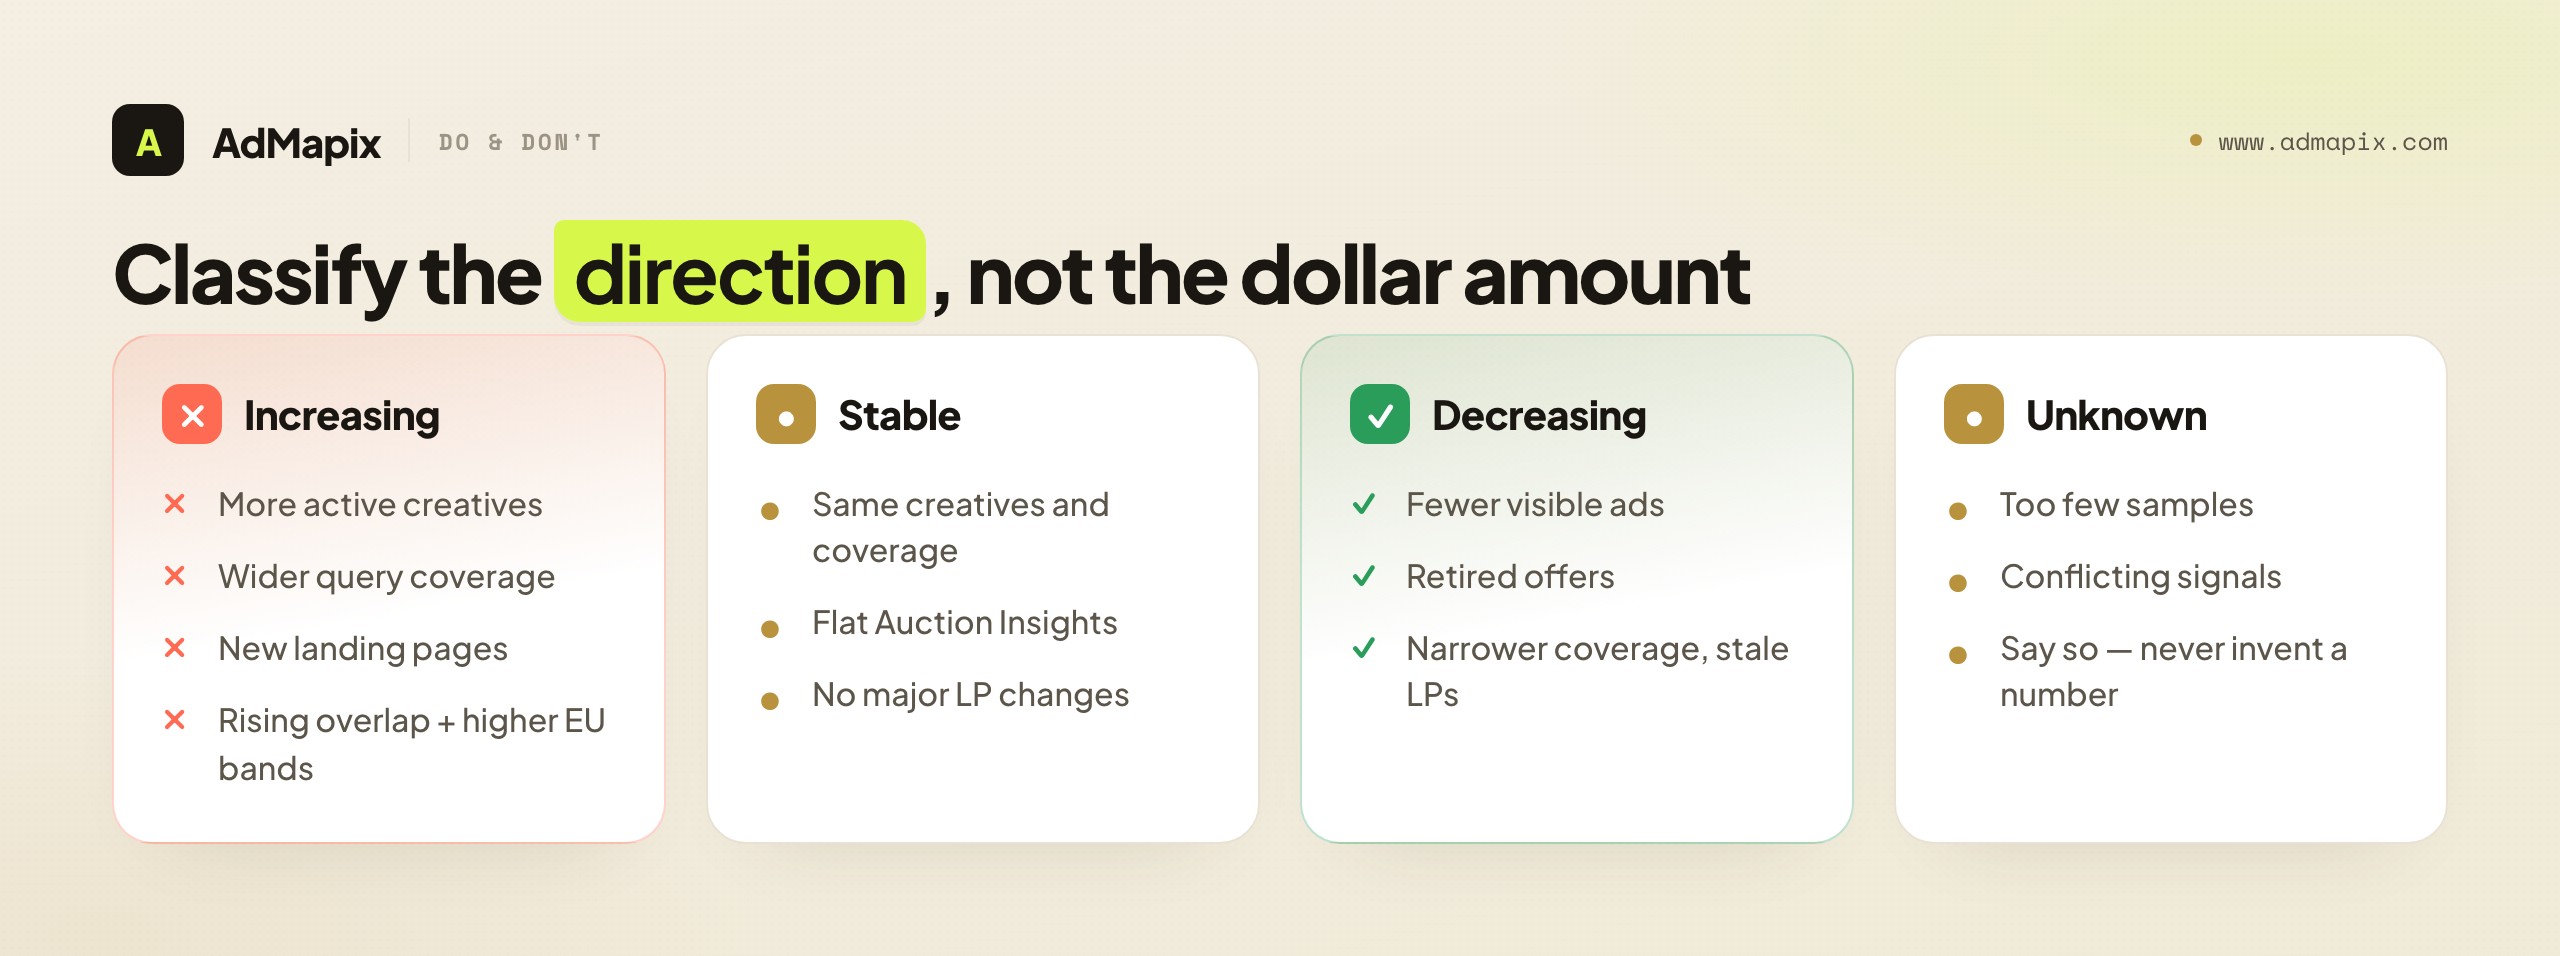
Pair the confidence score with a direction rather than a fabricated figure. Direction is both more honest and more actionable.
| Direction | Evidence pattern |
|---|---|
| Increasing | More active creatives, wider query coverage, new LPs, stronger offers, rising overlap, higher EU bands |
| Stable | Same creatives, same coverage, no major LP changes, flat Auction Insights |
| Decreasing | Fewer visible ads, retired offers, narrower coverage, falling cumulative spend, stale LPs |
| Unknown | Too few samples or conflicting signals — say so explicitly |
"Increasing spend pressure, high confidence" drives a far better decision than "they're spending about $84,000/month" — a number you invented and cannot defend.
8. Worked example 1 — SaaS: a rival defending a benchmark report
Let's run the full method on a B2B SaaS team monitoring a direct rival that just launched a "2026 Industry Benchmark Report."
Evidence collected (one weekly cycle):
| Evidence | Observation | Weight |
|---|---|---|
| Search sampling | Rival appears on 14 of 25 tracked high-intent queries for two straight weeks | 1 |
| Auction Insights | Overlap rate rose from 41% → 58%; your outranking share fell 12 points | 3 |
| EU spend bands | 6 active EU ads on the report; floors sum to €22K, ceilings to €44K (30 days) | 3 |
| Active-ad count | Jumped from 9 to 23 active ads in two weeks | 2 |
| Landing page | New dedicated /2026-benchmark page with utm_campaign paid params | 2 |
| Offer repetition | Same report pushed across search, display, and social | 1 |
Score: 1 + 3 + 3 + 2 + 2 + 1 = 12 → High confidence. Direction: Increasing. EU spend floor: ≈ €22K–€44K on this campaign alone (global is higher — non-EU delivery invisible).
The response — and what NOT to do. A score of 12 mandates defend, but defend does not mean "double the budget tomorrow." A disciplined response:
- Confirm whether your own impression share or conversion rate moved on the same query set (separate your account data from their public data — never blend them).
- Build a counter-message test that does not copy their report angle — proof and differentiation, not imitation.
- Audit your landing-page proof blocks against their dedicated report page.
- Defend brand and top-converting non-brand terms where outranking share slipped.
- Re-run the same evidence next week to confirm the trend holds.
9. Worked example 2 — E-commerce: a DTC brand scaling a seasonal push
Now a DTC e-commerce team watching a rival ahead of a seasonal window.
Evidence collected:
| Evidence | Observation | Weight |
|---|---|---|
| EU spend bands | 14 active EU ads; floors sum to €61K, ceilings to €120K (30 days) | 3 |
| Run-time + impressions | 3 ads in the 100K–500K bucket, live 80+ days = proven winners | (informs reading) |
| Active-ad count | 30 → 55 active ads, heavy video creative | 2 |
| Cumulative 12-mo spend | Advertiser profile figure jumped a full band MoM | 2 |
| Auction Insights | Shopping overlap up; outranking share roughly flat | 1 |
| Offer repetition | Same "bundle + free shipping" offer across all channels | 1 |
Score: 3 + 2 + 2 + 1 + 1 = 9 → High confidence. Direction: Increasing, concentrated on a few proven creatives.
The read: the three 100K–500K ads running 80+ days are the budget. The other 50+ ads are creative testing around them. The right e-commerce response is not to match ad count — it is to study those three winning angles, identify the underserved angle they are not running, and test against it, while ensuring your own proven creatives hold their impression share through the season.
10. Worked example 3 — Mobile app: ambiguous, low-confidence signal
The honest counter-example — because not every investigation produces a confident answer, and pretending otherwise is the cardinal sin.
Evidence collected:
| Evidence | Observation | Weight |
|---|---|---|
| EU spend bands | Rival runs US-only — no EU ads, so no spend bands at all | 0 |
| Impressions buckets | A handful of ads in the 10K–50K range, several with Low Impression badges | (informs reading) |
| Active-ad count | Roughly flat, 8 → 10 ads | 0 |
| Auction Insights | Impression share below 10% on shared terms → report does not render | 0 |
| Search visibility | Appears on 3 of 25 tracked queries, inconsistently | 1 |
Score: 1 → Low confidence. Direction: Unknown.
The read: this is the result your model should sometimes produce. US-only delivery erases the EU bands, sub-10% impression share suppresses Auction Insights, and the Low Impression badges suggest testing rather than scaling. The correct output is "insufficient evidence — monitor only," not a manufactured estimate. Resist the urge to invent a number to satisfy a stakeholder. A clearly-labeled "unknown" is a better deliverable than a confident-sounding fabrication, and it protects your credibility for the calls that do matter.
11. Search, display, social, and landing-page signal alignment
Competitor ad spend becomes believable when signals align across channels. Isolated signals stay weak; aligned signals compound. Here is what to watch per channel and how alignment raises confidence.
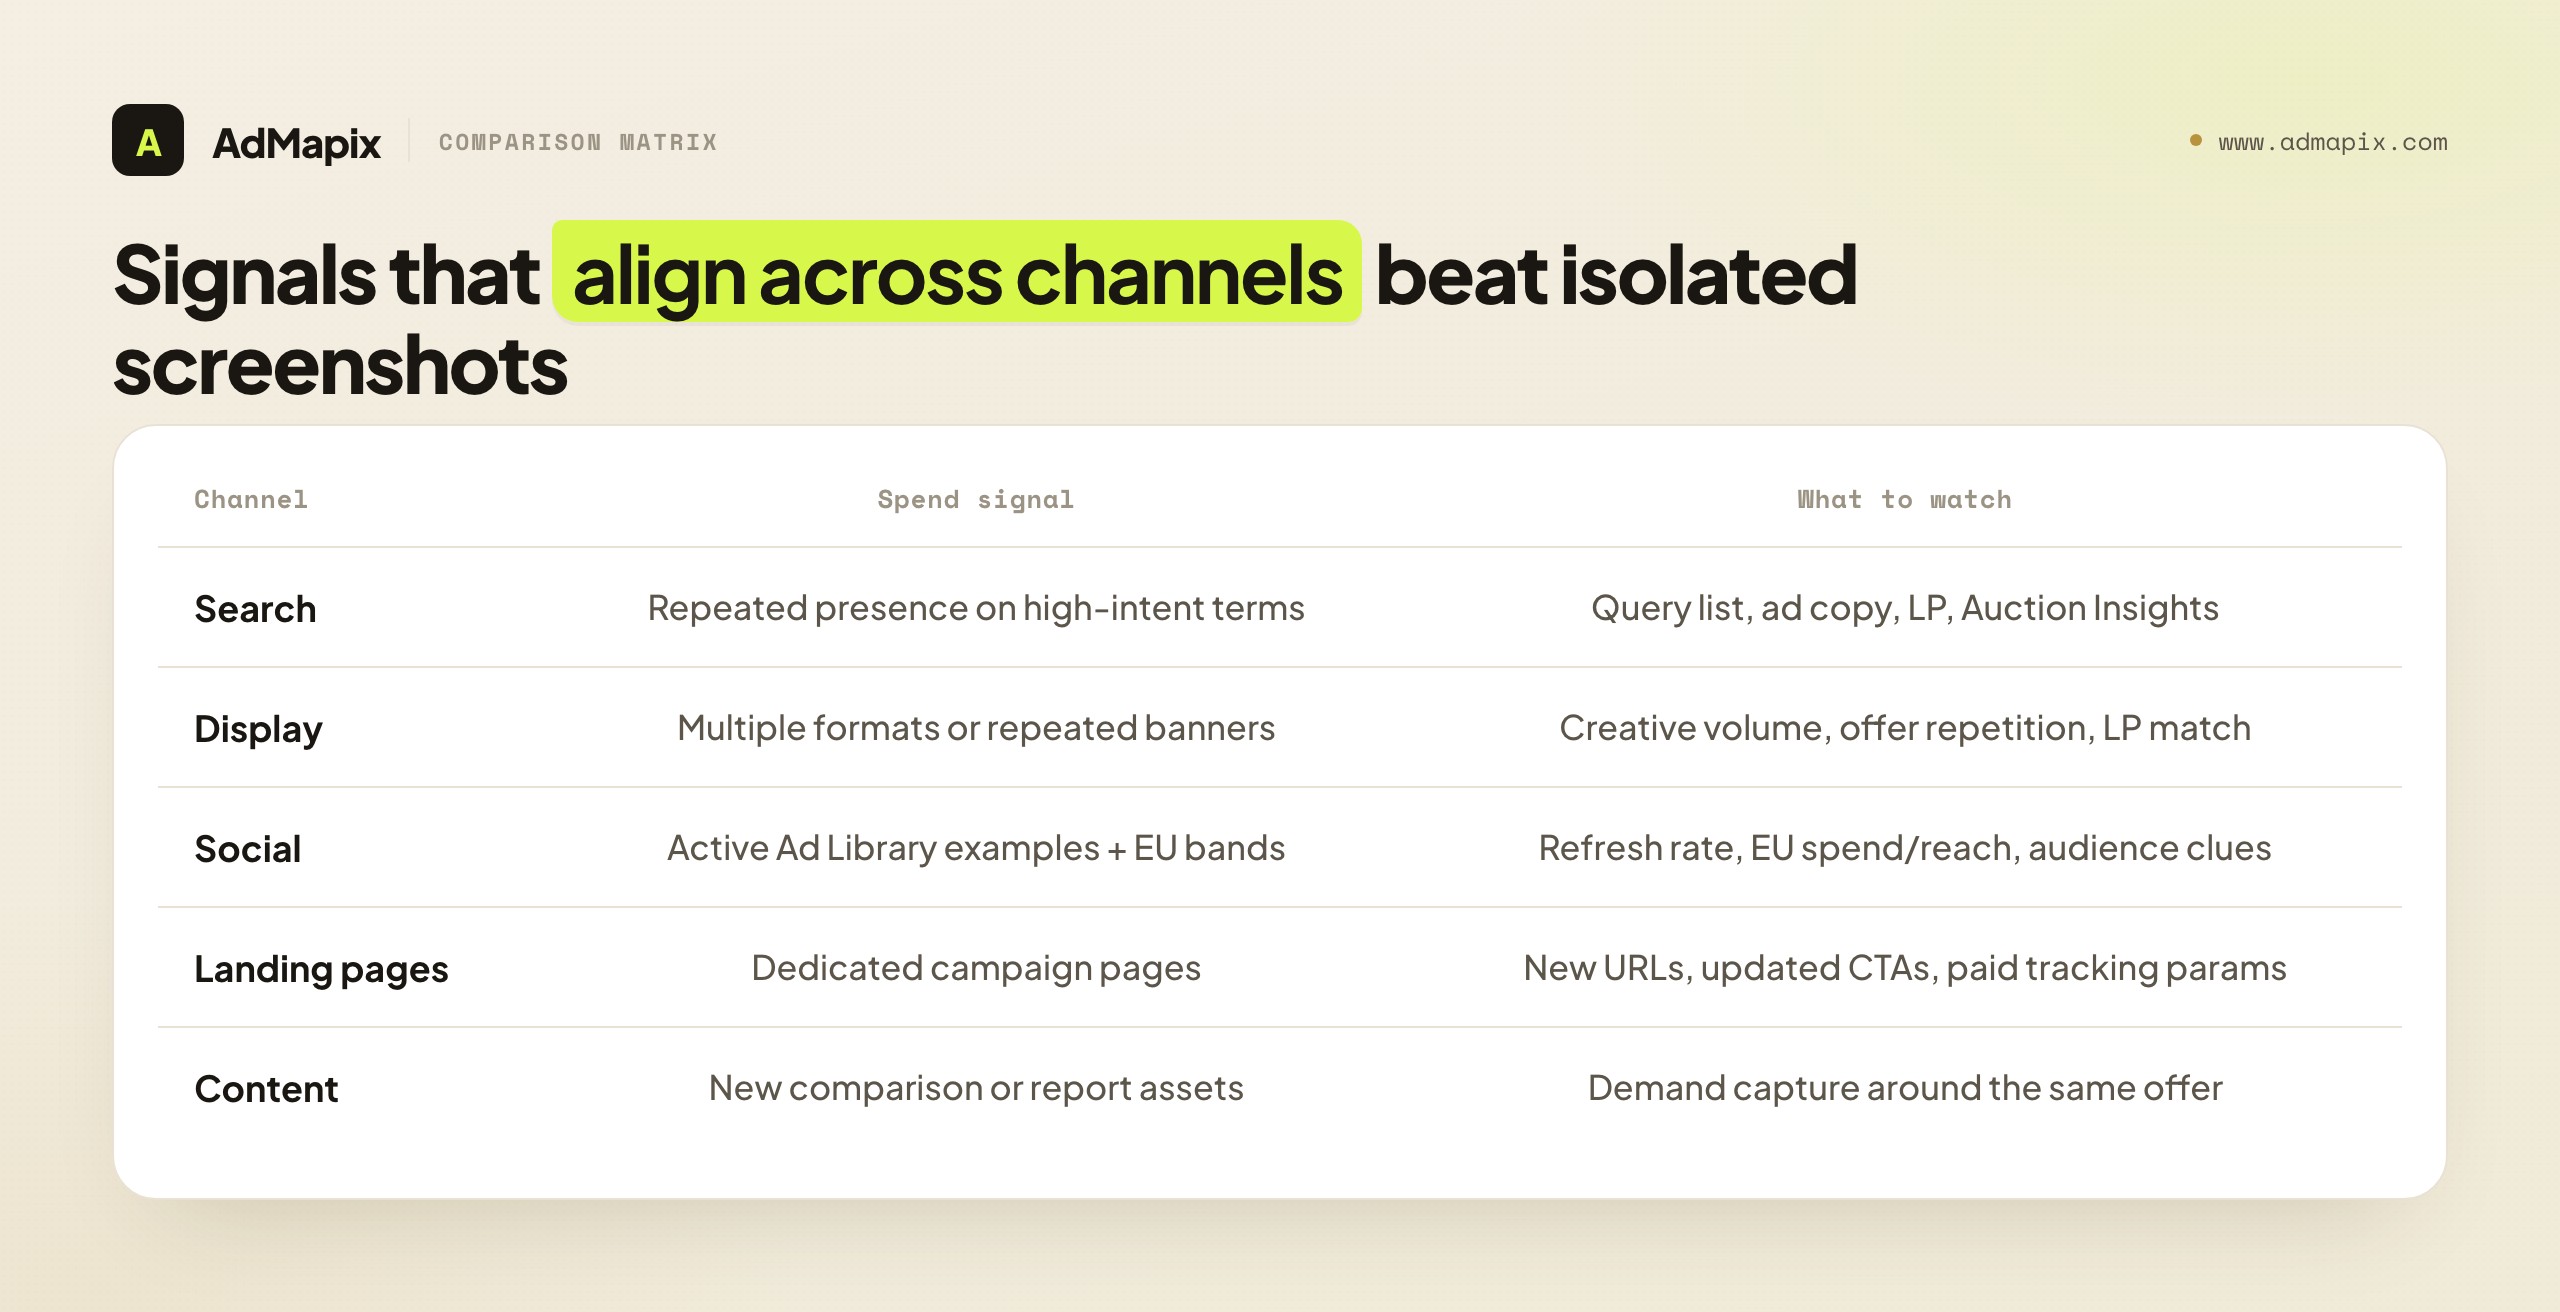
| Channel | Spend signal | What to watch |
|---|---|---|
| Search | Repeated presence on high-intent terms | Query list, ad copy, landing page, Auction Insights movement |
| Display | Multiple formats or repeated banners | Creative volume, offer repetition, landing-page match |
| Social | Active Ad Library examples + EU bands | Creative refresh rate, EU spend/reach, audience clues |
| Landing pages | Dedicated campaign pages | New URLs, updated CTAs, proof blocks, paid tracking params |
| Content | New comparison or report assets | Demand capture around the same offer |
The rule: when search, display, social, and landing pages all push the same offer at the same time, a rival is putting real budget behind a campaign — raise your confidence and your weights. When the signals are scattered and inconsistent, keep the estimate conservative. Alignment is itself a weighted signal in the Section 7 model.
12. Tool category comparison: what each can and cannot show
"Competitor ad spend tool" covers several very different categories, and conflating them is how teams end up disappointed. Here is what each can and cannot actually show, so you buy (or build) against reality.
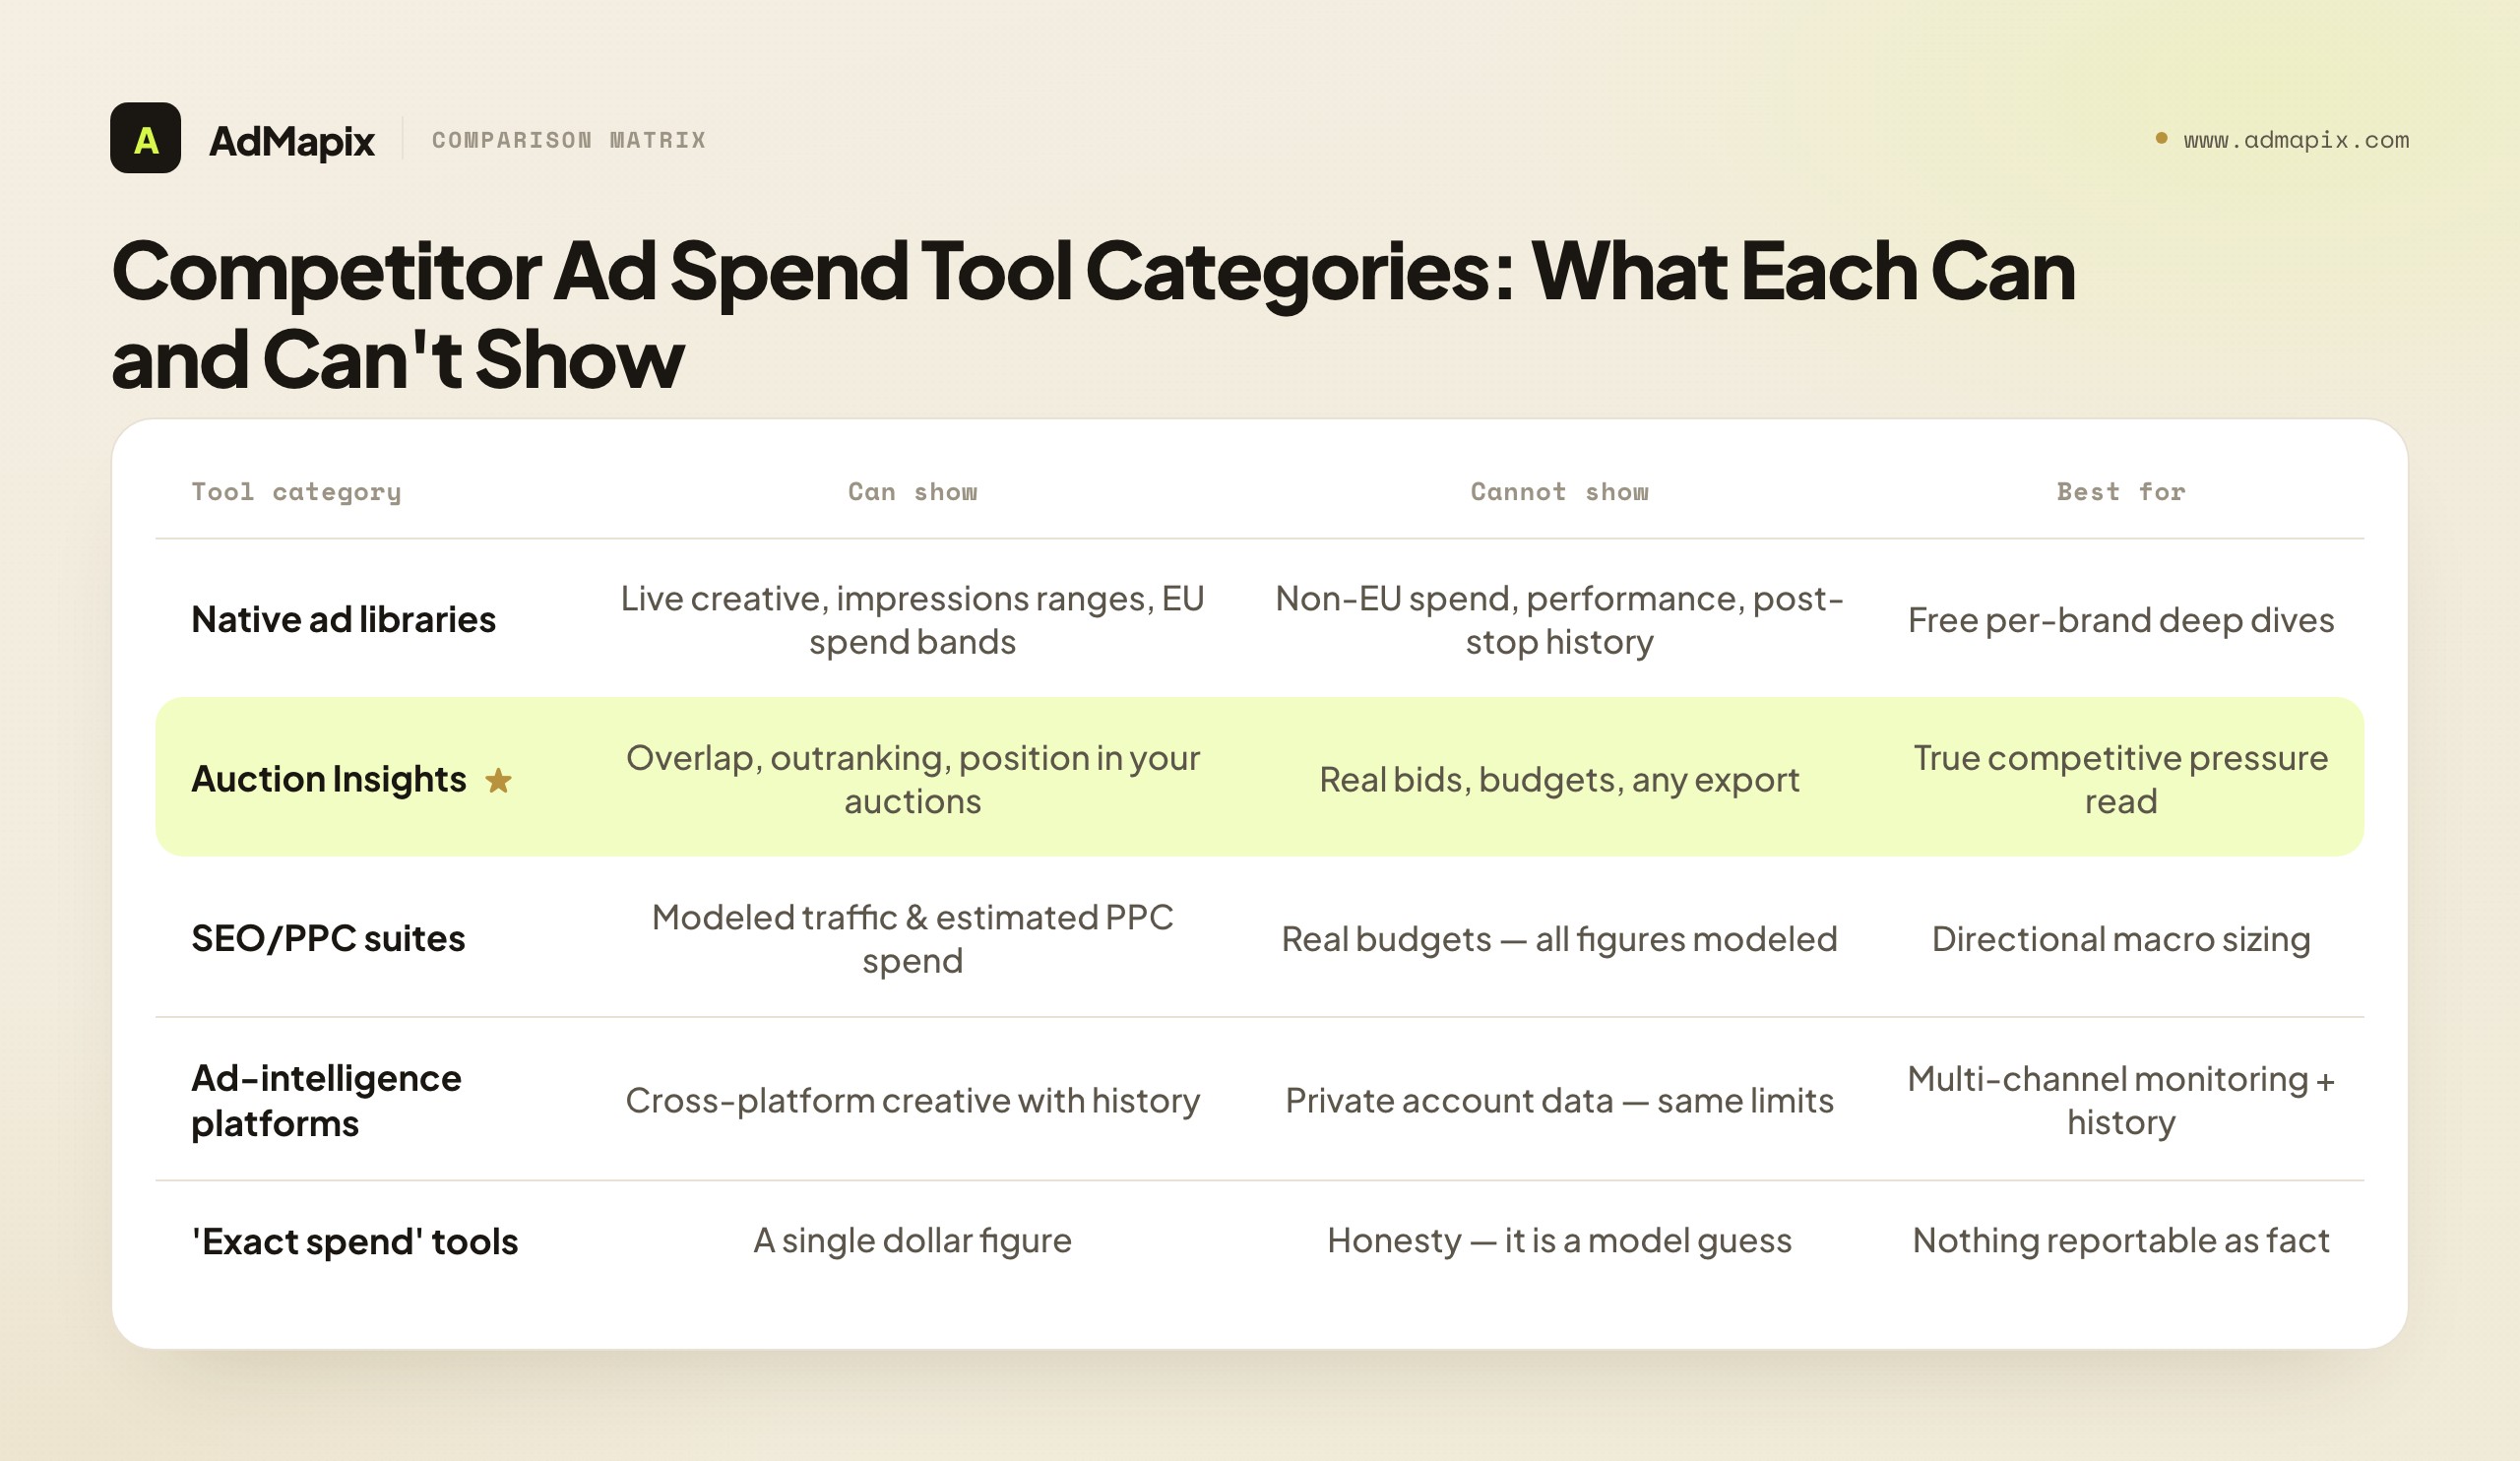
| Tool category | Can show | Cannot show | Best for |
|---|---|---|---|
| Native ad libraries (Meta, Google, TikTok, LinkedIn) | Live creative, impressions ranges, EU spend bands, run-time | Non-EU spend, performance, history after ads stop | Free per-brand deep dives, primary-source evidence |
| Auction Insights (Google native) | Overlap, outranking, position, top-of-page in your auctions | Actual bids, budgets, non-shared auctions, any export | The one true competitive-pressure read in search |
| SEO/PPC suites (SoV-style estimators) | Modeled traffic, estimated PPC spend, keyword overlap | Real budgets — all figures are modeled guesses | Directional macro sizing, keyword gap analysis |
| Ad-intelligence platforms | Cross-platform creative with history, velocity, normalized data | Private account data — same hard limits apply | Multi-channel monitoring, preserving the history natives erase |
| "Exact spend" tools | A single dollar figure | Honesty — the figure is a CPM-model guess sold as fact | Nothing you should report as fact |
Two judgments to carry away. First, the SoV-style "estimated spend" numbers from SEO/PPC suites are modeled — useful for rough macro sizing, dangerous if quoted as real budget. Second, the structural value of an ad-intelligence platform is history and cross-platform consolidation: native libraries erase commercial ads when they stop and silo each network, so the thing you are paying for is a snapshotted, normalized, multi-network record over time — not magical access to private data, which no one has. For side-by-side spy-tool comparisons, see our ad spend tracking and ad tracking & competitive research guides; AdMapix sits in the consolidation layer, normalizing Meta, TikTok, Google, YouTube and more into one searchable workspace.
13. Turning estimates into action without overreacting
The entire point of estimating competitor ad spend is to change a decision you can test — not to create panic in a planning meeting. Map each estimate to a proportionate response.
| Estimate (confidence + direction) | Better action |
|---|---|
| Low-confidence increase | Keep monitoring, collect more samples, do not react |
| Medium-confidence increase | Test one counter-message or landing-page improvement |
| High-confidence increase | Review budget allocation; defend strategic and brand terms |
| Stable spend | Maintain watchlist; focus on your own conversion gains |
| Confident decrease | Look for efficient demand-capture while they pull back |
| Unknown | Say "unknown," widen sampling, do not guess |
The strongest competitive teams treat a confident "increasing" signal as a prompt to test, not to mirror. Copying a rival's offer cedes the initiative; testing a differentiated counter keeps it. If you want a standing evidence trail for these decisions, start with AdMapix reports; if your team needs continuous, multi-platform monitoring, compare pricing.
14. Mistakes to avoid
The failure modes are predictable, which means they are preventable.
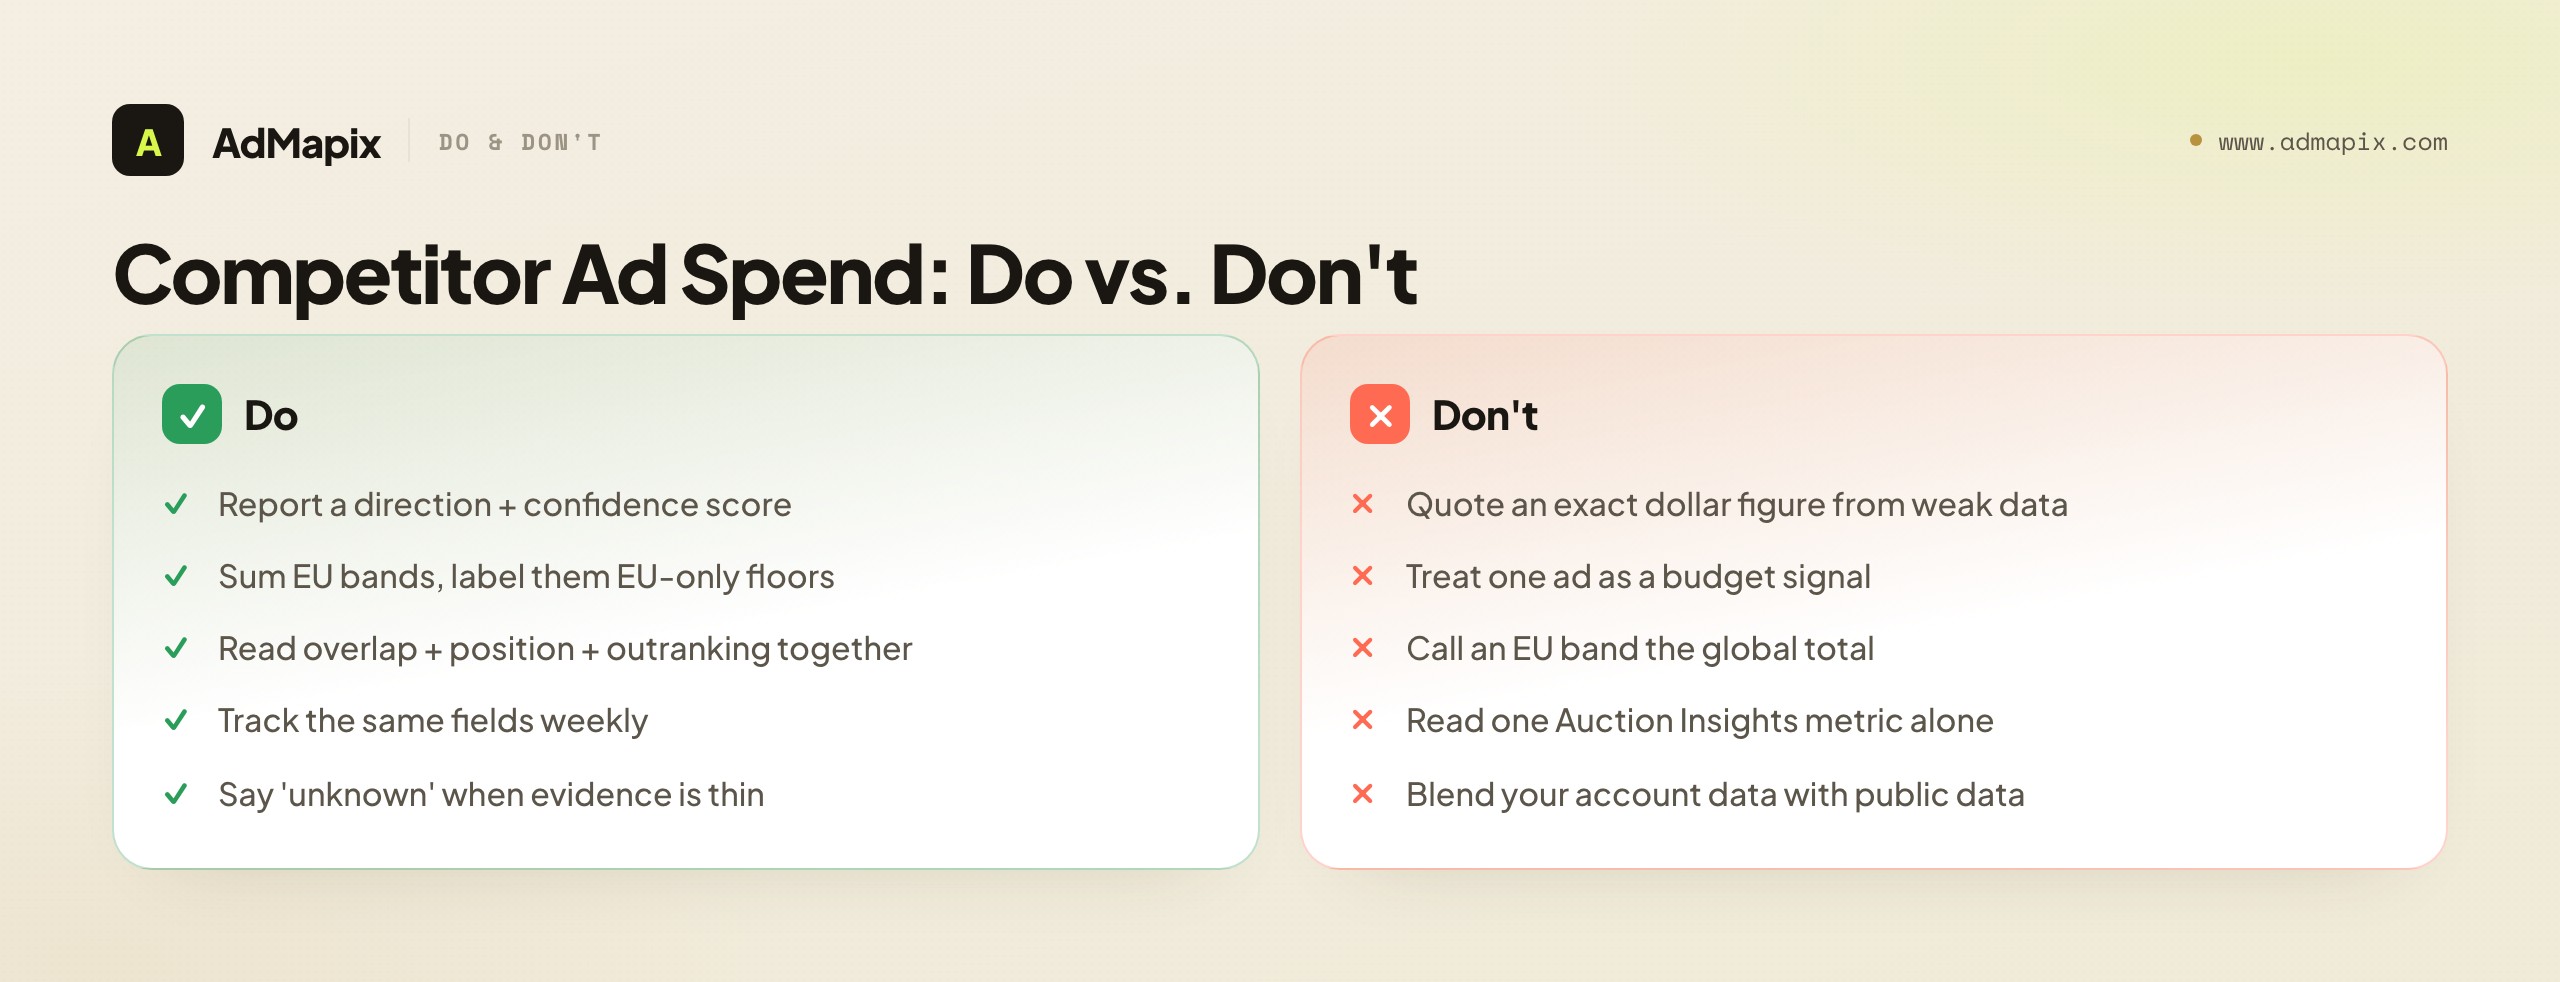
| Mistake | Better approach |
|---|---|
| Reporting an exact dollar spend from weak evidence | Use directional ranges + a confidence score |
| Treating one ad as a budget signal | Require repetition and cross-channel alignment |
| Quoting an EU spend band as the global total | Label it as EU-only — a floor, not the full figure |
| Reading one Auction Insights metric alone | Read overlap + position above + outranking together |
| Assuming higher position = more spend | Check Quality Score first — relevance can outrank bid |
| Blending your account data with public data | Label every source; never mix the two in one estimate |
| Ignoring landing pages | Dedicated, tracked pages reveal campaign seriousness |
| Assuming visibility = profitability | Visibility says nothing about ROI — that's invisible |
| Manufacturing a number to satisfy a stakeholder | A labeled "unknown" beats a confident fabrication |
| Doing it once and stopping | Monitoring is a weekly habit, not a screenshot |
15. Putting it together: the end-to-end workflow
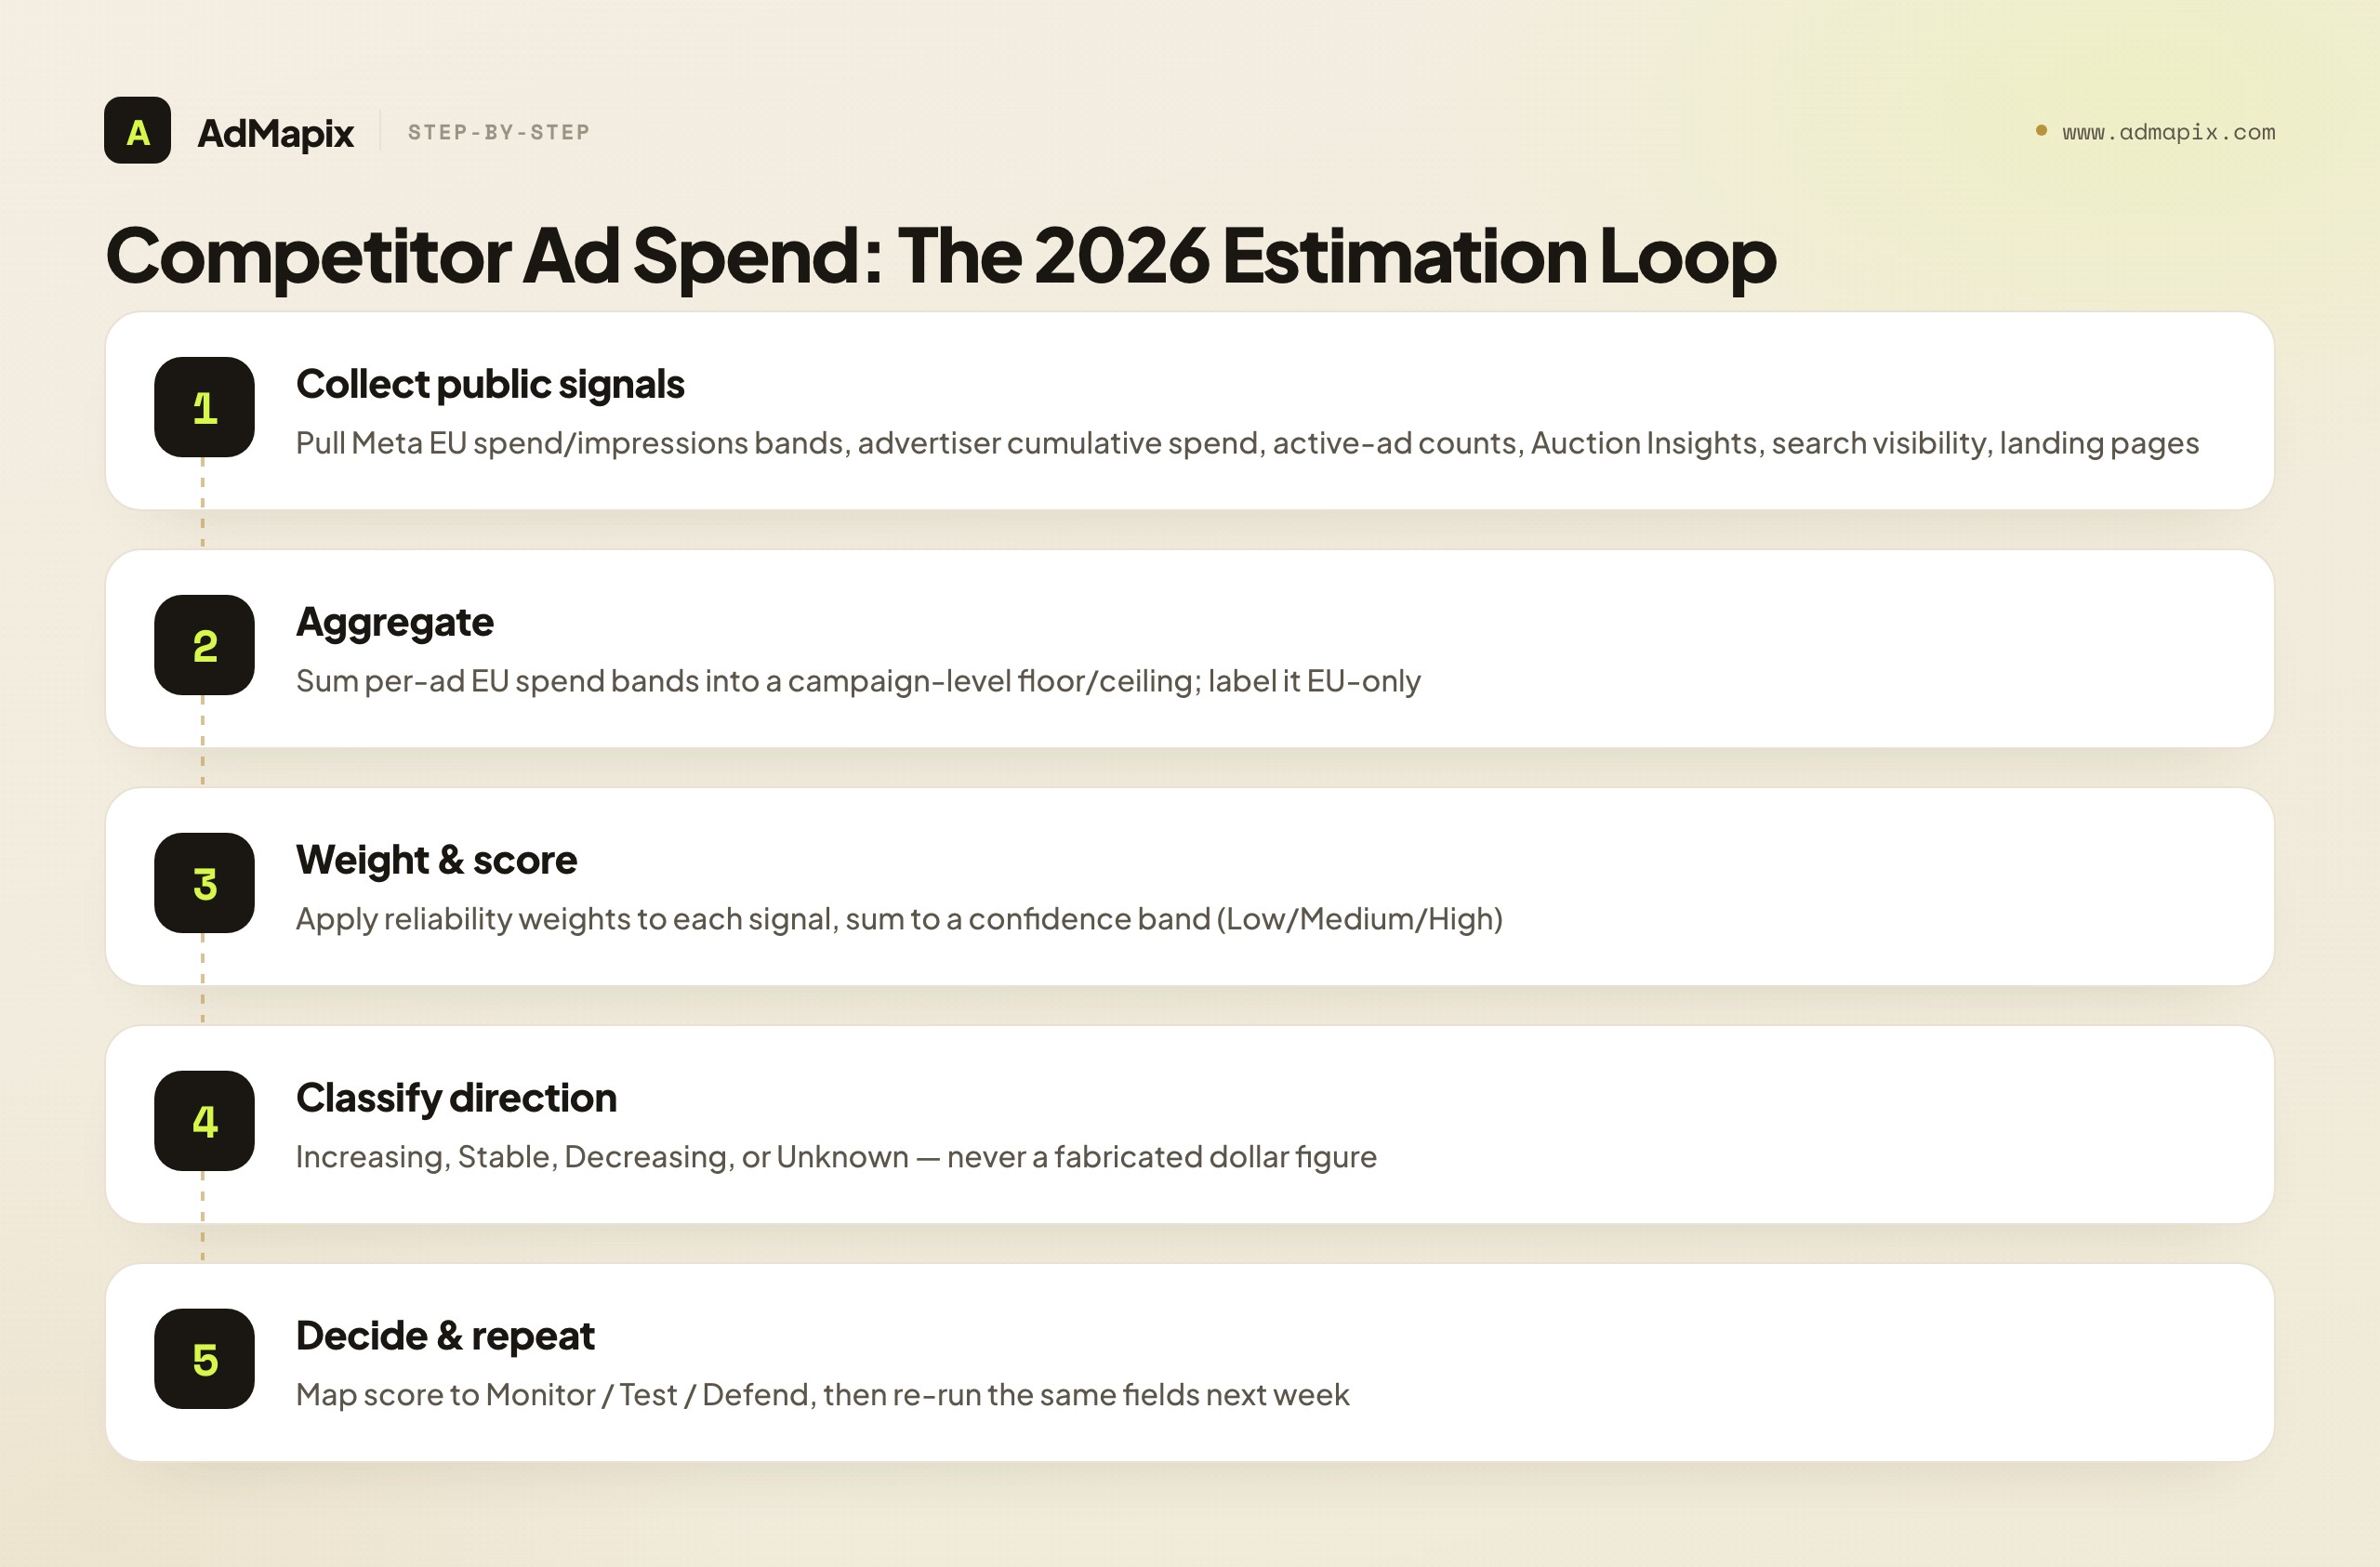
Here is the whole method as one loop you can hand to an analyst.
- Collect — Pull EU spend/impressions bands (Meta), advertiser cumulative spend, active-ad counts, Auction Insights metrics, search visibility, and landing-page evidence on a fixed weekly cadence.
- Aggregate — Sum per-ad EU bands into a campaign-level magnitude; record the floor/ceiling and label it EU-only.
- Weight — Apply the Section 7 weights to every signal you can evidence.
- Score — Sum to a confidence band (Low / Medium / High) and classify direction (Increasing / Stable / Decreasing / Unknown).
- Decide — Map the score to monitor, test, or defend. Keep the response proportionate.
- Repeat — Re-run the same fields next cycle. Trends, not snapshots, are what map to budgets.
Run that loop for a quarter and you will have something most competitors never build: a disciplined, evidence-backed, honestly-labeled history of every rival's spend trajectory — the asset that turns "I think they're spending more" into "their EU spend floor rose a band, overlap is up 17 points, and outranking share fell 12 — high confidence, defend."
FAQ
Can I see competitor ad spend exactly?
No. Exact competitor ad spend, bids, daily budgets, conversion rates, and ROAS are private and not visible from outside their ad accounts. The closest you get is EU spend ranges per ad (under DSA rules, for EU-delivered ads only) and advertiser-level cumulative 12-month spend ranges on Meta profile pages. Both are bands, not exact figures, and both are EU-or-range-scoped. Treat any tool promising an exact number as selling a CPM-model guess.
How do I estimate competitor ad spend in 2026?
Combine public signals and score your confidence: read Meta Ad Library impressions and EU spend ranges (sum the per-ad bands across a campaign), watch Google Auction Insights (overlap, outranking share, position above rate) for shared-auction pressure, track active-ad counts and advertiser cumulative spend over time, and check landing-page and offer alignment across channels. Weight each signal, sum to a confidence score, and report a direction (increasing/stable/decreasing), not a fabricated dollar amount.
How do I read Meta Ad Library impressions and spend ranges?
On each ad card, the impressions range bucket (under 1K → 1M+) shows now for all ads globally. For ads delivered in the EU, click into the ad's detail / EU transparency panel to find the spend range, total EU impressions, date range, and reach demographics — these exist only for EU delivery under DSA rules and are always ranges. To size a campaign, sum the lower and upper bounds of every live ad's spend band and report the total as an EU-only floor on global spend.
How do I check a competitor's Google Ads budget?
You cannot check the exact budget directly. The strongest proxy is Auction Insights in your own Google Ads account: rising overlap rate plus rising position above rate plus falling outranking share against a rival indicates escalating spend or quality pressure on the auctions you share. Note that Auction Insights only renders when your own impression share is ≥ 10%, only covers shared auctions, and (since August 24, 2024) cannot be exported to third-party BI tools.
What is ad spend monitoring and how is it different from a one-time check?
Ad spend monitoring is a repeatable weekly process that tracks the same fields (active-ad counts, EU spend bands, Auction Insights metrics, cumulative spend, landing pages) on the same cadence against the same query list. Because it measures change over time, it maps to real budget shifts in a way a single screenshot never can. A one-time check is a snapshot; monitoring is the trend that actually drives decisions.
Which signals are most reliable for ad budget tracking?
The two highest-reliability signals are EU spend/impressions bands (Meta, for EU-delivered ads) and Auction Insights movement (Google, for shared auctions). Next come advertiser cumulative spend and active-ad count over time. Search visibility, creative volume, landing-page investment, and offer repetition are useful corroboration but rarely decisive alone. Confidence rises sharply when multiple independent signals point the same direction.
How do EU transparency rules change what I can see?
The EU Digital Services Act (Article 39) forces Meta to disclose, for any ad delivered in the EU, an estimated spend range, total impressions range, reach demographics, and targeting parameters, retained for one year after the ad's last impression. This is why EU-targeted ads expose budget signals that US-only ads do not. If a rival runs in Germany, France, or Spain, you get spend bands; if they run US-only, you only get the impressions bucket.
How often should I monitor competitor ad spend?
Weekly for active, competitive categories; bi-weekly for moderate ones; monthly for slow B2B or niche markets. Whatever cadence you pick, hold the query list and evidence fields constant every cycle — changing your measurement set destroys the period-over-period comparison that gives monitoring its value.
Can ad-intelligence tools show me data the native libraries can't?
Not private data — no tool can see bids, budgets, conversion rates, or ROAS. What ad-intelligence platforms add is history (native libraries erase commercial ads when they stop running) and cross-platform consolidation (one searchable workspace across Meta, TikTok, Google, YouTube, and more, instead of tab-hopping). They preserve and normalize public signal over time; they do not unlock private accounts.
What is the single biggest mistake in competitor ad spend research?
Manufacturing a confident dollar figure from weak evidence. A made-up number invites panic or false comfort and destroys your credibility when it proves wrong. The disciplined alternative is a labeled directional estimate — "increasing spend pressure, high confidence, EU floor ≈ €40K–€70K" — or an honest "unknown" when the evidence is too thin. Direction plus confidence beats a fake precision every time.
Conclusion
Competitor ad spend research is genuinely valuable — but only when it is disciplined. The 2026 reality is that you have more public signal than ever (EU spend bands, all-ad impressions ranges, cumulative advertiser spend, Auction Insights) and zero access to the private numbers that everyone secretly wants. The teams that win are the ones who stop chasing the exact figure and instead collect public evidence, aggregate the EU bands, weight the signals, score confidence, classify direction, and choose a proportionate response — every week.
Do that consistently and "what is our competitor spending?" stops being a guessing game and becomes a question you can answer with evidence and a confidence label attached.
If you want a recurring, normalized evidence trail across every major ad network, start with AdMapix reports. If your team needs ongoing, multi-platform competitor ad spend monitoring, compare pricing.
Related reading
- Ad spend tracking — the recurring monitoring workflow
- Track competitor Facebook ad spend
- Facebook Ads Library 2026: complete guide
- Google Ads competitor analysis
- Competitor PPC ads research
- Ad tracking & competitive research
Authoritative sources
- Meta Ad Library — https://www.facebook.com/ads/library/
- Meta Ad Library help (EU transparency, impressions, spend) — https://www.facebook.com/business/help/2405092116183307
- Google Ads Auction Insights help — https://support.google.com/google-ads/answer/2579754?hl=en
- Google Ads Transparency Center — https://adstransparency.google.com/
- Google Ads budget report help — https://support.google.com/google-ads/answer/10486637?hl=en
- EU Digital Services Act (Article 39 overview) — https://digital-strategy.ec.europa.eu/en/policies/digital-services-act-package
See what competitors are really running
Search 6M+ ad creatives, landing pages, and weekly spend across 200+ countries. No credit card, no commitment.
Related Articles

KaloData vs FastMoss: Which TikTok Commerce Tool Fits Your Workflow?
A decision-first comparison of KaloData and FastMoss for TikTok Shop analytics, with where AdMapix adds ad creative evidence.
FastMoss Alternative: TikTok Commerce Data vs Creative Intelligence
A decision framework for choosing a FastMoss alternative based on whether you need TikTok commerce data or competitor ad creative intelligence.
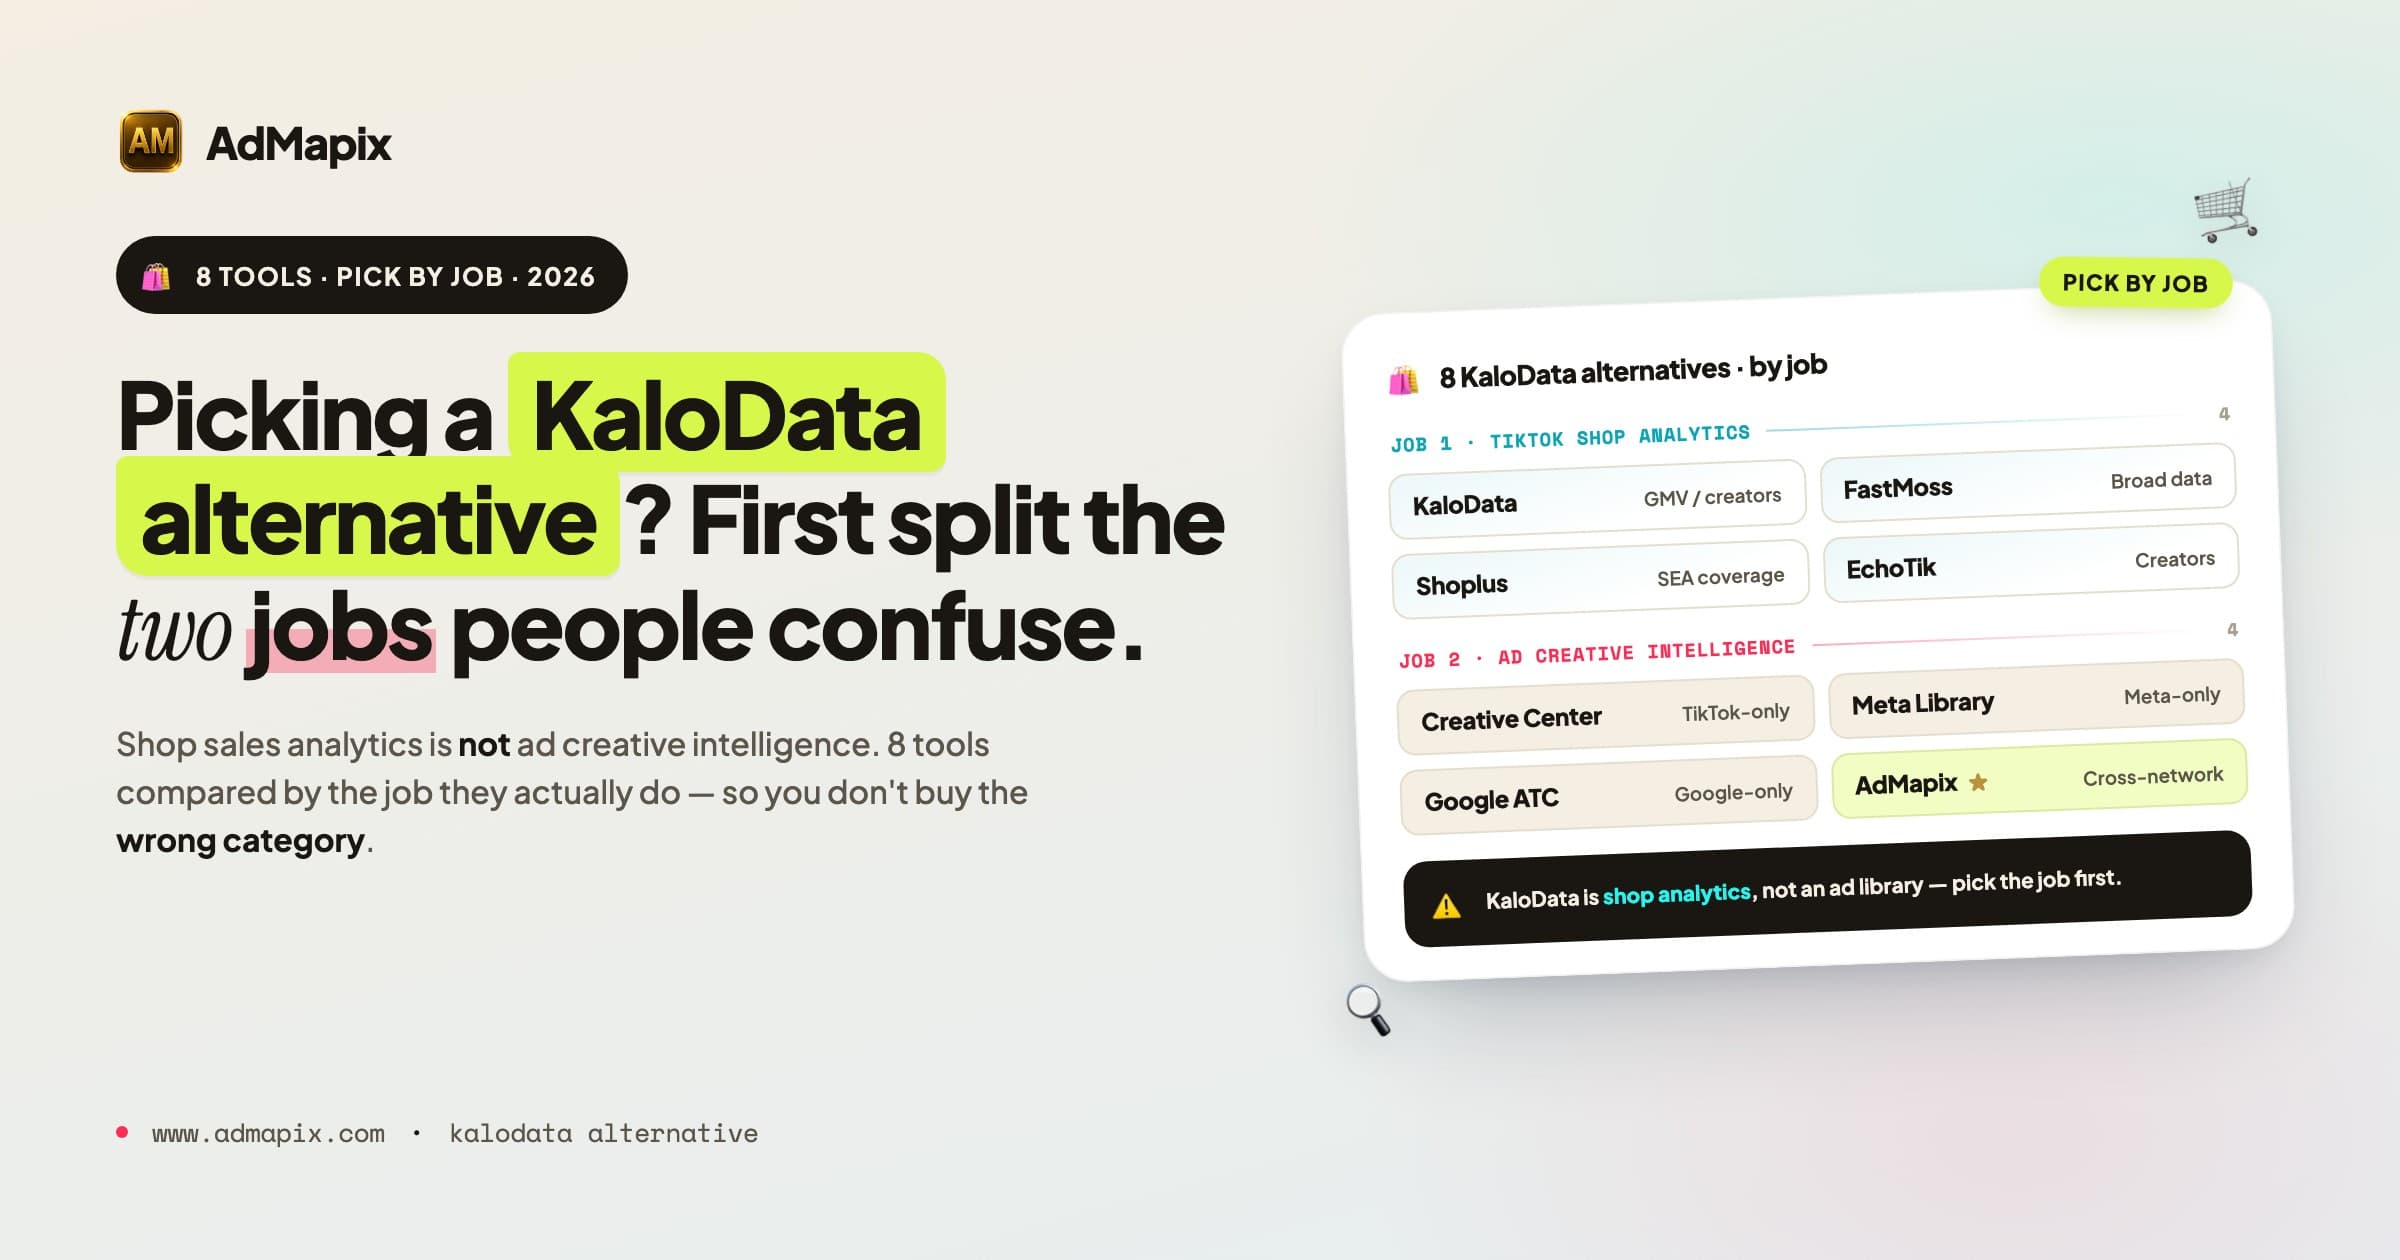
KaloData Alternatives in 2026: 8 TikTok Shop & Ad Research Tools Compared
A 2026 guide to KaloData alternatives: how to pick by job, a side-by-side comparison of TikTok Shop analytics and competitor ad-intelligence tools, pricing context, migration tips, and where AdMapix fits.