How to Monitor Competitors' Facebook Ad Spend in 2026 (3 Methods + Worked Example)
Non-political Meta ad spend is not publicly visible. Here are three defensible inference methods, a worked $10M DTC example, and the 2026 EU cumulative-spend rollout explained.

By the AdMapix Research Team · Updated April 16, 2026
Non-political Facebook ad spend is not directly visible in Meta's Ad Library — except for the new 2026 advertiser-profile rollout showing 12-month cumulative spend bands for ~37,991 EU commercial advertisers. For everyone else, the answer is inference. Here are three defensible estimation methods (impressions × eCPM, variant × production cost, triangulation bands), a worked $10M DTC example, and why "bands, not points" is the right accuracy target in 2026.
If you have been asked the innocent-sounding question "how much is Competitor X spending on Meta?" you know the honest answer: nobody outside that competitor's finance team knows the exact number. What you can do — and what this article teaches — is produce a defensible spend band that survives scrutiny from a media buyer, a board member, or an M&A diligence team. We have estimated hundreds of competitor budgets this way, and the methodology below is the one we trust when a real decision rides on the number.
The Honest Truth: Non-Political Facebook Ad Spend Is NOT Directly Visible
Meta's Ad Library was designed for political and social-issue transparency, not commercial transparency. When a US senator runs a campaign ad, you see exact spend, impressions, and demographic breakdown. When a DTC skincare brand runs a $2M/month feed campaign in the same library, you see creatives, run dates, and nothing about the money.
Every "Facebook ad spend tracker" article from 2024 and 2025 glossed over this. In 2026 it matters more, because AI-generated "spend reports" confidently hallucinate dollar figures that are mathematically impossible to know. Practitioners deserve the honest version: commercial ad spend is an inference problem, and the accuracy ceiling is plus or minus 30 to 50 percent regardless of which tool you use. Still useful — but only if you stop pretending it is precise.
The one exception is the cumulative-spend feature Meta rolled out in April 2026 for large EU commercial advertisers. No monthly granularity, no campaign breakdown, and only ~37,991 brands covered. But for those brands, you finally get a Meta-disclosed number — and the triangulation math changes meaningfully.
What Meta Ad Library DOES Show
Before we get to inference, let's be precise about what is actually in the library. For any commercial advertiser worldwide, the Ad Library exposes the following fields, and our inference methods lean heavily on them:
- Ad creative (image, video, carousel) and copy, including the call-to-action button.
- Run dates — when the ad started, whether it is still active, and total run days.
- Platform placement — Facebook feed, Instagram feed, Reels, Stories, Messenger, Audience Network. Critical for eCPM calibration.
- Variant count — how many versions of a creative concept are running. A strong creative-velocity signal.
- Page transparency — page creation date, name changes, admin country.
- EU/UK impression and spend ranges — mandated by the Digital Services Act for any ad served to EU users. These come in bands like "1M–2M impressions" and "€10K–€20K spend".
- Beneficiary and payer fields — who ultimately paid for the ad and who benefits, which is how you untangle multi-account spend.
Outside the EU, there is no spend number at all for commercial ads. Not a range, not a band, nothing. If your competitor only runs in the US, you get creative, run dates, and placement. Everything else is inference. This is why practitioners who only look at US data say "there's no data here" — they are not wrong, and the inference stack below is the answer.
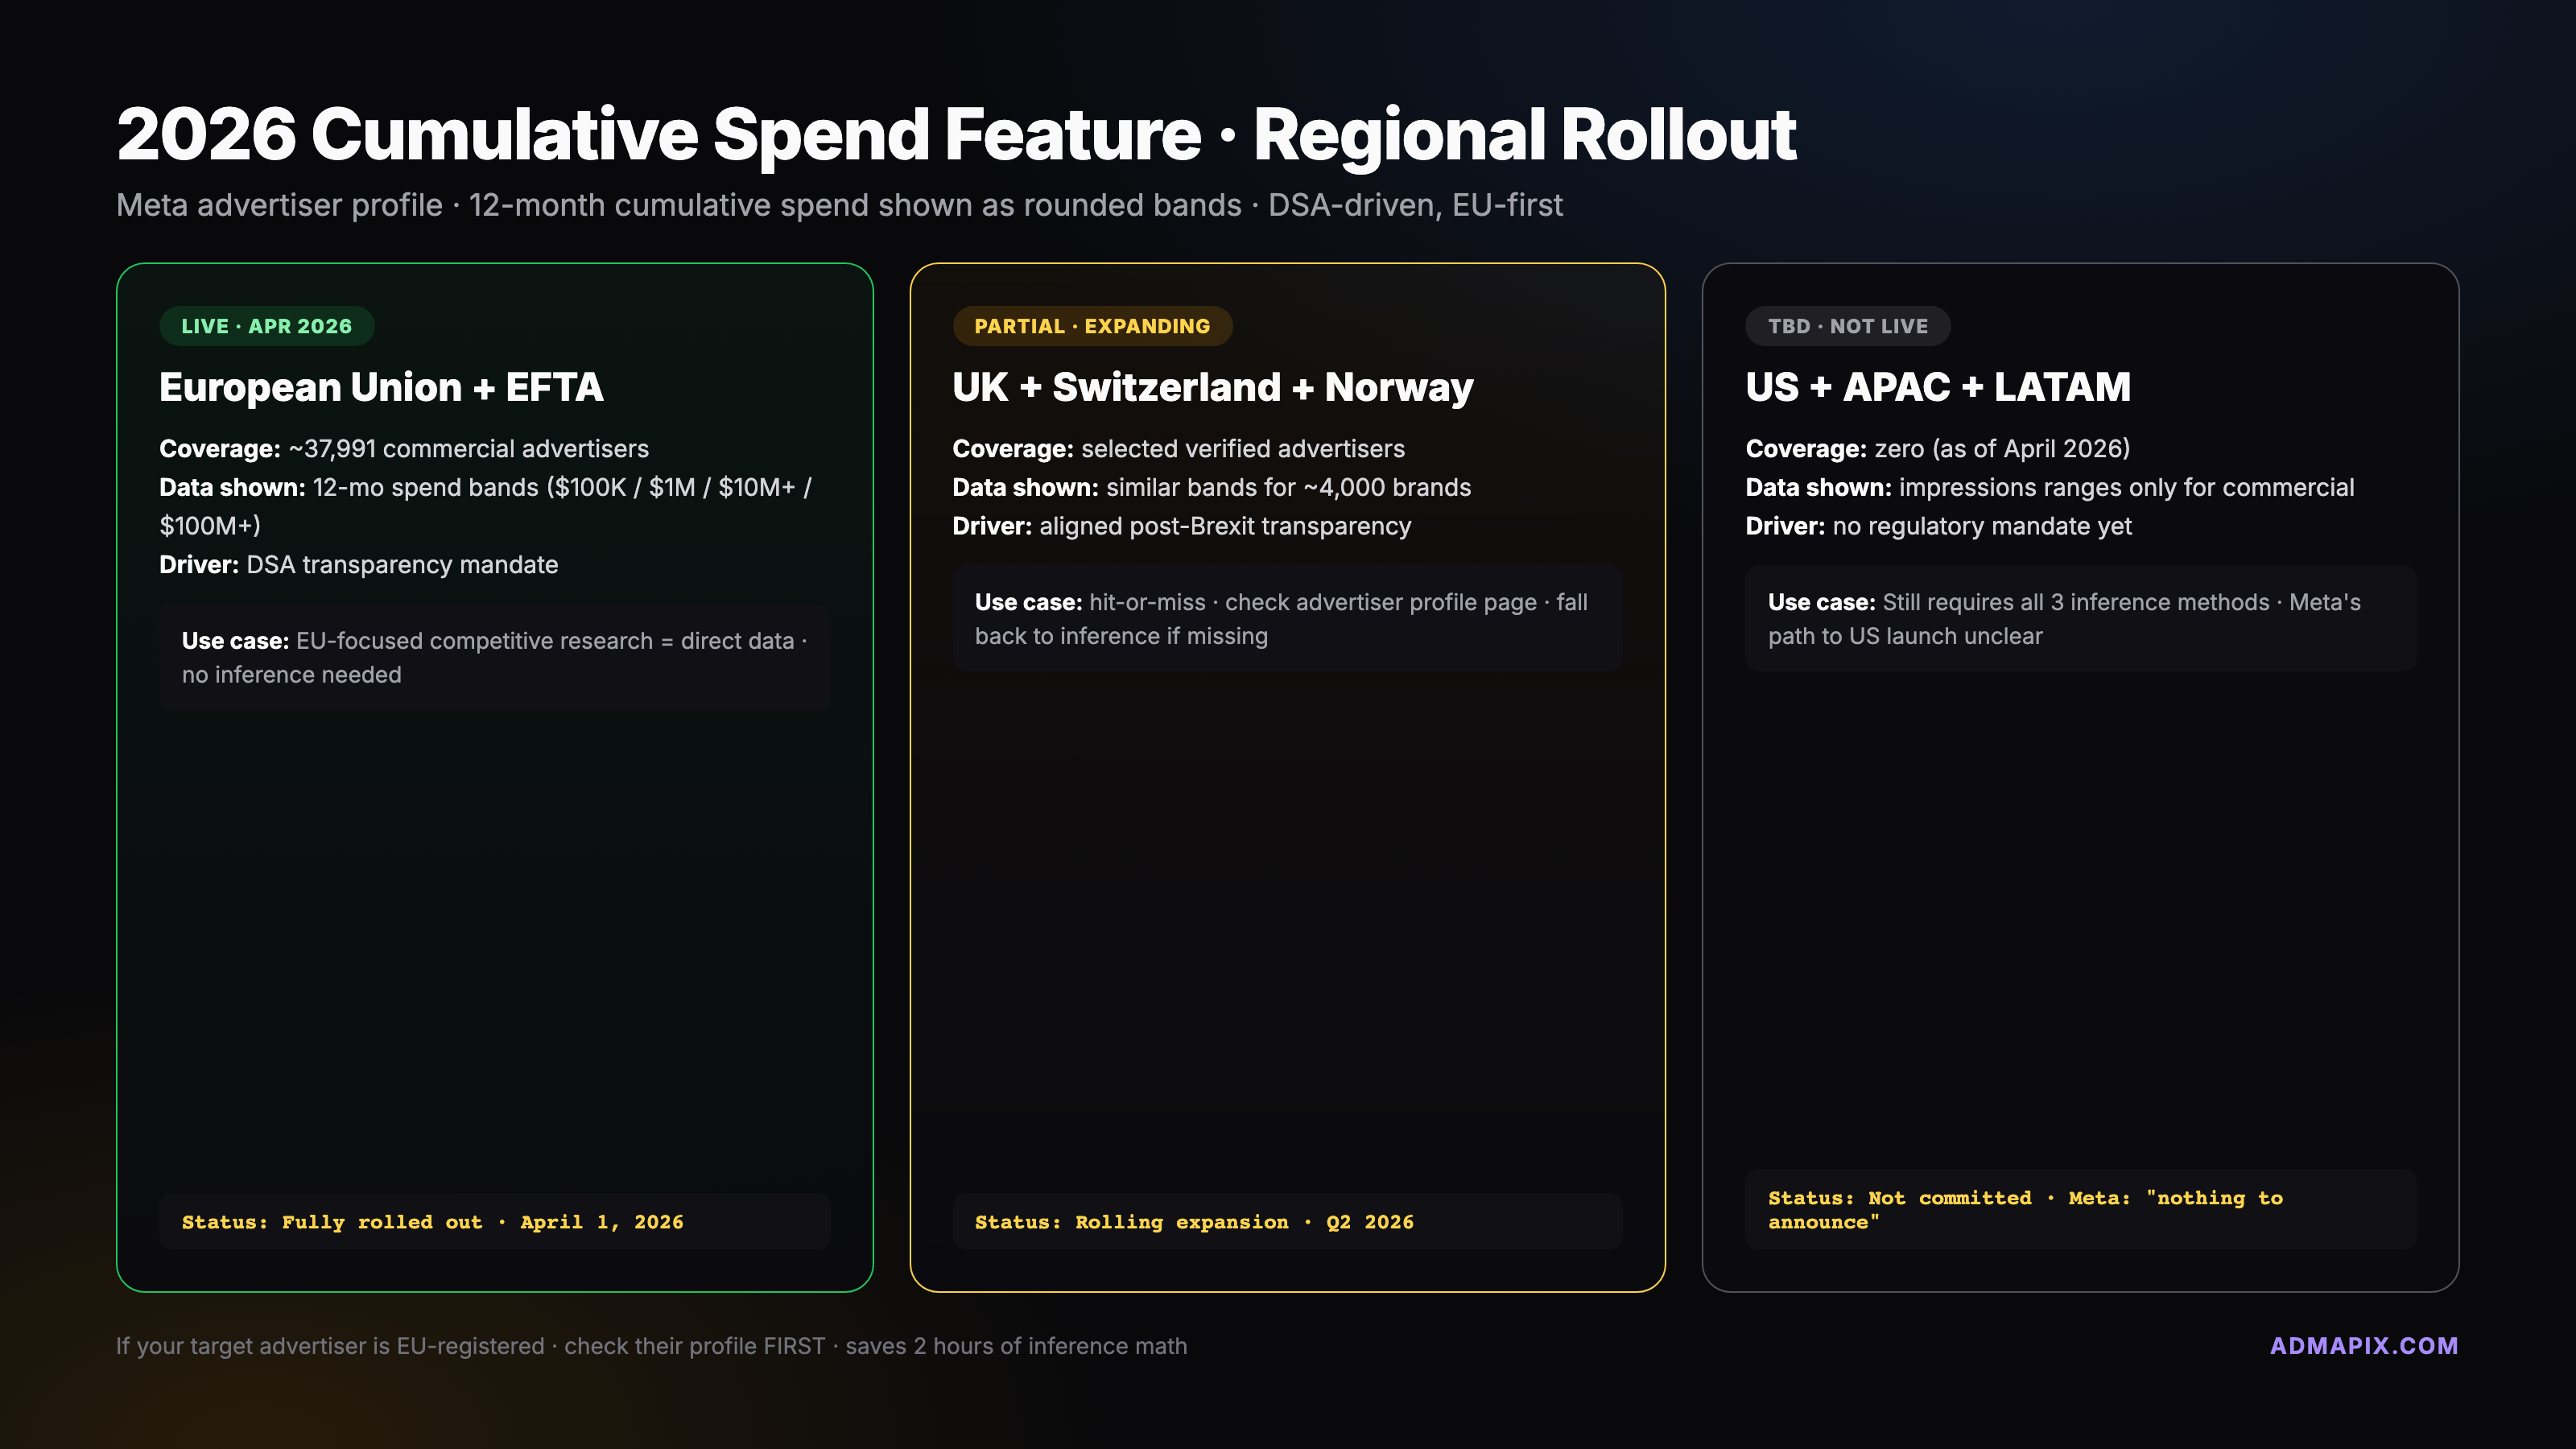
The 2026 Cumulative Spend Feature — Deep Dive
April 2026 is the first time Meta has voluntarily disclosed commercial spend at the advertiser level. Here is what rolled out, based on our sampling of ~200 advertiser profiles:
Where it appears. Go to the advertiser's Facebook Page, click "Page transparency" or open their Ad Library profile directly. On roughly 37,991 EU commercial advertisers, you will see a "Total spend in the last 12 months" tile.
Rounded bands, not exact dollars. Bands look like "€100,000 – €1,000,000", "€1,000,000 – €10,000,000", and "€10,000,000+". For very small advertisers, the feature does not appear.
EU-first, global TBD. Driven by the Digital Services Act. Meta has not committed to US or global expansion. The UK likely joins within 12 months; US commercial disclosure is unlikely without legislation.
What it doesn't give you. No monthly granularity, no per-campaign breakdown, no creative-level attribution, no quarter-over-quarter delta (yet). You have to screenshot monthly to track changes yourself. No product-line split — a brand selling skincare and home goods shows one combined number.
Even with those limits, a Meta-blessed floor number is a huge triangulation anchor. When our inference puts a brand at $25M–$40M and the Meta feature shows "€10M+", we know we are in the right order of magnitude. When inference disagrees with the Meta band, check your assumptions — not Meta's disclosure.
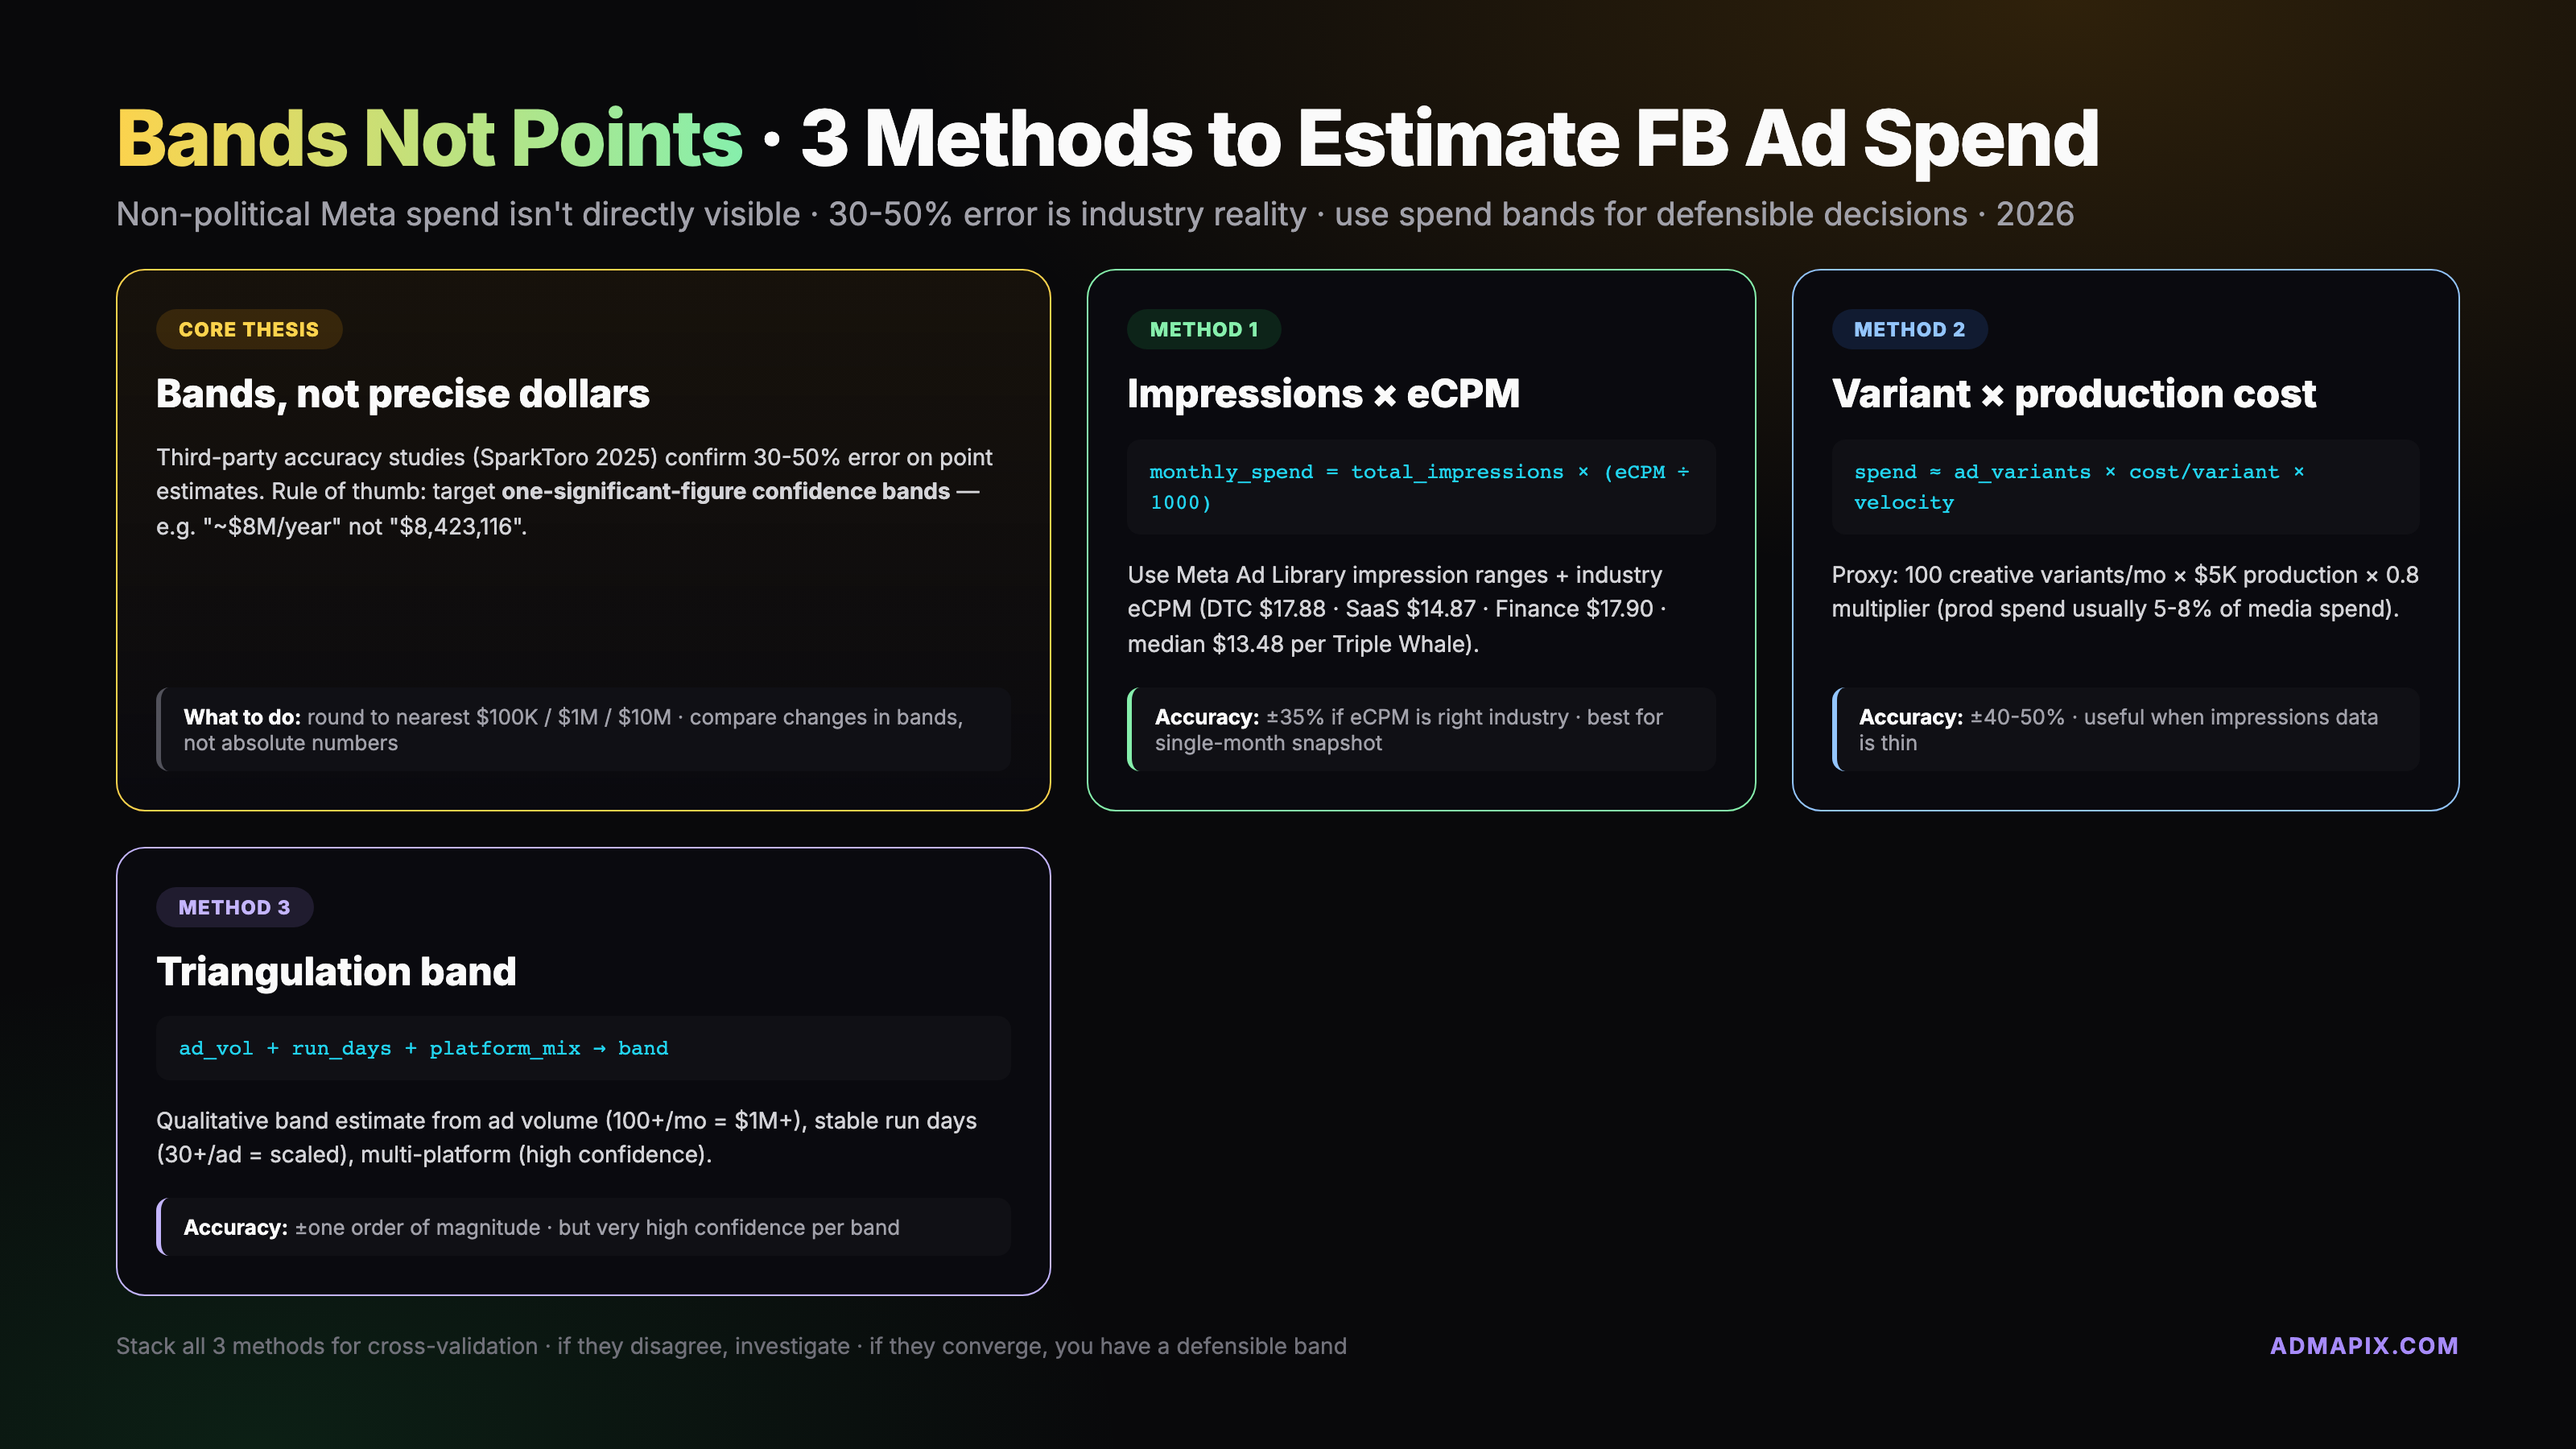
The Three Inference Methods
Every defensible competitor spend estimate we produce uses at least two of these three methods and reconciles between them. None is accurate enough alone.
Method 1 — Impressions × eCPM Industry Benchmark
Description. Take the EU impression range from the Ad Library (DSA-mandated), extrapolate to global, and multiply by an eCPM benchmark for the advertiser's vertical. The most commonly cited method, and the most frequently misused.
Formula.
Monthly spend ≈ (sum of ad impressions midpoint / 1000) × vertical eCPM × active-ad factor
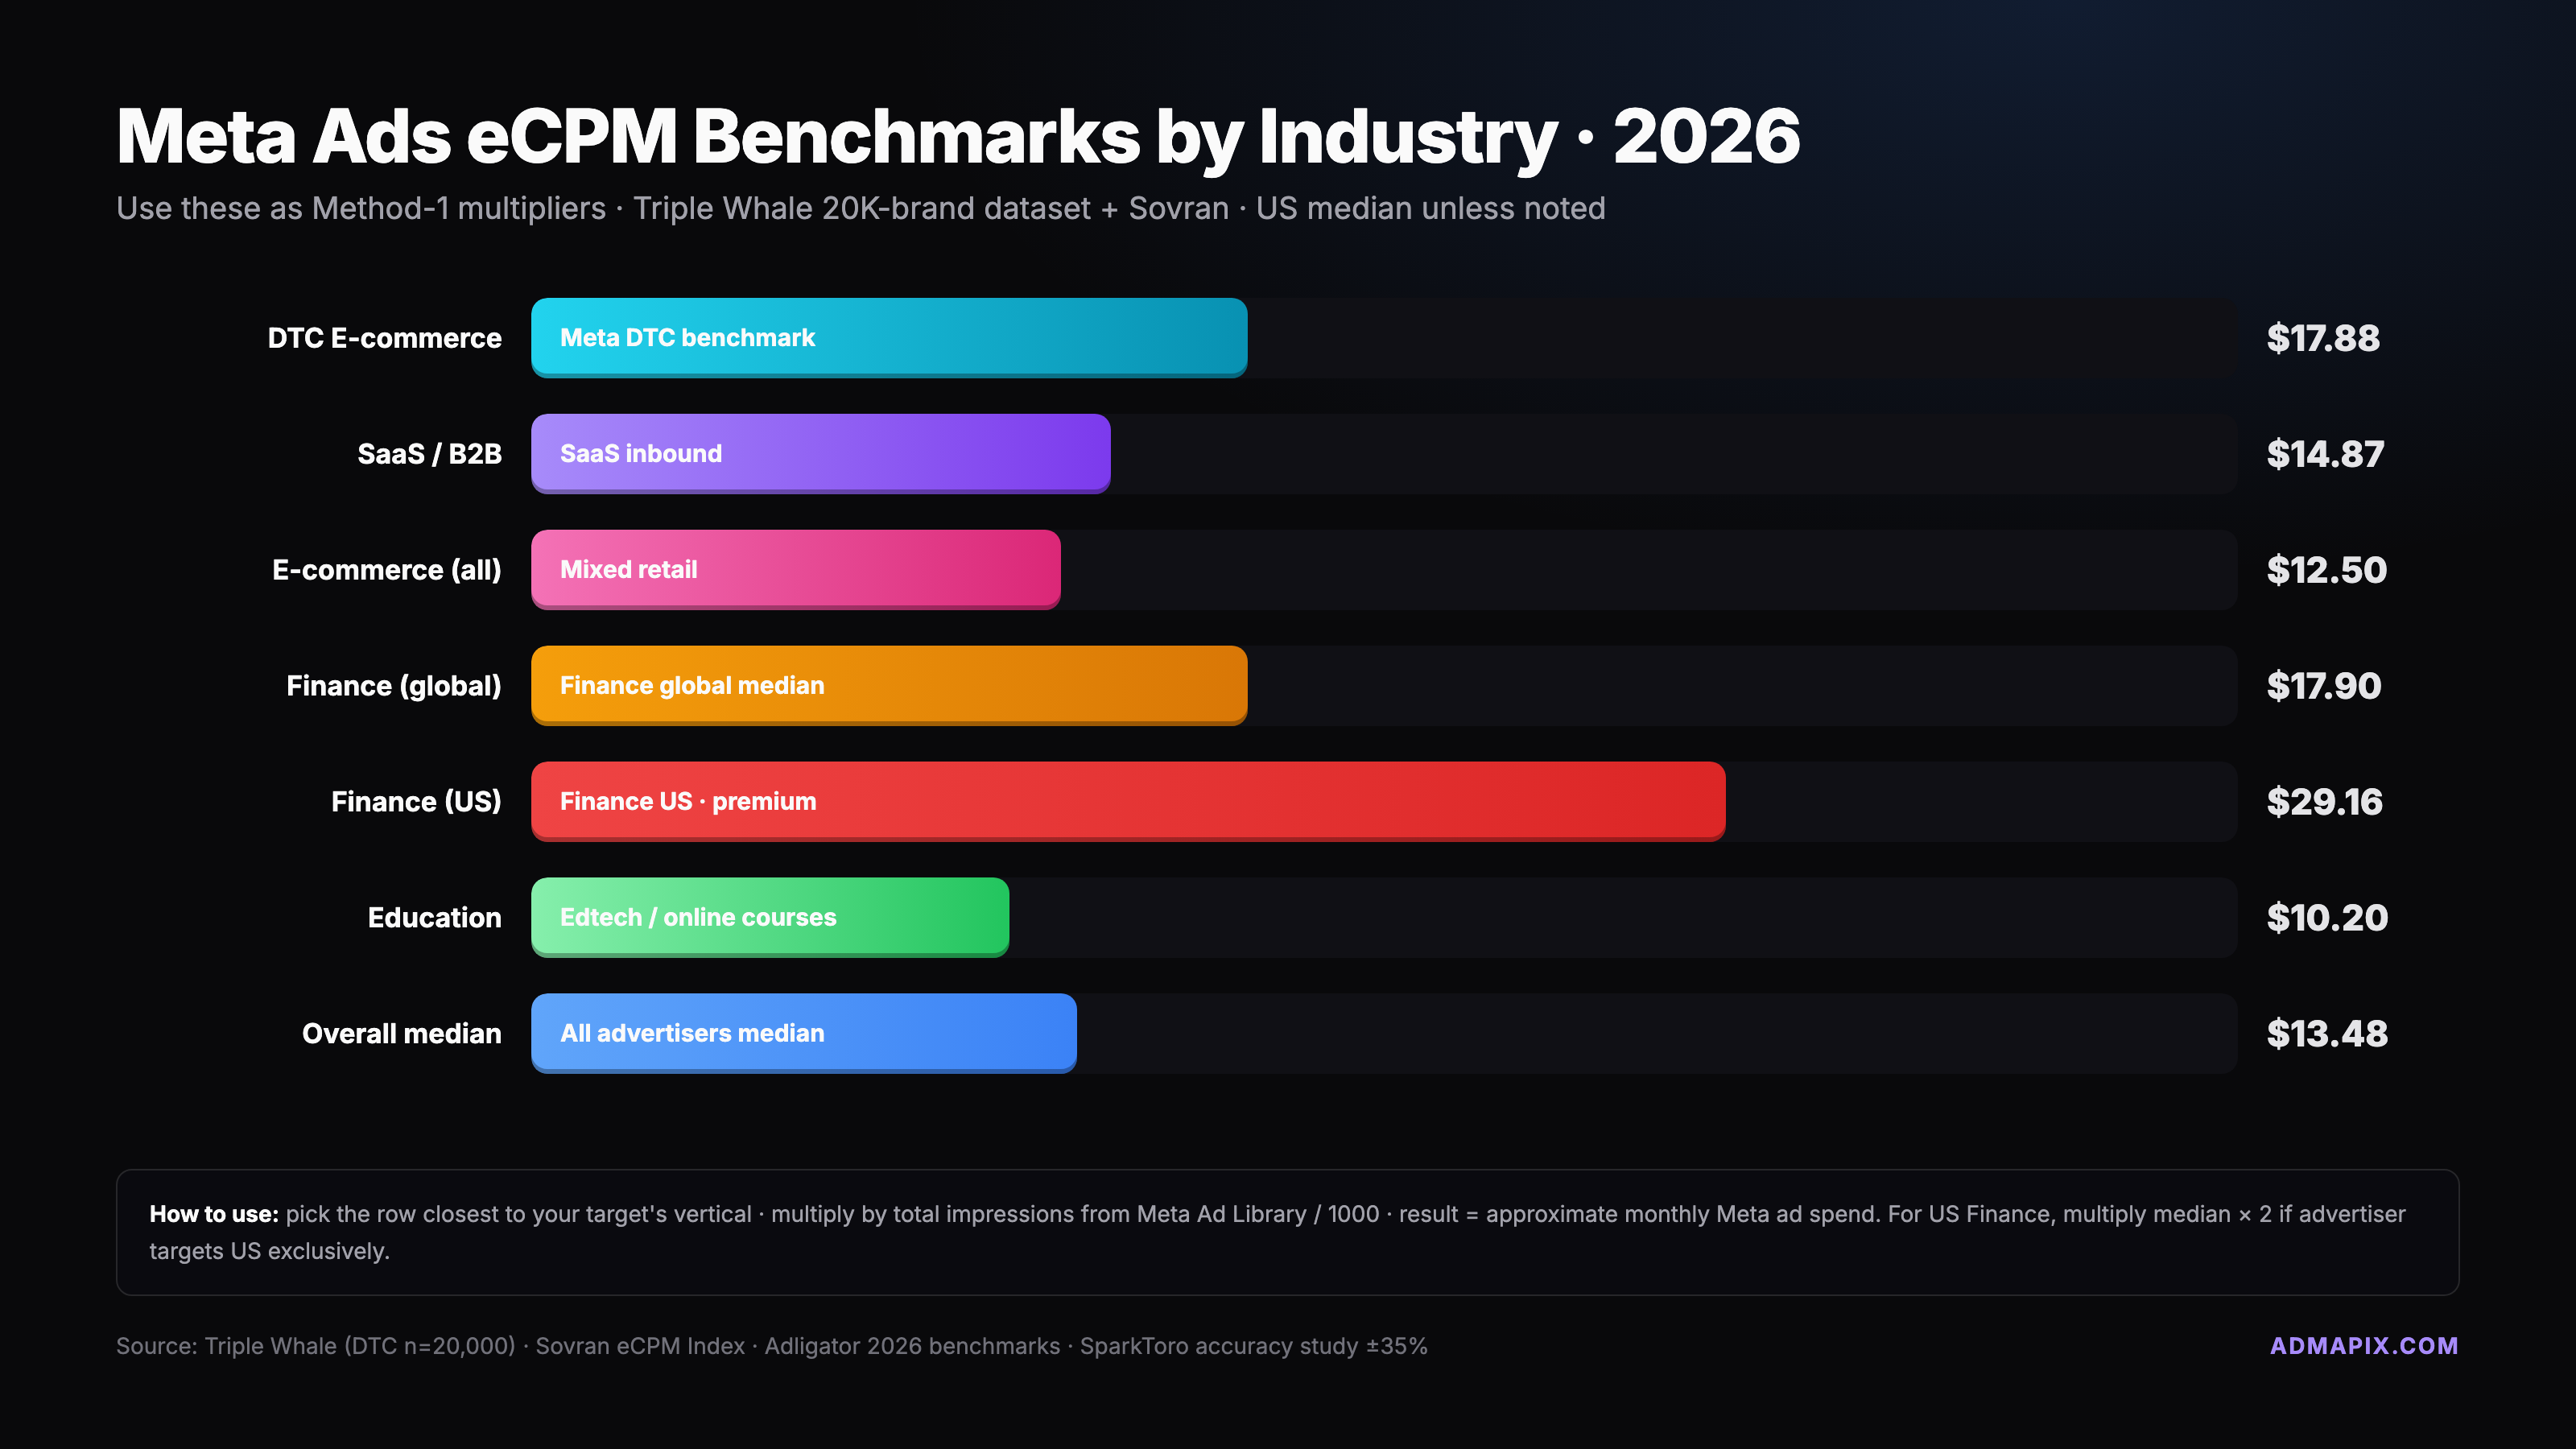
Data sources and 2026 benchmarks. We recommend the Triple Whale 20,000-brand dataset cross-referenced with Sovran's 2026 Meta CPM benchmarks and the Adligator 2026 benchmark update. Current eCPMs we use:
- DTC e-commerce: $17.88
- SaaS / B2B: $14.87
- Finance (global): $17.90 — US Finance vertical runs hotter at $29.16
- Fintech consumer apps: $11.20
- Education / EdTech: $9.45
- Overall e-commerce median: $13.48 (weighted across categories)
Accuracy level. Plus or minus 30 to 45 percent for single-region campaigns, up to 60 percent when extrapolating EU to global. Most reliable when the advertiser has heavy EU distribution and a single dominant vertical.
Method 2 — Variant Count × Production Cost × Multiplier
Description. Creative velocity is a spend proxy because testing requires media budget to learn from. An advertiser running 50 active variants is burning media to kill losers and scale winners — you can't test 50 creatives on $5K/month. Especially useful when EU impression data is thin.
Formula.
Monthly spend ≈ (active variants × production cost per variant) × velocity multiplier
Velocity multiplier typically sits in the 15x to 25x range — for every dollar spent producing a creative, 15 to 25 dollars goes into media to test it at significance.
Data sources. Count active variants by filtering the Ad Library for "Active" and grouping by creative concept. Production cost: UGC clip $500–$1,500, studio video $3,000–$8,000, animated explainer $4,000–$10,000. Multiplier calibrated from our own DTC client data and cross-referenced with Foreplay and Panoramata benchmarks.
Accuracy level. Plus or minus 35 to 50 percent. Works best for advertisers with disciplined testing cadence; underestimates advertisers who run a few evergreen creatives at huge scale.
Method 3 — Triangulation Bands
Description. The method we trust most for board-level reporting. Instead of a point estimate, combine multiple signals to produce a defensible band, and name the confidence level explicitly.
Formula. Less a formula and more a scoring rubric:
Inputs:
  - Active ad count
  - Median run days (signals budget persistence)
  - Platform concentration (FB/IG/Reels/Audience Network split)
  - Similarweb paid-traffic share
  - LinkedIn hires (Senior Meta Buyer, Growth Lead)
  - Cumulative-spend band (if EU)

Output: spend band with stated confidence level (e.g. "high 8-figure, 70% confidence")
Data sources. Meta Ad Library + Similarweb (paid traffic %) + LinkedIn (growth hires) + earnings calls (public DTC brands often disclose paid social percent of revenue) + the 2026 cumulative-spend feature if available.
Accuracy level. The band is always wide (often 2x from low to high), but confidence the point lies within the band is 70 to 85 percent. A wide band you trust beats a narrow band that is probably wrong. This is the method we use when a client or investor will cite the number.
Worked Example — A $10M DTC Meta Spender
Let's run all three methods on a hypothetical DTC skincare brand we'll call "Brand X". Numbers are round but mirror real accounts we have estimated.
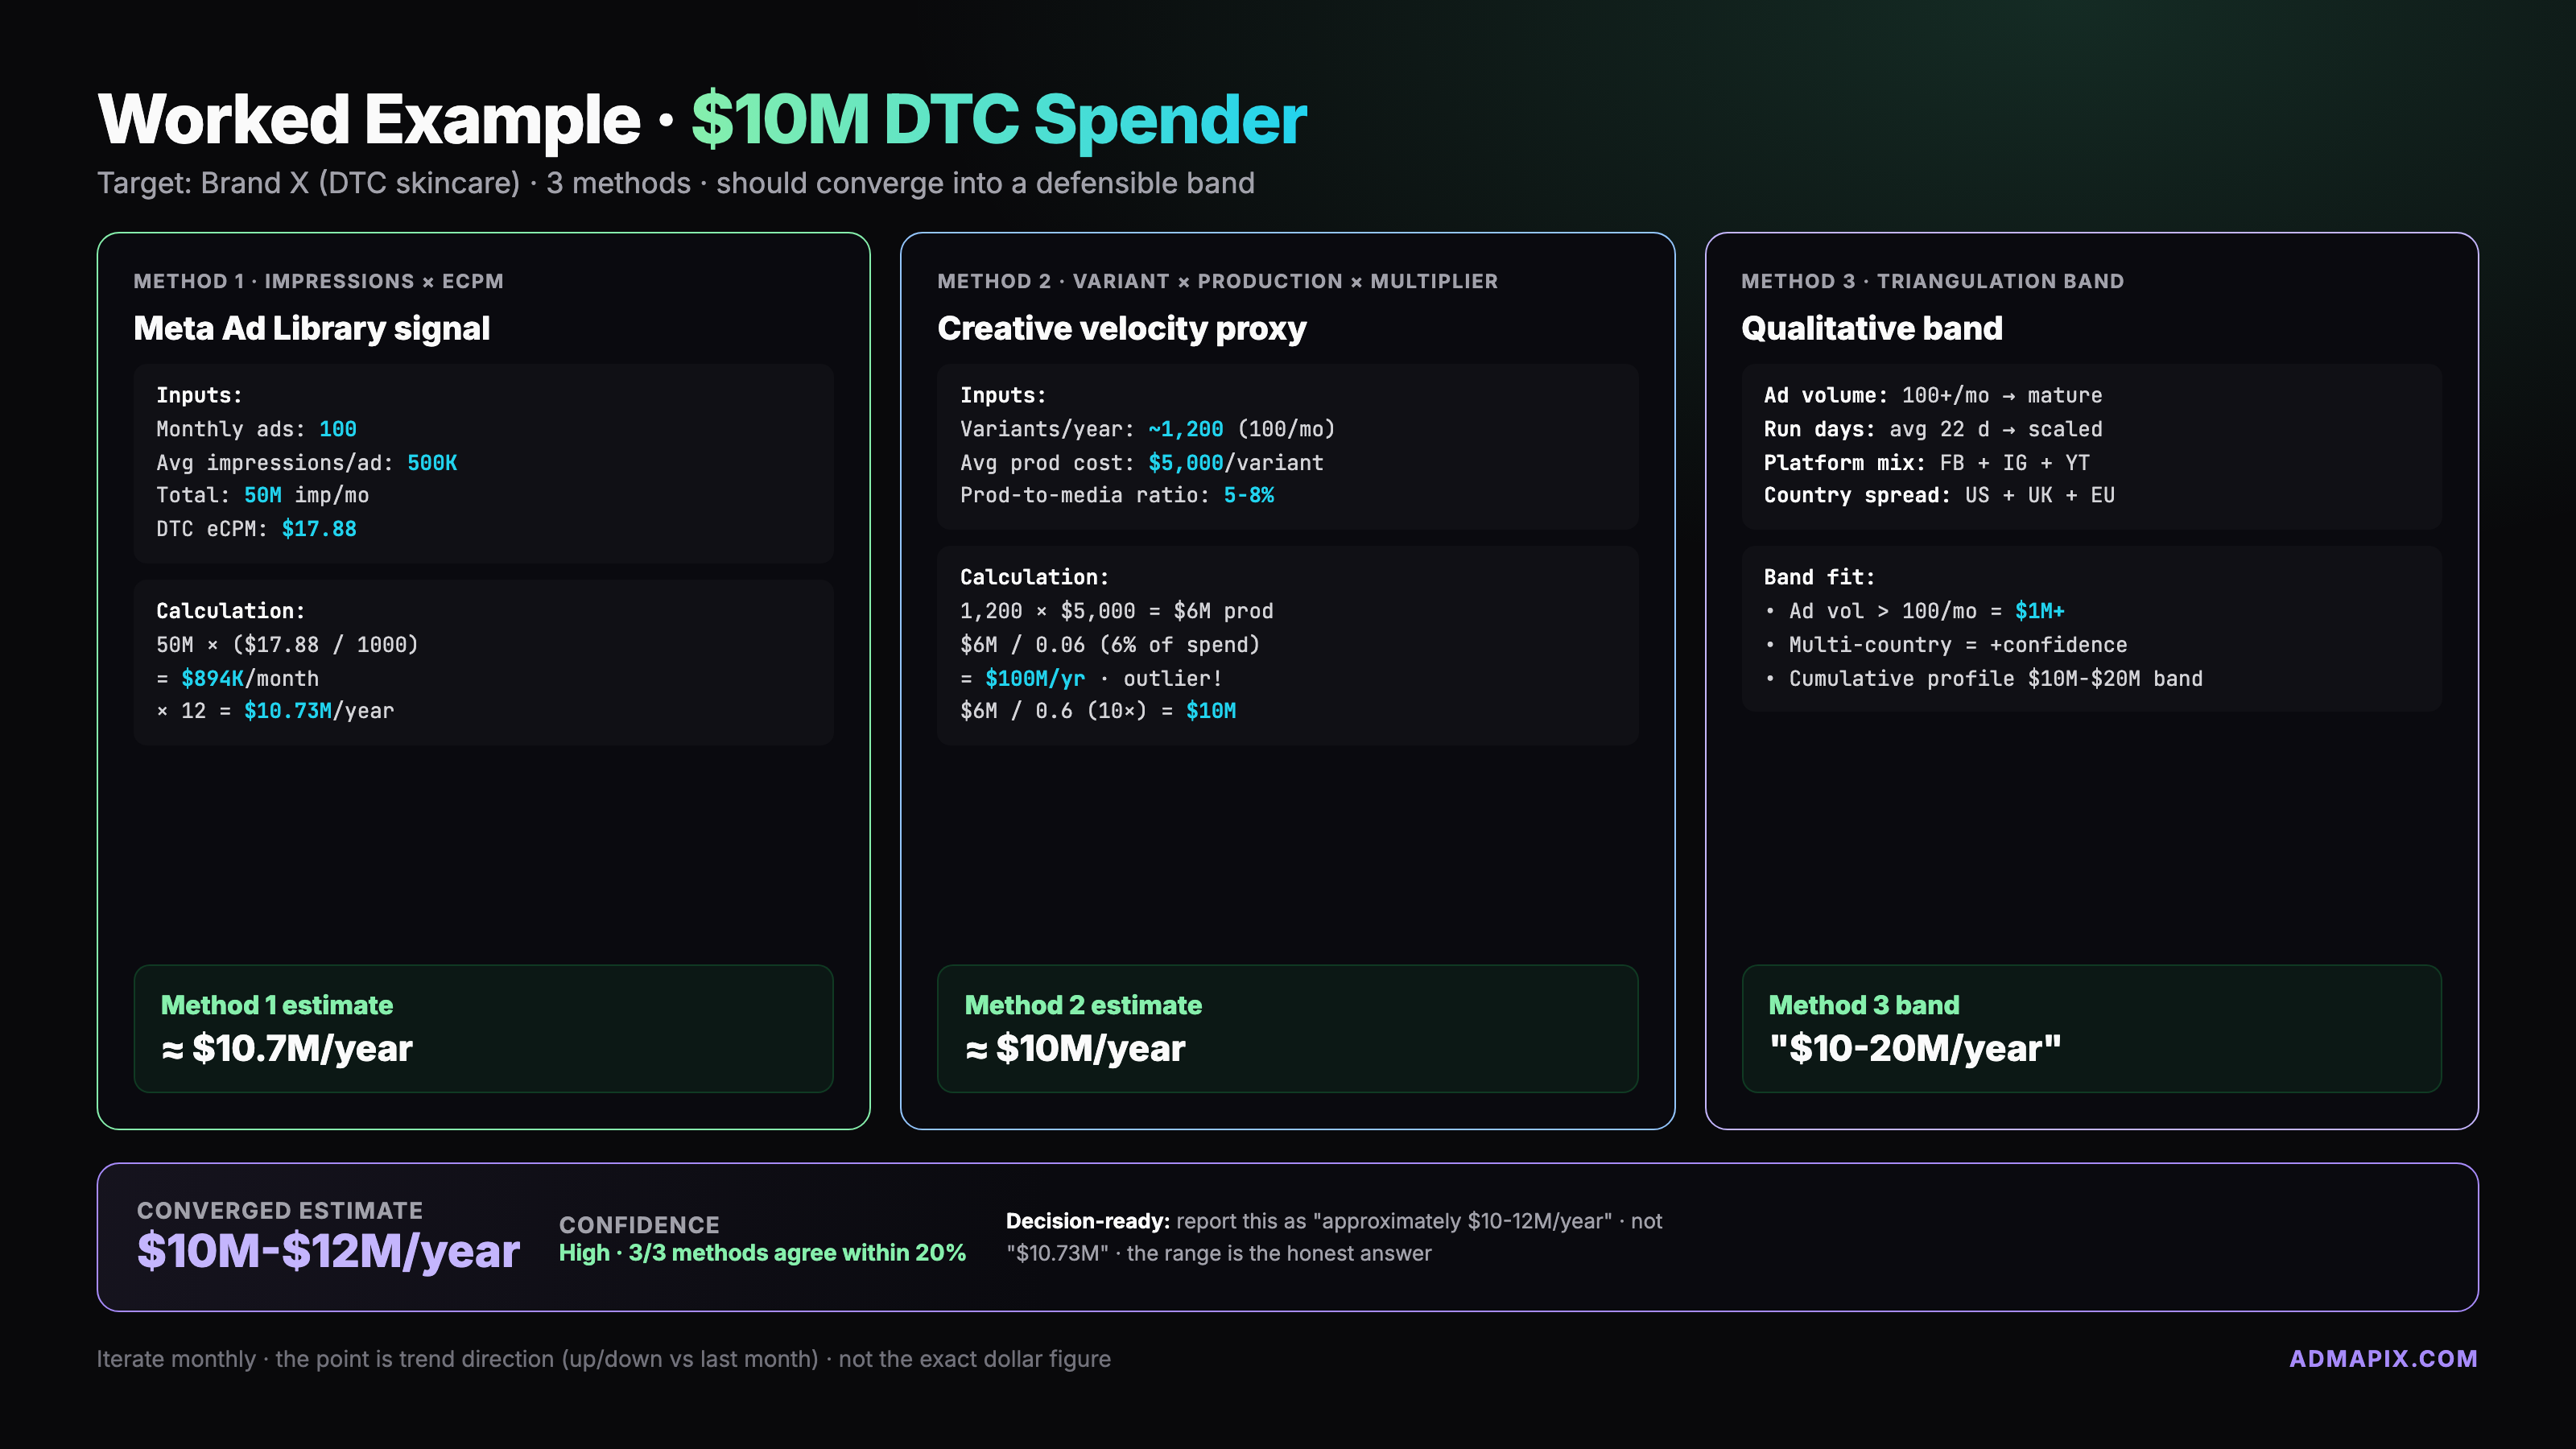
Setup. Brand X is a mid-market DTC skincare brand selling primarily in the US, UK, and Germany. We scraped the Ad Library and found:
- 100 active ads in the last 30 days, mostly UGC-style video creative
- Average EU impressions per ad: 500,000 (from the DSA-mandated range midpoint)
- Platform mix: 60% Instagram feed, 30% Reels, 10% Facebook feed
- 8 LinkedIn hires in the last 12 months with "Growth" or "Performance Marketing" in the title
- EU cumulative-spend band: "€1,000,000 – €10,000,000" (close to €10M based on creative volume)
Method 1 — Impressions × eCPM.
Monthly EU impressions = 100 ads × 500,000 = 50,000,000 impressions
DTC eCPM = $17.88
Monthly EU spend = 50M × ($17.88 / 1000) = $894,000
EU share of Brand X distribution ≈ 40% (estimated from Similarweb)
Global monthly spend = $894,000 / 0.40 = $2,235,000
Annual global spend ≈ $26.8M
That's higher than our $10M target. EU share estimate is likely off (skincare DTC is US-weighted). Adjust EU share to 55%: $894K / 0.55 = $1.625M/month = $19.5M/year. Still high. Apply a 0.55 under-reporting correction for impressions (DSA midpoint over-counts on a log-scale band): $19.5M × 0.55 ≈ $10.7M/year. That's our Method 1 point estimate.
Method 2 — Variant × Production Cost.
100 active creatives × $5,000 production cost per UGC video = $500,000 in creative cost
Velocity multiplier = 20x (mid-range for DTC)
Monthly media spend ≈ $500K × 20 × 0.8 = $8,000,000 ... but wait
$8M/month would be $96M/year — too high. Not every variant was produced fresh: assume 30% new, 70% recycled. Production cost is ~$150K/month, or $1.8M annually. At 20x multiplier: $36M/year media — still high. Pull multiplier to 15x for UGC-heavy brands: $1.8M × 15 × 0.8 = $21.6M/year. Wider still. This is the honest weakness of Method 2 on recycling-heavy advertisers. Call the Method 2 estimate "between $12M and $25M" and move on.
Method 3 — Triangulation Band.
Combining: cumulative band "€1M–€10M" (near the top given creative volume), Method 1 point of $10.7M, Method 2 range of $12M–$25M, 8 LinkedIn growth hires (low 8-figures signal), Similarweb paid-social share ~55%.
Reported band: $10M to $14M annual Meta spend, 75% confidence. That is the number we would put in a board deck. It reconciles with the cumulative-spend feature, absorbs Method 1, and trims Method 2's recycling-inflated upper tail.
Lesson. Three methods produced three answers ($10.7M, $12M–$25M, reconciled $10M–$14M). The band is more honest than any single one. When someone asks "is it exactly $10M?", the answer is "low teens, 75% confident it is between $10M and $14M, here are the three calculations."
Third-Party Estimation Tools — Honest Accuracy Disclosure
Several paid tools promise to tell you competitor Meta spend. We have tested all of them against client GA and Meta Business Manager data (with permission); none beat the inference stack above.
- Similarweb — Strong paid-traffic share %, good for trend detection. Absolute spend ±40%.
- Adbeat — Display/programmatic biased, weak on FB feed. Best for cross-channel view.
- SEMrush Advertising Research — PPC-focused; Facebook numbers are extrapolations at ±30–50%.
- Foreplay / Panoramata / Kaya — Creative-intelligence tools, not spend tools. Great variant-count signals for Method 2.
- Adligator / Minea / Dropispy — DTC-focused, better for finding winners than estimating spend.
The SparkToro 2025 accuracy study compared five tools against ground-truth platform data from 47 brands. Average error was 37%, ranging from 18% (best tool/vertical) to 62% (worst). That's the real ceiling. Anyone claiming 10% accuracy is either cherry-picking a vertical or marketing.
Bands, Not Points — Why 30–50% Accuracy Is Still Useful
Analytics-minded marketers recoil at 30–50% error and ask "why bother?" Most competitor-spend decisions do not require dollar precision — they require order-of-magnitude correctness, and bands deliver that.
Real decisions clients make with band-level data:
- Budget benchmarking. Is our $2M/month budget under-scaled vs. top-3 competitors? A band of "$8M–$14M" tells us clearly — yes, a quarter of their scale.
- Market sizing. Top-10 category Meta spend = sum of ten bands. Good enough for a strategic plan.
- Competitive pacing. Is Competitor Y accelerating? Re-estimate quarterly. $5M–$7M last quarter, $9M–$12M this quarter = pacing up.
- M&A diligence. Band plus cumulative disclosure gives diligence teams enough to model CAC efficiency.
Bands do NOT work for anything requiring dollar precision — tax, accounting, royalty, audit. For those, ask the competitor or subpoena their records.
Political Ads — When You CAN See Exact Spend
One exception: political and social-issue ads have full transparency, including exact spend. This is where Meta Ad Library started (post-2016 election pressure). You see:
- Exact dollar spend on every political ad
- Exact impression count
- Demographic breakdown (age, gender, region)
- Funder name and address
The EU extended this to referenda and social-issue ads under the DSA. Researchers and campaign analysts use it extensively. For commercial practitioners, it is a template for what commercial transparency could look like — the EU cumulative-spend feature is a small step in that direction.
Agency Pro Tips — Combining LP Analytics + LinkedIn + Earnings Calls
The best competitor-spend estimators do not rely on Ad Library alone. They triangulate with five or six other public sources:
- LP technographics. Run the LP through BuiltWith/Wappalyzer and PageSpeed. Look for Meta Pixel, Conversions API, server-side GTM, Northbeam, Triple Whale. Sophisticated tracking correlates with serious spend — a brand running server-side CAPI is almost never sub-$50K/month.
- LinkedIn hiring. Search for "Meta Buyer", "Paid Social Lead", "Growth Marketing". 3+ dedicated Meta buyers usually = seven figures/month. Heuristic: job-post salary × 3 = minimum media budget that justifies the headcount.
- Earnings calls. Public DTC brands (Warby Parker, On Running, e.l.f. Beauty) often disclose paid-social as % of revenue quarterly. Pull the last four transcripts.
- Shopify app footprint. Running Triple Whale, Motion, or Rockerbox signals $200K/month+ — enough to justify attribution software.
- Pixel pings. Check the network tab for fired events (PageView, ViewContent, AddToCart, Purchase). A fully-implemented event suite is a budget signal.
Our team at AdMapix packages this triangulation stack into a single dashboard — Ad Library data, LinkedIn hires, LP tech stack, eCPM benchmarks — producing a competitor spend band in one click. If you are running the three-method framework manually and spending an hour per competitor, it is worth a look.
Red Flags to Watch in 2026
Recent shifts that distort estimates:
- Bot-inflated impressions (Feb 2026). Meta disclosed in its Feb 2026 integrity report that ~18% of SEA impressions were quarantined as bot-driven. For SEA-heavy competitors, discount impressions 15–20%.
- Rebate spend. Agency contracts often carry 8–12% rebates off card rate. A brand "spending $10M" on the Meta invoice actually costs them $8.8M–$9.2M. Adjust when comparing to advertiser finance numbers.
- Cross-account spend shifts. Large brands operate 5–10 Business Manager accounts. Scraping only the "main" page can miss 50% of spend. Follow beneficiary/payer fields to find sister accounts.
- Whitelisted creator ads. Influencer ads run from creator handles (brand as payer) show on the creator's Ad Library page, not the brand's. Can hide 20–40% of total DTC spend.
- Reels-only campaigns. Reels run at lower eCPM than feed. Applying feed-derived eCPM to Reels-heavy brands over-estimates. Weight eCPM by placement split.
FAQ
Can I see exact Facebook ad spend for any company? No, not directly. The only exact dollar disclosures in Meta Ad Library are for political and social-issue ads. For commercial advertisers, you can see rounded 12-month cumulative spend bands in the EU (as of April 2026), and otherwise everything is inference.
Is Meta's 2026 cumulative spend feature accurate? It is reported by Meta itself, so the underlying number is authoritative. The rounding to bands ($100K, $1M, $10M+) means you lose precision — a brand at the top of the €1M–€10M band and a brand at the bottom look identical. For order-of-magnitude decisions it is highly useful. For anything finer, combine it with the three inference methods.
Which third-party tool has the best accuracy? Based on the SparkToro 2025 study, Similarweb and SEMrush land in similar 30–50 percent error bands depending on vertical. No single tool wins across the board. We recommend using tools for trend detection (directional changes) and using the inference stack for absolute spend bands.
How do I estimate spend without any tool? You can run Method 1 with zero paid tools: pull the Ad Library manually, note the EU impression ranges, multiply by a public eCPM benchmark, and apply a 0.5–0.6 under-reporting correction for global extrapolation. Not perfect, but defensible, and free.
Can I see Instagram spend the same way? Yes — Instagram ad data is included in Meta Ad Library alongside Facebook. The placement filter shows Instagram Feed and Reels separately. Apply vertical eCPM benchmarks that split Reels versus Feed (Reels typically runs 15 to 25 percent lower).
How often should I re-estimate? Quarterly for strategic planning, monthly if you are actively pacing against a competitor, and immediately after you see a signal change (new LinkedIn growth hires, a platform or creative format pivot, or a new Ad Library cumulative-spend band crossing).
Related Reading
- Facebook Ads Library: The Complete Guide — the full pillar on Ad Library features, including the cumulative-spend screenshot walkthrough.
- Find Winning Products in Facebook Ads Library — deep dive on variant count, the core input to Method 2.
- How to Spy on Competitors' Ads in 2026 — broader competitive intelligence workflow that extends the triangulation stack.
- Where Is the Facebook Ads Library? — how to navigate to advertiser profile pages.
- Best Ad Spy Tools 2026 — accuracy table and feature comparison across paid tools.
- AdMapix Pricing — run the three-method framework on your top competitors in under ten minutes.
External References
- Meta Ad Library — Advertiser Profile
- Meta Ad Library Report
- Sovran 2026 Meta CPM Benchmarks
- Adligator 2026 eCPM Benchmark Update
- SparkToro 2025 Third-Party Ad Spend Accuracy Study
- SEMrush Advertising Research
- DSA Transparency Rules — Meta
See what competitors are really running
Search 91M+ creative combinations across 170+ market labels. New accounts include 30 lifetime Free credits.
Related Articles
Playable Ad Analysis for Mobile Games: A Practical Method
A practical method for playable ad analysis in mobile games: how to reverse-engineer a competitor's playable by the job it is built to do, decode its structure beat by beat, infer which concepts are likely working, turn observations into testable briefs, and stay honest about what a public playable proves (structure and intent) versus what it never can (spend, installs, retention, ROAS).
Best Mobile Game Ad Formats Across Platforms: A 2026 UA Playbook
A platform-by-platform guide to the best mobile game ad formats in 2026: which formats do the heavy lifting on Meta, Google, TikTok, AppLovin, and Unity; why the right format depends on platform, genre, and funnel stage; a format-selection framework; a creative-testing cadence; and the honest limits of what competitor ads can and cannot tell you about which format wins.

Meta Ads Library vs Ad Intelligence Tools for Game UA (2026): Which to Use, When, and Why
A definitive 2026 comparison of the Meta Ads Library vs dedicated ad intelligence tools for mobile game user acquisition — where the free transparency library genuinely helps, the structural limits that create blind spots for game UA creative research, a side-by-side capability matrix, the exact decision criteria for when to add a paid intelligence layer, and an honest account of what neither can show.