
Best KaloData Alternatives in 2026: FastMoss, Shoplus, EchoTik & AdMapix Compared
A 2026 guide to the best KaloData alternatives: how to pick by job, a side-by-side comparison of TikTok Shop analytics and competitor ad-intelligence tools, pricing context, migration tips, and where AdMapix fits.
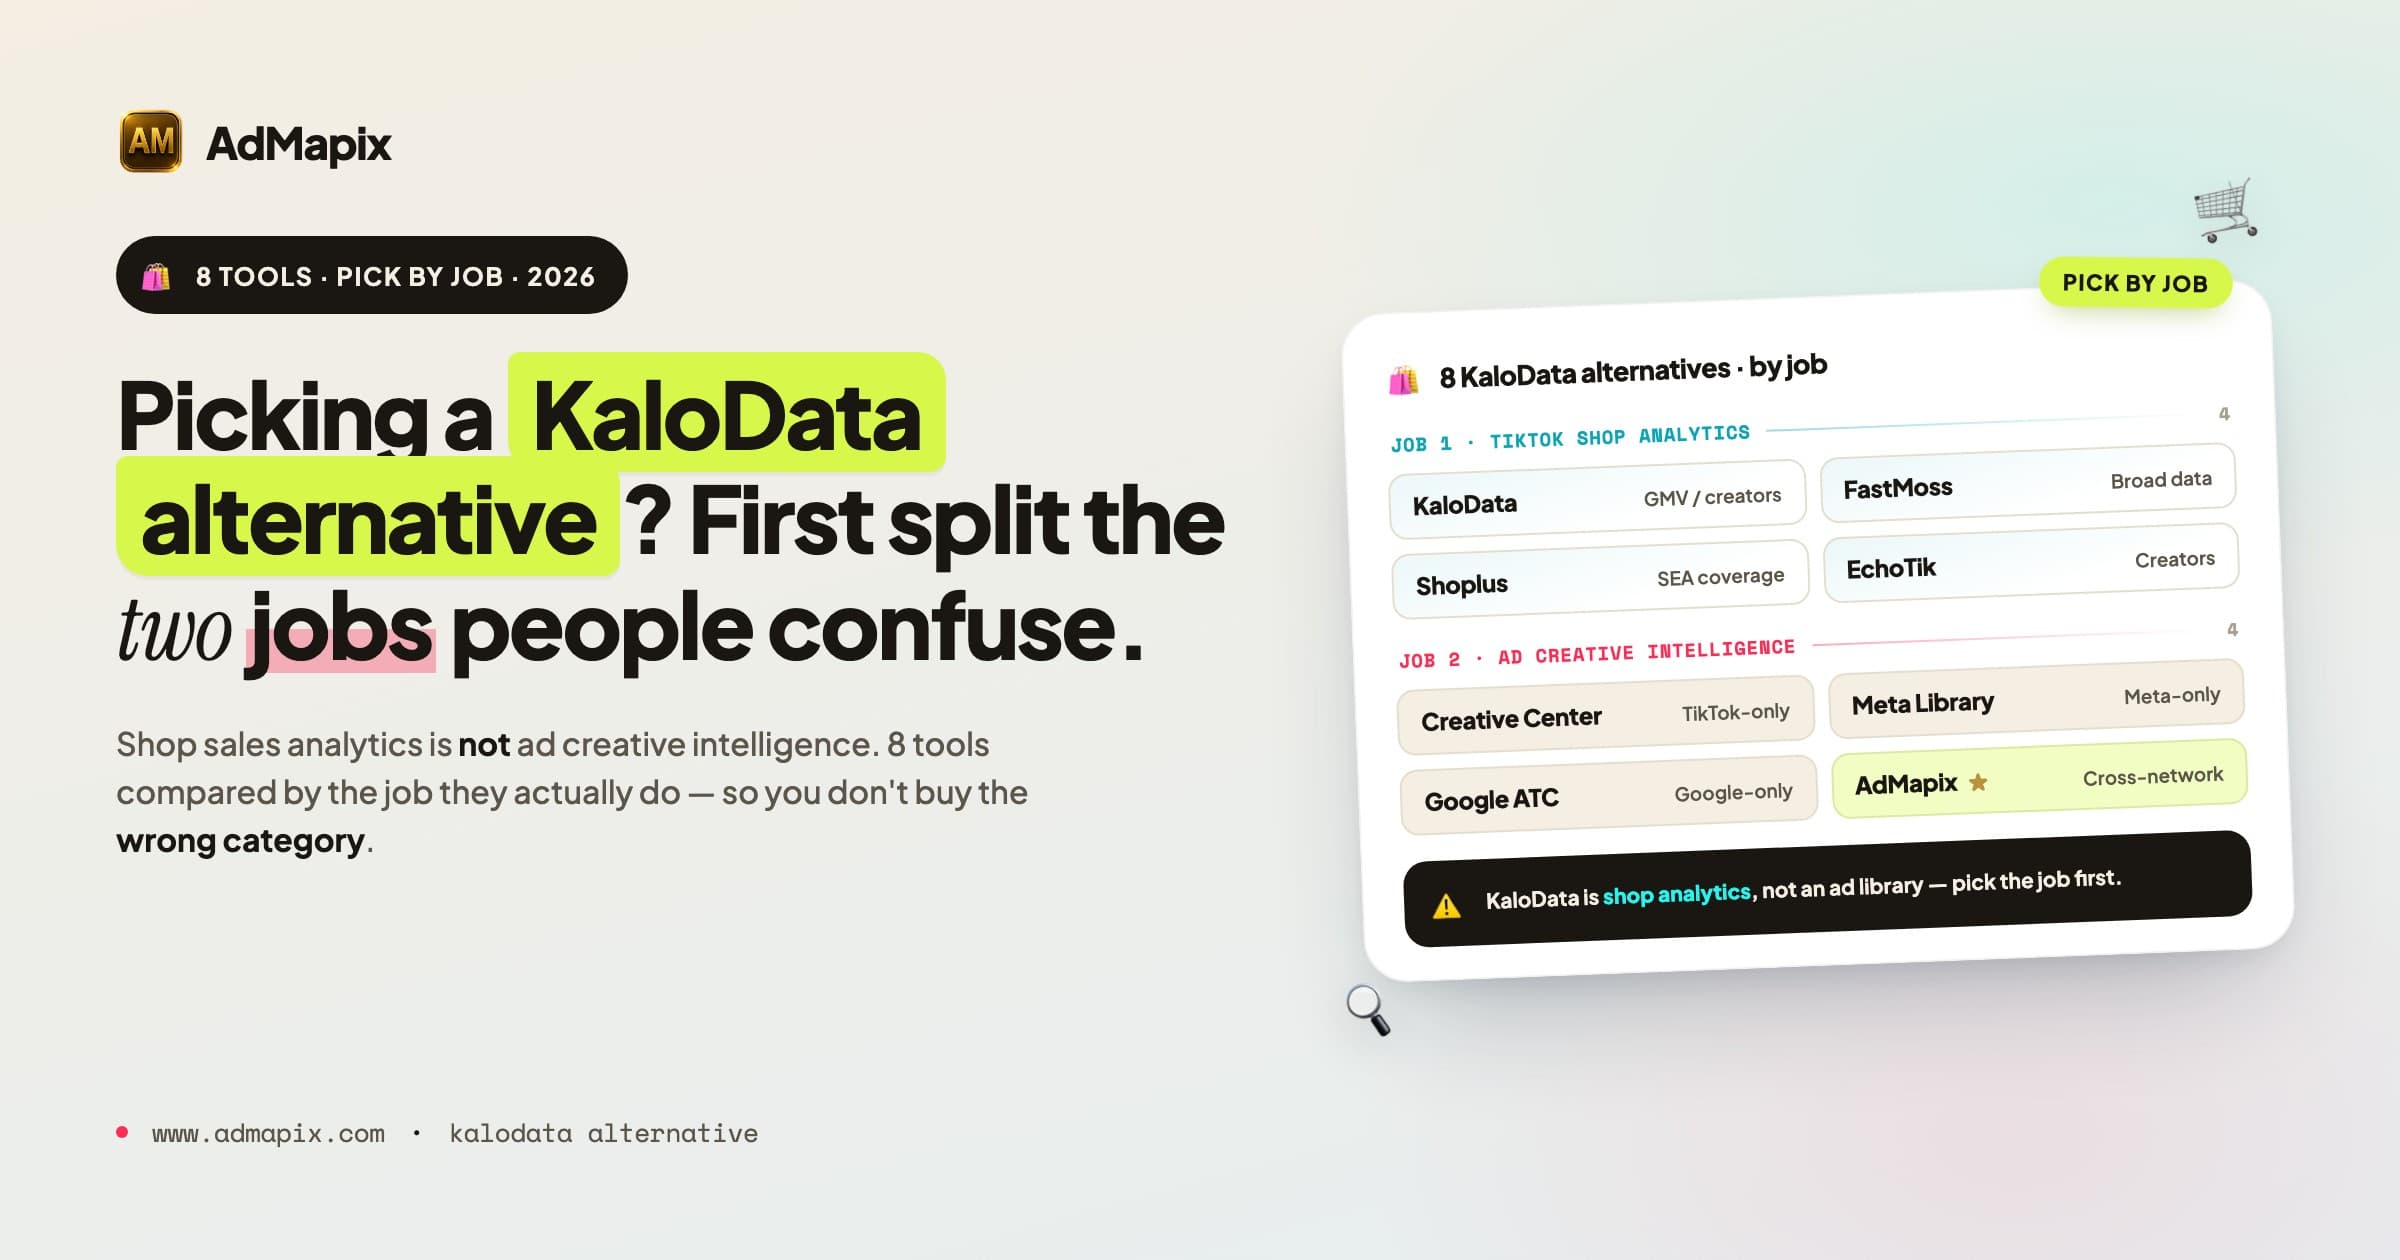
By the AdMapix Research Desk — Updated September 5, 2026
Best KaloData Alternatives in 2026: FastMoss, Shoplus, EchoTik & AdMapix Compared
The right KaloData alternative depends on which job you are actually doing — and most "best KaloData alternative" lists get this wrong by lumping incompatible tools into one ranking. KaloData is a TikTok Shop ecommerce analytics tool: it surfaces trending products, creator performance, livestream signals, and short-video sales data so sellers can decide what to source and who to partner with. If that is your job, you want a like-for-like shop-analytics tool. But a large share of people searching for a KaloData alternative are really trying to do a different job — studying the ads competitors run, the video hooks they use, and the offers behind them. That is ad creative intelligence, and it is a separate category with separate tools.
This guide is for TikTok Shop sellers, ecommerce founders, affiliates, agencies, and paid-social teams who need to choose the right tool in 2026. It does three things most comparison posts skip: it separates the two jobs people actually buy these tools for, compares eight real alternatives side by side with their strengths and limits, and gives you a decision framework so you pick by job rather than by feature-count. We'll be honest about where AdMapix fits (the ad-creative-intelligence job) and where it doesn't (TikTok Shop sales analytics) — because recommending the wrong category is the single most expensive mistake in this space.
TL;DR — Choosing a KaloData Alternative in 2026
- KaloData covers TikTok Shop research and also lists a Video & Ad section. Check the actual module, country, query results and plan limits before deciding whether another tool adds useful coverage.
- Pick by job, not by features. Shop-sales analytics is one job; competitor ad-creative intelligence is a different one. Judging one by the other's strengths leads to the wrong purchase.
- A single tool rarely does both jobs well. Most serious teams run a TikTok Shop analytics tool alongside an ad-intelligence tool, not one in place of the other.
- Direct shop-analytics substitutes for KaloData include FastMoss, Shoplus, EchoTik, and Kalodata-style regional tools — judge them on data coverage, creator depth, and pricing.
- Ad-intelligence alternatives (a different job) include TikTok Creative Center, ad libraries, and cross-network tools like AdMapix for searching, analyzing, and reporting on competitor ad creatives.
- All of it is directional, not audited. Estimated GMV and modeled sales are useful for ranking and direction — never treat them as financial truth, and validate with your own data.
What KaloData Actually Does (and Doesn't)
KaloData presents itself as a TikTok Shop analytics product. Its official site also lists Video & Ad alongside product, shop, creator and livestream research (checked September 5, 2026). It is therefore inaccurate to say it cannot support ad research. The useful comparison is which records, markets, networks and outputs each tool provides for your actual task.
Getting this boundary right is the whole game. Here is what KaloData is strong at and what falls outside its job:
| What you want to know | Tool job | KaloData-style fit |
|---|---|---|
| Which products are trending on TikTok Shop | Shop analytics | Strong |
| Which creators drive GMV for a category | Creator research | Strong |
| How a livestream or short video converted | Sales analytics | Strong |
| Estimated category and product GMV trends | Market sizing | Strong (modeled) |
| What ad creatives competitors are running | Ad research | Evaluate its Video & Ad module on your target query |
| How an ad’s hook and offer are structured | Creative analysis | Inspect the available examples and analysis output |
| Cross-network creative search | Ad research | Verify each required network and market in the current product |
Use the table to define an evaluation task. Product categories overlap; a second subscription is justified only when it supplies evidence or a workflow you cannot obtain from the existing tool.
Why You Might Be Looking for an Alternative
People leave or supplement KaloData for a handful of recurring reasons. Naming yours sharpens which alternative actually fits.
| Reason for switching | What it implies | Where to look |
|---|---|---|
| Price / plan limits | You want comparable shop analytics cheaper or with more seats | FastMoss, Shoplus, EchoTik |
| Regional data gaps | Your markets (SEA, US, EU) are thin in KaloData | Region-strong shop tools |
| You actually need ad data | Your real job is creative intelligence, not shop sales | TikTok Creative Center, ad libraries, AdMapix |
| Creator-discovery depth | You partner with creators at scale | Creator-focused TikTok analytics |
| Cross-platform commerce | You sell on Amazon/Shopee too | Multi-marketplace analytics tools |
| Reporting / client deliverables | You package research for clients | Tools with strong export/reports |
Ad research and client reporting do not automatically require leaving a shop analytics product. Check its relevant modules first, then compare any coverage or workflow gaps.
Split the Decision Into Two Jobs
Before comparing tools, separate the decisions you need to make. One product may support both; evaluate each workflow independently.
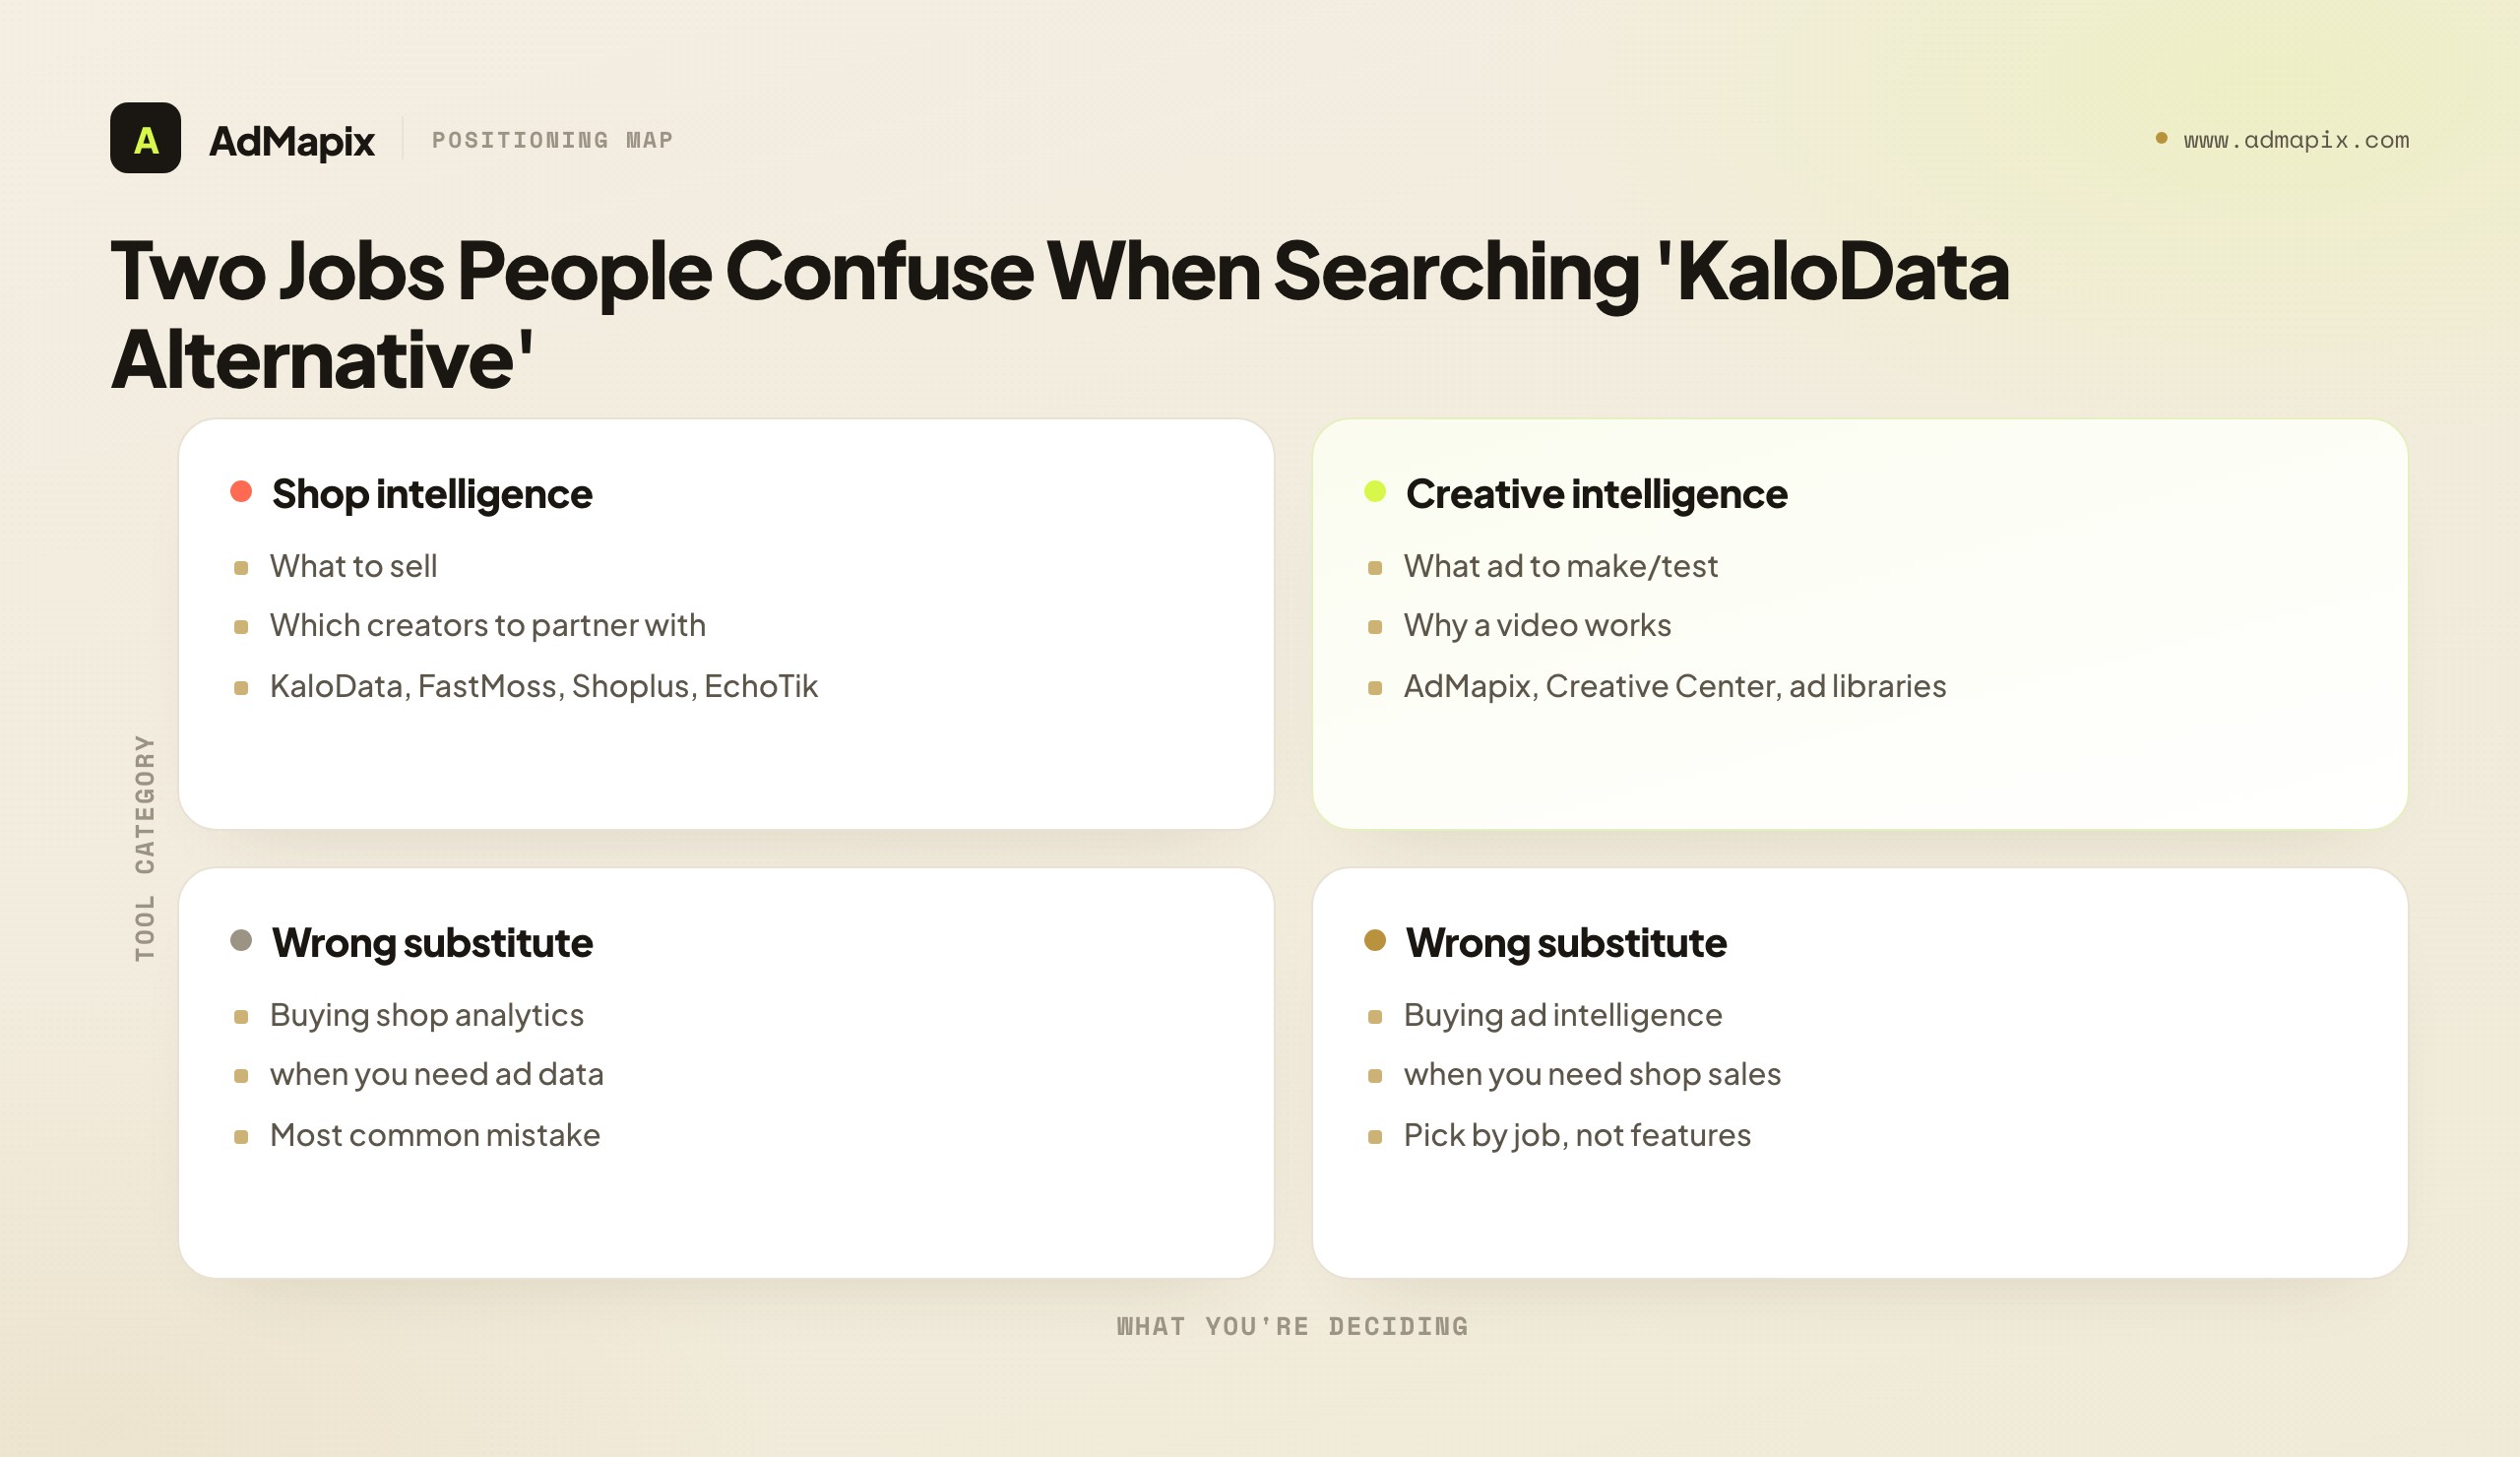
Job one is shop intelligence: find products to source, validate demand, and identify creators worth partnering with. The output is a product shortlist, a creator list, and GMV signals. KaloData and its direct competitors own this job.
Job two is creative intelligence: find the ads competitors run, understand why a video works, and turn that into a creative brief or a client report. The output is ad examples, hook breakdowns, offer angles, and shareable reports. This is a different category — TikTok Creative Center, the major ad libraries, and cross-network tools like AdMapix live here.
| Job | Core question | What good output looks like | Tool category |
|---|---|---|---|
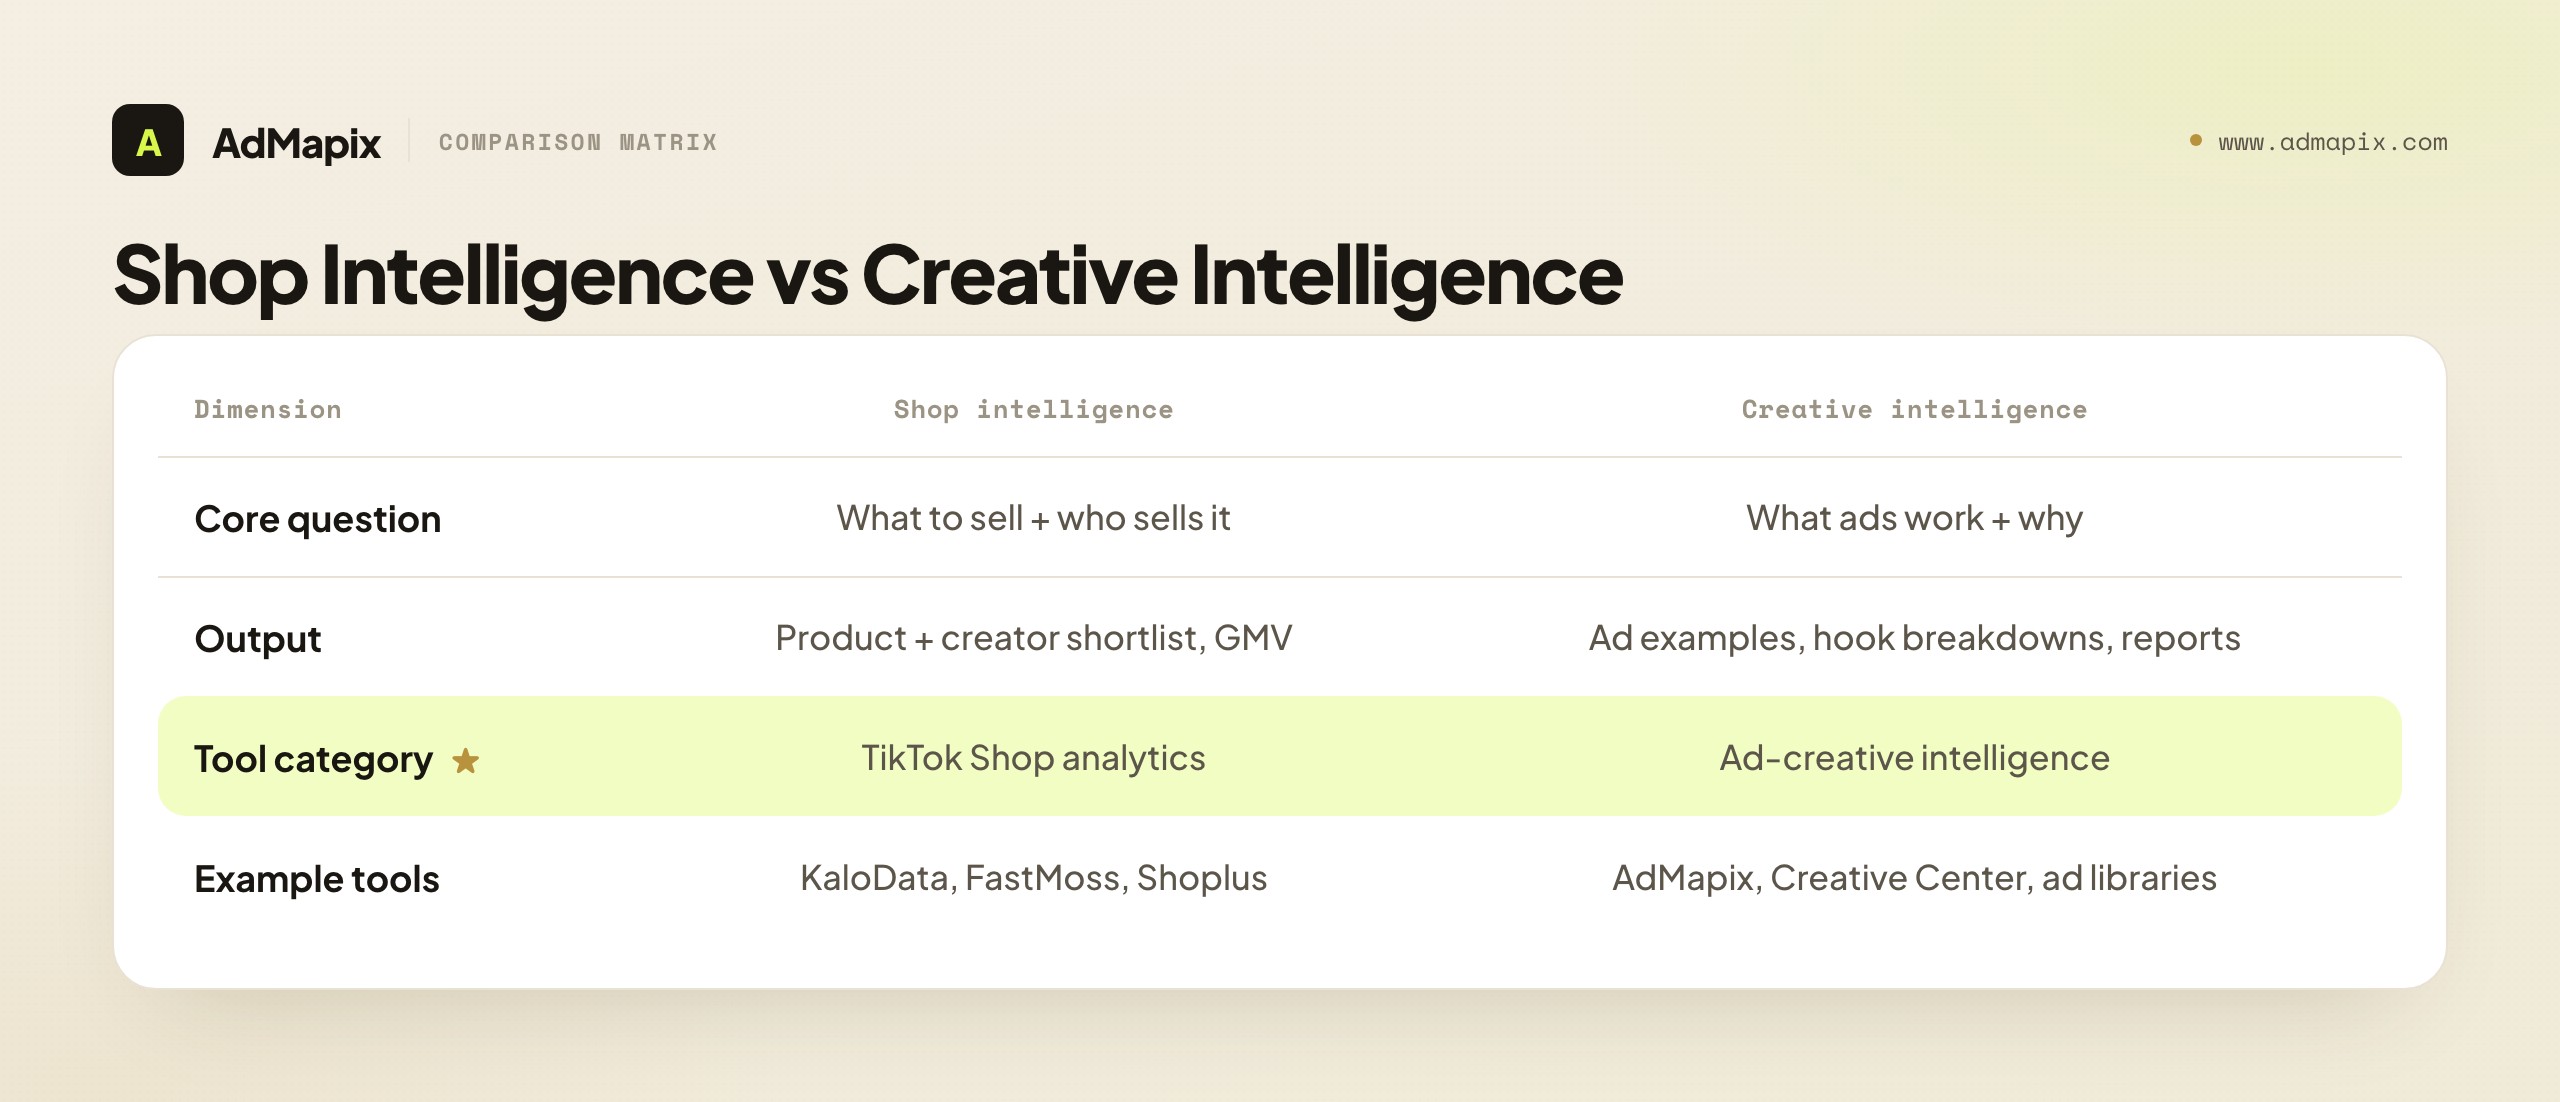
| Shop intelligence | What should I sell, and who should sell it? | Product shortlist, creator list, GMV signals | TikTok Shop analytics |
| Creative intelligence | What ads work, why, and what should I test? | Ad examples, hook breakdowns, offer angles, reports | Ad-creative intelligence |
The useful question is never "which tool has more features." It is "which tool improves my next decision" — a sourcing choice, a creator partnership, a creative brief, or a client deliverable. Once you know the decision, the category picks itself, and the comparison becomes simple.
The 8 KaloData Alternatives, Compared
Below is a side-by-side comparison of the eight alternatives worth knowing in 2026, grouped by the job they actually serve. Treat the "best for" column as the real differentiator — feature lists converge, but the job each tool is built around does not.
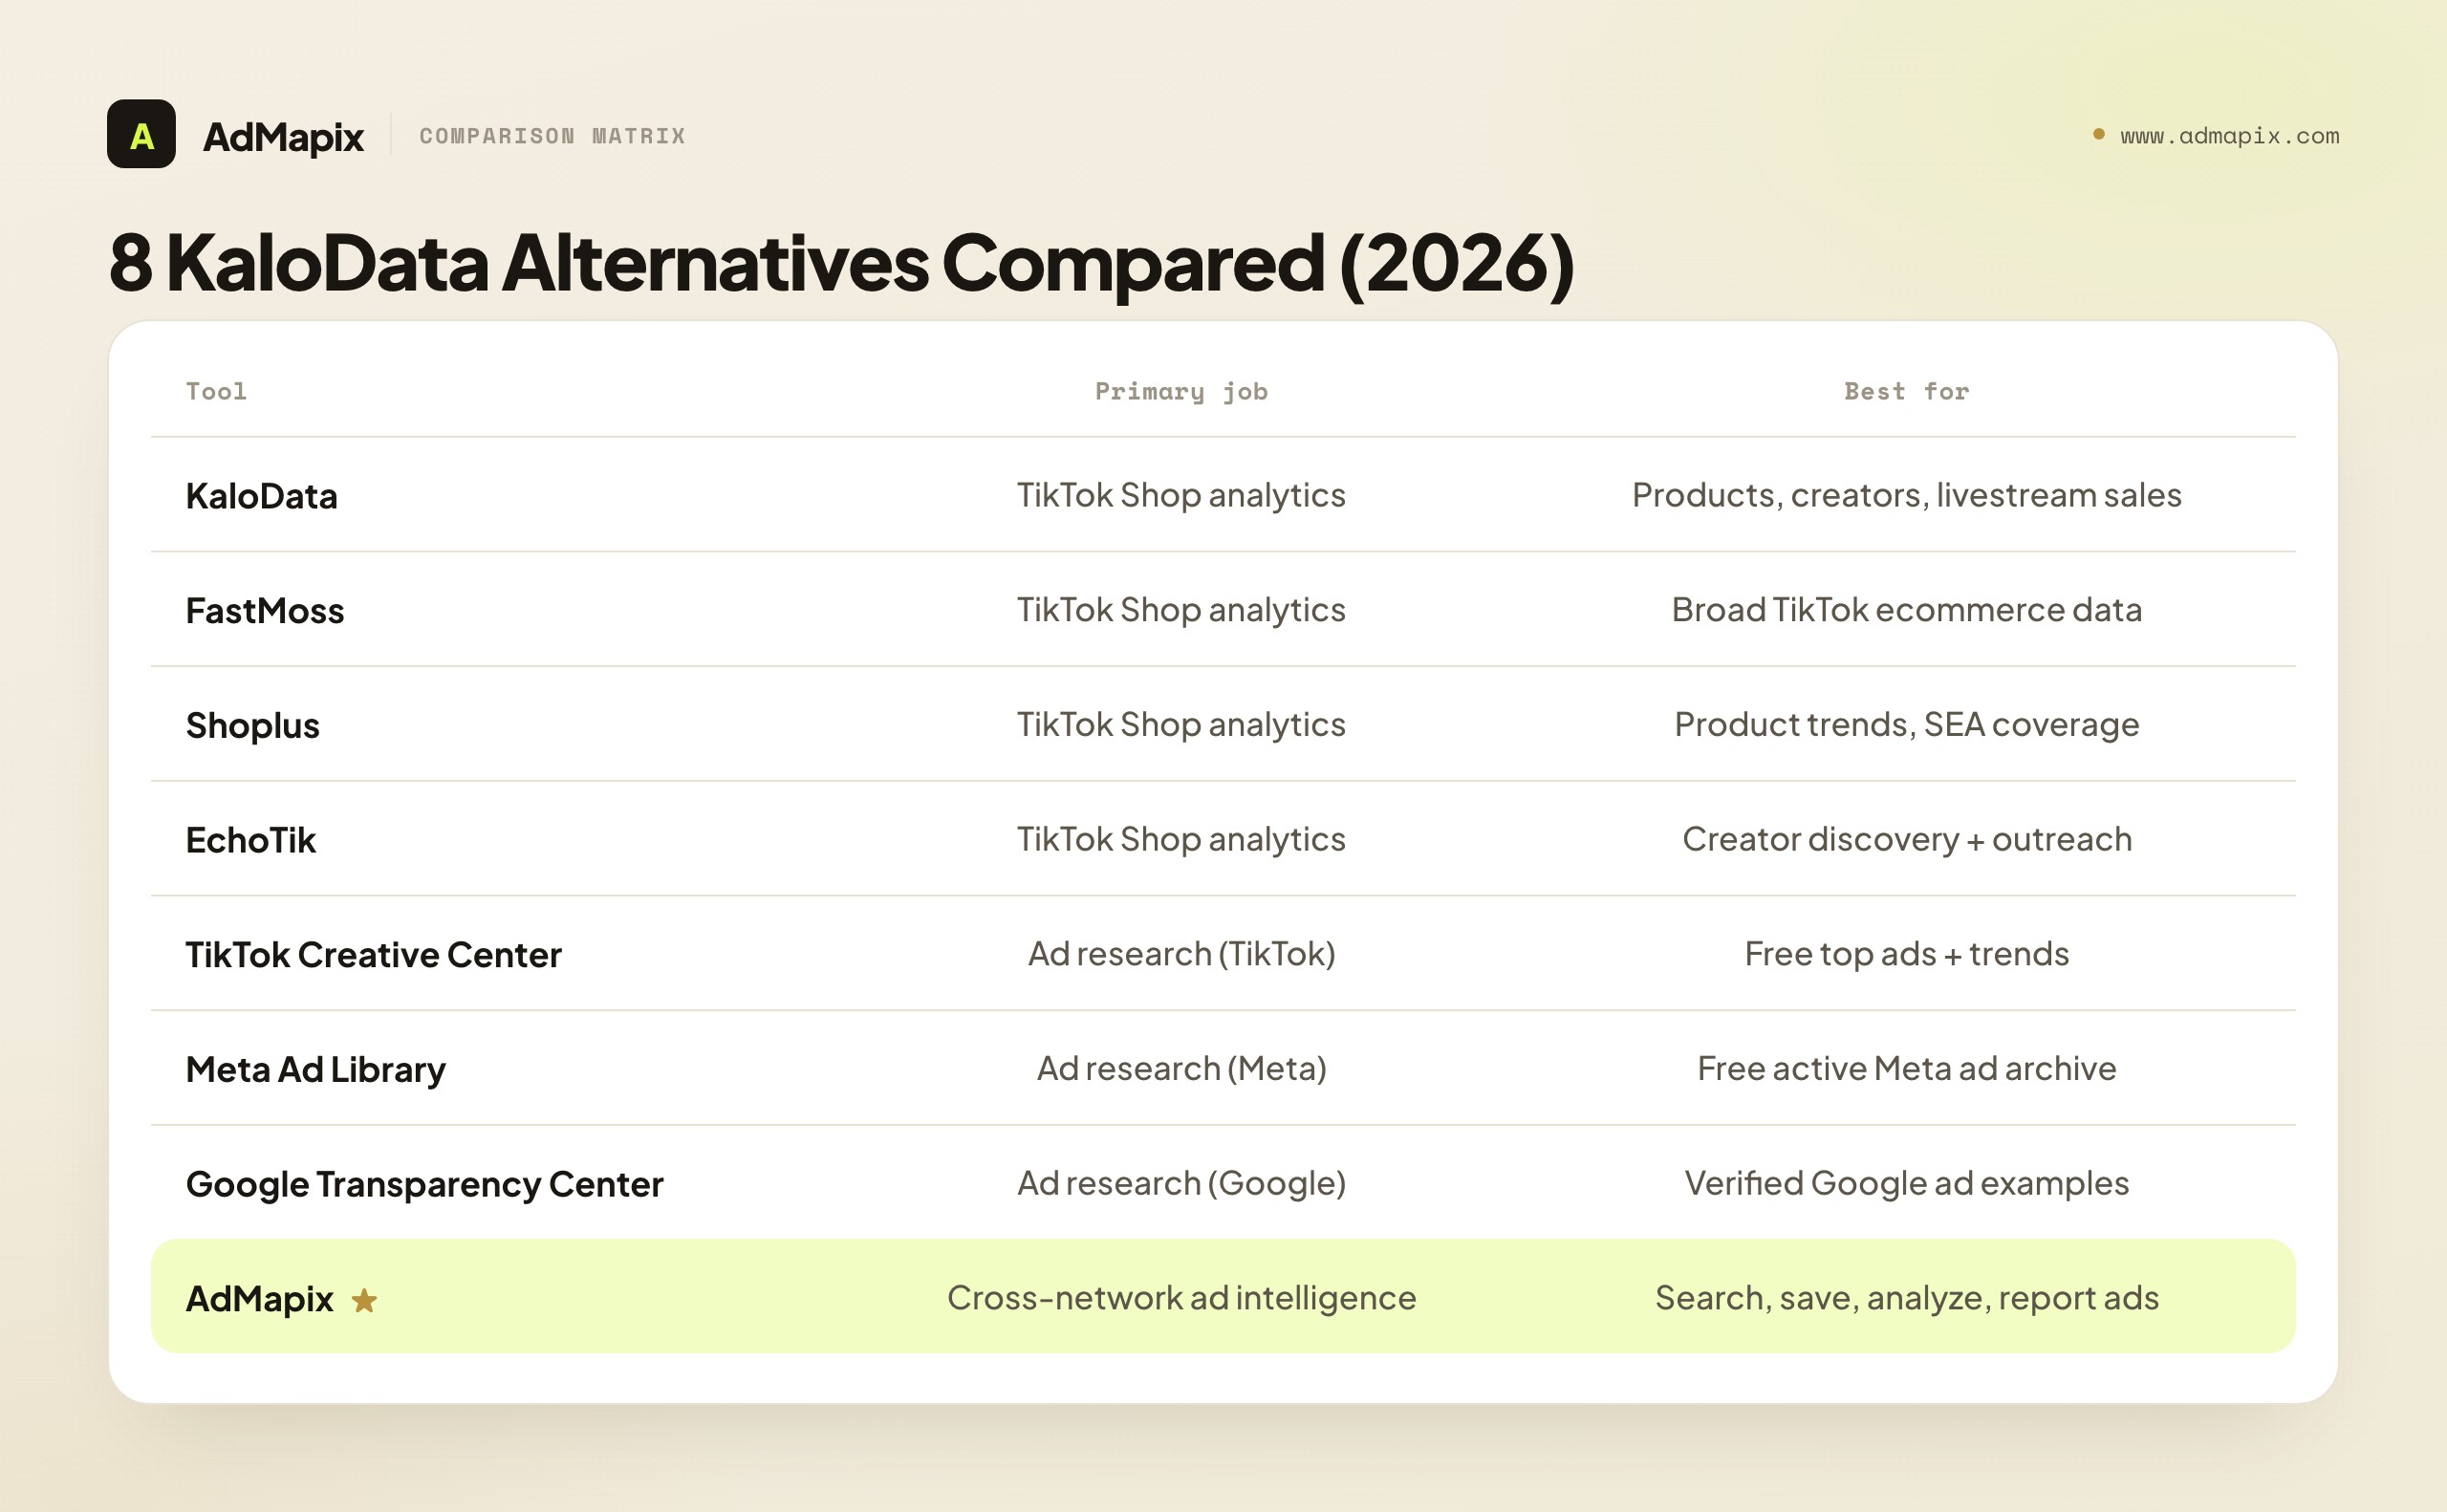
| Tool | Primary job | Best for | Watch-outs |
|---|---|---|---|
| KaloData | TikTok Shop analytics and Video & Ad research | Product, creator, shop and advertising questions | Verify module coverage, estimates and plan limits |
| FastMoss | TikTok Shop analytics | Product + creator discovery, broad TikTok ecommerce data | Estimates; overlapping feature creep |
| Shoplus | TikTok Shop analytics | Product trends, creator search, regional coverage | Data depth varies by market |
| EchoTik | TikTok Shop analytics | Product/creator/shop data, influencer outreach | Estimate accuracy varies |
| TikTok Creative Center | TikTok creative research | Official ad and trend discovery | Check the selected dataset, available filters and access conditions |
| Meta Ad Library | Meta ad transparency | Official advertiser and creative checks | Availability and historical retention vary by region and ad category |
| Google Ads Transparency Center | Ad creative research (Google-only) | Verified Google-ecosystem ad examples | Google-only; limited performance context |
| AdMapix | Cross-network ad intelligence | Searching, saving, analyzing & reporting competitor ads across networks | Not a TikTok Shop sales-analytics tool |
Use this table as a shortlist, not a measured ranking. Compare the same competitors and dates in each candidate; overlapping feature names do not establish equal record coverage.
The Shop-Analytics Substitutes (Same Job as KaloData)
If your job is genuinely TikTok Shop intelligence — sourcing products, validating demand, finding creators — these are the real like-for-like alternatives. Judge them on four axes: data coverage and freshness, creator-discovery depth, regional strength in your markets, and pricing/seats.
FastMoss
FastMoss is one of the broadest TikTok Shop analytics platforms, covering product discovery, creator analytics, shop data, and short-video/livestream signals. Teams pick it when they want wide TikTok ecommerce coverage in one place. As with every tool in this category, its sales and GMV figures are modeled estimates, strong for ranking and direction but not audited financials. Compare its creator depth and regional coverage against KaloData for your specific markets before switching.
Shoplus
Shoplus emphasizes product-trend discovery and creator search, and is often cited for coverage in Southeast Asian markets where some competitors are thinner. If your sourcing or selling skews toward SEA, Shoplus is worth a direct comparison. Validate the depth of its data in your exact category, since coverage quality varies more by region than feature lists suggest.
EchoTik
EchoTik covers product, creator, and shop-level data with a lean toward influencer discovery and outreach. Teams that partner with creators at scale value its creator-side tooling. Like its peers, treat its numbers as directional estimates and confirm category coverage for your niche.
The honest summary of this group: they converge on features and differ most on data coverage by region and creator depth. Don't choose on a feature checklist — run the same product and creator query through two or three of them in trial and pick the one whose data is strongest where you operate.
The Ad-Intelligence Alternatives (A Different Job)
For ad research, first test the Video & Ad or equivalent module in your existing tool. Add an official library or cross-network product if the results do not cover the networks, competitors or deliverables you need.
TikTok Creative Center
TikTok Creative Center provides official creative discovery tools. Check the scope and access conditions of the selected dataset; do not assume it is a complete archive of every competitor campaign.
The major ad libraries
Official libraries are useful for checking source records. Historical availability differs by network, region and ad category; record the source URL and retrieval date rather than promising that all commercial records persist or all disappear. See our Facebook Ads Library guide.
Cross-network ad intelligence
The gap the single-network tools leave is consolidation: studying TikTok, Meta, Google, and more in one workspace, preserving creatives so nothing is lost, and turning patterns into reports. That's the cross-network ad-intelligence job, and it's where AdMapix fits — covered in detail below. For the full landscape of these tools, see best ad spy tools 2026 and marketing intelligence tools.
Why Cross-Network Matters Even for TikTok-First Sellers
It's tempting for a TikTok Shop seller to assume a TikTok-only ad tool is enough — after all, the selling happens on TikTok. But the winning ad angles often don't originate or stay there. A hook that's crushing on Meta this month frequently migrates to TikTok next month, and vice versa; the best creative teams borrow proven structures across platforms before their competitors do. If you only watch TikTok ads, you see the angle after it has already arrived and saturated your own platform — you're perpetually a step behind the brands sourcing inspiration cross-network.
There's a second reason. The same product is frequently advertised by different sellers on different platforms with different angles. A posture corrector might be sold with a "back pain relief" angle on Meta, a "before/after transformation" hook on TikTok, and a "doctor-recommended" framing on Google. Seeing only one platform gives you one-third of the creative playbook for your own product. Cross-network visibility is what lets you assemble the full set of proven angles and pick the strongest one to adapt — rather than reinventing what already works elsewhere.
This is precisely why a cross-network tool is a genuine complement to a TikTok Shop analytics tool, not a redundancy. The shop tool tells you what to sell on TikTok; a cross-network ad tool tells you every way the market has figured out how to sell it — TikTok included, but not TikTok alone. For a deeper treatment of working across platforms, see spy on ads across all platforms.
Tools That Blur the Line (and Why That's a Trap)
A few tools market themselves across both jobs, which is exactly what makes the category confusing. Knowing how to read them keeps you from buying a jack-of-all-trades that's master of neither.
TikTok-ad spy tools (e.g., Pipiads-style platforms). These focus on TikTok ads — spy on TikTok ad creatives, find trending ad videos, and sometimes bolt on a product-research module. They're closer to the creative-intelligence job than KaloData is, but most are TikTok-only and don't consolidate across Meta, Google, and other networks. If your competitor research is purely TikTok, they're worth a look; if you run multi-network paid social, you'll outgrow a single-network spy tool quickly.
Multi-module suites. Test each relevant module with the same research task. A bundle may cover both jobs well enough; do not assume either a specialist or an all-in-one product will be better without comparing the output.
Evaluate the output: measure correct entity matches, relevant records, useful dates, source traceability and time to a usable brief. A single login is convenient, but the evidence must answer your question.
A Buyer's Checklist for Any KaloData Alternative
Whichever category you land in, run every candidate through the same checklist during its trial. Feature lists converge; these are the dimensions that actually separate a good fit from an expensive mismatch.
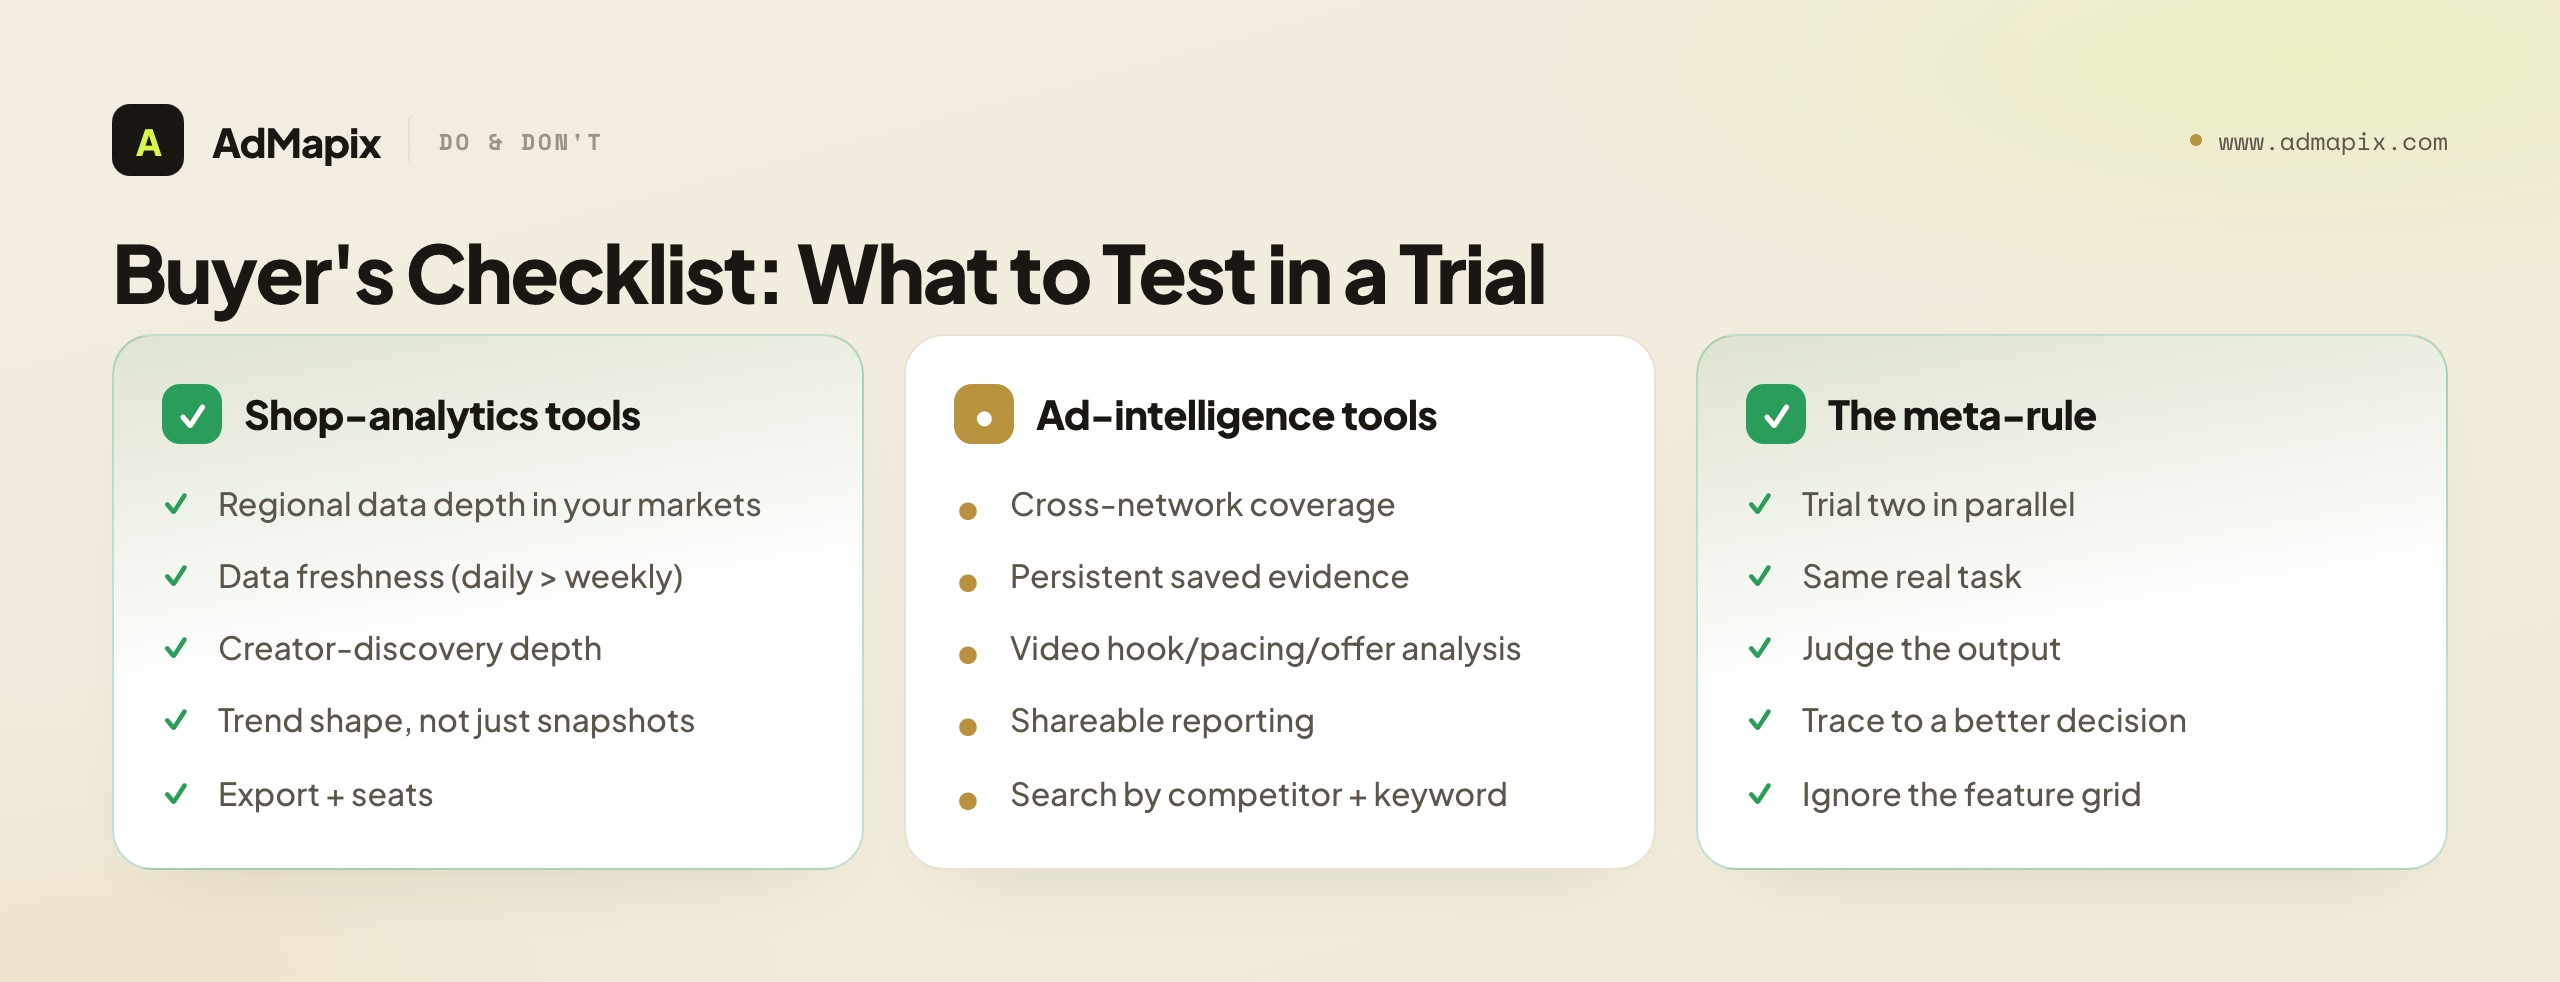
For shop-analytics tools (the KaloData-job substitutes):
- Regional data depth in your markets. Run your exact category in your exact target country. Does the data feel complete, or thin? This matters more than any feature.
- Data freshness. How often does it update? Daily beats weekly for catching trends early.
- Creator-discovery depth. Can you find, filter, and shortlist creators by category GMV, not just browse a generic list?
- Trend shape, not just snapshots. Can you see whether a product is climbing or already peaking? A point-in-time GMV number without a trend line is half the picture.
- Export and seats. Can you get the data out, and does the plan cover your team?
For ad-intelligence tools (the different job):
- Cross-network coverage. TikTok-only, or TikTok + Meta + Google + more? Single-network tools leave blind spots.
- Persistent evidence. Check whether links, saved collections and permitted exports meet your needs, and whether previously saved records remain accessible.
- Video-level analysis. Can you break a winning ad into hook, pacing, and offer — the things that actually drive paid-social performance — not just view a thumbnail?
- Reporting. Can you package findings into a shareable report for a team or client without manual screenshotting?
- Search depth. Can you search by competitor, keyword, market, and format, or only browse curated top-performers?
The meta-rule for the whole checklist: trial two tools in parallel on the same real task and judge the output, not the feature grid. A tool earns its price by improving your next decision — a better product shortlist, a sharper creative brief, a cleaner client report. If you can't trace a candidate to a better decision in your trial, it's the wrong tool no matter how long its feature list is.
How to Choose: A Decision Framework by Use Case
The fastest way to the right tool is to match it to your actual use case. Find the row that describes you and start there.
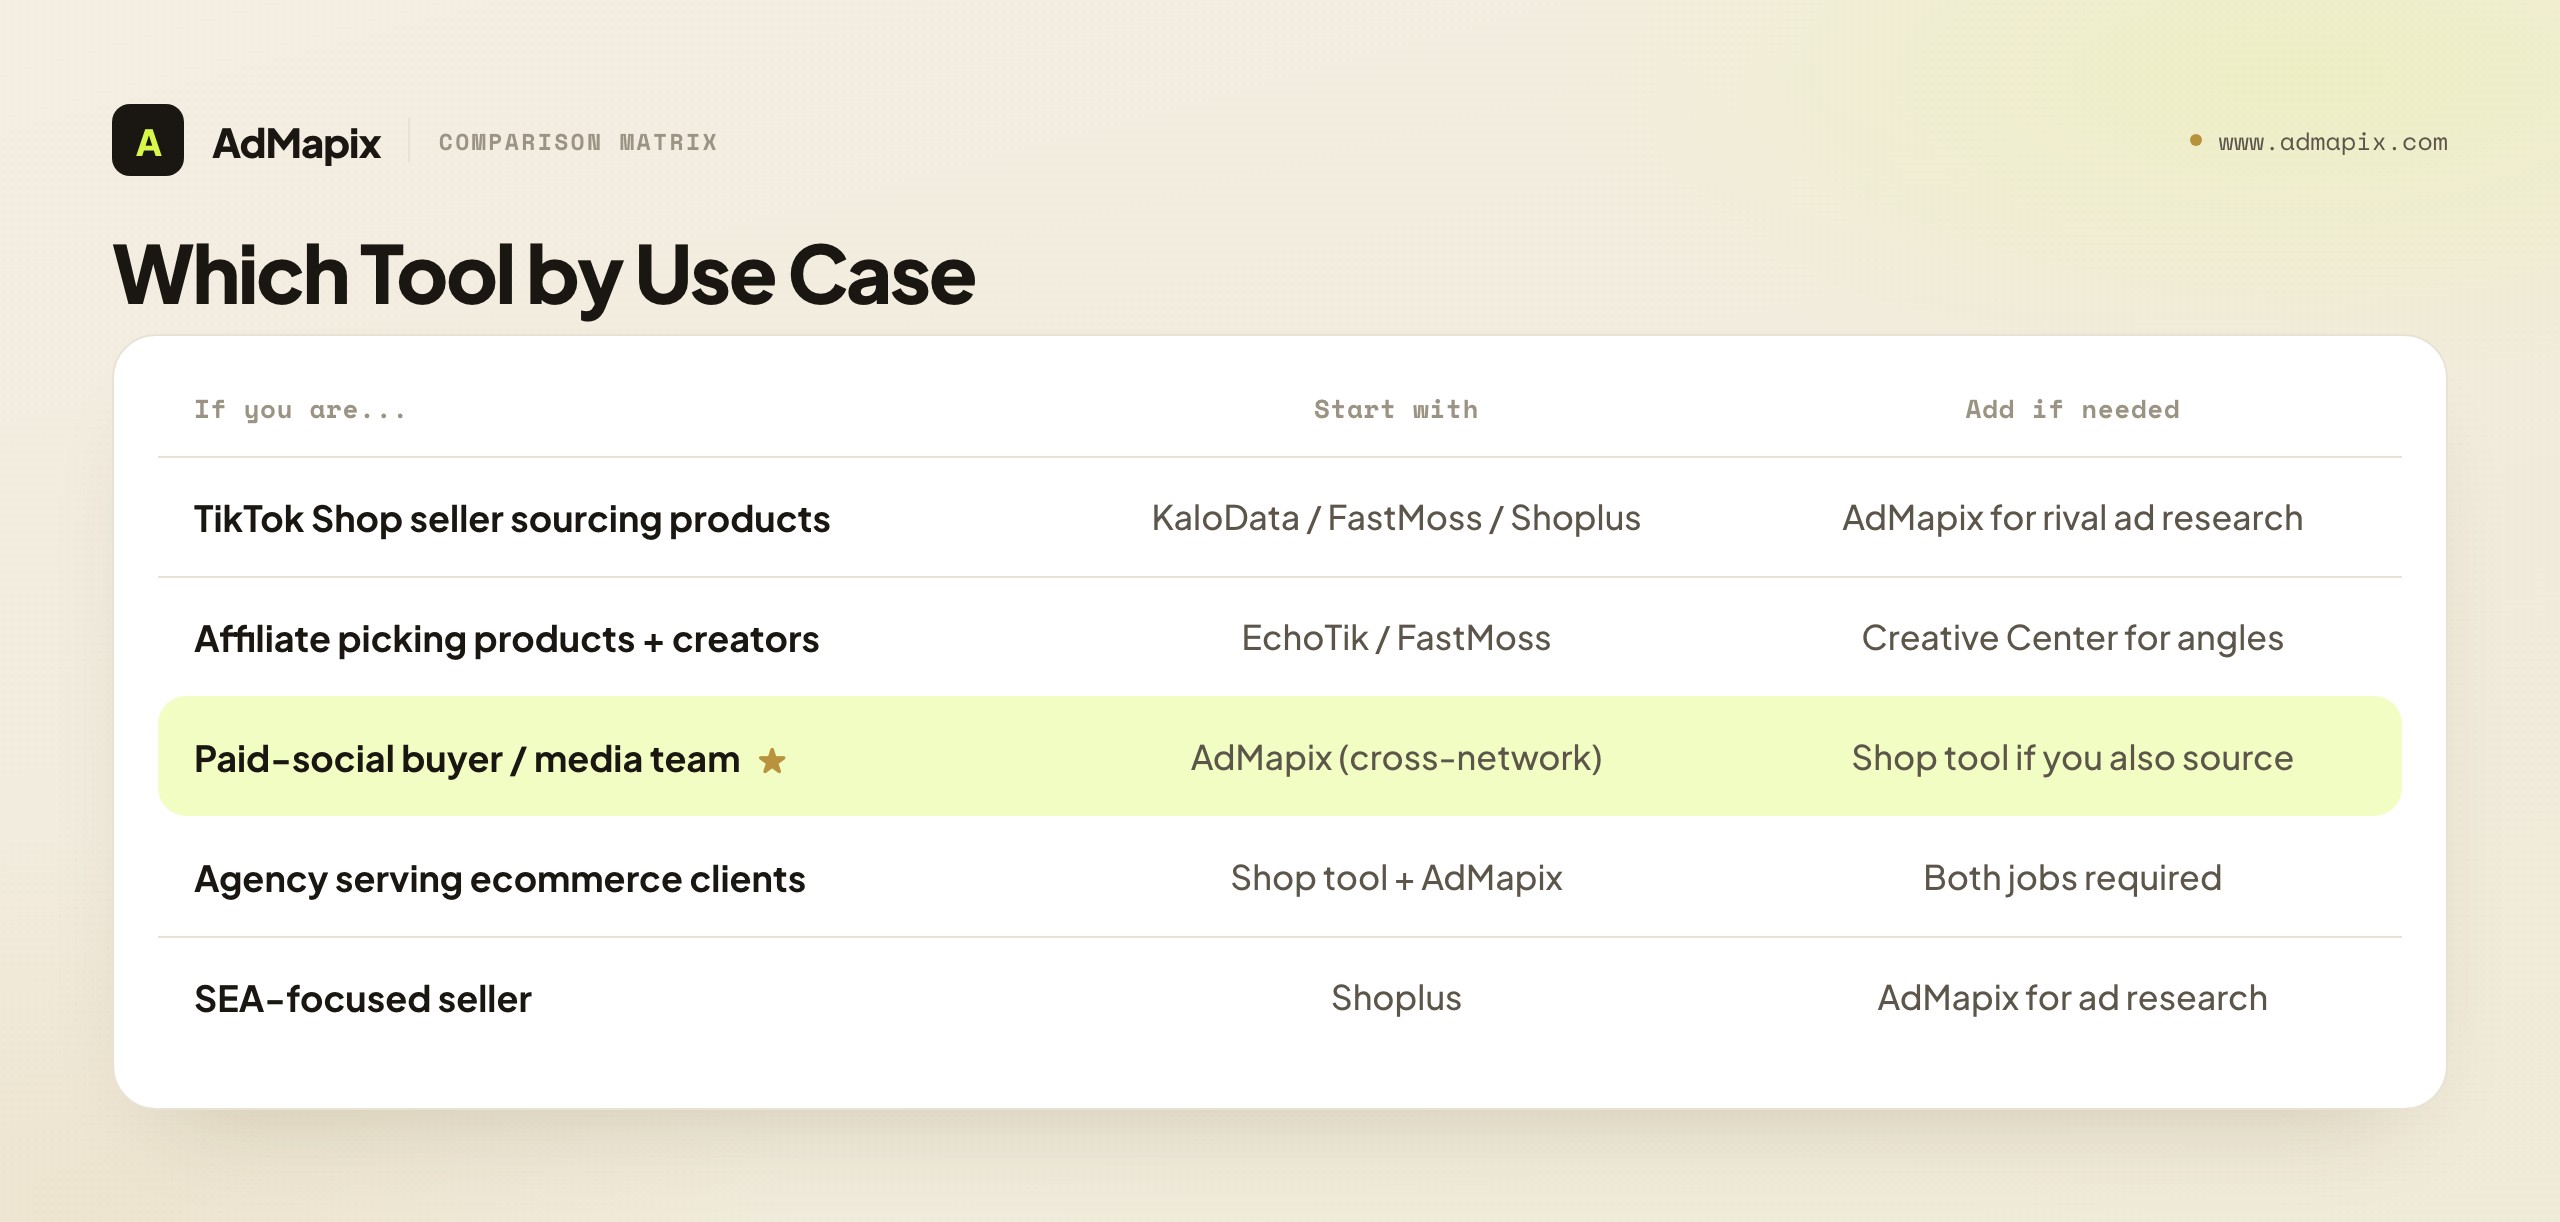
| If you are... | Your real job | Start with | Add if needed |
|---|---|---|---|
| A TikTok Shop seller sourcing products | Shop intelligence | KaloData / FastMoss / Shoplus | AdMapix to study how rivals advertise winners |
| An affiliate picking products + creators | Shop + creator intelligence | EchoTik / FastMoss | TikTok Creative Center for ad angle ideas |
| A paid-social buyer / media team | Creative intelligence | AdMapix (cross-network) | A shop tool only if you also source |
| An agency serving ecommerce clients | Both, packaged as reports | Shop tool + AdMapix | — (you need both jobs) |
| An SEA-focused seller | Region-strong shop analytics | Shoplus | AdMapix for competitor ad research |
| A brand studying competitor video hooks | Creative intelligence | AdMapix + TikTok Creative Center | — |
| A founder validating a niche | Shop intelligence first | KaloData / FastMoss | AdMapix before you write your first ads |
The pattern is consistent: if your next decision is what to sell or who to partner with, lead with a shop-analytics tool. If your next decision is what ad to make or test, lead with an ad-intelligence tool. Many of these rows end in "use both," because the two jobs genuinely complement each other — shop data tells you what sells, creative intelligence tells you how it's being marketed.
What Public Ad and Shop Data Can — and Cannot — Prove
This caveat applies to every tool in this guide, and skipping it is how teams make confident, expensive mistakes.
Competitor ad creatives are evidence of what a brand chose to run, not proof that it worked. In any ad-intelligence tool you can see the creative, format, hook, and offer, and you can infer which angles a brand bets on by how often it repeats them and how long it runs them. What you cannot see is the spend behind each ad, the conversion rate, or the profit. Treat repeated, long-running creatives as strong hypotheses worth testing — then validate them with your own campaign data.
The same caveat applies to shop-analytics tools. Estimated GMV and sales figures are modeled signals — derived, not reported. KaloData and its competitors are independent SaaS platforms, not official TikTok data sources, and they describe their figures as estimates. That makes them genuinely useful for ranking products and reading direction, and unreliable as audited financials. The discipline is the same on both sides of the tool divide:
| Signal | Good for | Never claim |
|---|---|---|
| Estimated GMV / product sales | Ranking, demand direction, sourcing shortlists | Exact revenue or profit |
| Creator GMV estimates | Partnership shortlisting | A creator's true earnings |
| Competitor ad creatives | Hook/offer hypotheses, angle discovery | That an ad is profitable |
| Ad longevity / repetition | Describing observed persistence and selecting examples to inspect | Profit, ROAS, spend or conversion rate |
Use these tools to direct decisions and generate hypotheses. Use your own first-party data — sales, conversion rate, ROAS — to confirm them.
Common Mistakes When Picking a KaloData Alternative
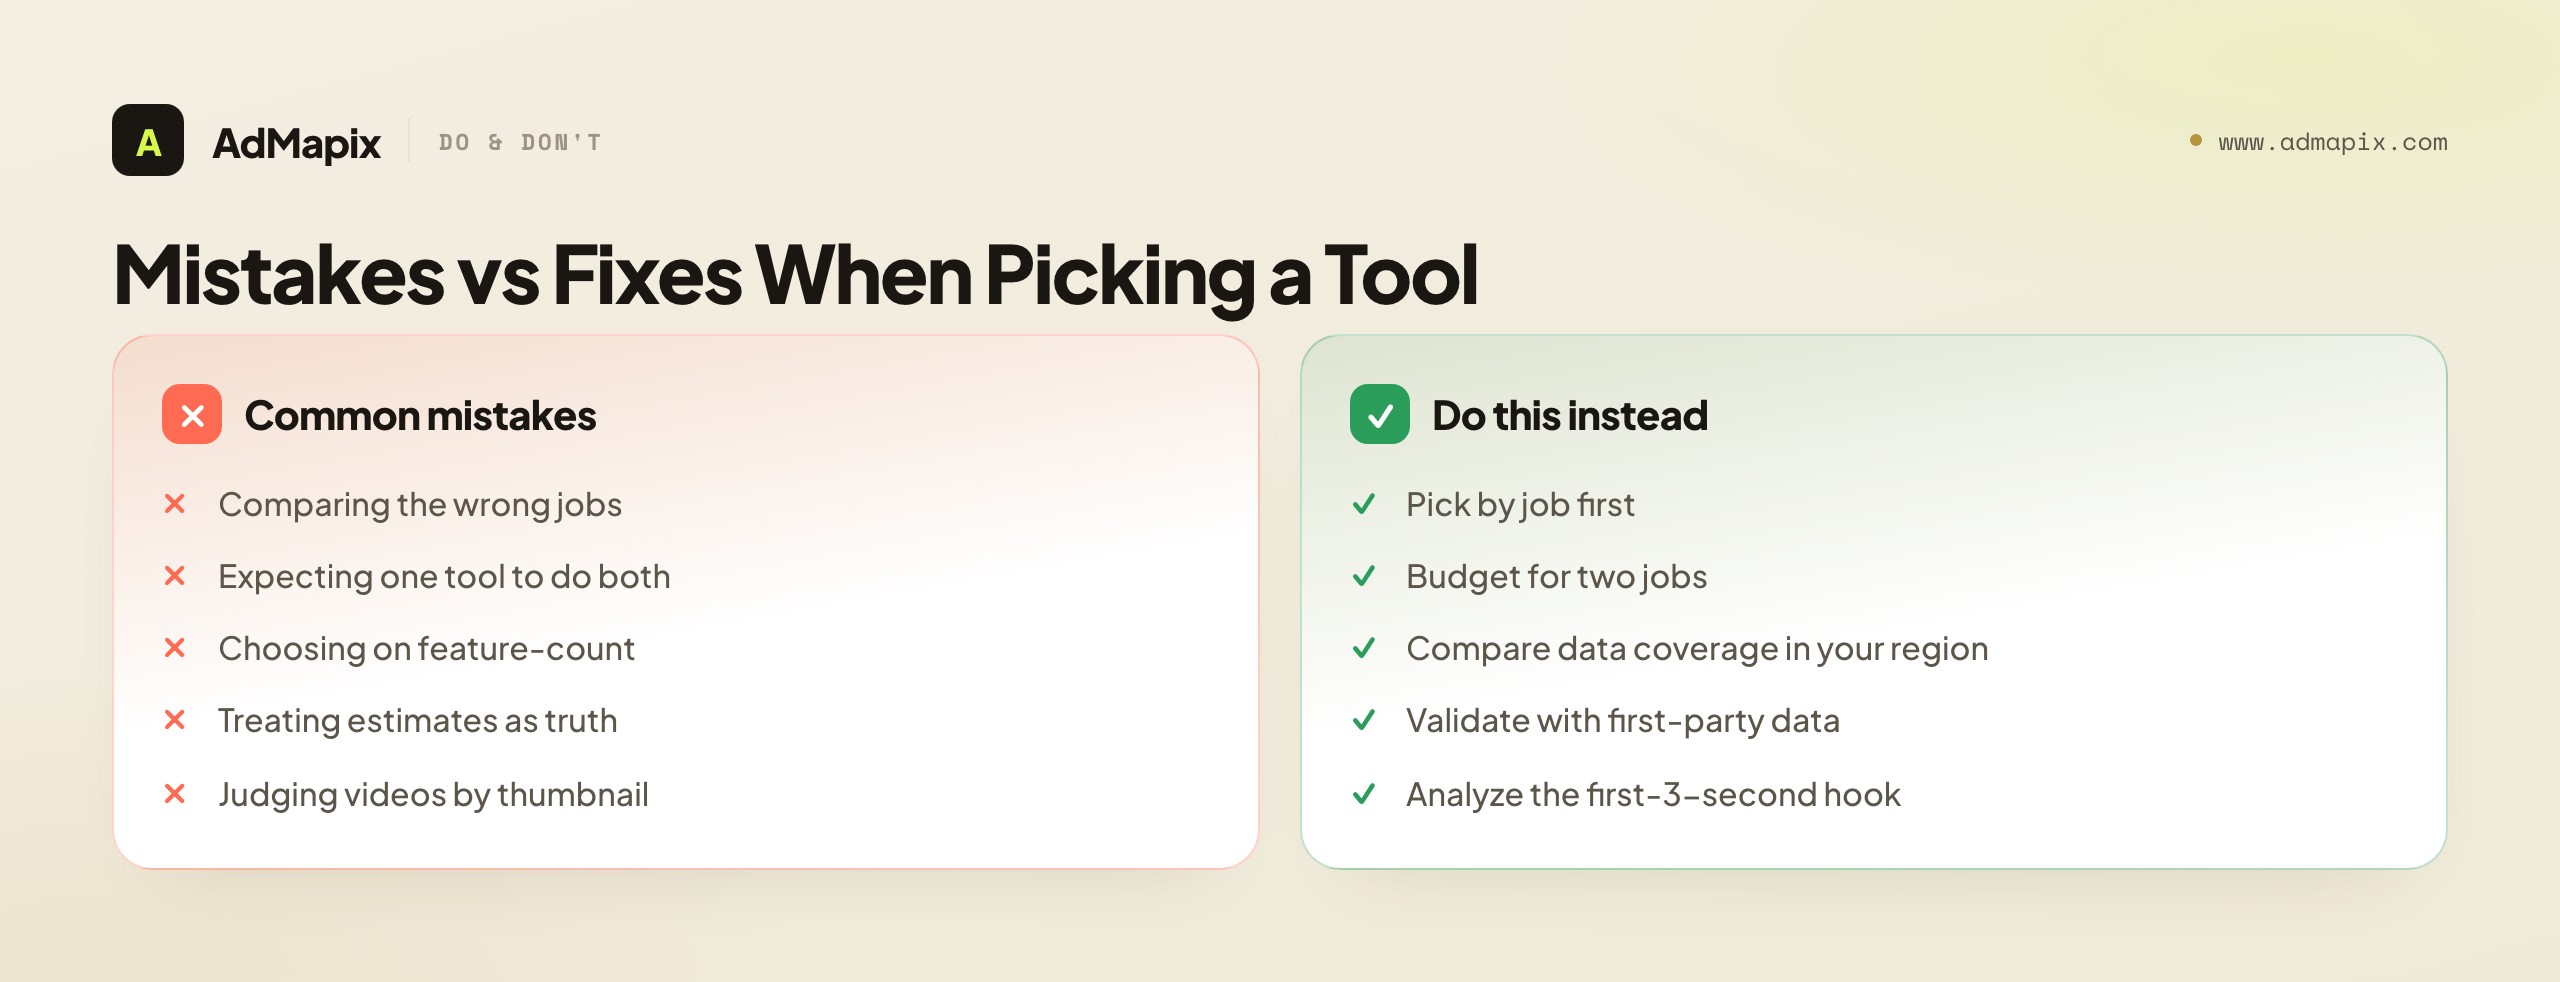
- Comparing the wrong jobs. A shop-analytics tool and an ad-creative tool are not substitutes; judging one by the other's strengths guarantees the wrong purchase. This is the single most common error.
- Assuming category labels settle the choice. Tools can overlap. Test both shop research and ad research before deciding to replace or supplement a subscription.
- Choosing on feature-count. Feature lists converge across competitors; the real differentiators are data coverage in your region and the specific job the tool is built around.
- Treating estimates as truth. Both modeled GMV and "this ad runs a lot" are directional signals, not financials or proof of profit. Validate with your own data.
- Judging videos by the thumbnail. For paid social, the first-three-seconds hook, pacing, and offer decide performance far more than the still frame — a tool that only shows thumbnails under-serves creative research.
- Skipping the handoff. Research only pays off when it becomes a sourcing decision, a creative brief, a test plan, or a client report. A tool with no clean path to a deliverable wastes the insight you paid for.
When to Use AdMapix (Honest Positioning)
Use AdMapix when the job is competitor ad creative intelligence — not when the job is TikTok Shop sales analytics. We'll say that plainly because recommending AdMapix for the wrong job would waste your money and your time.
AdMapix is a cross-network ad creative search tool: you search the ads competitors run across markets and networks, save the strongest examples, break the videos down, tag patterns, and turn them into reports. It's built for paid-social teams, agencies, affiliates, and founders who need creative evidence before writing a brief or pitching a client — the consolidation-and-reporting layer the single-network free tools don't provide.
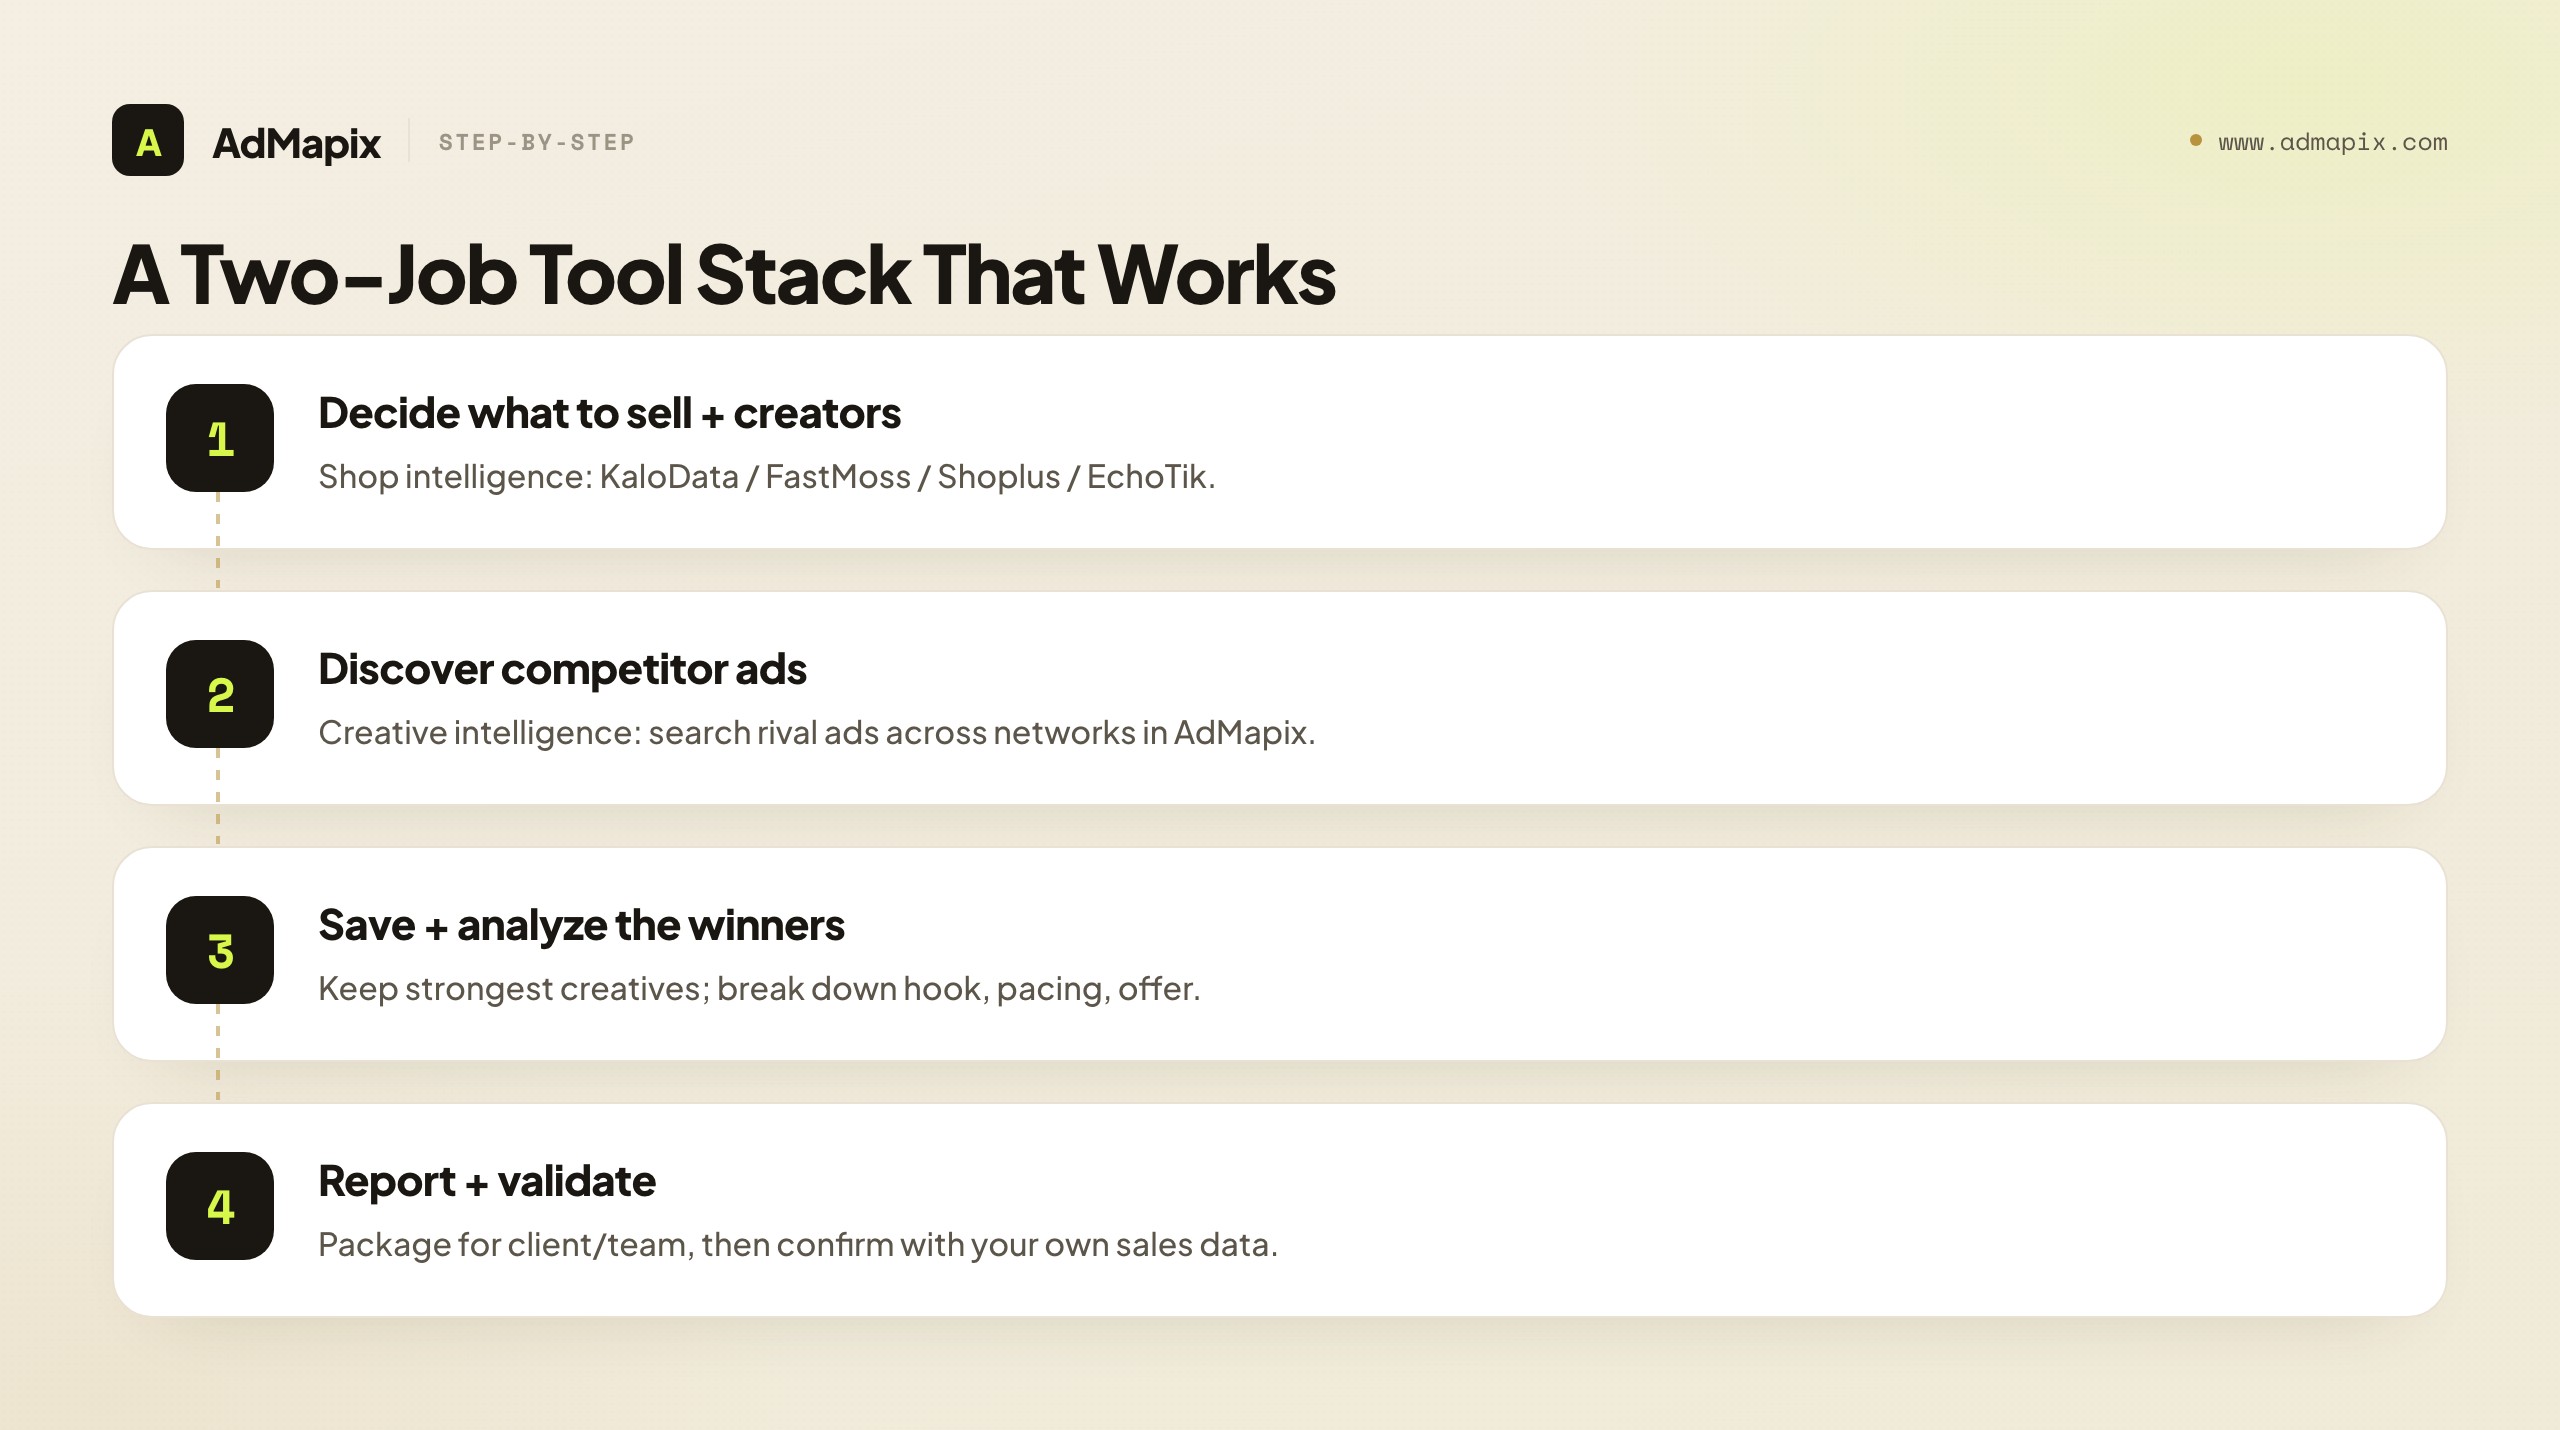
A practical setup that respects the two-job split:
| Step | Job | Tool |
|---|---|---|
| Decide what to sell + which creators | Shop intelligence | KaloData / FastMoss / Shoplus / EchoTik |
| Discover competitor ads across networks | Creative intelligence | Search AdMapix |
| Save the strongest creatives as evidence | Creative intelligence | Media |
| Break a winning ad into hook, pacing, offer | Creative intelligence | Video Analysis |
| Package findings for a team or client | Creative intelligence | Reports |
When a competitor set needs weekly review, run it once in Search AdMapix, keep the best examples in Media, and compare seats on Pricing or start from Login.
AdMapix is not for you if you only need TikTok Shop product rankings, creator GMV estimates, or livestream sales analytics — a shop-analytics tool serves that job better, full stop. It is for you when your next decision depends on understanding competitor ads and the videos behind them. For how this fits a broader competitor workflow, see paid ads competitor research and the competitor ad analysis framework.
How TikTok Shop Tools Actually Estimate GMV
Before you trust any number in this category, it helps to understand where it comes from — because "estimated GMV" means something specific, and misreading it is how sellers make confident sourcing mistakes.
TikTok Shop does not publish per-product or per-creator sales figures to third parties. So tools like KaloData, FastMoss, Shoplus, and EchoTik model sales by combining the public signals they can observe: a product's visible order counts and review velocity, a video's view and engagement metrics, livestream viewer and interaction data, listed prices, and historical patterns of how those signals convert to sales in a category. They then apply estimation logic to turn those signals into a GMV number. Different tools weight these signals differently, which is exactly why two tools can show different GMV for the same product — and why no single tool is "the accurate one."
This has three practical consequences for choosing an alternative:
- Ranking is reliable; absolute numbers are not. All these tools are good at telling you product A is selling more than product B in a category. They are far less reliable at telling you product A did exactly $84,000 last week. Use them to rank and shortlist, not to forecast revenue.
- Coverage quality varies by region and category. A tool's estimates are only as good as the signals it captures in your market. A tool strong in the US may be thin in Indonesia or the UK. This is the single most important thing to test in a trial — run your real category in your real market and judge whether the data feels complete.
- Freshness matters for trend-spotting. TikTok Shop trends move fast. A tool that updates daily will catch a rising product earlier than one that refreshes weekly. If your edge is being early to a trend, weight data freshness heavily.
The honest takeaway: every tool in the shop-analytics group is playing the same modeling game with different inputs. Choose the one whose directional ranking you trust most in your markets, and never build a sourcing plan on the assumption that the GMV figure is exact.
There's a simple way to sanity-check estimate quality during a trial: pick a product you already know something about — one you sell, or one whose rough performance you can verify from a public TikTok Shop storefront — and see how closely the tool's estimate tracks reality and how it ranks that product against neighbors you also recognize. You're not looking for the number to be exact (it won't be); you're checking whether the relative ranking matches your real-world sense of the category. A tool that ranks a product you know is selling well near the bottom of its category list is a tool whose signal is weak in your market, regardless of how polished its dashboard looks. Run this check on two or three tools at once and the differences in data quality become obvious fast — far more reliably than comparing their feature pages. It takes ten minutes, and it's the single most informative test you can run before committing real budget to any shop-analytics platform, because it measures the one thing that actually matters: whether the tool's view of your market matches reality well enough to trust your sourcing decisions to it.
A Worked Example: Sourcing a Product the Right Way
Frameworks land better with a concrete walk-through. Here's how a small TikTok Shop seller — call her a solo operator entering the home-fitness niche — uses both tool jobs to make one good decision, instead of guessing with one tool.
Step 1 — Shop intelligence: find candidates. She opens a KaloData-style analytics tool (KaloData, FastMoss, or Shoplus) and filters the home-fitness category by rising estimated GMV over the last 30 days in her target market, the US. Three products surface as trending: a resistance-band set, a compact pull-up bar, and a posture corrector. She treats the GMV numbers as rankings, not revenue — the point is that these three are heating up relative to the category, not that any figure is exact.
Step 2 — Shop intelligence: validate demand and creators. For each candidate, she checks the trend shape (is it climbing or already peaking?), the spread of sellers (is it saturated by one dominant shop, or open?), and which creators are driving the category's GMV. The resistance-band set looks crowded; the posture corrector is climbing with only a few sellers and a handful of mid-tier creators doing the volume. That's a promising combination: rising demand, room to enter, and an identifiable creator pool to partner with.
Step 3 — Creative intelligence (illustrative example). Evaluate the existing tool’s Video & Ad module and any additional sources needed for the chosen networks. Suppose several retrieved videos show a posture change and a bundle offer: that is an observed structure to inspect, not evidence that those videos perform best. Record the source and formulate a testable hypothesis without inferring success from repetition.
Step 4 — Synthesize into a decision. Now she has both halves: shop data says the posture corrector is a rising, enterable product with a workable creator pool, and creative intelligence says the winning ad angle is a fast before/after transformation with a bundle offer. That's a sourcing decision and a creative brief in one. She sources the product, drafts a brief built on the transformation hook (adapted, not copied), shortlists three creators from the category, and — critically — plans to validate everything with her own first sales and conversion data before scaling.
The lesson is the spine of this guide: neither tool alone gets her there. Shop analytics without creative intelligence picks a product but ships a weak ad; creative intelligence without shop analytics writes a great ad for a product nobody's buying. The two jobs, used together, turn a guess into an evidenced decision.
Building a Weekly TikTok Shop Research Workflow
Tools only pay off inside a repeatable routine. Here's a lightweight weekly workflow that uses both jobs and takes under an hour — the kind of cadence that compounds into a real edge over sellers who research sporadically.
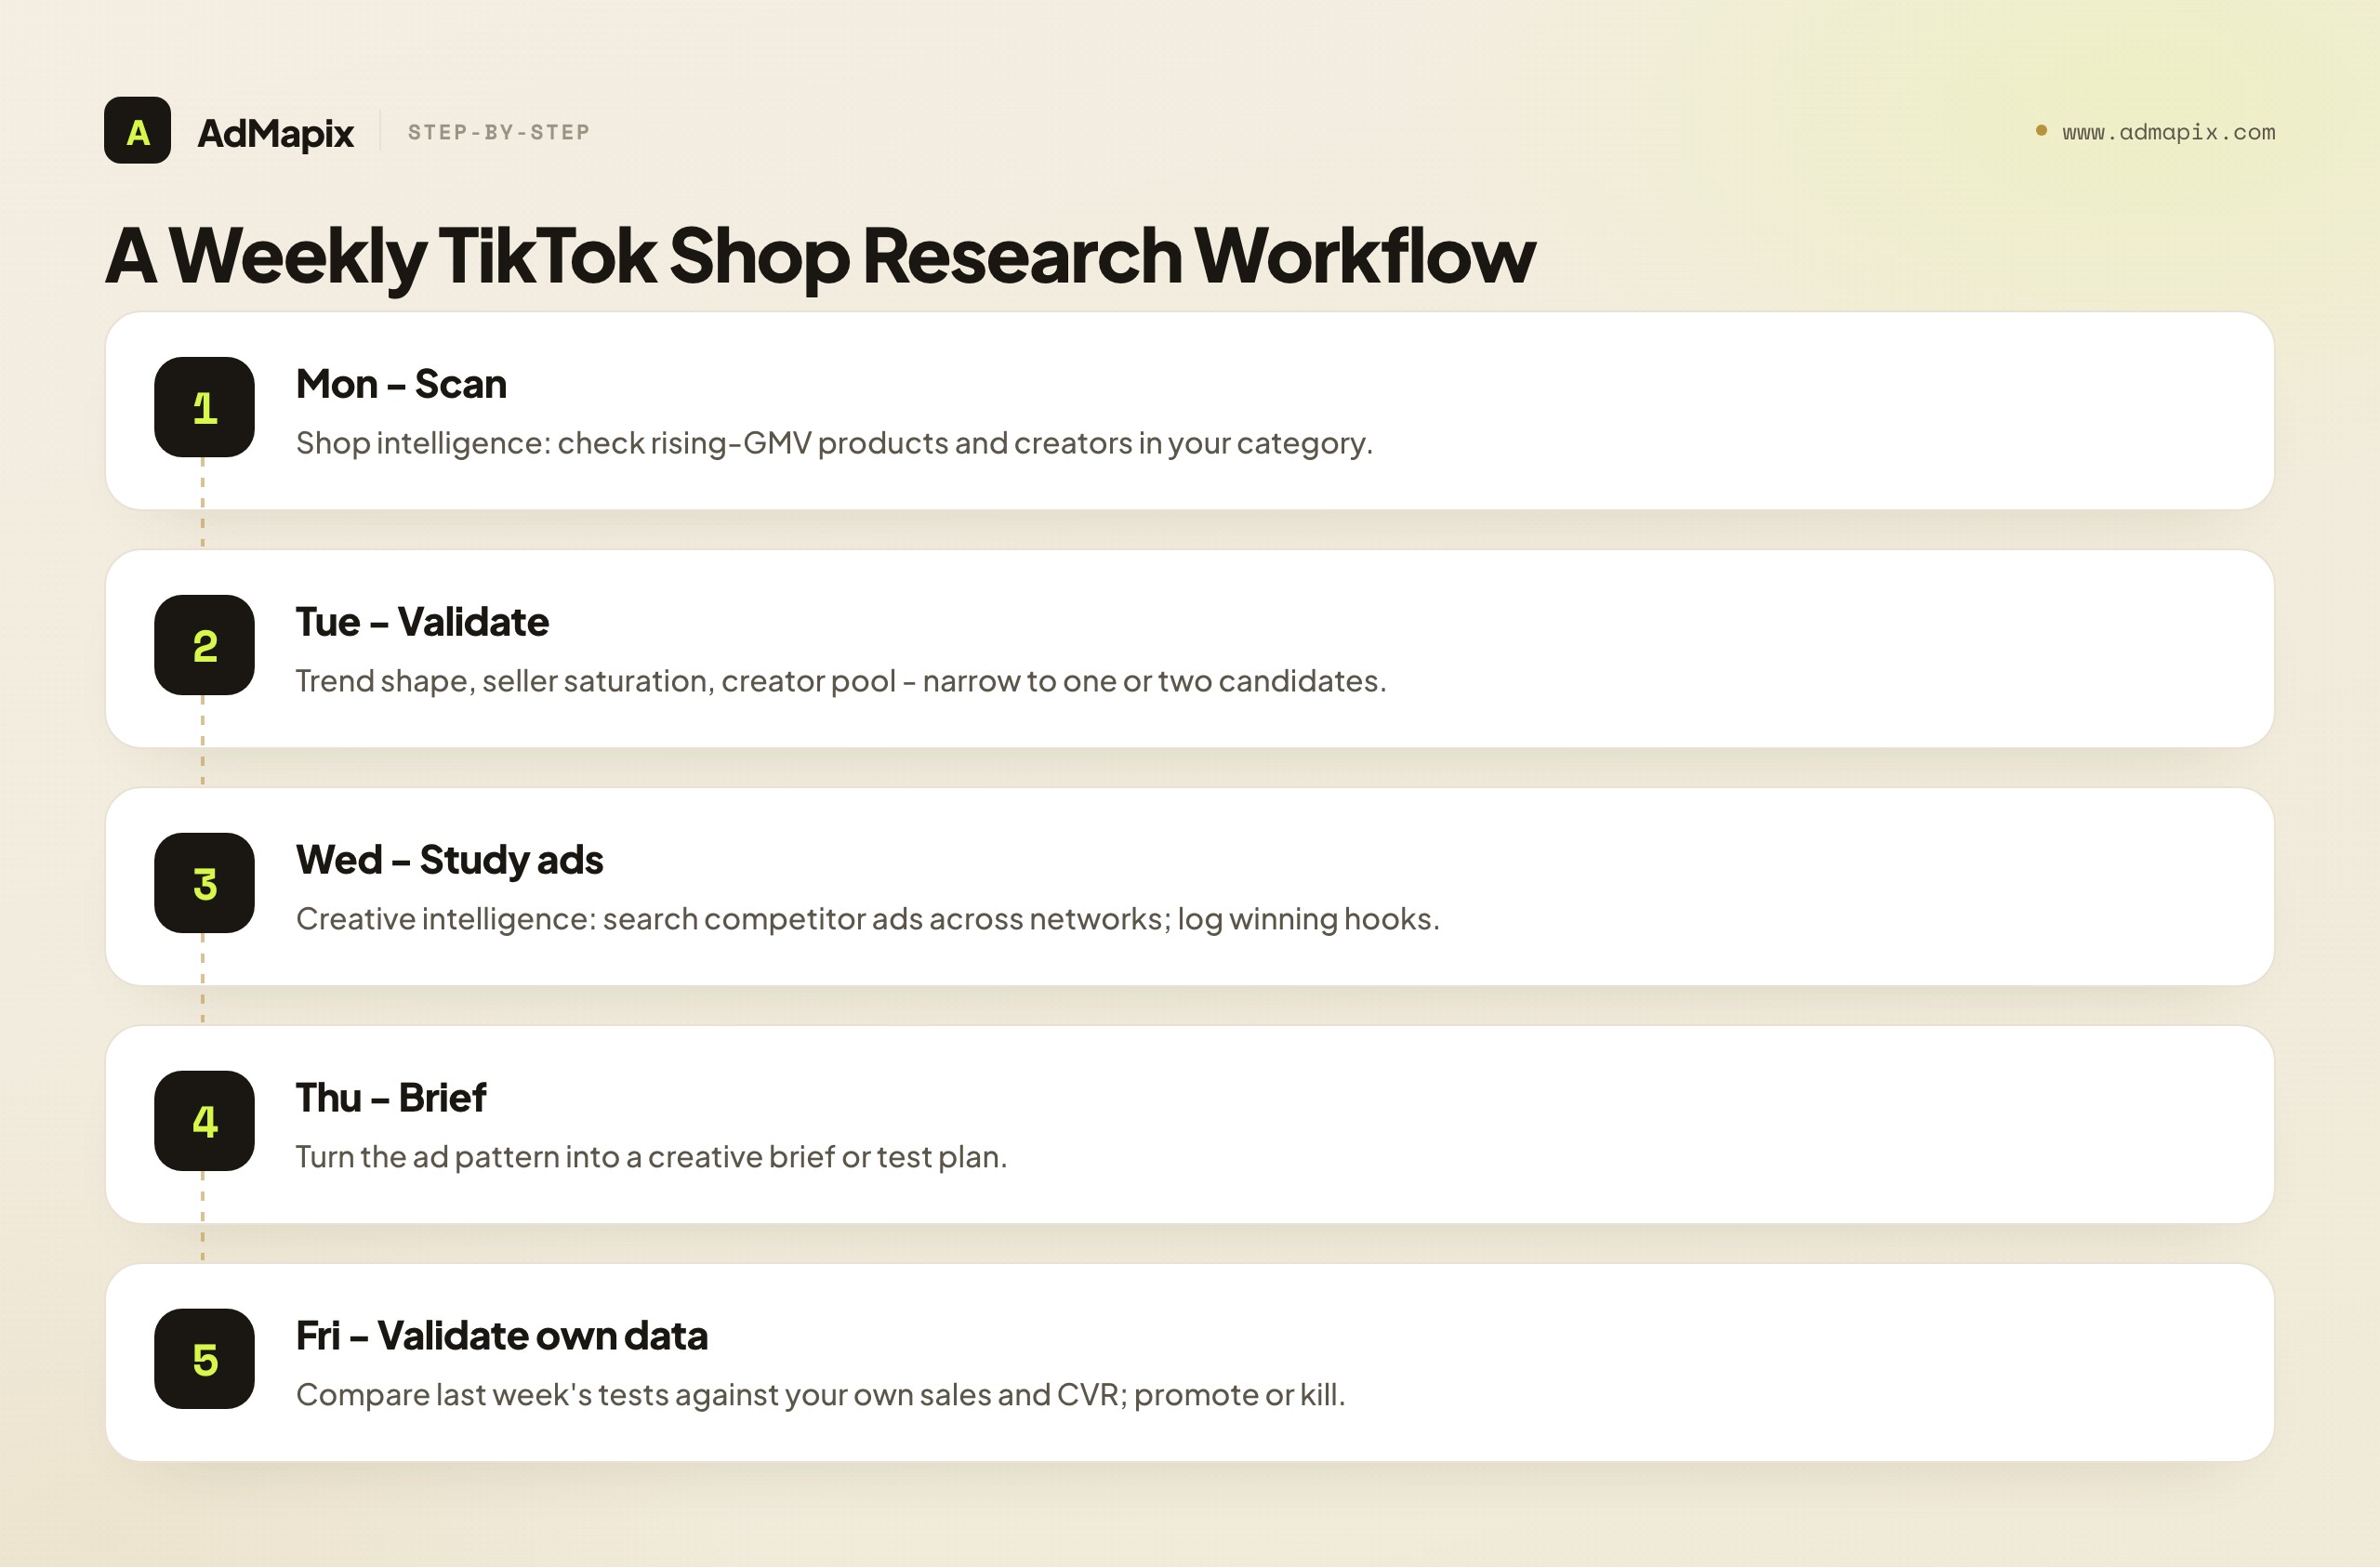
| Day / step | Job | Action | Output |
|---|---|---|---|
| Monday — scan | Shop intelligence | Check rising-GMV products + creators in your category | A short list of movers |
| Tuesday — validate | Shop intelligence | Trend shape, seller saturation, creator pool per candidate | One or two real candidates |
| Wednesday — study ads | Creative intelligence | Search competitor ads for the candidate across networks | Winning hooks + offers logged |
| Thursday — brief | Creative intelligence | Turn the ad pattern into a brief or test plan | A ready-to-shoot creative brief |
| Friday — validate own data | First-party | Compare last week's tests against your own sales/CVR | Promote, kill, or iterate |
Three rules keep this workflow honest. First, separate the jobs but connect the outputs — the shop scan feeds the ad study, which feeds the brief. Second, log evidence, don't just look at it. A winning competitor ad you screenshot and tag becomes a reusable brief; one you glance at and forget is wasted research. Third, always end on your own data. The competitor and shop signals generate hypotheses; your sales numbers are the only thing that confirms them. A team running this loop for a quarter builds something more valuable than any single insight — a history of what trended, what they tested, and what actually converted, which is the asset that makes next quarter's decisions faster and sharper.
This is also where keeping evidence in one place matters. Running the ad-study step in a tool that lets you save creatives, analyze the video, and compile reports turns a scattered week of tabs into a durable, shareable competitive archive — exactly the gap single-network free libraries leave open.
The workflow scales down and up cleanly. A solo seller might compress all five steps into a single focused hour on Monday, tracking three competitors and one product candidate. An agency might run it per client, with one analyst owning the shop-intelligence steps and another owning the creative-intelligence steps, then merging the outputs into a weekly client report. A larger brand might run it twice a week with a bigger competitor set and formal hypothesis tracking. The cadence and depth flex, but the spine is identical: scan the shop, validate the candidate, study the ads, brief the test, and validate against your own numbers. What separates teams that compound an edge from teams that don't is rarely the tool — it's whether they actually run the loop consistently, week after week, instead of researching in sporadic bursts whenever a launch looms. Consistency is the moat; the tools just make the loop faster.
Regional Availability Is a Hidden Tool-Selection Variable
Most KaloData-alternative comparisons treat the tools as if every TikTok Shop market behaves the same. They do not, and in 2026 the regional picture is the variable most likely to make or break your tool choice — often more than price or feature depth. TikTok Shop is not equally available, equally mature, or equally stable everywhere, and your tool is only as useful as its data coverage in the specific markets you actually sell into.
Start with availability, because it bounds everything else. TikTok Shop launched and scaled first and deepest across Southeast Asia — Indonesia, Thailand, Vietnam, the Philippines, Malaysia — which is why several shop-analytics tools were built SEA-first and carry their richest data there. The US is a large but younger and more politically contingent market, where TikTok's regulatory standing has been an open question that can shift the ground under any US-focused sourcing plan. The UK and parts of Western Europe sit somewhere in between: real, growing, but thinner in third-party data coverage than SEA. The practical consequence is direct: a tool's marketing page will claim "global coverage," but its usable coverage is lumpy, and the lumps rarely line up with where you sell.
This availability map should reshape how you read the eight alternatives above. If your business is SEA-centric, a tool with deep Indonesian or Thai signal — Shoplus is frequently cited here — may rank a thinner-in-SEA competitor that looks stronger on a US-centric feature comparison. If you are a US TikTok Shop seller, weight two things heavily: how complete the tool's US signal feels on your real category, and how resilient your overall plan is to TikTok's US regulatory uncertainty. A seller whose entire sourcing engine depends on one US-only shop-analytics tool is carrying a concentration risk that has nothing to do with the tool's quality and everything to do with the platform's standing in that market.
There is a cross-border angle that matters specifically for the two-job framing at the heart of this guide. Many serious sellers and agencies now operate across multiple TikTok Shop regions at once — sourcing a product that is proven in SEA and launching it in the US, or vice versa. For them, the shop-analytics tool has to be judged region by region (and may need to be two tools, one strong in each market), while the creative-intelligence job benefits from a tool that is inherently cross-region and cross-network. A winning ad angle for a given product frequently appears in one market before it spreads to another, so a seller expanding from SEA into the US gains a real edge by studying how the product is already being advertised in the destination market before launching there. This is exactly where a cross-network ad-intelligence tool like AdMapix complements a region-specific shop-analytics tool: the shop tool tells you whether the product travels, and the ad tool shows you how the destination market is already selling it.
The takeaway is a simple addition to your trial discipline: do not just run your real category through each tool — run it through each tool in each market you sell or plan to sell in. A tool that is excellent in one region and hollow in another is a partial tool, and the only way to discover which regions are hollow is to test them directly. The vendor's coverage claim will never tell you; your own query in your own market will.
Pricing and Migration Notes
Two practical considerations before you commit.
On pricing: every tool in this guide prices and packages differently, and plans change often, so verify current details on each vendor's own page before purchasing. The more useful framing than "cheapest" is cost per job done. A shop-analytics tool and an ad-intelligence tool are separate line items because they're separate jobs — budgeting for one when you need both is the mistake that derails most tool decisions. If budget is tight, decide which job is more urgent for your next decision and fund that first.
On migration: because shop-analytics tools are largely substitutes, switching between them (KaloData → FastMoss, say) is low-friction — your workflow of "find product, validate, find creator" transfers directly. Moving between jobs is not a migration at all; it's adding a second capability. If you're leaving KaloData because you realized you need ad data, you're not replacing it — you're adding an ad-intelligence tool to a stack that may still need shop analytics too. Trial two tools in parallel on the same real query before you cancel anything, and keep your existing tool until the replacement proves its data is stronger in your markets.
FAQ
What is the best KaloData alternative in 2026?
There is no single best alternative, because it depends on the job. If you need TikTok Shop product, creator, and livestream analytics, the closest like-for-like substitutes are FastMoss, Shoplus, and EchoTik — judge them on data coverage in your region and creator depth. If you actually need competitor ad creatives, video breakdowns, and reports, that's a different category, and a cross-network ad-intelligence tool such as AdMapix fits. Many teams run one of each.
Should I switch from KaloData entirely, or just add a tool?
It depends on why you're looking. If KaloData's shop analytics work for you but are too expensive or thin in your region, switch to a like-for-like substitute (FastMoss, Shoplus, EchoTik) and trial it on your real category before cancelling. If KaloData works fine but you realize you also need to study competitor ads, don't switch at all — add an ad-intelligence tool alongside it, because that's a second job, not a replacement. The only case for leaving entirely is when a substitute proves clearly stronger in your markets on the same query. When in doubt, run both in parallel for a billing cycle and let the data decide.
Do these tools work outside the US market?
Coverage varies significantly by region, and this is the most important thing to verify in a trial. Some tools are strong in the US but thin in Southeast Asia, the UK, or Latin America; Shoplus, for example, is often cited for SEA coverage. Because all of these platforms model sales from the signals they can observe, their accuracy is only as good as their data collection in your specific market. Always run your real category in your real target country during a trial rather than trusting a global feature claim.
Is KaloData affiliated with TikTok Shop?
No. KaloData describes itself as an independent SaaS analytics platform that is not affiliated with, endorsed by, sponsored by, or officially associated with TikTok, TikTok Shop, or ByteDance. Its sales figures are modeled estimates, not official TikTok data. The same independence and estimate caveat applies to FastMoss, Shoplus, EchoTik, and similar tools.
Can AdMapix replace KaloData?
Not for shop-level product and sales analytics — that is not what AdMapix does. AdMapix replaces or supplements the ad-creative-intelligence layer around your TikTok Shop competitors: searching their ads, analyzing the videos, and turning patterns into reports. The two tools cover different jobs, so most teams use them together rather than one in place of the other.
What are the best free KaloData alternatives?
For the ad-research job, the strongest free options are TikTok Creative Center (TikTok top ads and trends), the Meta Ad Library, and the Google Ads Transparency Center — each single-network and free. For the shop-analytics job, most tools offer limited free tiers or trials rather than fully free access, since the modeled sales data is their core product. Use the free ad libraries to start, and trial the paid shop tools on a real query before committing.
How should TikTok Shop teams use both types of tools?
Use a KaloData-style shop-analytics tool to decide what to sell and which creators to work with, then use an ad-intelligence tool like AdMapix to study the ads competitors run for similar products — their hooks, offers, and formats. Shop data tells you what sells; creative intelligence tells you how it's being marketed. The two jobs complement each other, which is why serious teams budget for both.
How do I compare KaloData alternatives fairly?
Run the same real query — a specific product or creator search — through two or three tools in trial at the same time, and compare the data quality in your markets, not the feature lists (which converge). For ad-intelligence tools, test whether you can search across networks, save evidence persistently, analyze the video hook, and export a report. Pick the tool whose output most directly improves your next decision.
Are the sales and GMV numbers in these tools accurate?
They are modeled estimates, not audited financials. KaloData, FastMoss, Shoplus, EchoTik and peers derive GMV and sales from signals rather than official TikTok reporting, so the numbers are reliable for ranking and direction but not for exact revenue or profit. Use them to shortlist and prioritize, then validate the winners with your own first-party sales and conversion data.
What does AdMapix actually let me do?
AdMapix lets you search ad creatives across multiple ad networks, save the ones worth keeping to a media library, run video analysis on individual ads (hook, pacing, offer), tag recurring patterns, and compile the results into reports you can share with a team or client. It's the cross-network search-save-analyze-report workflow that single-network free libraries don't provide.
Which KaloData alternative is best for Southeast Asian markets?
For the shop-analytics job in SEA, prioritize tools with demonstrated depth in Indonesian, Thai, Vietnamese, and Philippine data — Shoplus is the one most often cited for strong SEA coverage, though FastMoss and EchoTik are worth comparing on your exact category. Because TikTok Shop matured first and deepest in Southeast Asia, several tools carry their richest signal there, but coverage still varies by country and niche. Don't trust a "global coverage" claim: run your real product category in your specific SEA target country during the trial and judge whether the data feels complete. For the separate creative-intelligence job, pair whichever SEA-strong shop tool you pick with a cross-network ad tool, since winning ad angles often travel between SEA and other markets.
Does TikTok's US regulatory uncertainty affect which tool I should pick?
Indirectly, yes — it's a concentration-risk question more than a feature question. If your entire sourcing engine depends on a single US-only TikTok Shop analytics tool, your plan inherits whatever uncertainty surrounds TikTok's US standing, regardless of how good that tool is. Two hedges help: weight the completeness of a tool's US signal heavily during your trial, and keep the creative-intelligence side of your stack cross-network rather than TikTok-only, so the ad-research half of your workflow stays useful even if your channel mix shifts. A cross-network ad tool like AdMapix keeps that half platform-agnostic, which is exactly the kind of resilience a politically contingent channel argues for.
Related Reading
- Best Minea alternatives in 2026 — 7 tools compared for ad & creative intelligence
- Ad strategy teardowns (series index) — real advertisers' UA playbooks broken down with AdMapix delivery data
- DramaBox ad strategy teardown — one serial hook takes 75.5% of the top 10 in short-drama UA
- Best ad spy tools 2026 — the full landscape of ad-intelligence tools
- Marketing intelligence tools — the wider tool stack
- Paid ads competitor research — the workflow these tools feed
- Competitor ad analysis framework — the broader strategic framework
- Facebook Ads Library complete guide — deep dive on the Meta evidence layer
- TikTok Creative Center tutorial — platform-specific TikTok ad research
Sources
Official pages checked as of June 21, 2026. Pricing, product names, availability, and platform support change often, so verify current details before purchasing or migrating.
- KaloData App Store listing — describes KaloData as a TikTok ecommerce data-analysis platform for creators, products, livestream, and short-video insights.
- KaloData official X profile — positions KaloData as a data tool for TikTok, Amazon, and Shopee commerce analysis.
- TikTok Creative Center — TikTok's official free hub for top ads, trends, and keyword insights.
- Meta Ad Library — Meta's free public archive of active ads across Facebook and Instagram.
- Google Ads Transparency Center — Google's verified archive of ads running across its ecosystem.
Key Takeaways
- Decide which job you're buying for first: TikTok Shop sales analytics or competitor ad creative intelligence. The category follows from the job.
- For the shop-analytics job, KaloData's real substitutes are FastMoss, Shoplus, and EchoTik — compare on regional data coverage and creator depth, not feature lists.
- For the ad-intelligence job, use TikTok Creative Center and the ad libraries to start, and a cross-network tool like AdMapix to search, save, analyze, and report.
- Treat both modeled GMV and competitor ad repetition as directional hypotheses, and validate them with your own first-party data.
- Most serious teams run a shop-analytics tool and an ad-intelligence tool together, budgeting for two jobs rather than forcing one tool to do both.
Use this article in your next research task
- Set the scope. Choose one app or brand, one country and one date window. Keep the query settings and retrieval date so repeated checks use a comparable sample.
- Inspect attributable records. Continue the research in AdMapix. For a case study, verify the developer, store and app ID before opening its creatives. For a workflow guide, start in the creative library and set the relevant network and market manually. A missing result means no match in that query, not no advertising.
- Write one testable hypothesis. Open matching examples and record the source, observation date, opening hook, mechanic or offer, and CTA. Change one variable in your own creative brief, then evaluate it with your own results.
Check the research methodology and compare context with the ad lifespan benchmarks. Repetition, estimated impressions and download trends do not establish ROAS, profit or causation. Current index coverage and access depend on the query and plan.
Turn these observations into your next creative study
Open the creative library and select samples for your market, network and research question.
Related Articles
SwipeKit Alternative in 2026: 7 Tools Compared (Swipe Files, Video & Reporting)
A 2026 guide to choosing a SwipeKit alternative — why ad-saving isn't the bottleneck, a 7-tool comparison with pricing and coverage, the saving-vs-acting distinction, a migration plan, and an honest read on when AdMapix fits and when SwipeKit is still right.
SocialPeta Alternative in 2026: 7 Tools Compared (Without Overbuying)
A 2026 guide to choosing a SocialPeta alternative — why teams overbuy mobile ad intelligence, a 7-tool comparison with pricing and coverage, the creative-vs-market-data distinction, a migration plan, and an honest read on when AdMapix fits and when SocialPeta is still right.

MagicBrief Alternative in 2026: Migration Plan + Foreplay vs Atria vs AdMapix Compared
MagicBrief shuts down July 31, 2026. A complete 2026 migration guide and comparison of MagicBrief alternatives — Foreplay, Atria, Canva Grow, and AdMapix — by what they replace, a migration-risk checklist, and how to rebuild your swipe file and briefs before the deadline.