Marketing Intelligence Tools in 2026: The 7-Layer Stack, Software Compared & Buyer's Scorecard
A practical 2026 guide to marketing intelligence tools and software — the 7-layer stack, free vs paid sources, a 6-criterion buyer's scorecard, stacks by team stage and industry, build-vs-buy math, ROI, and a weekly decision workflow that turns signals into tests.
By the AdMapix Research Team — Updated June 21, 2026
Marketing Intelligence Tools in 2026: The 7-Layer Stack, Software Compared & Buyer's Scorecard
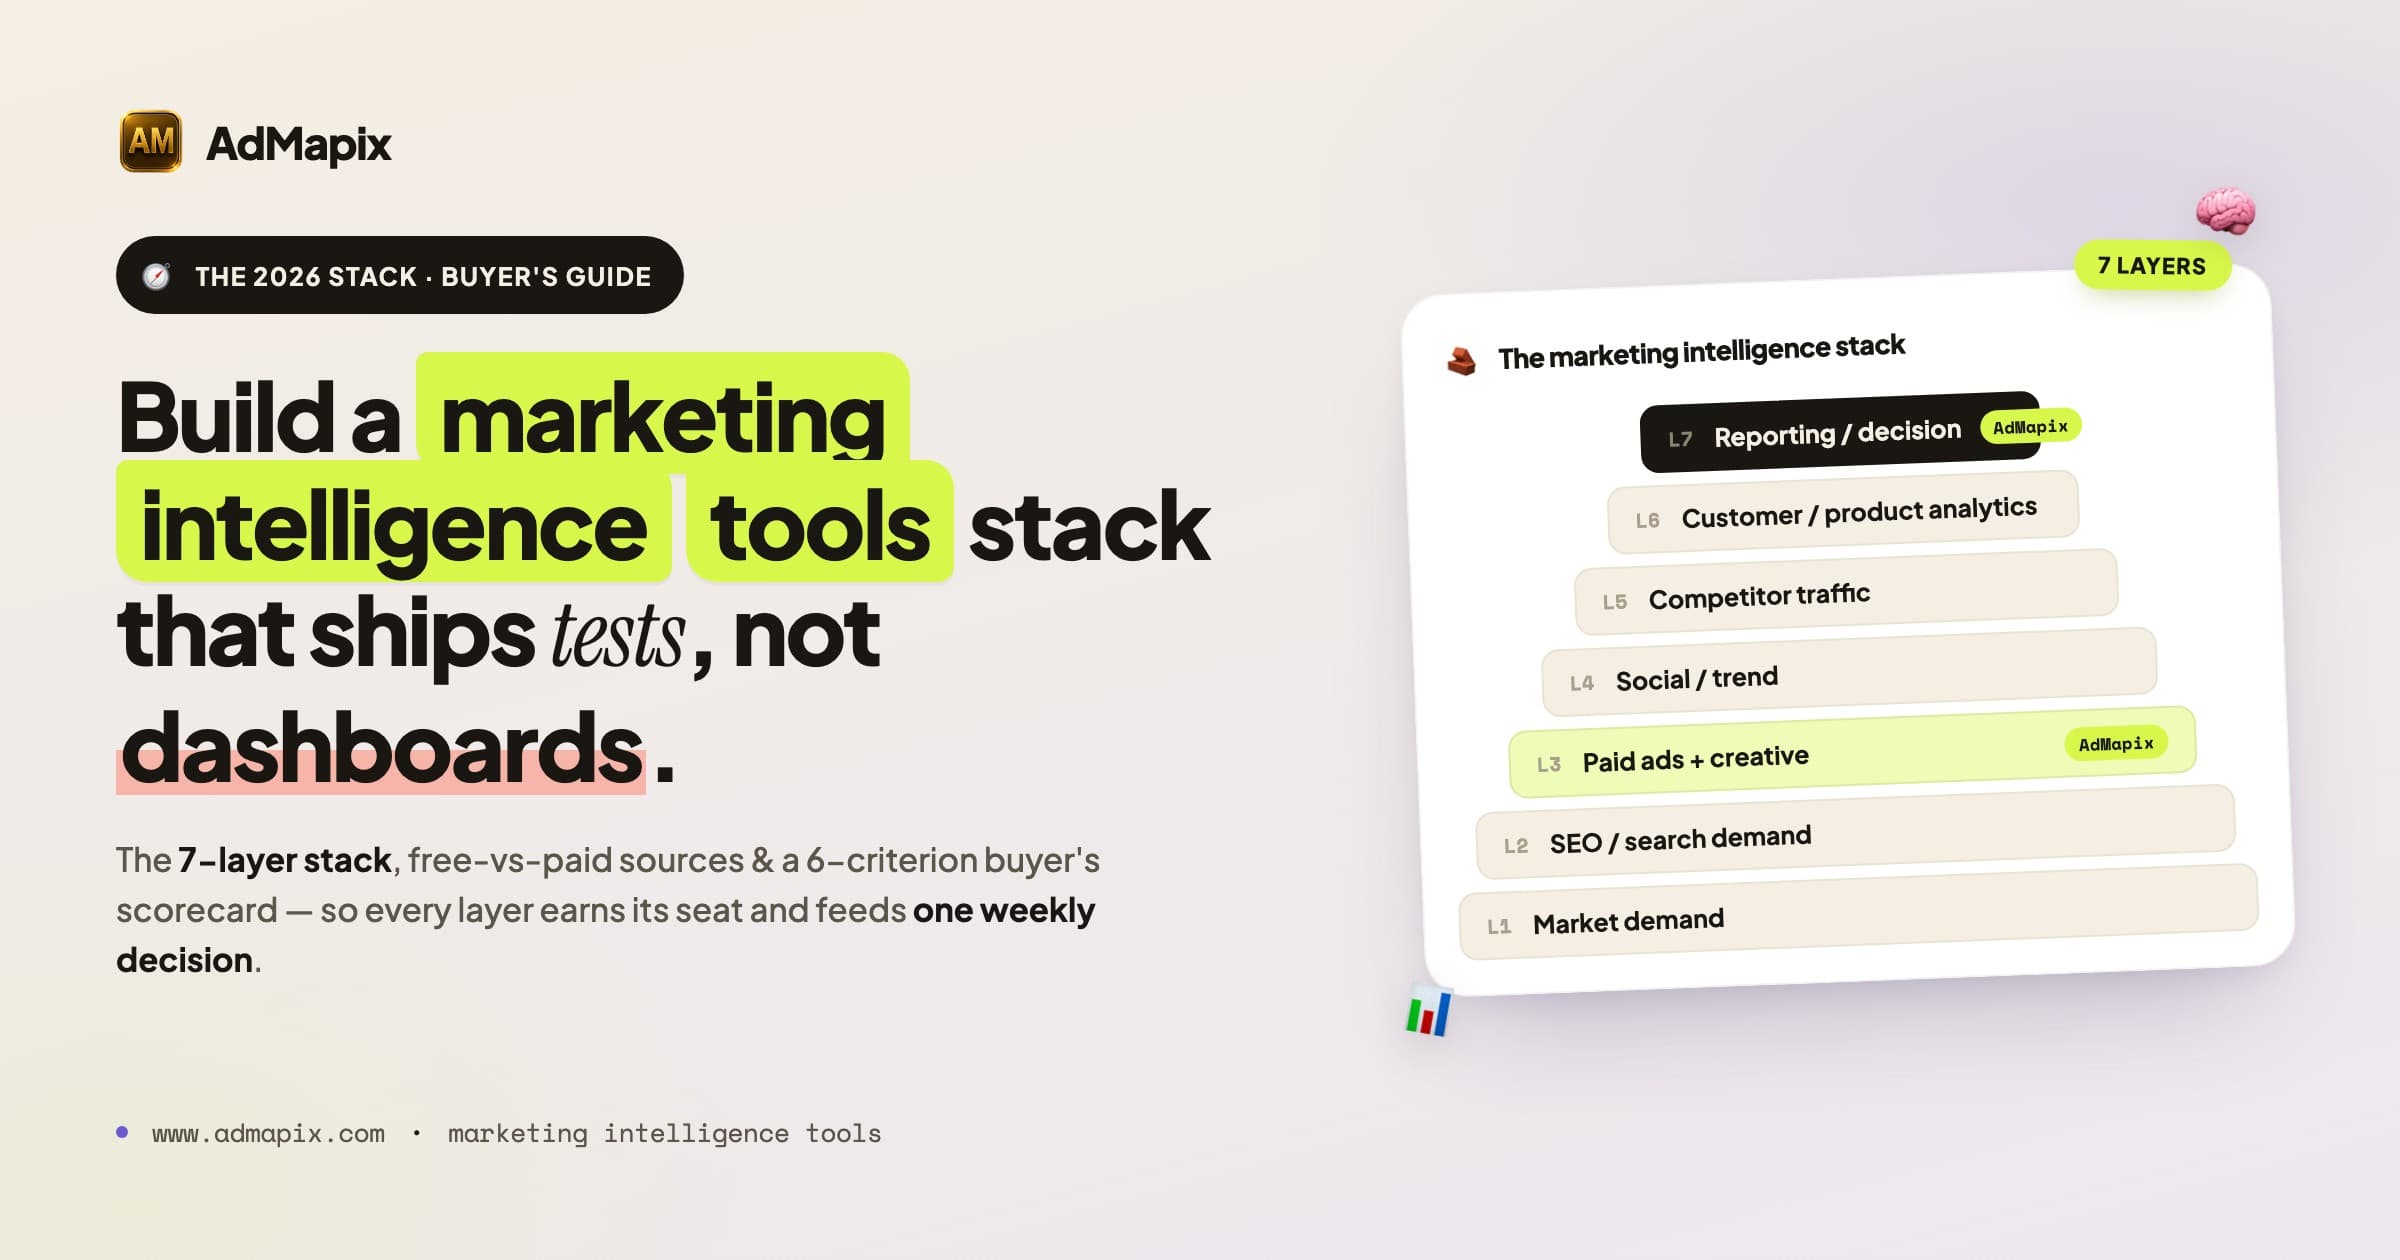
Marketing intelligence tools are the software, public data sources, and workflows that help a team understand what is changing in the market — demand, competitors, ads, traffic, pricing, creative, and audience attention — before those changes show up as missed targets. In 2026, with ad creative fatiguing in 7–9 days, search demand reshaped by AI Overviews, and competitor signals scattered across a dozen public libraries, the teams that win are not the ones with the most dashboards. They are the ones whose tooling reliably answers one recurring question: what should we do differently next week, and what is the evidence? This guide gives you the full system — a 7-layer stack, free-vs-paid source breakdowns, a 6-criterion buyer's scorecard, recommended stacks by team stage and industry, build-vs-buy math, an ROI model, and a weekly workflow that turns signals into shipped tests.
TL;DR — Marketing Intelligence Tools in One Screen
- Marketing intelligence tools look outward (market, competitors, ads, trends, traffic). Marketing analytics tools look inward (your campaigns, GA4, CRM, revenue). You need both — intelligence makes hypotheses, analytics validates them.
- The best marketing intelligence software maps to a weekly decision, not a dashboard. If a tool can't change what you test, monitor, or brief, it's noise.
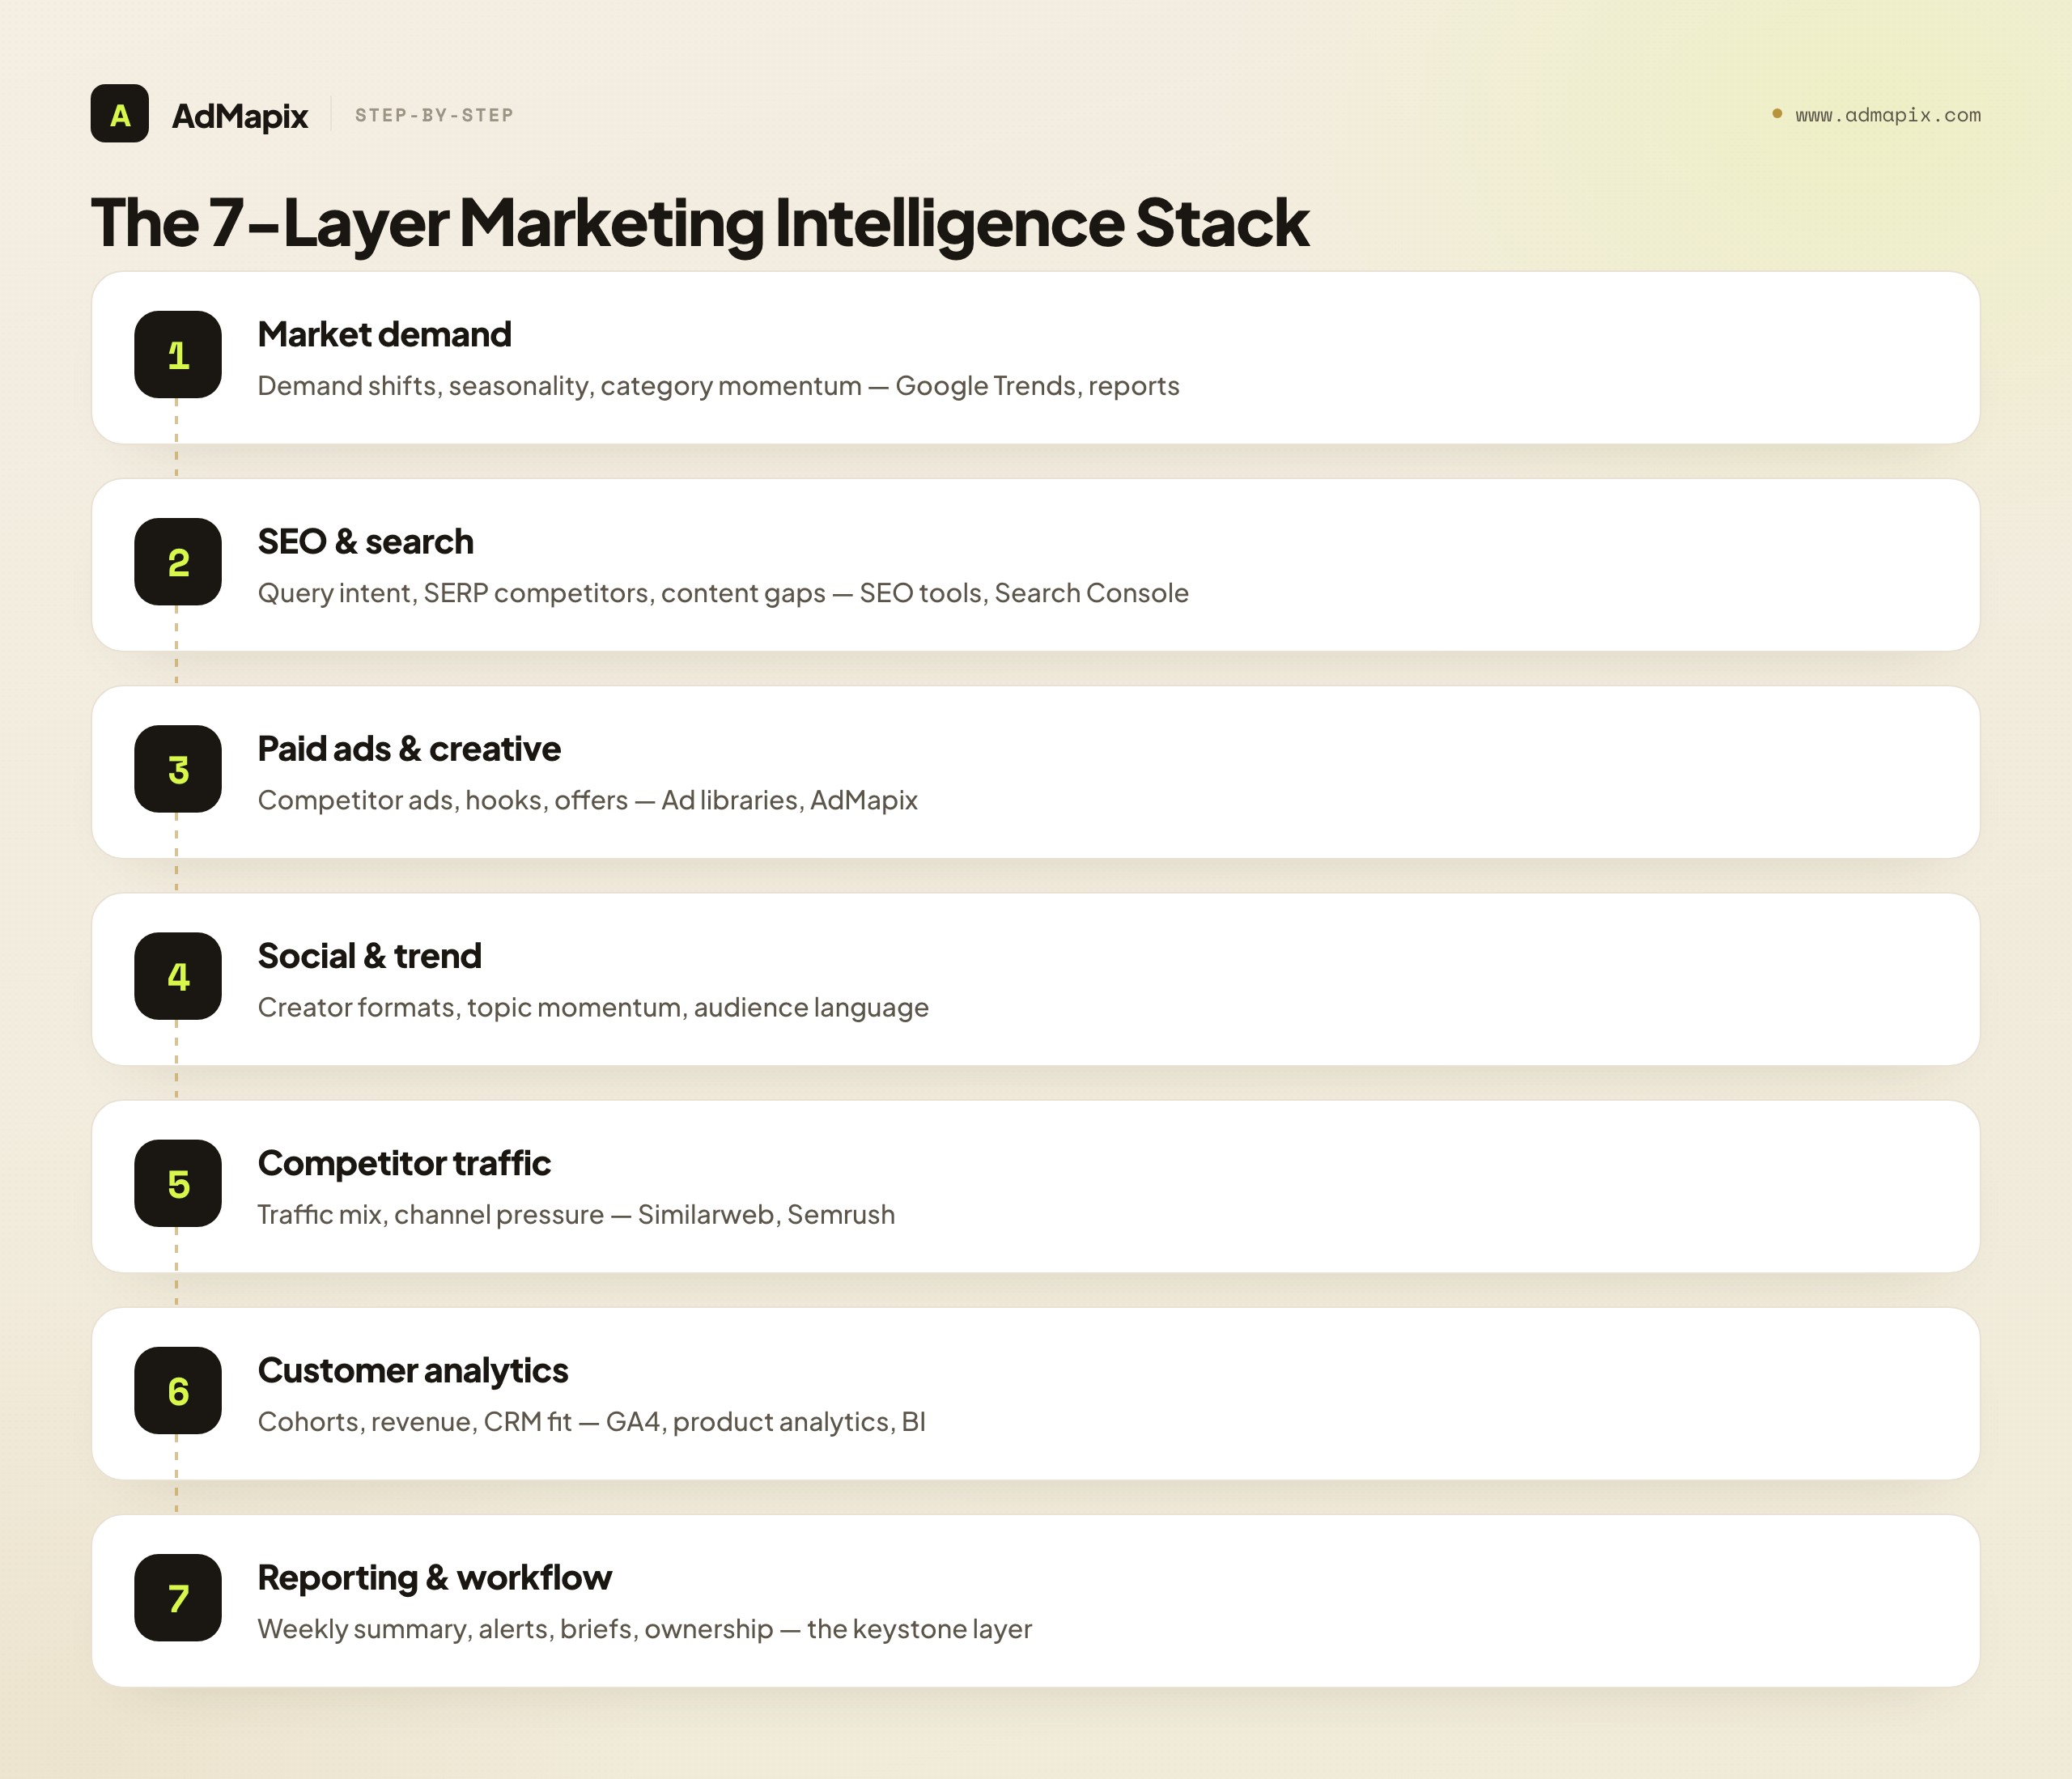
- Build the stack in 7 layers: market demand, SEO/search, paid ads + creative, social/trend, competitor traffic, customer/product analytics, reporting/decision workflow.
- The free official stack (Google Trends, Google Ads Transparency Center, Meta Ad Library, TikTok Creative Center, Search Console, GA4) covers ~70–80% of needs for small teams.
- Use the 6-criterion scorecard before buying: use-case fit, data freshness, source transparency, workflow output, team adoption, decision risk.
- Match the stack to team stage and industry — a founder needs a sheet and free libraries; an enterprise needs governance, traffic intelligence, and recurring research workflows.
- Separate source confidence: public ad data, modeled traffic estimates, and first-party analytics do not carry the same certainty. Tag findings low/medium/high before acting.
What Marketing Intelligence Tools Should Help You Decide
Start with the decision. Tool categories are easier to compare once you know the question they must answer. The single most common procurement mistake is buying a tool for its feature list instead of for a decision it owns. Reverse it: write down the recurring choices your team makes, then map sources to them.
| Decision | Useful marketing intelligence source |
|---|---|
| What market or audience is heating up? | Google Trends, market research tools, social trend data, search volume exports |
| Which competitors are increasing pressure? | Ad libraries, traffic intelligence, search ads intelligence, competitor landing pages |
| What should we test in paid media? | Ad creative intelligence, PPC research, hook and offer analysis |
| Which content or keyword cluster should we prioritize? | SEO tools, Search Console, Google Trends, SERP review |
| Which offer or pricing angle is changing? | Competitor pages, pricing intelligence, ad copy, promo monitoring |
| Which findings should leadership see? | Reporting workflows, summaries, alerts, and decision boards |
If a tool cannot help you choose a next action, it is not intelligence yet. It may still be useful data, but the team needs a workflow to interpret it. The distinction matters because "marketing intelligence" has become a marketing term itself — every analytics vendor now claims it. The test is operational: does the output end a meeting with a decision, or start another meeting to "look into it"?
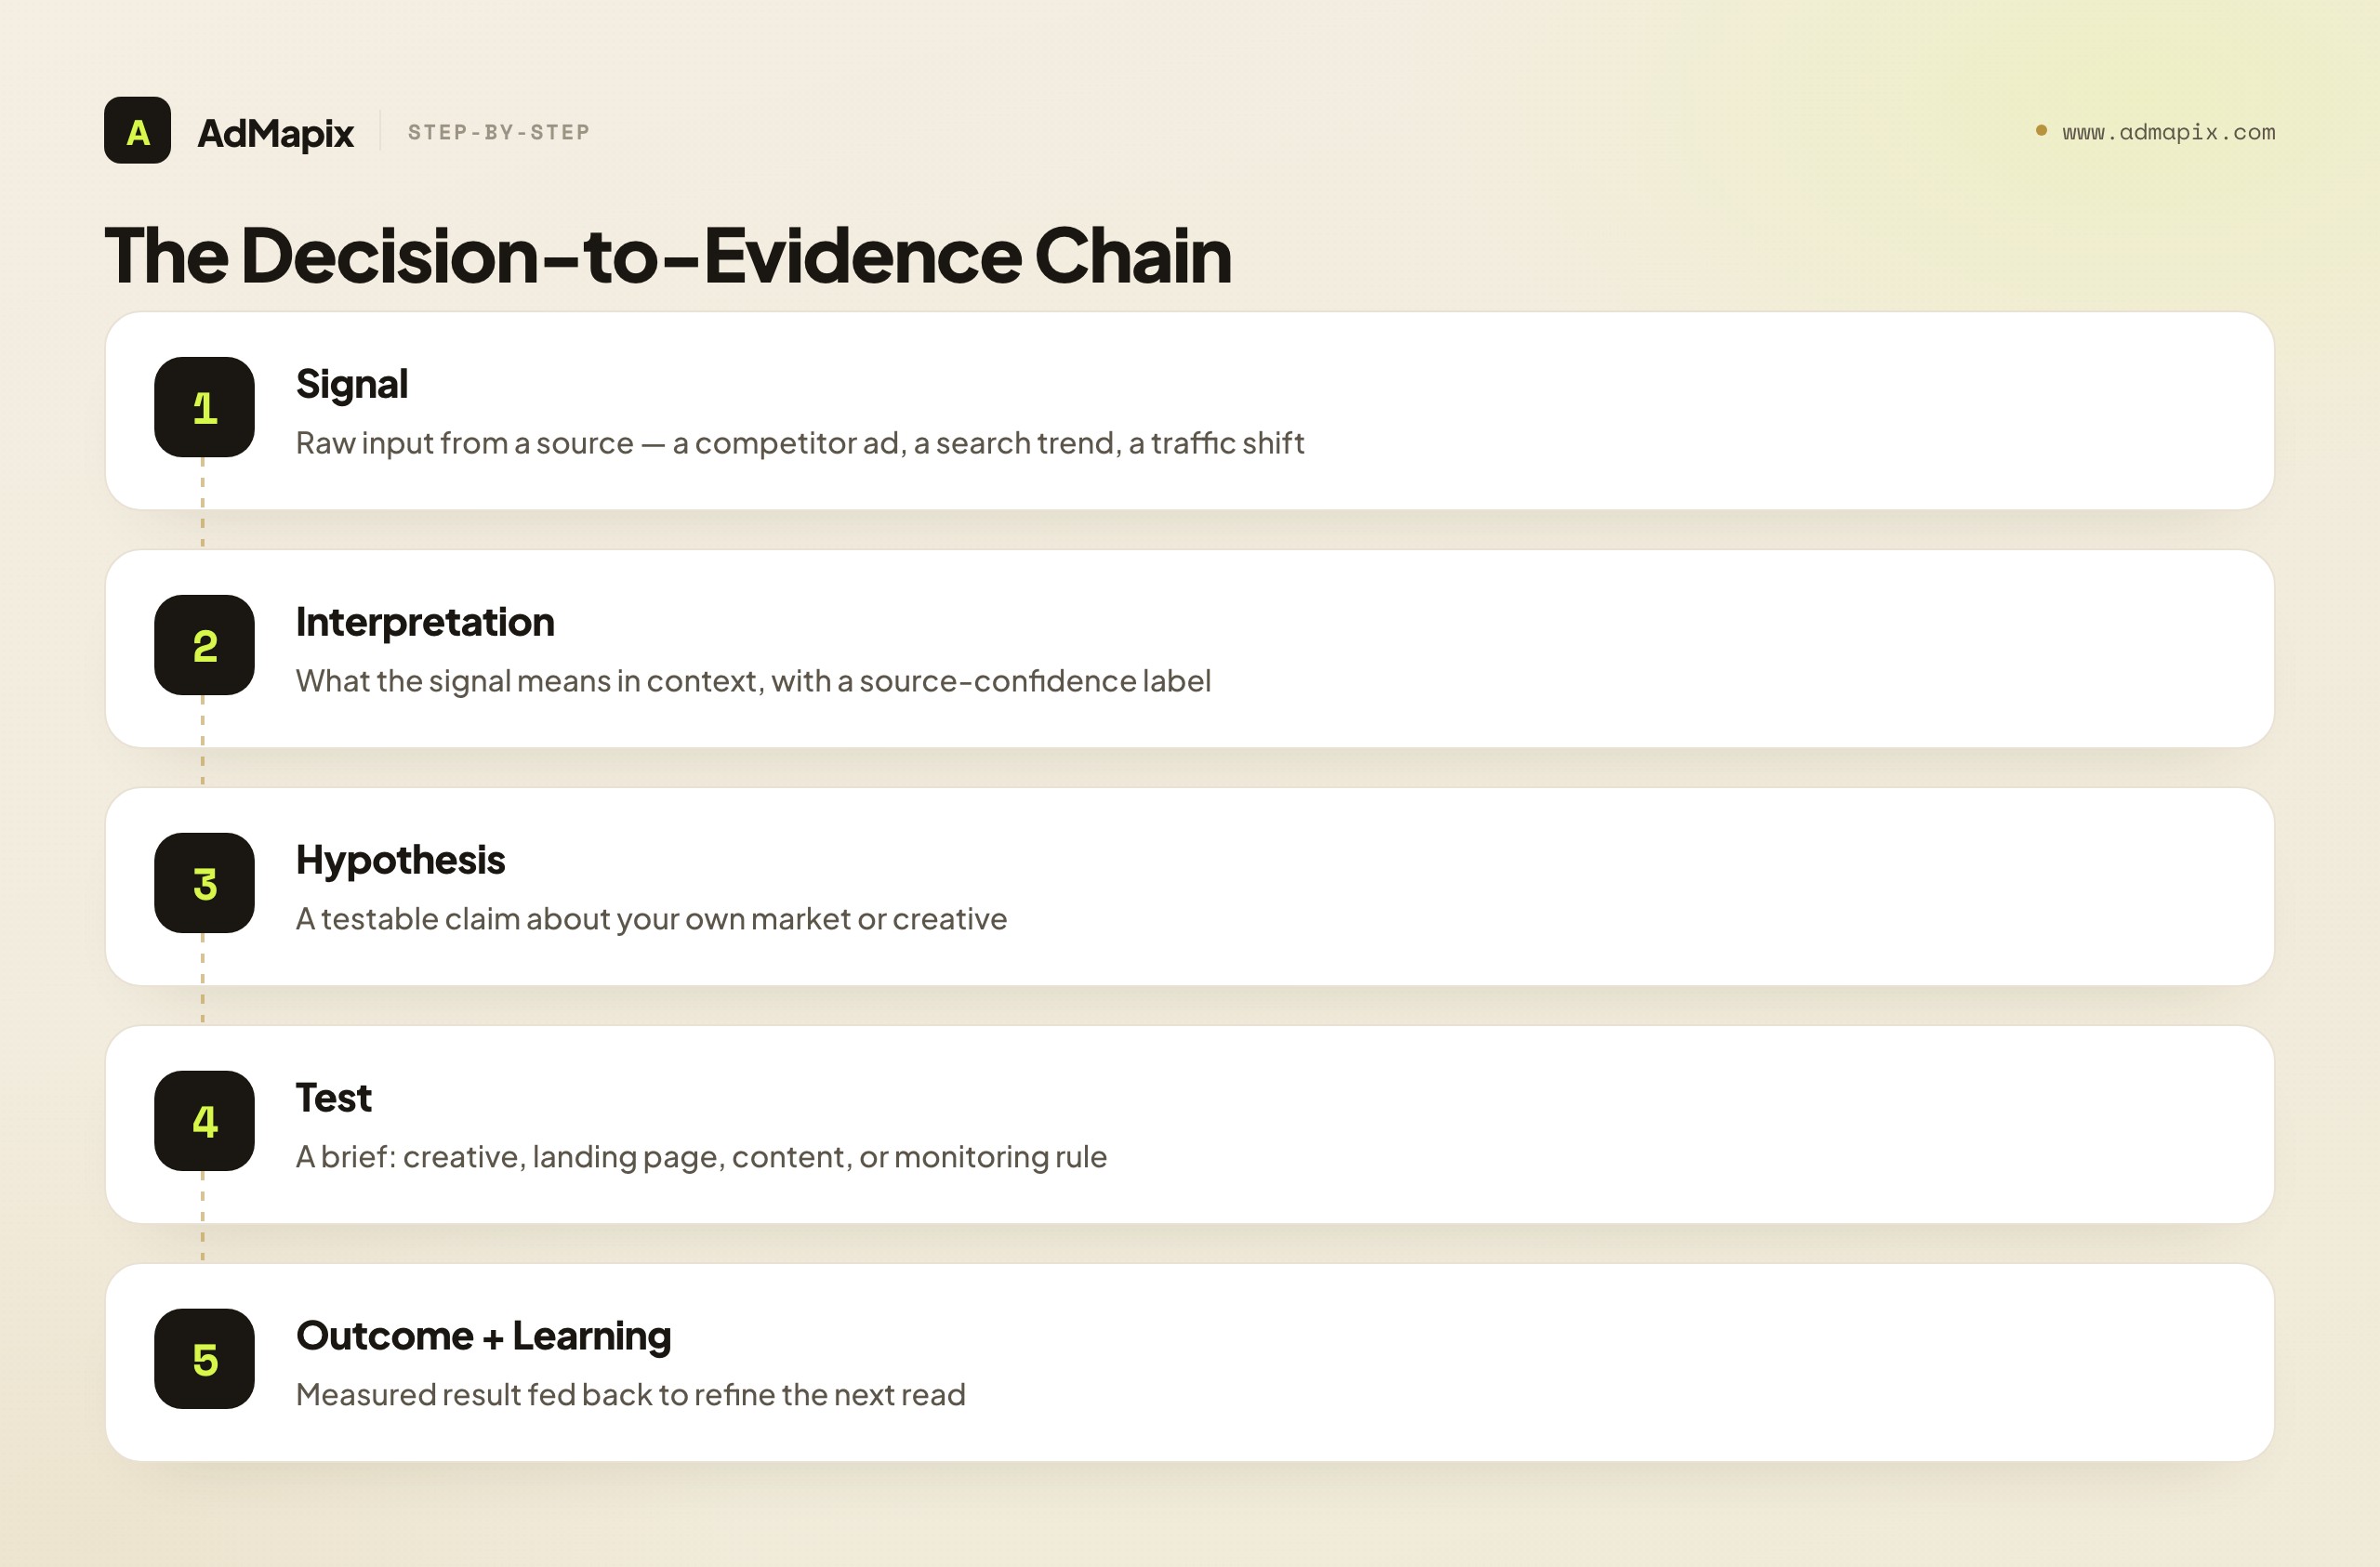
A useful framing is the decision-to-evidence chain. Every marketing intelligence tool should sit on a chain that runs: signal → interpretation → hypothesis → test → outcome → learning. Tools that stop at "signal" (raw ad dumps, undigested traffic charts) are the cheapest and the most abundant; tools that help you get to "hypothesis" and "test" are where the leverage is. When you evaluate software, ask how far down that chain it carries you. A keyword exporter stops at signal. A research-workflow layer carries you to a brief. The price difference is usually justified by how much manual interpretation labor it removes.
Marketing Intelligence Tools vs Marketing Analytics Tools
Marketing intelligence and marketing analytics overlap, but they answer different questions. Confusing them is the root cause of half the bad tooling decisions we see.
| Area | Marketing intelligence tools | Marketing analytics tools |
|---|---|---|
| Main question | What is changing in the market, competitor landscape, and buyer attention? | What happened inside our own campaigns, site, CRM, or product? |
| Main data source | Public ads, SERPs, market data, trend data, competitor traffic, landing pages | Ad accounts, GA4, CRM, product analytics, attribution, BI |
| Best output | Market read, competitor brief, trend map, creative brief, monitoring alert | KPI dashboard, cohort report, budget report, funnel diagnosis |
| Time orientation | Forward-looking — what's about to matter | Backward-looking — what already happened |
| Typical risk | Overreading public signals as exact truth | Optimizing only historical data and missing external shifts |
Strong teams combine both. Use marketing intelligence tools to create hypotheses, then use analytics to validate whether those hypotheses work in your account.
For example, if competitors repeat "migration from legacy tools" messaging, marketing intelligence tells you the category narrative is shifting. Your own analytics tells you whether a migration offer, landing page, or demo CTA actually improves qualified pipeline. Neither tool alone closes the loop — intelligence without analytics is guessing; analytics without intelligence is driving by the rear-view mirror.
Marketing Intelligence vs Business Intelligence
A related confusion: marketing intelligence (MI) vs business intelligence (BI). They are not the same, and buying a BI seat expecting MI is a common, expensive mistake.
| Marketing intelligence (MI) | Business intelligence (BI) | |
|---|---|---|
| Scope | External market + competitive + buyer signals | Internal company data across all functions |
| Primary users | Growth, brand, content, media, product marketing | Analysts, finance, ops, leadership |
| Example tools | Ad libraries, traffic intelligence, creative/research workflows | Looker, Power BI, Tableau, warehouse + SQL |
| Output cadence | Weekly competitive reads, briefs, trend maps | Dashboards, scheduled reports, ad-hoc queries |
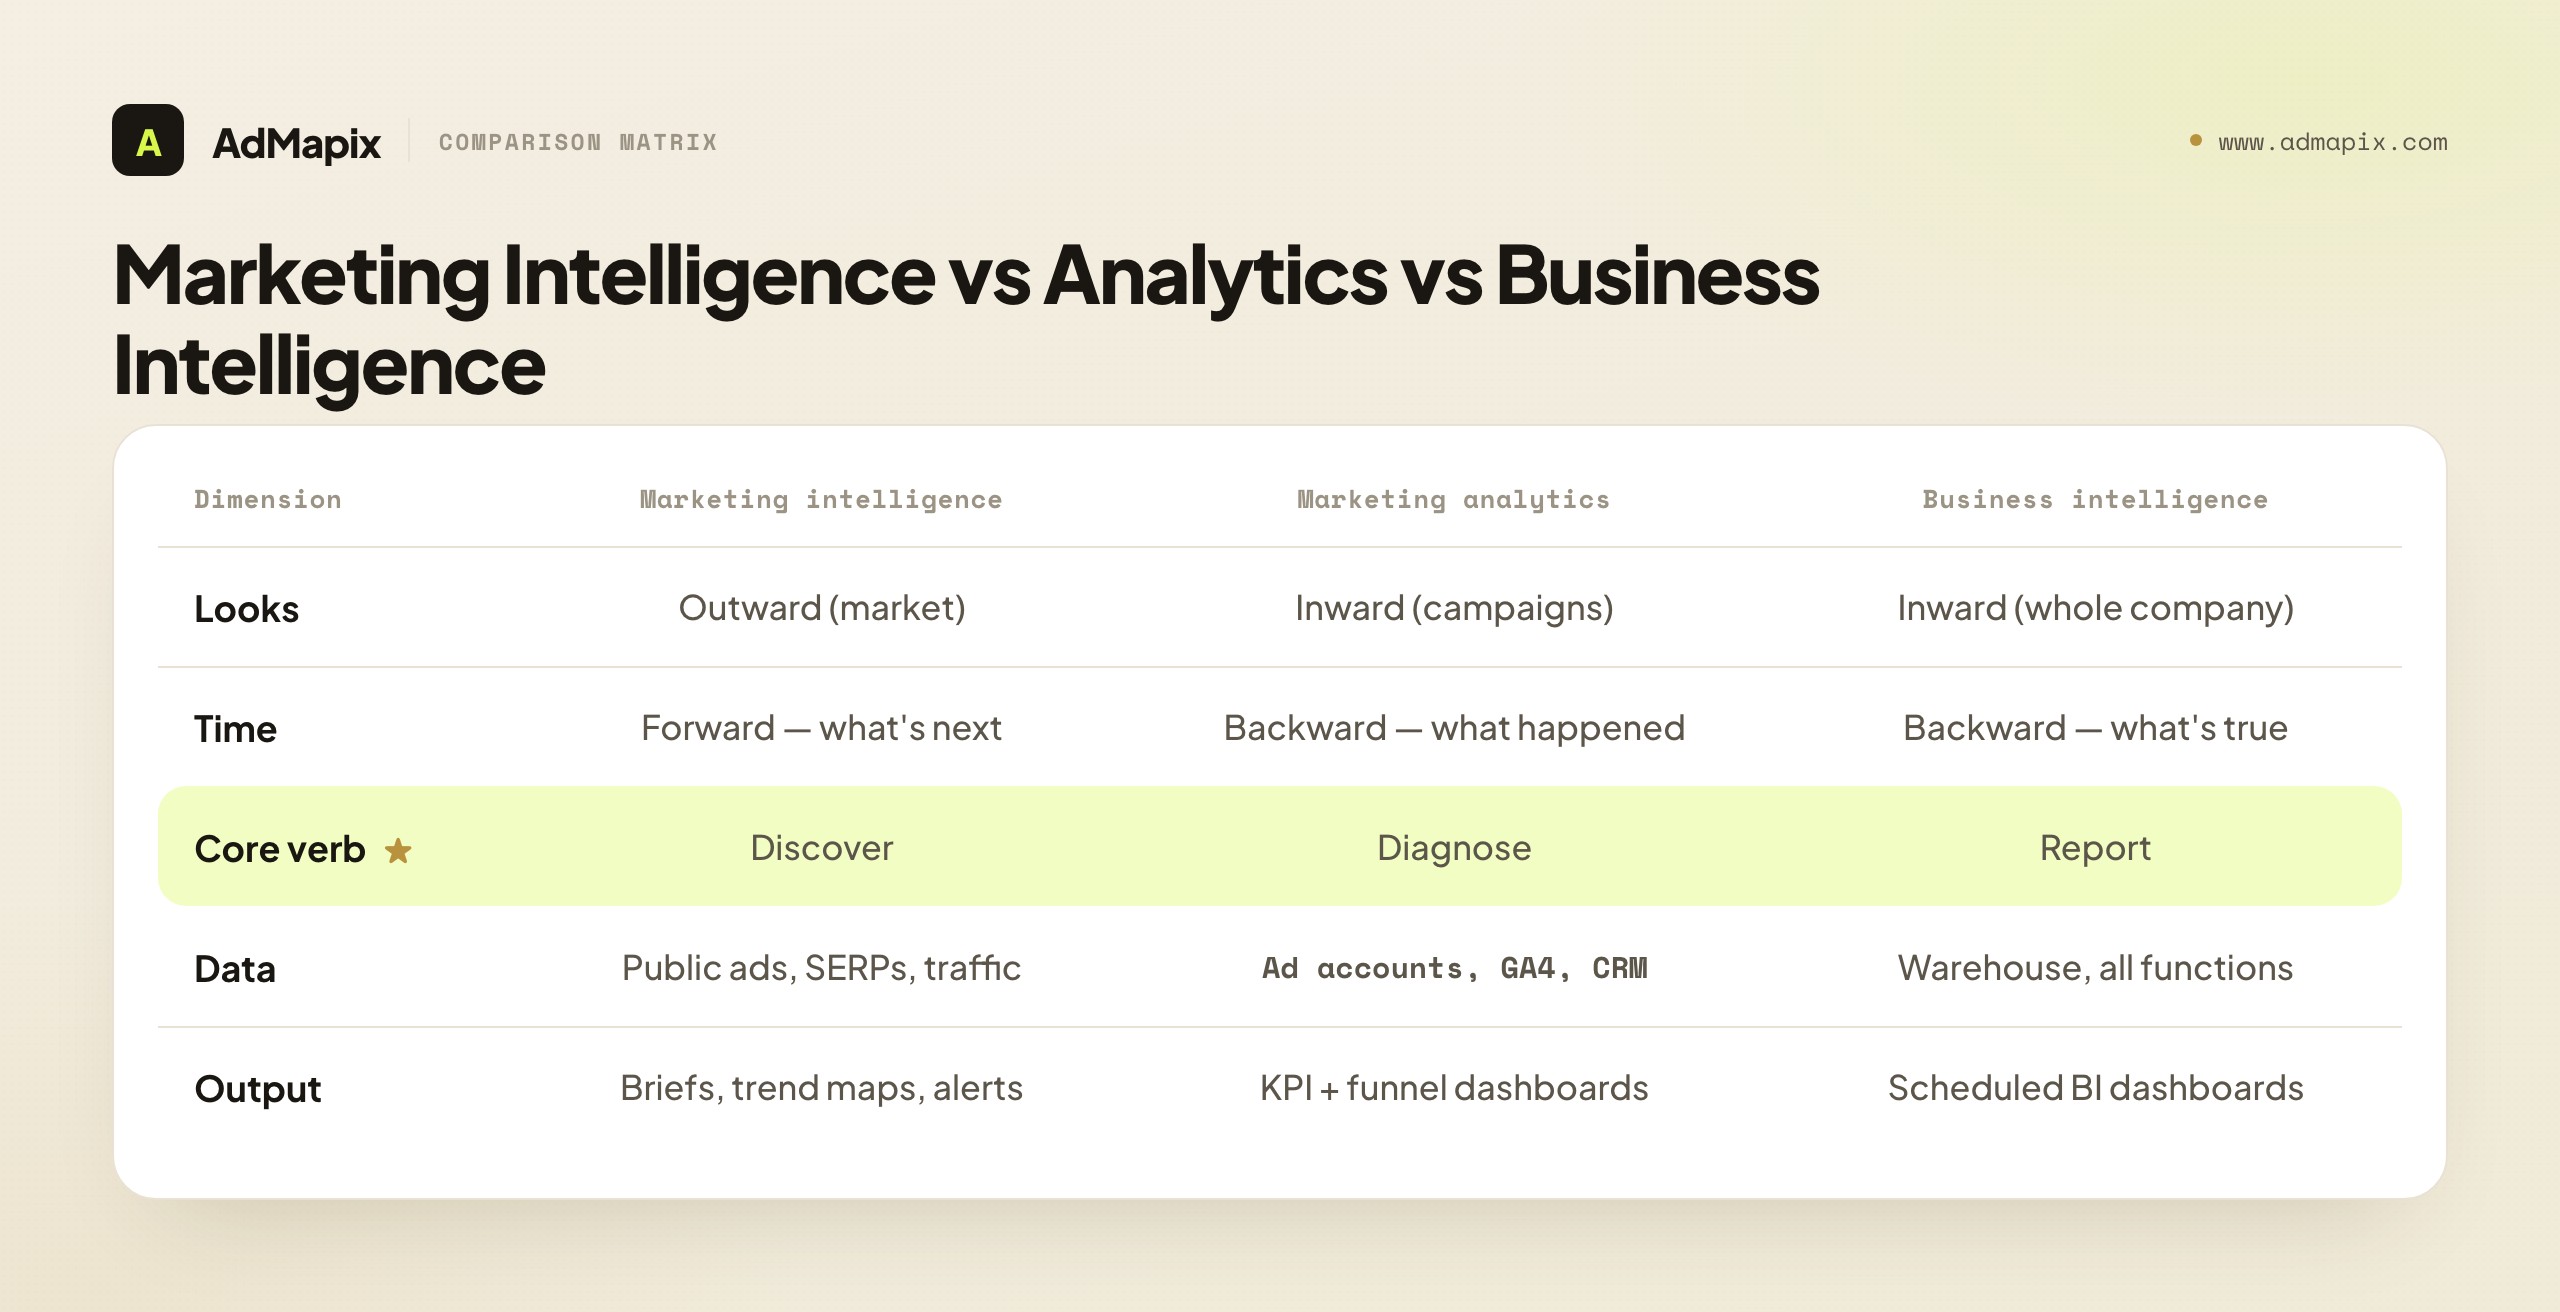
| Core verb | Discover (what's new outside) | Report (what's true inside) |
BI tells you your blended CAC rose 18% last quarter. MI tells you why — three competitors entered your top keyword auction and bid up CPCs. You want both, but you reach for them at different moments. Treat MI as the early-warning system and BI as the system of record.
The 7-Layer Marketing Intelligence Stack
A complete marketing intelligence platform is rarely one product. Most teams need a stack with seven layers. Think of it as a pyramid: the bottom layers tell you what the market is doing, the middle layers tell you what competitors are doing, and the top layer turns all of it into decisions.
| Layer | What it reveals | Example sources |
|---|---|---|
| Market demand intelligence | Demand shifts, seasonality, category momentum | Google Trends, keyword exports, industry reports |
| SEO and search intelligence | Query intent, SERP competitors, content gaps | SEO tools, Search Console, live SERP review |
| Paid ads and creative intelligence | Competitor ads, hooks, offers, creative patterns | Google Ads Transparency Center, Meta Ad Library, TikTok Creative Center, AdMapix |
| Social and trend intelligence | Creator formats, topic momentum, audience language | TikTok Creative Center, social listening tools, community review |
| Competitor traffic intelligence | Traffic mix, channel pressure, referral movement | Similarweb Marketing Strategy, Semrush Traffic and Market tools |
| Customer and product analytics | Event quality, cohorts, revenue, CRM fit | GA4, product analytics, CRM, BI |
| Reporting and decision workflow | Weekly summary, alerts, briefs, ownership | AdMapix reports, BI dashboards, docs, Slack or Feishu workflows |
The important part is separation. Public ad data, modeled traffic data, first-party campaign data, and editorial interpretation should not be mixed as if they have the same certainty. A common failure is a slide that puts a Similarweb traffic estimate next to a GA4 measurement with identical formatting — readers assume equal precision, and the team over-trusts a model. Label every number with its source class.
How the Layers Reinforce Each Other
The layers are not independent — the value compounds when you read them together:
- Market demand + SEO tells you where attention is moving and whether you can capture it organically.
- Paid ads + social/trend tells you how competitors are converting that attention into demand, and which creative angles are winning.
- Competitor traffic tells you how big the pressure is and which channels are carrying it.
- Customer analytics tells you whether any of it is working for you.
- Reporting/workflow is the layer that makes the other six matter — without it, you have six sources and no decisions.
Most teams over-invest in layers 1–5 (data acquisition) and under-invest in layer 7 (interpretation). The result is a "data-rich, decision-poor" org: everyone can pull a chart, nobody owns the brief. If your team has more tool subscriptions than weekly decisions, rebalance toward the workflow layer first.
Free Official Sources Every Team Should Use
Free sources are not enough for every team, but they are the best starting point because they give primary evidence — the actual ads and the actual search interest, not a vendor's interpretation of them.
| Free source | What it is good for | Limitation |
|---|---|---|
| Google Trends | Compare search interest, rising topics, regions, and seasonal demand | It shows relative interest, not exact private buyer intent |
| Google Ads Transparency Center | Review public ads from verified advertisers across Google's ecosystem | It is not a full PPC account spy tool |
| Meta Ad Library | Check currently active ads across Meta products and public ad transparency context | Commercial ad history and performance data are limited |
| TikTok Creative Center | Find top ads, keyword insights, trends, creators, and creative guidance | It needs interpretation before becoming a brief |
| Google Search Console | First-party query, impression, click, and position data for your own site | Only covers your own properties |
| Live SERP checks | See visible competitors, ad copy, and landing pages for priority queries | Results vary by location, device, time, and personalization |
Google's own Trends documentation notes that Trends can help teams monitor rising topics, use Explore for custom terms, and review related queries before choosing where to invest content effort. That makes it useful for prioritization, but not enough for paid media decisions by itself.
Google's Ads Transparency Center is useful because Google describes it as a searchable hub for ads from verified advertisers and says it can show ads, regions, last shown dates, and ad formats. That is valuable evidence, but it still does not reveal exact spend, bid strategy, or ROAS. For a deeper walkthrough, use our Google Ads Transparency Center guide and search ads intelligence workflow.
Meta's Ad Library and TikTok Creative Center fill different gaps. Meta is useful for current public Meta ads; our Facebook Ads Library guide explains the limitations and use cases. TikTok's Creative Center is strong for short-form creative, trend discovery, Top Ads, keyword insights, and creative guidance; see the TikTok Creative Center tutorial when you need a platform-specific workflow. Neither replaces your own performance analytics.
How Far the Free Stack Actually Gets You
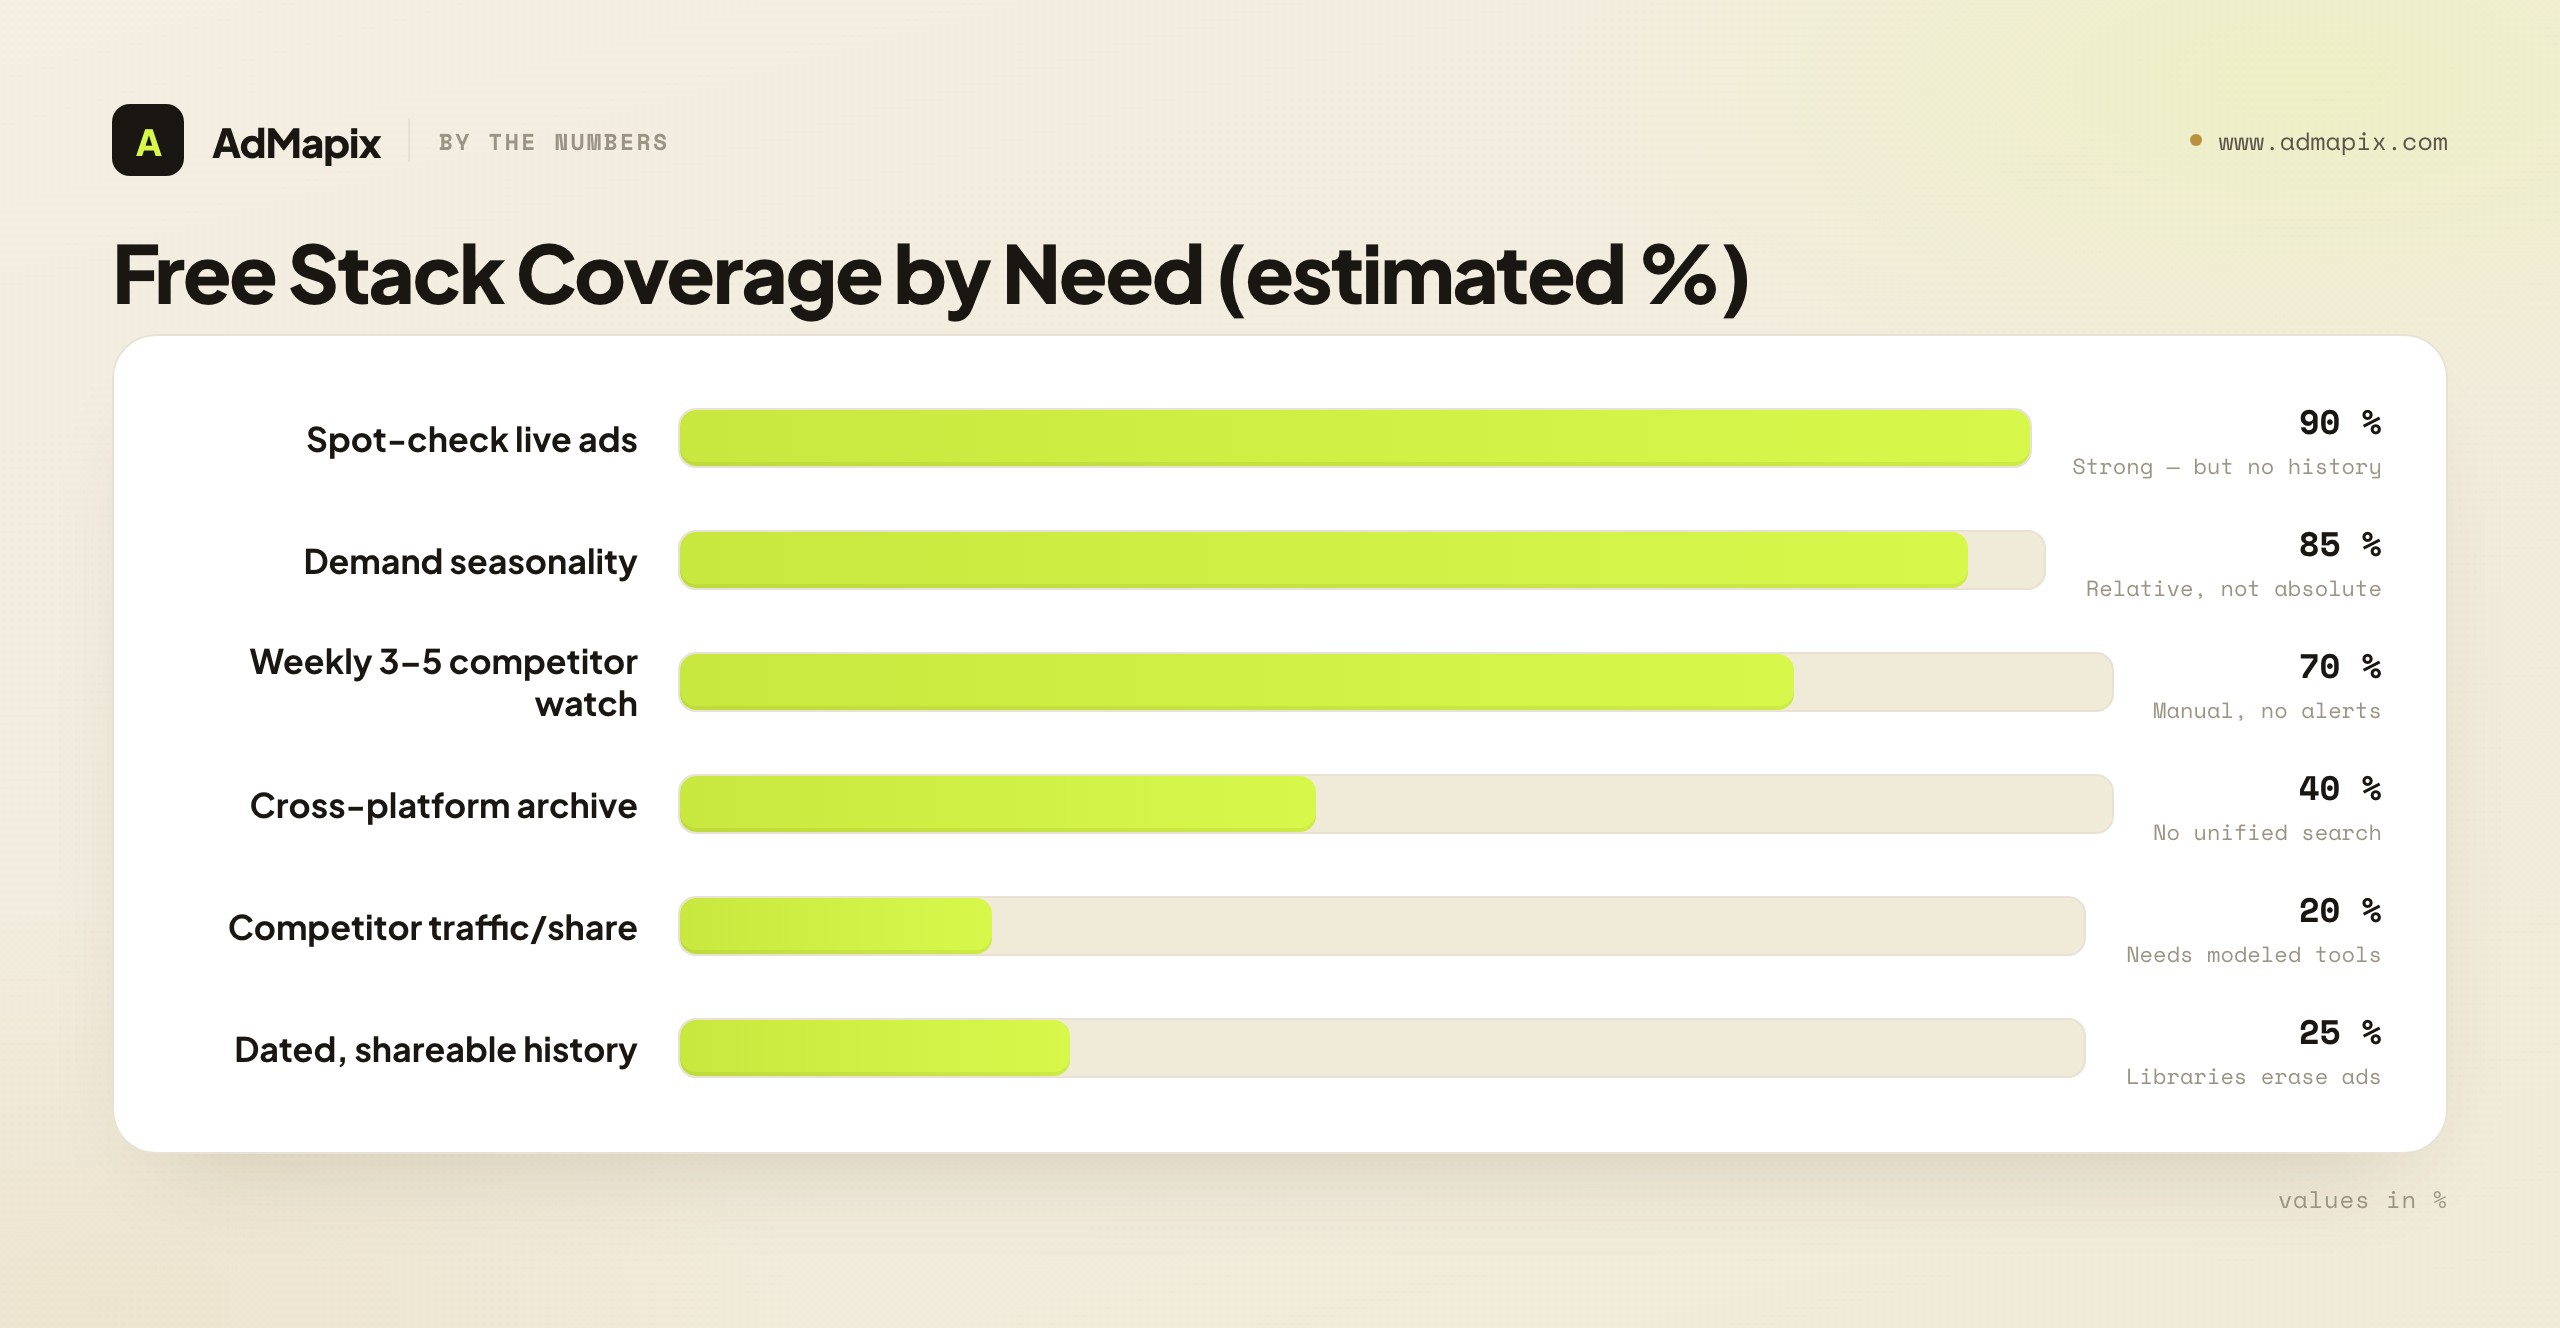
A realistic read on coverage, because "free is enough" and "you must buy tools" are both oversold:
| Need | Free stack coverage | Where it breaks |
|---|---|---|
| Spot-check a competitor's live ads | High (~90%) | No history once ads stop running |
| Track demand seasonality | High (~85%) | Relative, not absolute volume |
| Monitor 3–5 competitors weekly | Medium (~70%) | Manual, time-expensive, no alerts |
| Cross-platform creative archive | Low (~40%) | No unified search across Meta/TikTok/Google |
| Estimate competitor traffic/share | Low (~20%) | Needs modeled traffic tools |
| Team-shareable, dated history | Low (~25%) | Libraries erase non-political ads when they stop |
The pattern: free sources are excellent for point-in-time discovery and weak for longitudinal, cross-platform, team-shared intelligence. That gap — history and consolidation — is exactly what paid tools sell. Buy when the gap costs you more in analyst hours than the subscription.
Marketing Intelligence Software: Categories and When They Are Worth It
Paid marketing intelligence software becomes worth it when manual research is too slow, too fragmented, or too hard to turn into decisions. Below are the major categories, the team they fit, and the concrete buying signal that says "now."
| Software category | Best fit | Buying signal |
|---|---|---|
| SEO and PPC suites | Search demand, keywords, paid search competitor context | Search is a major acquisition channel and the team already reviews keyword or SERP data weekly |
| Traffic and market intelligence | Competitive traffic, market share, category benchmarking | Leadership needs market movement, not only ad examples |
| Ad creative intelligence | Competitor creative, hooks, formats, offers, landing pages | Creative testing cadence is frequent and manual swipe files are breaking down |
| Social listening and trend tools | Audience language, creators, topics, cultural changes | Brand and content teams need early signals beyond search data |
| Customer analytics and BI | First-party funnel quality, revenue, retention, cohort data | Teams need to validate intelligence hypotheses with actual performance |
| Reporting and research workflows | Weekly competitor reads, executive summaries, client-ready reports | The main bottleneck is interpretation, not raw data access |
This is where AdMapix reports fit. AdMapix is not meant to replace every marketing analytics tool. It helps teams turn competitor ad evidence, creative patterns, and market signals into decision-ready research. If your team spends more time collecting screenshots than deciding what to test, a workflow layer matters.
For the ad-creative slice of this stack specifically, three companion guides go deeper than this page can: our advertising intelligence guide for the discipline overview, best ad intelligence tools for a head-to-head of the paid options, and the competitor ad analysis framework for the 5-dimension scoring system that turns ad data into briefs.
Representative Tools by Category (2026)
Naming concrete software helps anchor the categories, but treat this as a map, not an endorsement — the right pick depends on your industry, budget, and the scorecard below. Each category has a free anchor and paid options.
| Software category | Free / official anchor | Common paid options |
|---|---|---|
| SEO and PPC suites | Google Search Console, Keyword Planner | Semrush, Ahrefs, Moz |
| Traffic and market intelligence | — (no free equivalent) | Similarweb, Semrush .Trends, Sensor Tower (apps) |
| Ad creative intelligence | Meta Ad Library, Google Ads Transparency Center, TikTok Creative Center | AdMapix, Foreplay, Atria, Minea |
| Social listening and trend tools | TikTok Creative Center, native platform search | Brandwatch, Sprout Social, Brand24 |
| Customer analytics and BI | GA4, Looker Studio | Amplitude, Mixpanel, Power BI, Tableau |
| Reporting and research workflows | Docs + a shared sheet | AdMapix reports, Whatagraph, Looker |
Two reading notes. First, several vendors appear in multiple rows (Semrush spans SEO, PPC, and traffic) — that breadth is convenient but rarely best-in-class in every layer, which is why the hub-and-spoke model below usually beats a single suite. Second, the free anchors are genuinely usable, not loss-leaders: a disciplined team running Search Console + the three ad libraries + GA4 + a shared sheet already operates a real, multi-layer marketing intelligence stack. Paid tools earn their place by removing manual labor or adding history and cross-platform reach — not by being the only way to get a signal.
Marketing Intelligence Software vs a Single "Platform"
Buyers often ask for a single "marketing intelligence platform" that does everything. In practice, no one product covers all seven layers well, and the ones that claim to are usually strong in two layers and thin in five. The realistic architecture is a hub-and-spoke model:
- Hub: one workflow/reporting layer that everyone reviews weekly (where decisions are recorded).
- Spokes: best-in-class sources for each layer (a traffic tool, an ad-intelligence tool, an SEO suite, free libraries).
The platform question is therefore less "which product does it all" and more "which hub will my team actually open every week, and which spokes feed it." A mediocre hub that the team reviews beats a brilliant spoke that no one checks. Adoption is the constraint, not feature breadth.
The Marketing Intelligence Tool Buyer's Scorecard
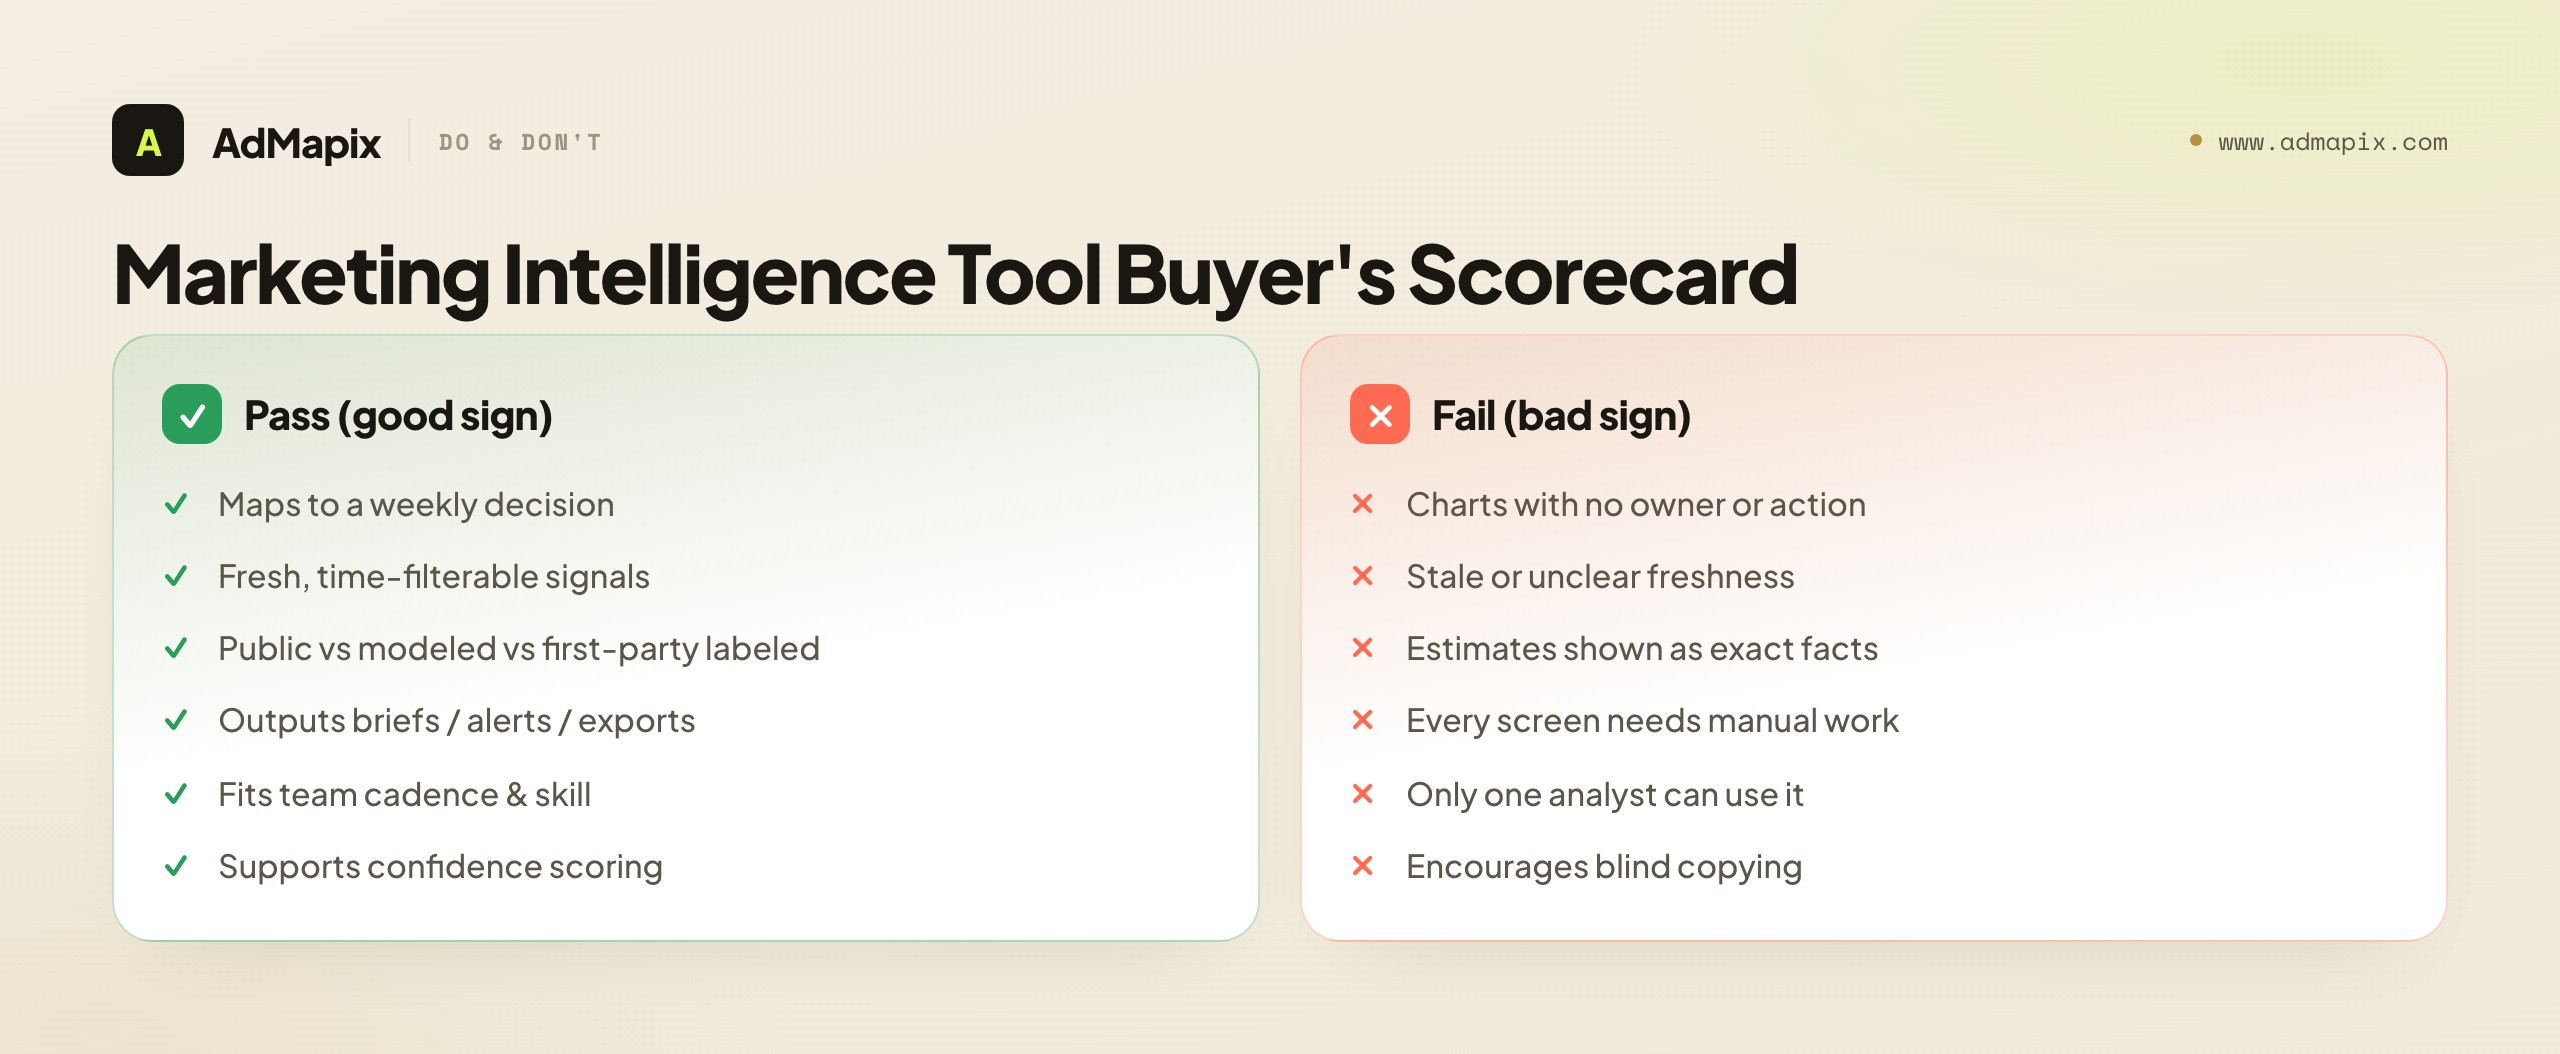
Use this scorecard before buying any marketing intelligence tool or software. Score each criterion pass/fail. The goal is to predict whether a tool will change weekly decisions, not just add another dashboard.
| Criterion | Good sign (pass) | Bad sign (fail) |
|---|---|---|
| Use case fit | The tool maps to weekly decisions: content, media, creative, pricing, positioning, or reporting | It has interesting charts but no clear owner or action |
| Data freshness | The team can see active, recent, or time-filtered signals | Data is stale or freshness is unclear |
| Source transparency | Public, modeled, and first-party sources are separated | Estimates are presented as exact facts |
| Workflow output | The tool creates briefs, alerts, tags, exports, or summaries | The team must manually interpret every screen |
| Team adoption | It fits the review cadence and skill level | Only one analyst can use it |
| Decision risk | It supports confidence scoring and caveats | It encourages copying competitors blindly |
Scoring rule:
| Result | Interpretation |
|---|---|
| 5–6 passes | Buy or expand. The tool can drive decisions now. |
| 3–4 passes | Pair it with another source or workflow. |
| 2 passes | Trial only. Validate adoption before adding process. |
| 0–1 pass | Skip. The tool is likely dashboard noise. |
How to Run the Scorecard in a Trial
The scorecard only works if you test against a real decision, not a demo. Run a two-week trial like this:
- Pick one live decision the team is currently stuck on (e.g., "which creative angle to test next on Meta").
- Use only the trial tool to reach a recommendation, timing how long it takes.
- Score each criterion based on that real run — did freshness hold up? Did it produce a shareable output, or did you have to rebuild it in a doc?
- Compare to your current method. If the tool didn't reach the decision faster and more defensibly, it fails Use-case fit regardless of how good the charts look.
A demo shows you the tool's best case. A trial against a real stuck decision shows you the tool's median case — which is what you'll actually live with.
Stack Recommendations by Team Stage
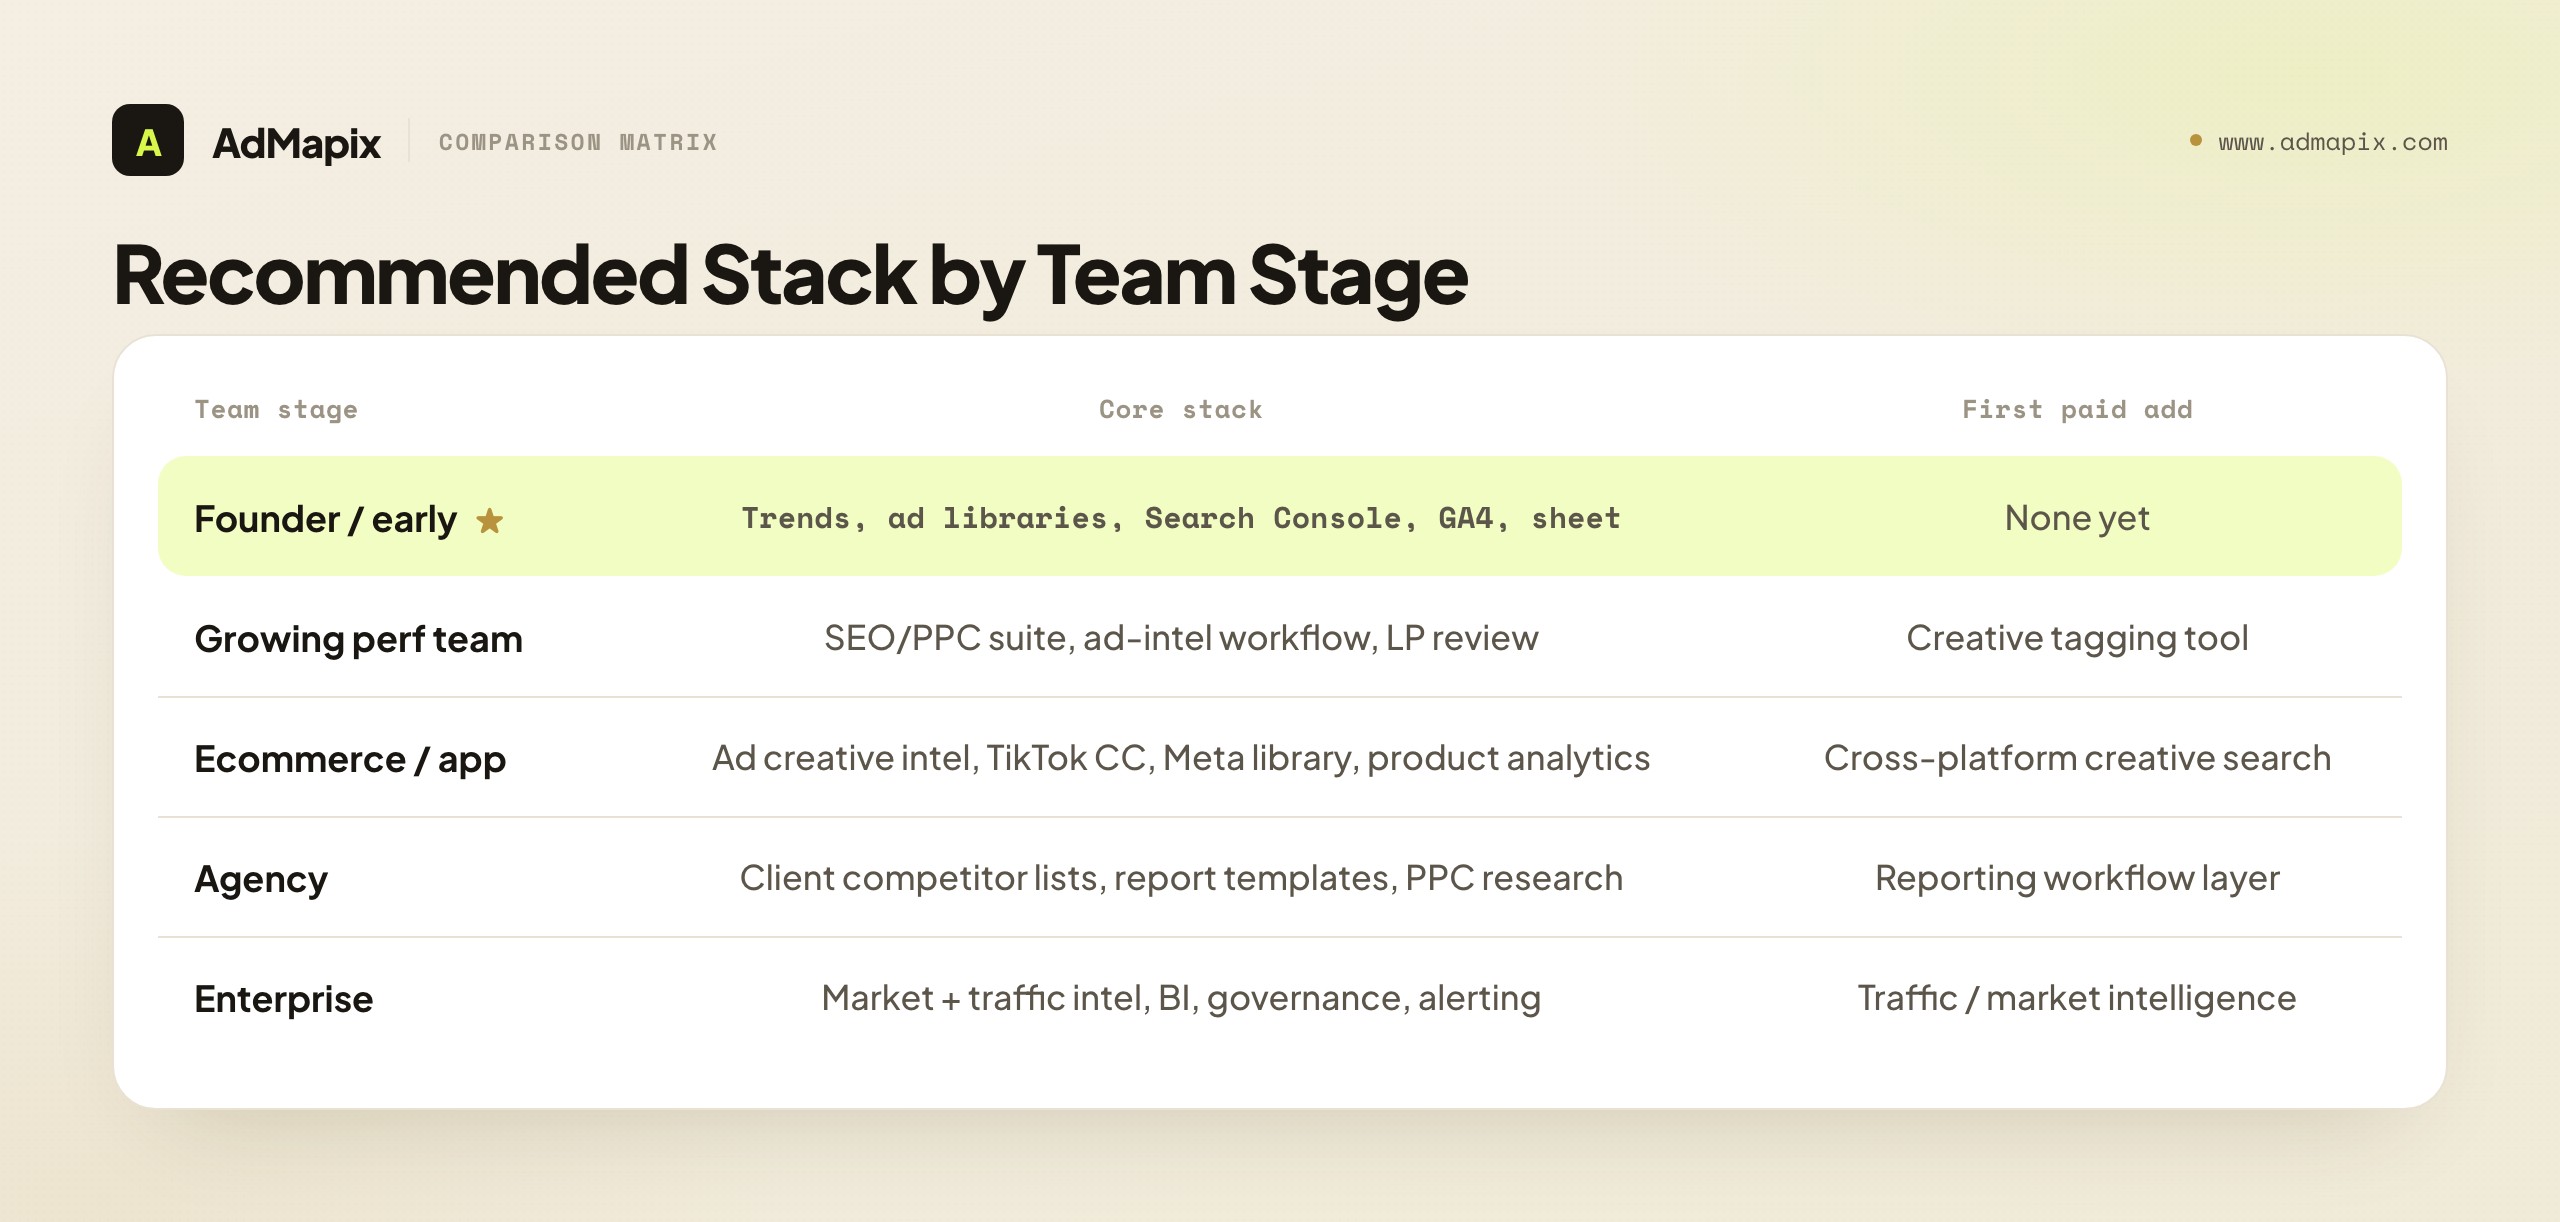
Different teams need different stacks. The most expensive mistake is buying the enterprise stack before the team has a weekly review rhythm to feed it.
| Team stage | Recommended stack |
|---|---|
| Founder or early startup | Google Trends, official ad libraries, Search Console, GA4, a simple competitor tracking sheet |
| Growing performance team | SEO/PPC suite, ad intelligence workflow, creative tagging, landing-page review, weekly decision board |
| Ecommerce or app growth team | Ad creative intelligence, TikTok Creative Center, Meta Ad Library, store page review, product analytics |
| Agency | Client-specific competitor lists, reusable reporting templates, PPC research, creative examples, executive summaries |
| Enterprise | Market intelligence, traffic intelligence, BI, governance, source documentation, alerting, recurring research workflows |
Do not buy the enterprise stack before the team has a weekly review process. A small team with a strong operating rhythm will usually beat a bigger team with disconnected tools. The maturity path is predictable: free sources → a workflow layer → category-specific paid tools → traffic/market intelligence → governance and BI integration. Skipping straight to the end produces shelfware.
Stack Recommendations by Industry
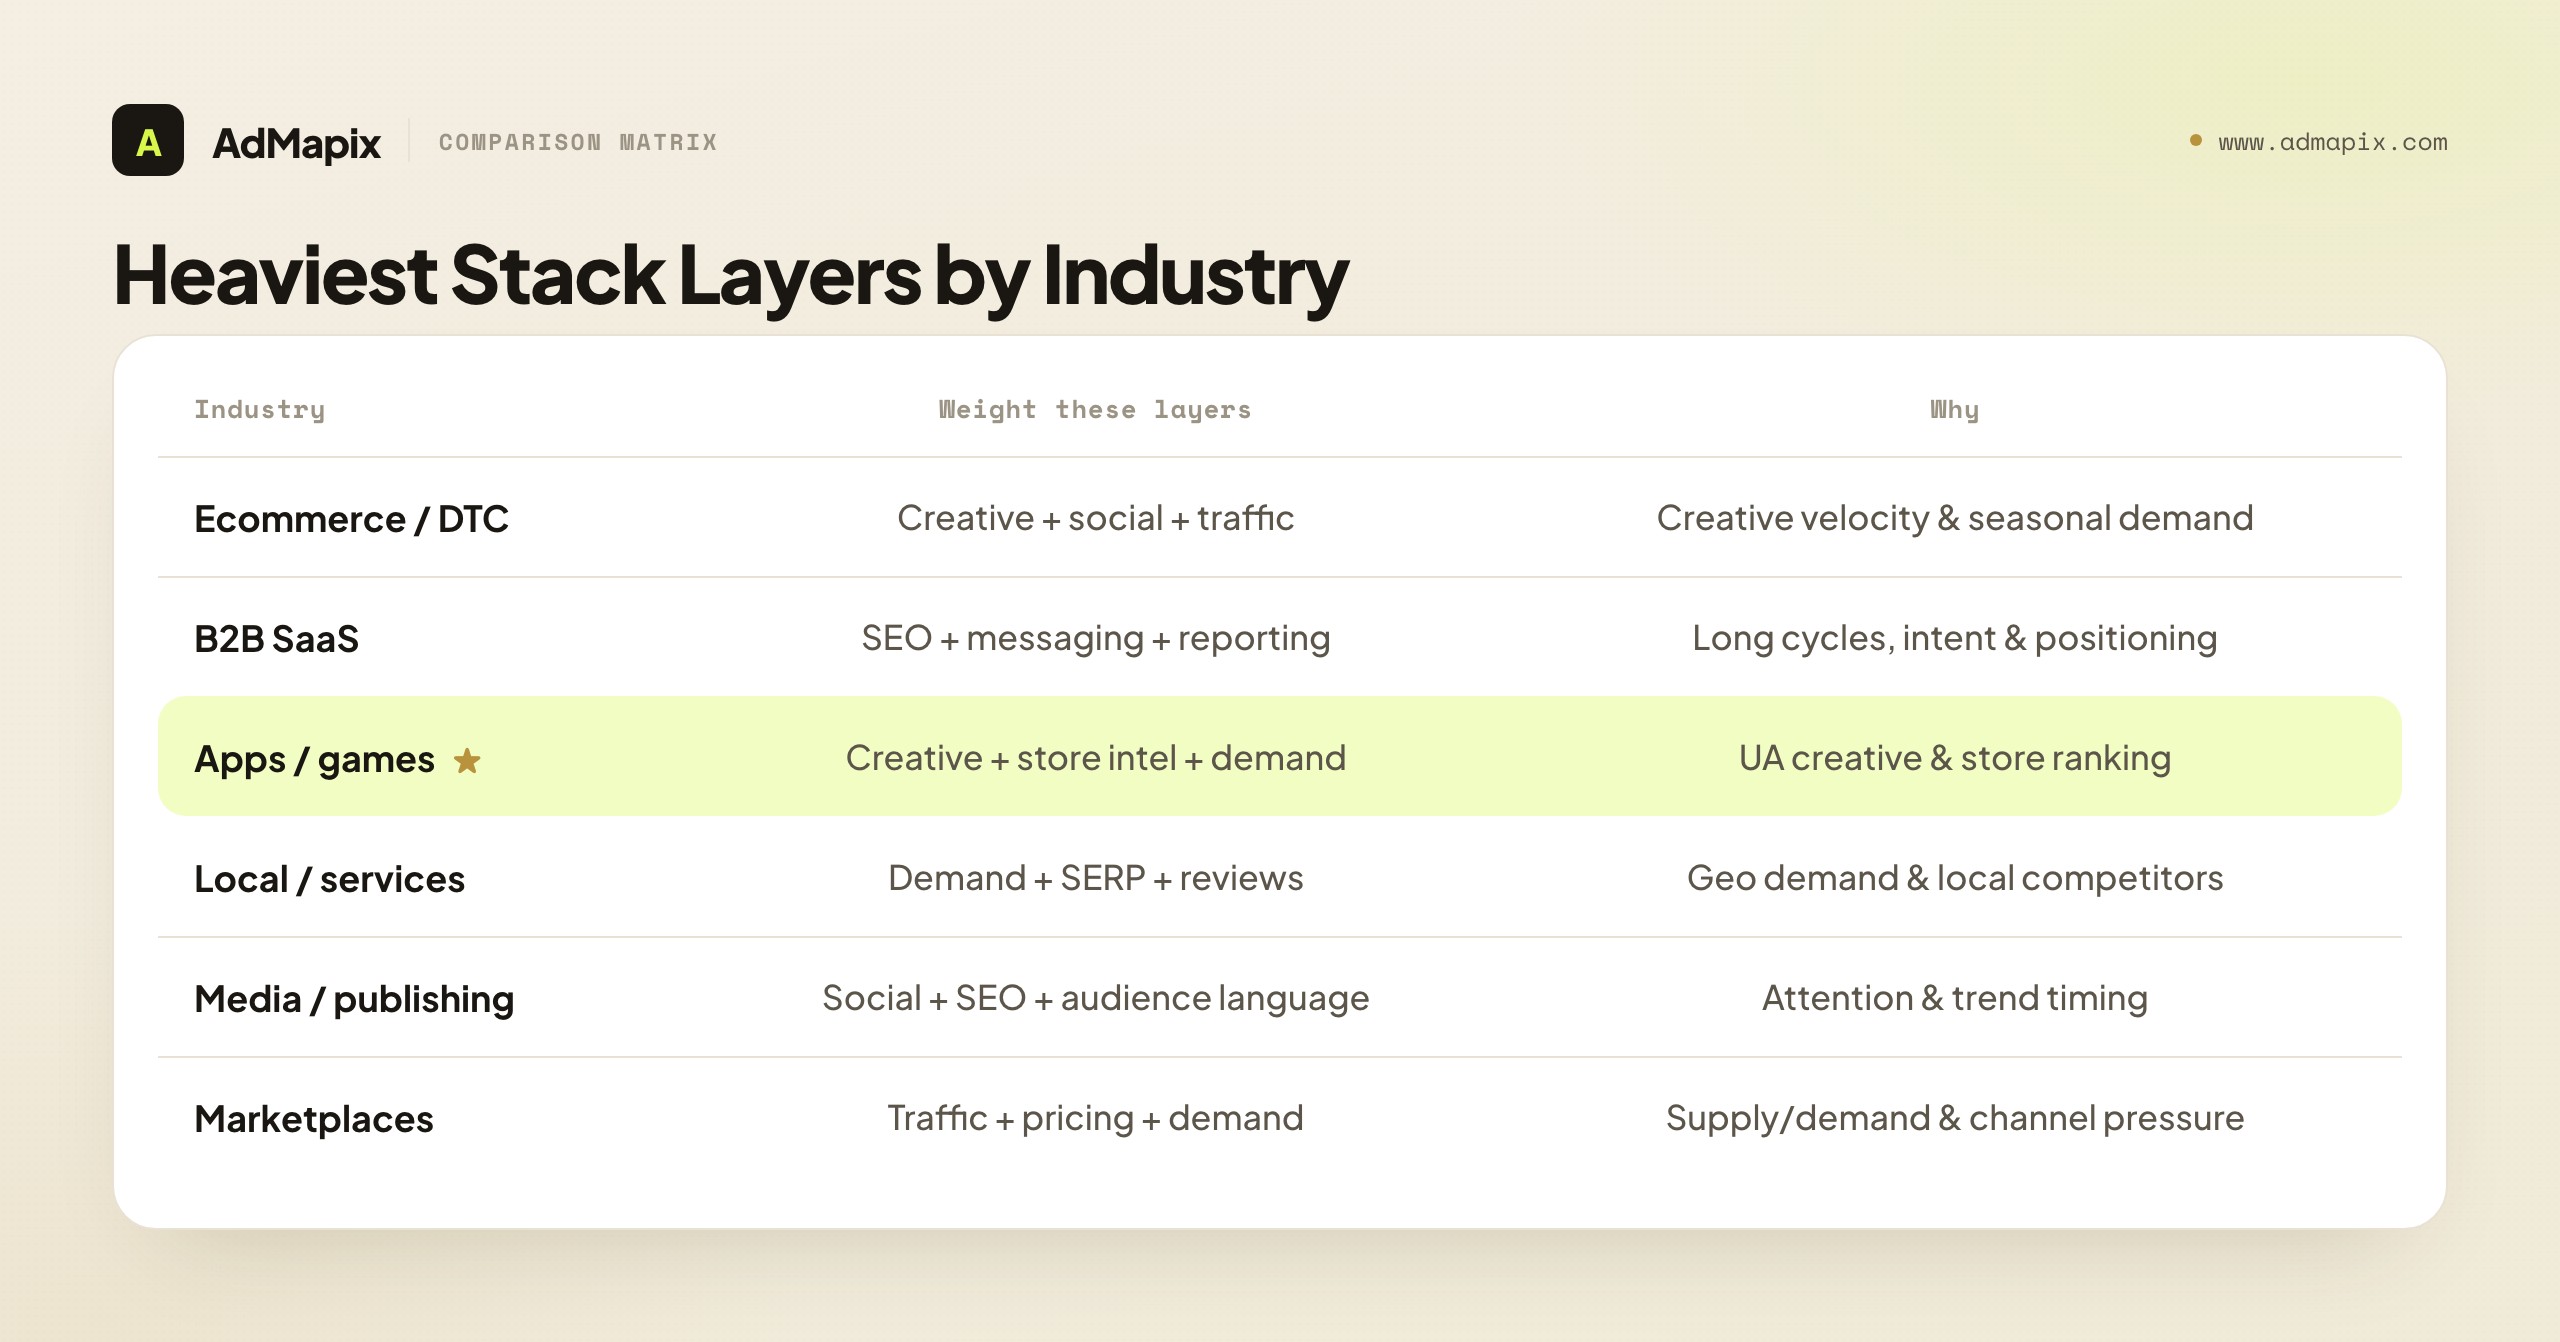
Team stage tells you how much tooling to buy. Industry tells you which layers to weight. The same seven layers exist everywhere, but the center of gravity shifts.
| Industry | Heaviest layers | Why |
|---|---|---|
| Ecommerce / DTC | Ad creative + social/trend + competitor traffic | Creative velocity and seasonal demand dominate; winners are found in ad libraries |
| B2B SaaS | SEO/search + competitor messaging + reporting | Long cycles; intent keywords and positioning shifts matter more than viral creative |
| Mobile apps / games | Ad creative + store intelligence + market demand | UA creative and store ranking drive installs; category momentum signals new markets |
| Local / services | Market demand + SERP + reviews | Geo demand and local-pack competitors beat national trend data |
| Media / publishing | Social/trend + SEO + audience language | Attention and topic momentum are the product; trend timing is everything |
| Marketplaces | Competitor traffic + pricing + market demand | Supply/demand balance and channel pressure define the competitive read |
A B2B SaaS team obsessing over TikTok creative trends is mis-weighting the same way a DTC brand obsessing over SEO content gaps is — both are real layers, just not the ones that move their number. Weight by where your buyers actually decide.
Build vs Buy: The Honest Math
Before subscribing, many teams ask whether they should just assign an analyst to do this manually. Sometimes the answer is yes. Here's the math, framed as the real trade-off rather than a sales pitch.
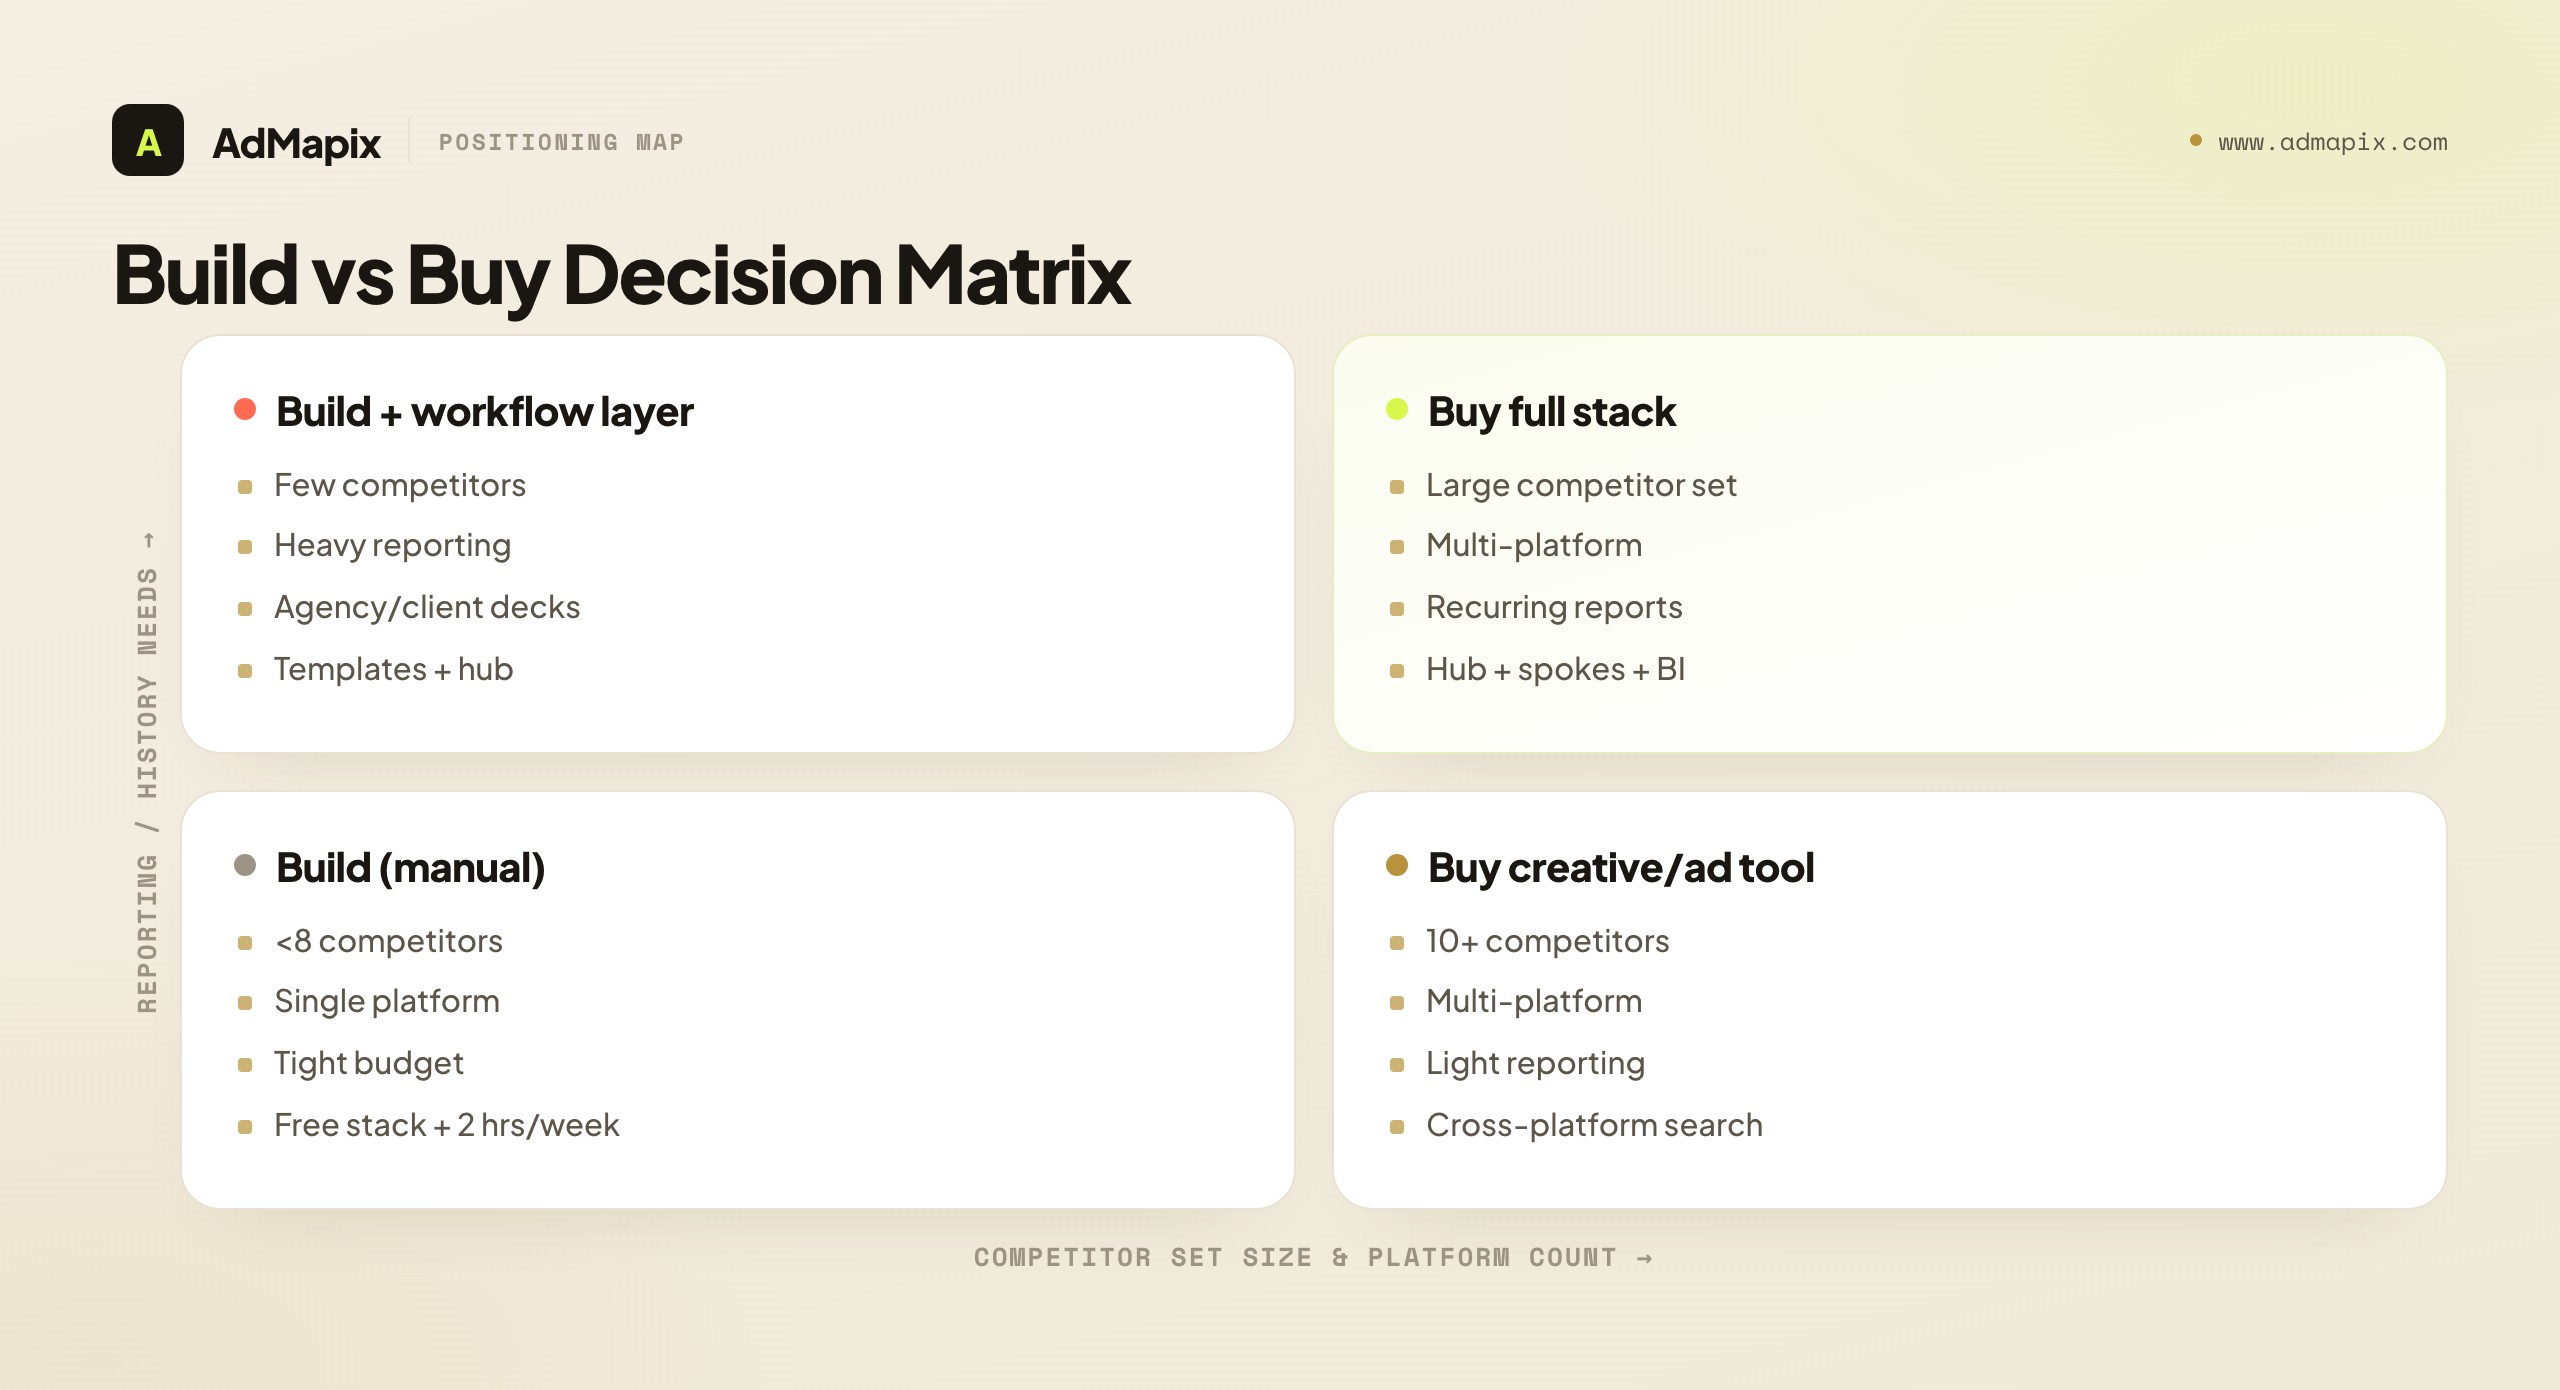
| Factor | Build (manual / DIY) | Buy (paid software) |
|---|---|---|
| Upfront cost | Low (labor only) | Subscription |
| Time per weekly cycle | High (4–8 analyst hours) | Low (1–2 hours) |
| Coverage breadth | Narrow (what one person can check) | Wide (cross-platform) |
| History / archive | Manual, fragile, easily lost | Built-in, durable |
| Consistency | Varies with who's on it | Standardized |
| Best when | <5 competitors, single platform, tight budget | 10+ competitors, multi-platform, recurring reporting |
The honest version: manual works at small scale and breaks predictably as you grow. A solo founder tracking three competitors on Meta should not buy software — the free stack plus two hours a week wins. A 12-person growth team tracking 20 competitors across Meta, TikTok, Google, and YouTube cannot do it manually without a full-time analyst, at which point the subscription is cheaper than the headcount. The crossover point is usually around 8–10 competitors or 3+ platforms. Below it, build; above it, buy.
Put rough numbers on it. At a loaded analyst cost of roughly $40–60 per hour, a manual weekly cycle that runs 6 hours costs about $240–360 a week, or $1,000–1,500 a month, and still misses cross-platform history. A mid-tier intelligence tool that cuts that cycle to 2 hours pays for itself purely on recovered labor once the manual version exceeds ~4 hours a week — which is exactly what happens past the 8–10 competitor mark. The subscription isn't an added cost at that scale; it's a cheaper substitute for hours you're already spending and a hedge against the history you're already losing.
The ROI of Marketing Intelligence
Marketing intelligence is easy to justify intuitively and hard to justify on a spreadsheet, because its value is mostly in avoided mistakes and earlier moves. Three ROI mechanisms are real and worth modeling:
- Faster winning creative. If competitor creative intelligence cuts the time to find a winning angle from 6 weeks to 3, and a winning angle is worth (say) 15% CAC reduction, the value is half a quarter of efficient spend recovered earlier. On a $200K/quarter media budget, even a modest improvement dwarfs a $200/mo tool.
- Avoided dead tests. Knowing which angles competitors already burned through saves you from re-running their failures. Every test slot you don't waste is a test slot spent on a real hypothesis.
- Earlier category-shift detection. Catching a positioning shift 30 days before it becomes obvious is the difference between leading a narrative and chasing it. First-mover advantage on a category message is the highest-leverage outcome and the hardest to quantify — but ask any brand that arrived to a saturated angle six months late what it cost them.
The trap is measuring MI like a performance channel (direct, attributable conversions). It isn't one. Measure it like insurance plus optionality: how many expensive mistakes did it prevent, and how many earlier moves did it enable? If your weekly review consistently produces at least one test you wouldn't otherwise have run, the stack is paying for itself.
Setting Up Source-Confidence Scoring
Throughout this guide one principle recurs: public ad data, modeled traffic estimates, and first-party analytics do not carry the same certainty. The problem is that "keep source confidence clear" is easy to say and easy to forget the moment a finding lands in a slide deck. The fix is to make confidence explicit and structured — a small system, not a good intention.
Adopt a simple three-tier label and apply it to every finding before it reaches a decision:
| Confidence | What it means | Typical sources | How to act on it |
|---|---|---|---|
| High | Measured first-party data, or a public fact you verified directly | GA4, your CRM, a live competitor ad you screenshotted | Act on it directly; safe to brief leadership |
| Medium | A clear pattern from multiple corroborating signals | A creative angle seen across several competitors; a consistent trend | Test it, don't bet the quarter on it |
| Low | A single modeled estimate or one unverified signal | One traffic-tool estimate; a single ad with no corroboration | Treat as a hypothesis only; corroborate before acting |
The discipline is to attach the label to the finding, not keep it in your head. In your weekly decision memo, every claim carries its tier: "Competitor X is scaling TikTok spend (medium — three creative-velocity signals, no spend confirmation)" reads completely differently from the same sentence with no qualifier. The label changes how the reader weighs it, and it protects you when a low-confidence read turns out wrong — you flagged it as a hypothesis, not a fact.
Two rules make the system stick. First, never let a modeled estimate inherit the formatting of a measurement. The classic failure is a slide that puts a Similarweb traffic estimate next to a GA4 number in identical fonts — readers assume equal precision and over-trust the model. Visually distinguish them, or label them. Second, upgrade confidence only with corroboration, never with repetition. Seeing the same low-confidence estimate three times doesn't make it high-confidence; it makes it a low-confidence estimate you've seen three times. Confidence rises when independent sources agree — a traffic estimate that matches a hiring surge that matches a new ad push is genuinely higher-confidence than any one signal alone. Build this scoring into your templates and the whole stack gets more trustworthy overnight, because every decision now carries an honest certainty label.
Common Mistakes When Choosing Marketing Intelligence Software
Mistake 1: Confusing Data Volume With Decision Quality
More rows do not automatically mean better intelligence. A tool that shows a million ads but cannot help you decide what to test next may slow the team down. Database size is the most over-weighted feature in the category. Ask "how fast does this get me to a brief," not "how many ads does it have."
Mistake 2: Treating Estimates as Exact Competitor Data
Traffic estimates, spend estimates, and public ad signals are useful directional evidence. They are not the same as private account data. Use confidence levels such as low, medium, and high before turning findings into action. A modeled traffic figure off by 30% is still useful for direction; it's dangerous only when presented as precision.
Mistake 3: Ignoring Landing Pages
Competitor ads are only half the story. The landing page often reveals the offer, proof, pricing, objection handling, and conversion path. Always connect the ad to the funnel. An ad tells you the hook; the LP tells you the whole hypothesis. Teams that analyze ads but never click through to the LP are reading the headline and skipping the article.
Mistake 4: Buying Tools Without Assigning Ownership
Every marketing intelligence tool needs an owner. If nobody is responsible for reviewing it, tagging findings, and turning them into actions, the tool becomes another subscription. The owner doesn't have to be senior — but the role must exist, with a named person and a recurring calendar slot.
Mistake 5: Separating Intelligence From Testing
Marketing intelligence should produce testable decisions. If a weekly review does not create a creative brief, landing-page test, content update, monitoring rule, or executive note, the workflow is incomplete. The output of intelligence is a change, not a document.
Mistake 6: Over-Buying Before the Rhythm Exists
The most expensive mistake is buying the full enterprise stack while the team still checks competitors "when someone remembers." Tools amplify a process; they don't create one. Establish the weekly rhythm with free sources first, then buy tools to make that proven rhythm faster and broader.
Common Data Pitfalls That Mislead Marketing Intelligence
The mistakes above are about choosing tools; these are about reading the data once you have it. Marketing intelligence runs on incomplete, public, and modeled signals, which means it's unusually prone to a handful of interpretation traps. Knowing their names is half the defense.
Survivorship bias. You see the competitor ads that are still running, not the ones that were killed. Studying only the survivors makes you conclude that whatever's live must be working — when in reality you're looking at the few that lasted, blind to the many that failed. The correction: weight longevity plus repetition (an ad running 60 days across multiple variants) over mere presence, and remember that a competitor's current creative is their winners plus their not-yet-killed tests, not a curated best-of.
Sampling and freshness gaps. Modeled traffic and trend tools sample, and samples lag. A "traffic estimate" may be weeks old and built on a partial panel, so treating it as a real-time, precise number is a category error. Always ask a tool two questions before trusting it: how fresh is this, and how is it sampled? If you can't answer either, drop the finding's confidence a tier.
Correlation read as causation. A competitor's traffic rose the same month they launched a new campaign — did the campaign cause it, or did a seasonal spike, a PR cycle, or a partner deal? Public data almost never shows the mechanism, only the co-movement. The discipline is to hold causal claims loosely and look for converging evidence (the traffic rise and a hiring surge and a creative-volume jump) before you act as if you know why something moved.
Aggregation that hides the signal. A blended, account-level number averages away the very thing you need. "Their Google spend is up 20%" might be entirely PMax Search Partner noise, not core Search. "Conversion is flat" might hide one market doubling while another halves. Always ask whether the number is aggregated across things that should be separated — channels, markets, audiences — before drawing a conclusion from it.
Recency and salience bias in your own reading. The most recent or most dramatic competitor move feels the most important, but it often isn't. A single splashy launch grabs attention while a slow, sustained shift in messaging — the thing that actually changes the category — goes unnoticed because no single week is dramatic. Counter it by tracking trends over time (the diff against last month), not just reacting to whatever's loudest this week.
The common thread: marketing intelligence data is directional, not precise, and most pitfalls come from treating directional signals as exact facts. Pair every one of these with the source-confidence scoring above and you'll dodge the interpretation errors that quietly steer teams toward confident, wrong decisions.
A Practical Weekly Workflow
Use this lightweight process before building a complex system. It is deliberately calendar-shaped so it survives busy weeks — the rhythm matters more than the depth on any single day.
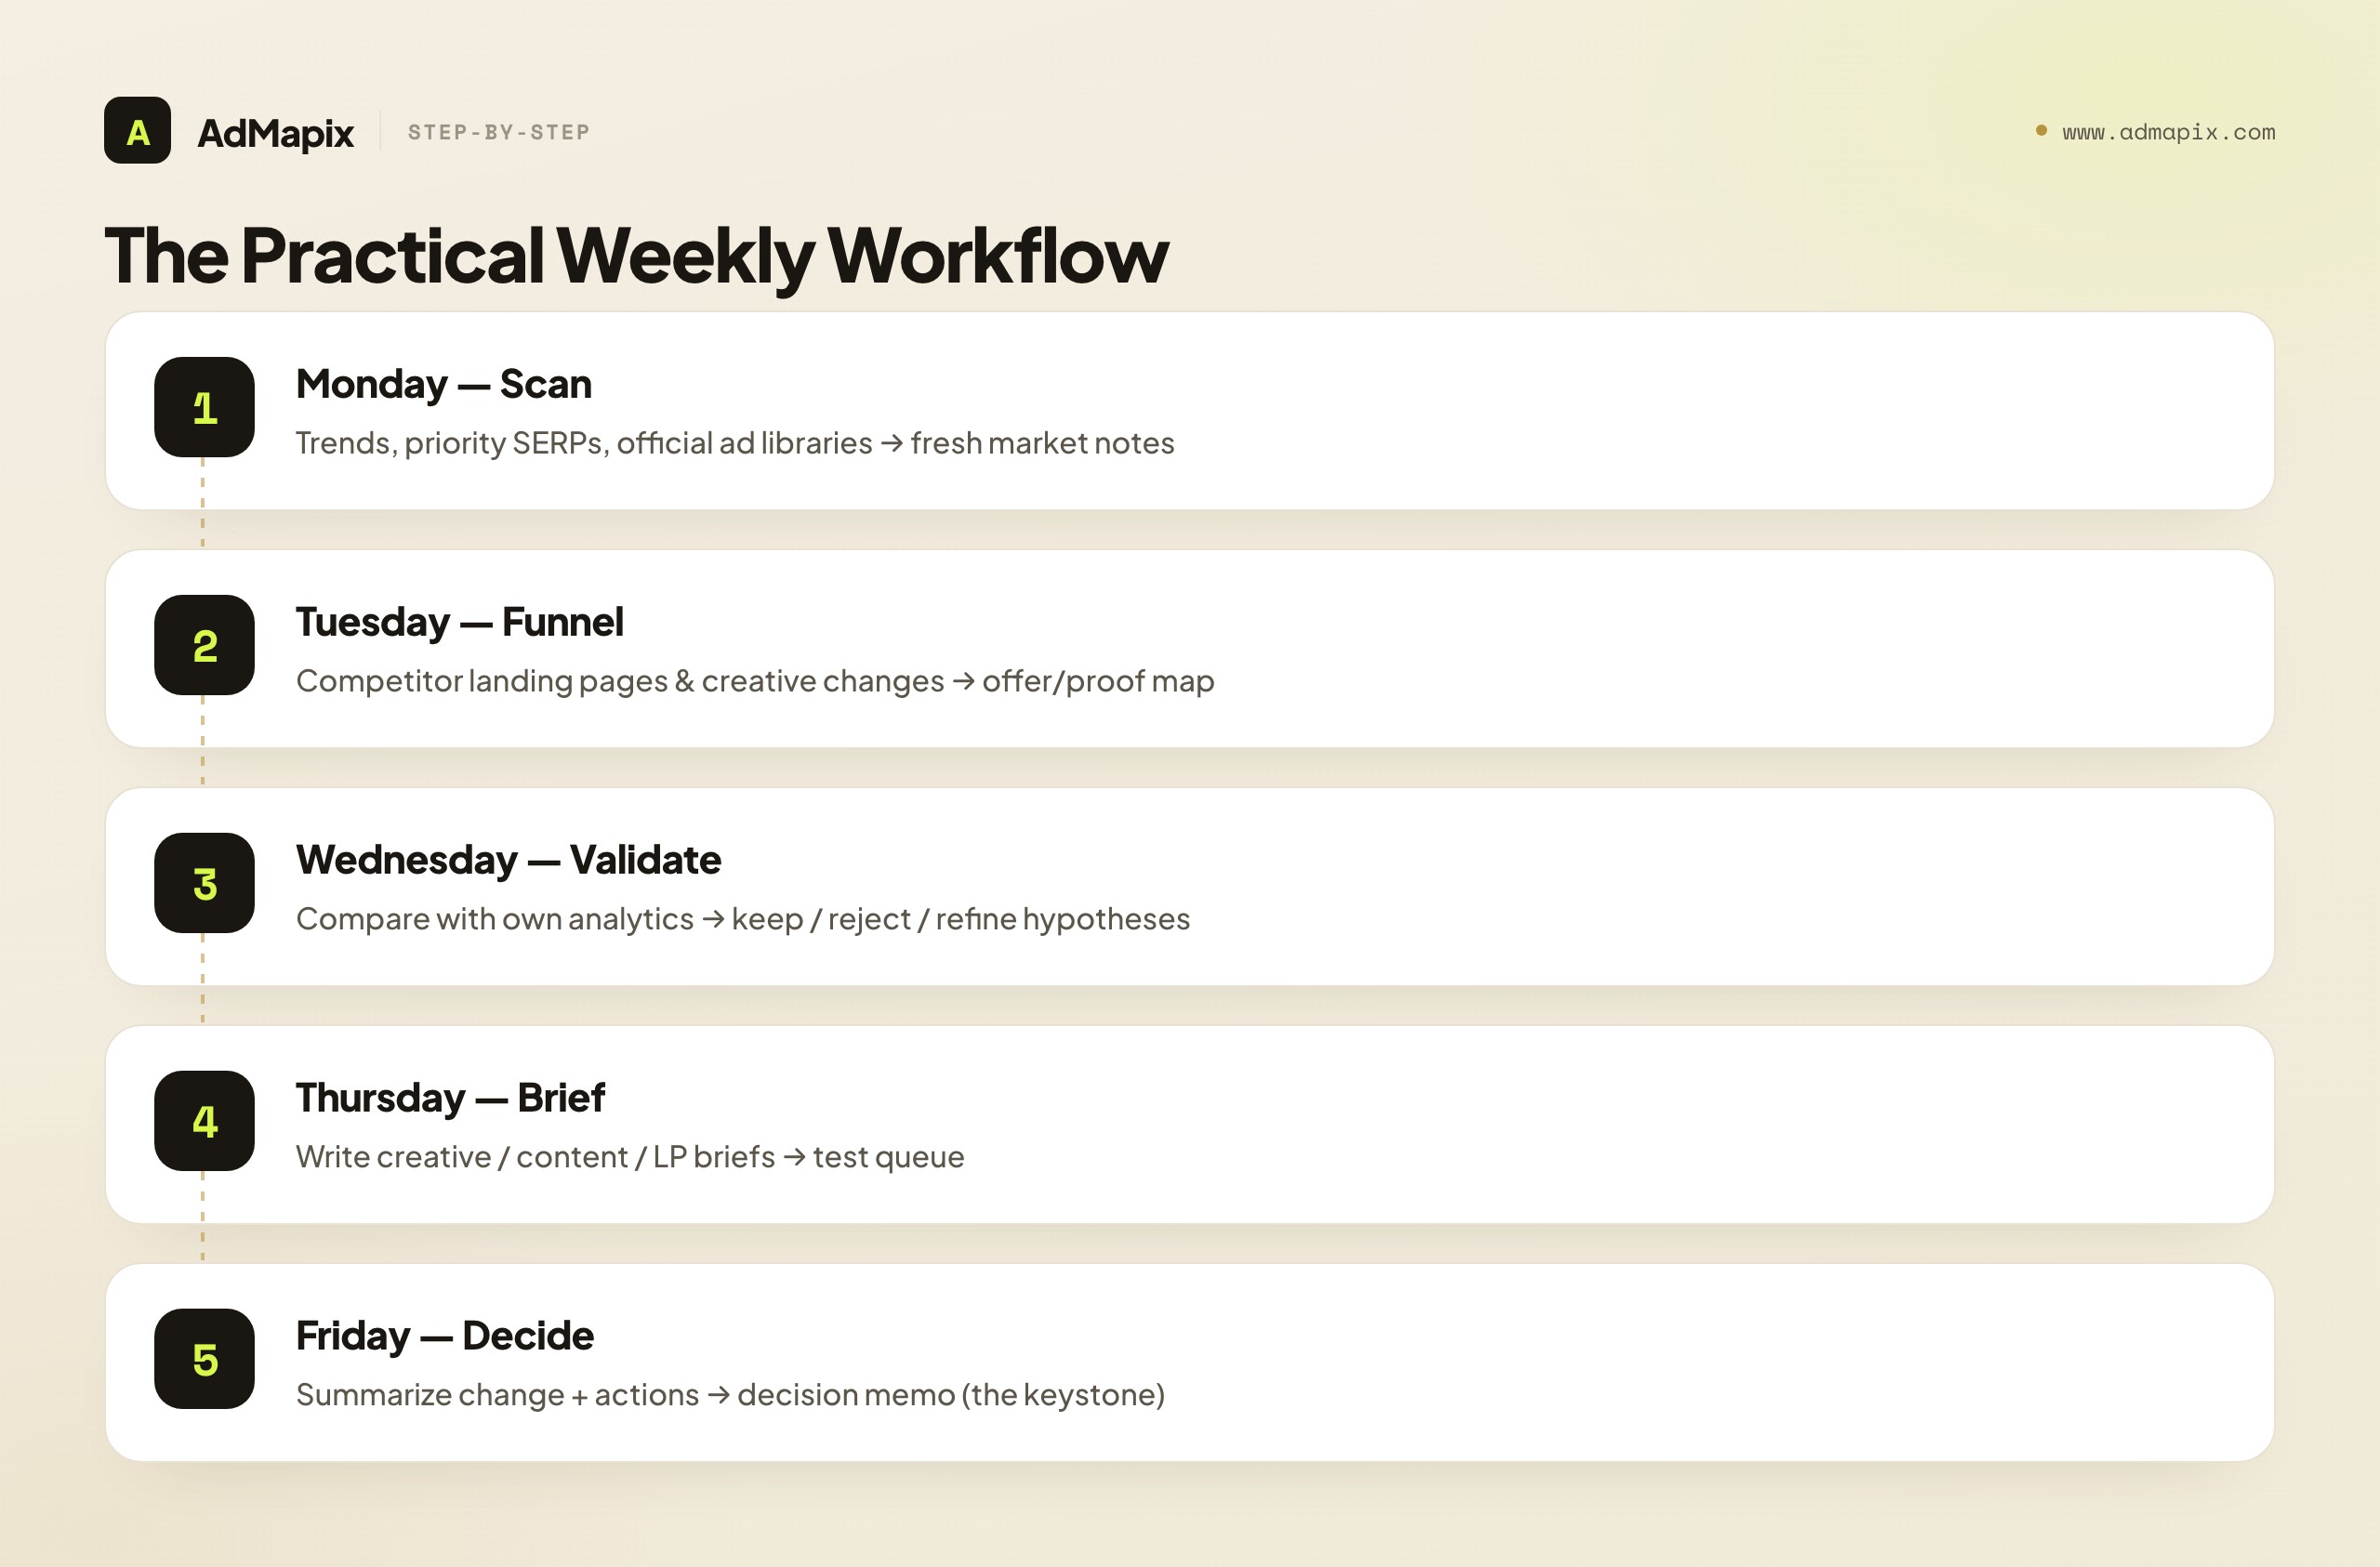
| Day | Action | Output |
|---|---|---|
| Monday | Check Trends, priority SERPs, and official ad libraries | Fresh market and competitor notes |
| Tuesday | Review competitor landing pages and creative changes | Offer and proof map |
| Wednesday | Compare findings with your own analytics | Keep, reject, or refine hypotheses |
| Thursday | Write creative, content, or landing-page briefs | Test queue |
| Friday | Summarize what changed and what the team will do | Decision memo |
This rhythm keeps the stack practical. The team does not need to monitor everything every day. It needs to notice meaningful changes early enough to respond. The Friday decision memo is the keystone artifact — if it exists every week, the whole stack is working; if it's skipped, no tool in the stack is delivering value, because nothing is reaching a decision.
A 30-Day Implementation Roadmap
If you're standing this up from scratch, here's a sequenced first month that avoids the "bought tools, no process" trap:
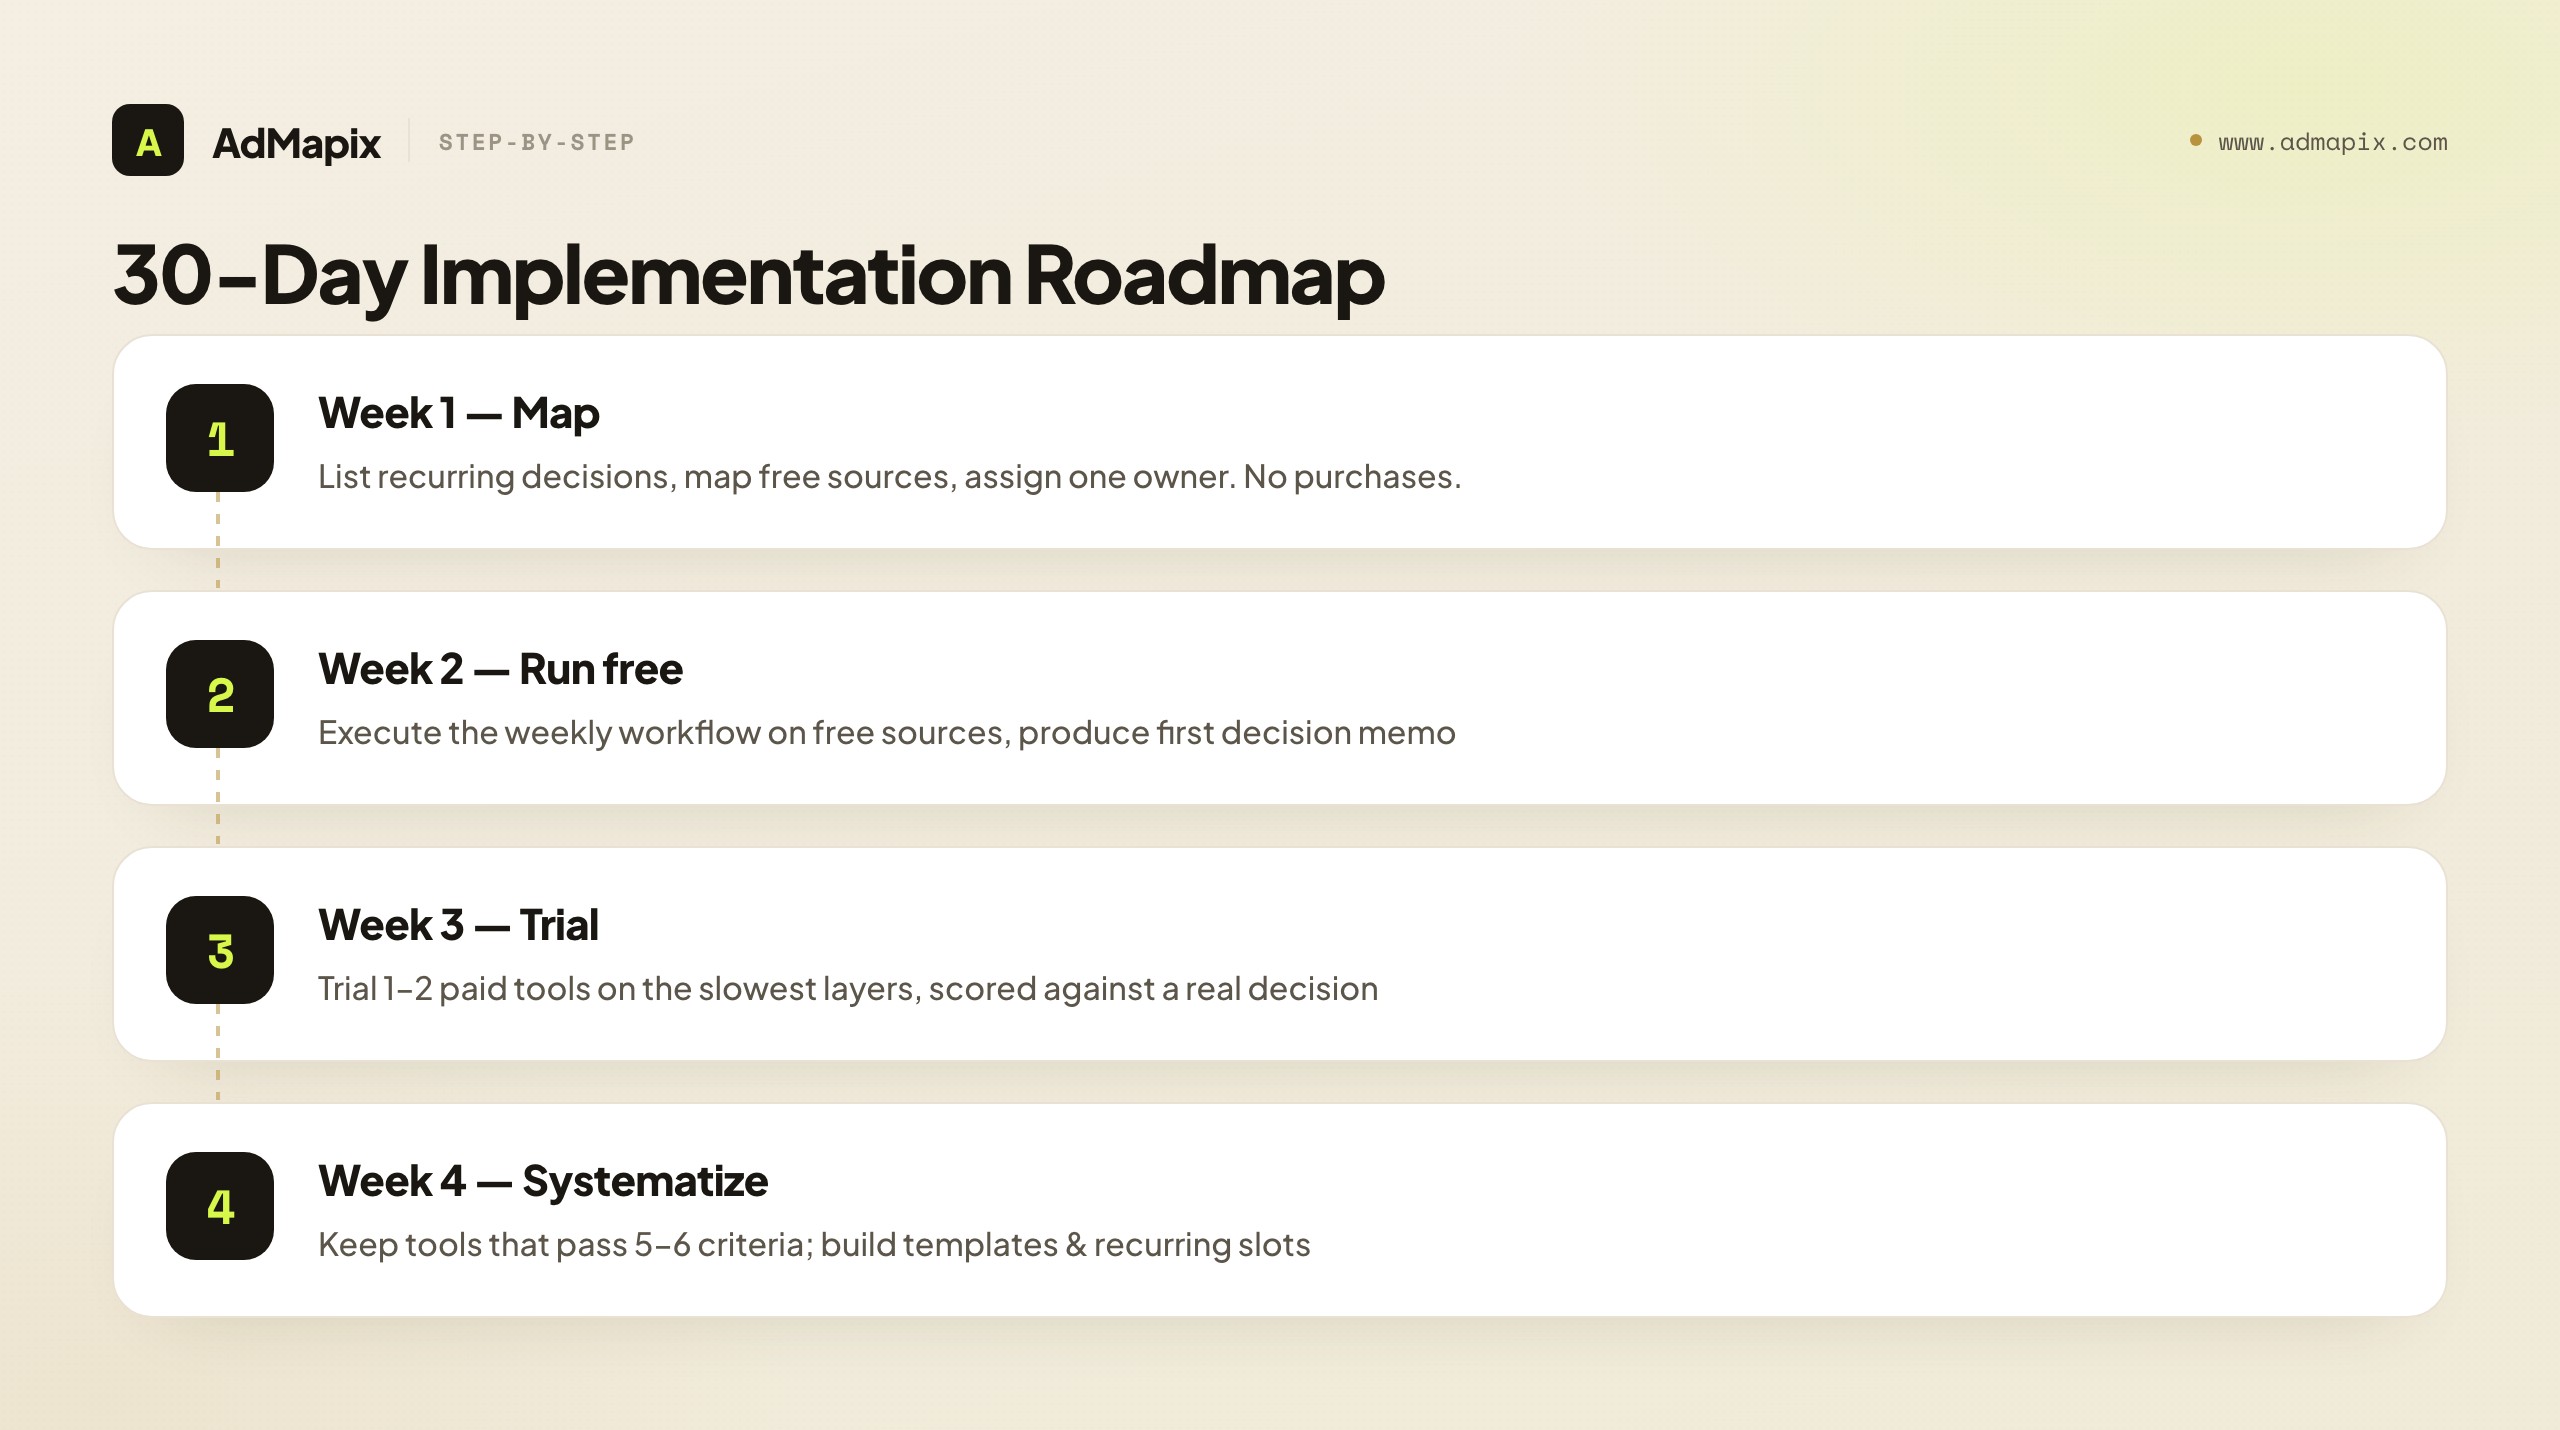
- Week 1 — Decisions & sources. List the 5–6 recurring decisions the team makes. Map free sources to each. Assign one owner for the weekly review. No purchases yet.
- Week 2 — Run the free rhythm. Execute the Monday-to-Friday workflow using only free sources. Produce your first decision memo. Note exactly where it was slow or thin.
- Week 3 — Targeted trials. For the 1–2 layers that were slowest (usually cross-platform creative or competitor traffic), trial one paid tool each against the scorecard, on a real decision.
- Week 4 — Decide and systematize. Keep tools that passed 5–6 criteria. Build templates for the brief and the memo. Set the recurring calendar slots. Document source-confidence labeling so the rhythm survives a handoff.
By day 30 you have a proven process, evidence-based tool choices, and reusable templates — in that order, which is the order that prevents shelfware.
How AdMapix Fits a Marketing Intelligence Stack
This guide is deliberately tool-agnostic, and the free stack genuinely covers most early-stage needs. Where teams hit a wall is the ad-creative and competitor-research layer at scale: the moment you're tracking more than ~10 competitors across Meta, TikTok, Google, and YouTube, manual swipe files break down and free libraries erase the history you need.
AdMapix sits in two of the seven layers — paid ads/creative intelligence and reporting/decision workflow. Concretely, it provides cross-platform creative search (one query across multiple ad networks instead of tab-hopping five free libraries) and turns that evidence into decision-ready reports and briefs rather than another raw dashboard. It is not a replacement for your SEO suite, your traffic-intelligence tool, or your BI — those remain best-in-class spokes. It's the hub for the competitive-ad slice, designed so the weekly review produces a brief instead of a folder of screenshots. If your bottleneck is interpretation of competitor ads at scale, that's the gap it closes; if it's anywhere else in the stack, use the right spoke for that layer.
Marketing Intelligence Tools for Agencies vs In-House Teams
The right marketing intelligence stack looks different depending on whether you serve one brand or many. Agencies and in-house teams have genuinely different constraints, and choosing tools without accounting for that is a common reason a stack underdelivers.
In-house teams optimize for depth on a single business. You can afford to go deep on your own category, your handful of direct competitors, and the specific channels that drive revenue. Continuity matters more than breadth: the same person watches the same competitor set week after week, so historical context compounds. The biggest risks are tunnel vision (only watching the obvious rivals) and tool sprawl (every team buying its own point solution until nobody sees the whole picture). The scorecard criteria that matter most here are data depth, historical retention, and how cleanly a tool exports into your existing BI — fewer tools, used more deeply, feeding one source of truth.
Agencies optimize for breadth, repeatability, and client-facing output. You manage many brands across many categories, so you need tools that scale horizontally: multi-workspace or multi-client organization, fast onboarding of a new competitor set, and — critically — white-label or export-friendly reporting, because the deliverable is a client-ready memo, not an internal Slack note. Per-seat or per-client pricing math dominates the build-vs-buy decision in a way it rarely does in-house. An agency's worst outcome is spending billable hours rebuilding the same competitor research from scratch for each client; the value of the stack is turning a repeatable research process into a productized service.
A few practical implications fall out of this split:
| Consideration | In-house priority | Agency priority |
|---|---|---|
| Pricing model | Flat or per-seat | Per-client / multi-workspace |
| Reporting | Feeds internal BI | White-label, client-ready |
| Depth vs breadth | Depth on one category | Breadth across many |
| Continuity | Same watcher, compounding context | Fast onboarding per client |
| Biggest risk | Tunnel vision + tool sprawl | Re-doing research per client |
The common thread is the same idea that runs through this whole guide: the tool is only as good as the decision it produces. An in-house team buys depth so one analyst can defend a budget call; an agency buys repeatability so a junior can ship a client-ready competitive brief without reinventing the workflow. Map your purchase to which of those you actually are before comparing feature lists.
FAQ
What are marketing intelligence tools?
Marketing intelligence tools are software products, public sources, and workflows that help teams understand market demand, competitor activity, buyer behavior, advertising patterns, and campaign opportunities. The best tools turn signals into decisions — a creative brief, a content priority, a monitoring rule — not just another dashboard. They span seven layers, from market-demand data down to the reporting workflow that records what the team will do about it.
What is the difference between marketing intelligence tools and marketing analytics tools?
Marketing intelligence tools look outward at the market, competitors, public ads, traffic movement, trends, and category signals. Marketing analytics tools look inward at your campaigns, website, CRM, product events, and revenue performance. Intelligence is forward-looking (what's about to matter); analytics is backward-looking (what already happened). Teams need both — intelligence generates hypotheses and analytics validates them.
What is the difference between marketing intelligence and business intelligence?
Marketing intelligence (MI) focuses on external market, competitive, and buyer signals to inform marketing decisions. Business intelligence (BI) focuses on internal company data across all functions — finance, operations, sales — usually via warehouse-and-dashboard tools like Looker or Power BI. MI's core verb is discover (what's new outside); BI's is report (what's true inside). A BI tool will tell you CAC rose; an MI tool helps explain why.
What is the best marketing intelligence software for a small team?
Start with free official sources: Google Trends, Google Ads Transparency Center, Meta Ad Library, TikTok Creative Center, Search Console, GA4, and a simple competitor tracking sheet. This covers roughly 70–80% of a small team's needs. Add paid marketing intelligence software only when the manual workflow becomes too slow or inconsistent — typically once you track more than 8–10 competitors or work across 3+ platforms.
Are free ad libraries enough for competitor research?
They are enough for baseline, point-in-time checks, but not always enough for ongoing research. Free ad libraries are fragmented, require manual review, and erase non-political ad history once campaigns stop. Teams with frequent creative testing, multiple markets, or agency reporting needs usually need a workflow or paid intelligence layer to add cross-platform search and durable history.
How do you choose a marketing intelligence platform?
Run the 6-criterion buyer's scorecard: use-case fit, data freshness, source transparency, workflow output, team adoption, and decision risk. Score each pass/fail against a real stuck decision during a two-week trial, not a demo. A tool that passes 5–6 criteria can drive decisions now; 3–4 means pair it with another source; 0–1 means skip it. Avoid choosing by database size or dashboard design.
Should we build a manual process or buy marketing intelligence tools?
Build manually when you track fewer than ~8 competitors on a single platform with a tight budget — the free stack plus a couple of analyst hours a week wins. Buy software once you cross roughly 8–10 competitors or 3+ platforms, where manual research would require a full-time analyst and the subscription is cheaper than the headcount. The crossover is about breadth and history, not sophistication.
How does AdMapix fit into a marketing intelligence stack?
AdMapix fits the paid-ads/creative-intelligence and reporting/workflow layers. It provides cross-platform creative search and turns competitor ad evidence into decision-ready reports and briefs. It complements — not replaces — your SEO suite, traffic-intelligence tool, and BI. Use it as the hub for the competitive-ad slice when manual swipe files break down; review pricing for recurring workflows.
How often should a team review marketing intelligence?
Use a layered cadence: a quick daily or every-other-day scan of priority sources to catch new launches, a structured weekly review that produces briefs and a decision memo, and a monthly rollup for leadership. Daily catches surprises; weekly produces decisions; monthly communicates them. Anything less frequent than weekly tends to decay into a quarterly PDF nobody reads.
How do I score the confidence of marketing intelligence findings?
Use a three-tier label and attach it to every finding before it reaches a decision. High = measured first-party data or a directly verified public fact (act on it). Medium = a clear pattern from multiple corroborating signals (test it, don't bet the quarter). Low = a single modeled estimate or unverified signal (treat as a hypothesis, corroborate first). The key disciplines are never letting a modeled estimate inherit the formatting of a measurement, and only upgrading confidence with independent corroboration — seeing the same low-confidence estimate repeatedly doesn't make it more reliable. Build the label into your decision memo so every claim carries an honest certainty tier.
What are the most common data mistakes in marketing intelligence?
Five recur: survivorship bias (you see surviving competitor ads, not the killed ones), sampling and freshness gaps (modeled estimates lag and sample partially), correlation read as causation (public data shows co-movement, rarely the mechanism), over-aggregation (a blended number averages away the signal — PMax noise inflating "Google spend," one market hiding another), and recency bias (the loudest recent move feels most important while slow category shifts go unnoticed). The common thread is treating directional, public data as precise fact. Pair every finding with confidence scoring and look for converging evidence before acting.
Conclusion
The best marketing intelligence tools do not only collect data. They help your team decide what to monitor, what to test, what to ignore, and what to explain to stakeholders.
Build the stack from decisions backward: market demand, search, paid ads, social trends, competitor traffic, first-party analytics, and reporting. Keep source confidence clear and labeled. Run the buyer's scorecard before every purchase, weight your layers by industry, and respect the build-vs-buy crossover instead of over-buying early. Then turn the weekly review into creative briefs, landing-page tests, content priorities, and competitor monitoring rules — recorded in a Friday decision memo that proves the whole stack is working.
If competitor ad research is the bottleneck, use AdMapix reports to turn public ad evidence into a decision-ready brief instead of manually checking every source.
See what competitors are really running
Search 6M+ ad creatives, landing pages, and weekly spend across 200+ countries. No credit card, no commitment.
Related Articles
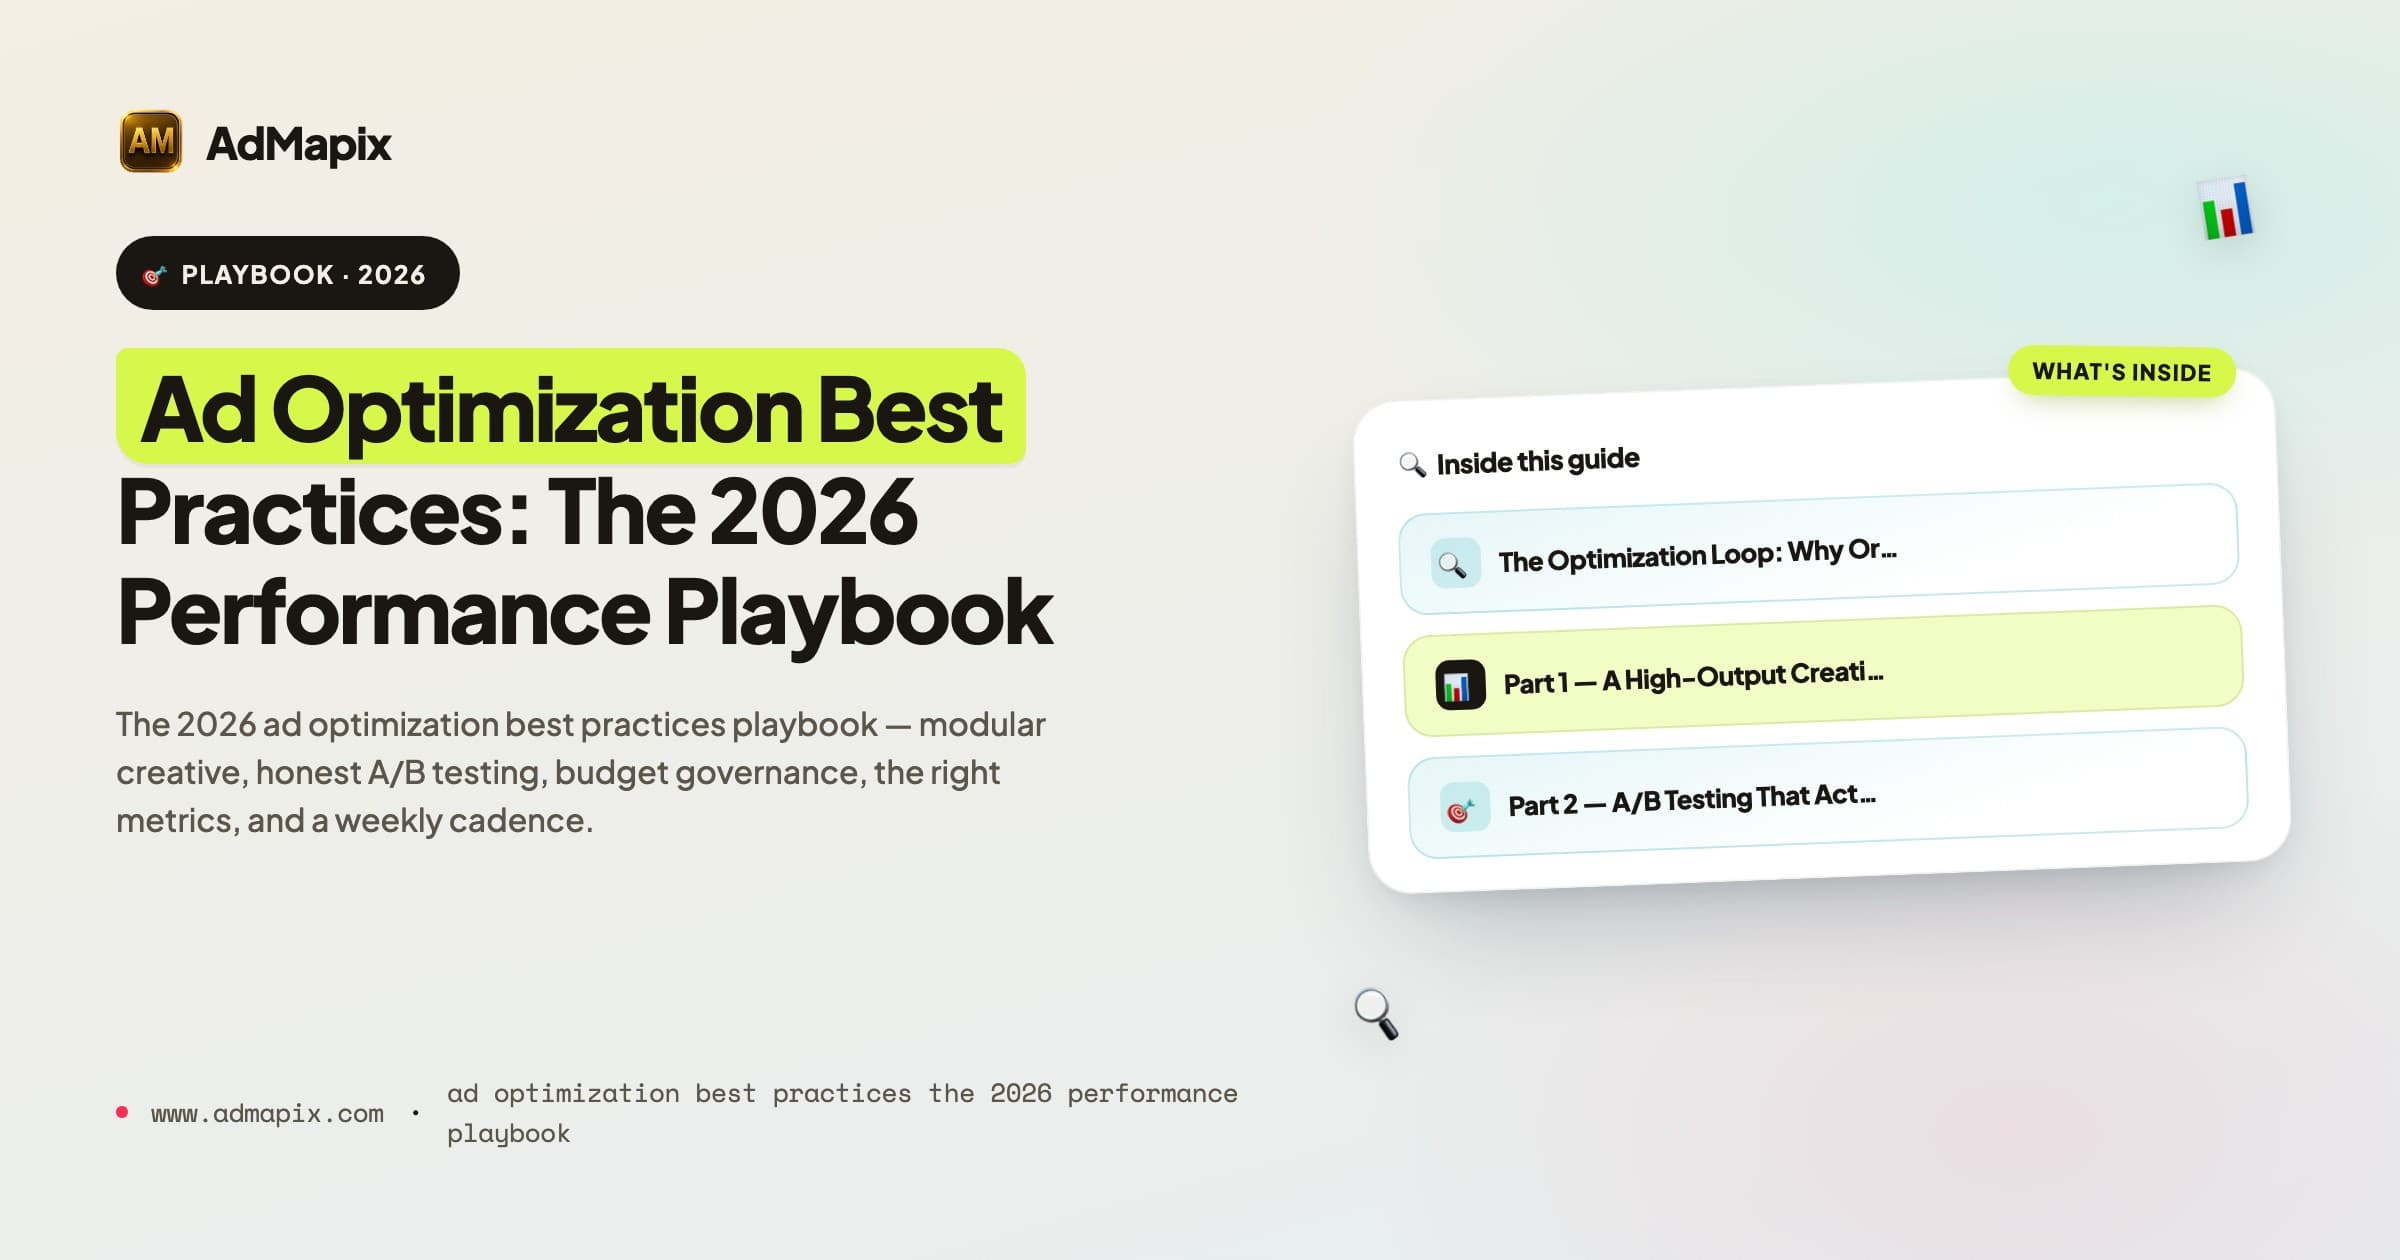
Ad Optimization Best Practices: The 2026 Performance Playbook
The definitive 2026 guide to ad optimization best practices — a high-output creative production system, statistically honest A/B testing, budget governance and pacing rules, the metrics that matter, structured account hygiene, an optimization cadence, and an FAQ that settles the hard questions performance teams keep arguing about.
Pathmatics Alternative in 2026: Ad Spend Intelligence vs. Creative Workflow
A complete 2026 buyer's guide to choosing a Pathmatics alternative — why teams look past Pathmatics (now Sensor Tower), what it actually measures, a layered comparison of spend-intelligence suites versus creative-workflow tools across coverage, data type, price, and fit, who should choose which, a practical migration plan, the honest limits of estimated spend, and where a lighter cross-network creative tool like AdMapix fits.
Moat Alternative in 2026: Ad Verification vs. Creative Intelligence
A complete 2026 buyer's guide to choosing a Moat alternative — why teams look past Oracle Moat, what Moat actually does (viewability, invalid traffic, brand safety), the critical split between the ad-verification layer and the creative-intelligence layer, a layered comparison across coverage and fit, who should choose which, a practical migration plan, the honest limits of public creative data, and where a creative-research tool like AdMapix fits.