Ad Budget Monitoring & Optimization Framework: Allocate Paid Media Budget in 2026
A 7,500-word 2026 framework for ad budget monitoring, tracking, and optimization: the 70-20-10 split, marginal ROAS, competitor ad budget signals, budget pacing, a weekly tracking dashboard, and a monthly reallocation workflow.
By the AdMapix Research Desk — Updated June 21, 2026
Ad Budget Monitoring & Optimization Framework: How to Allocate Paid Media Budget in 2026
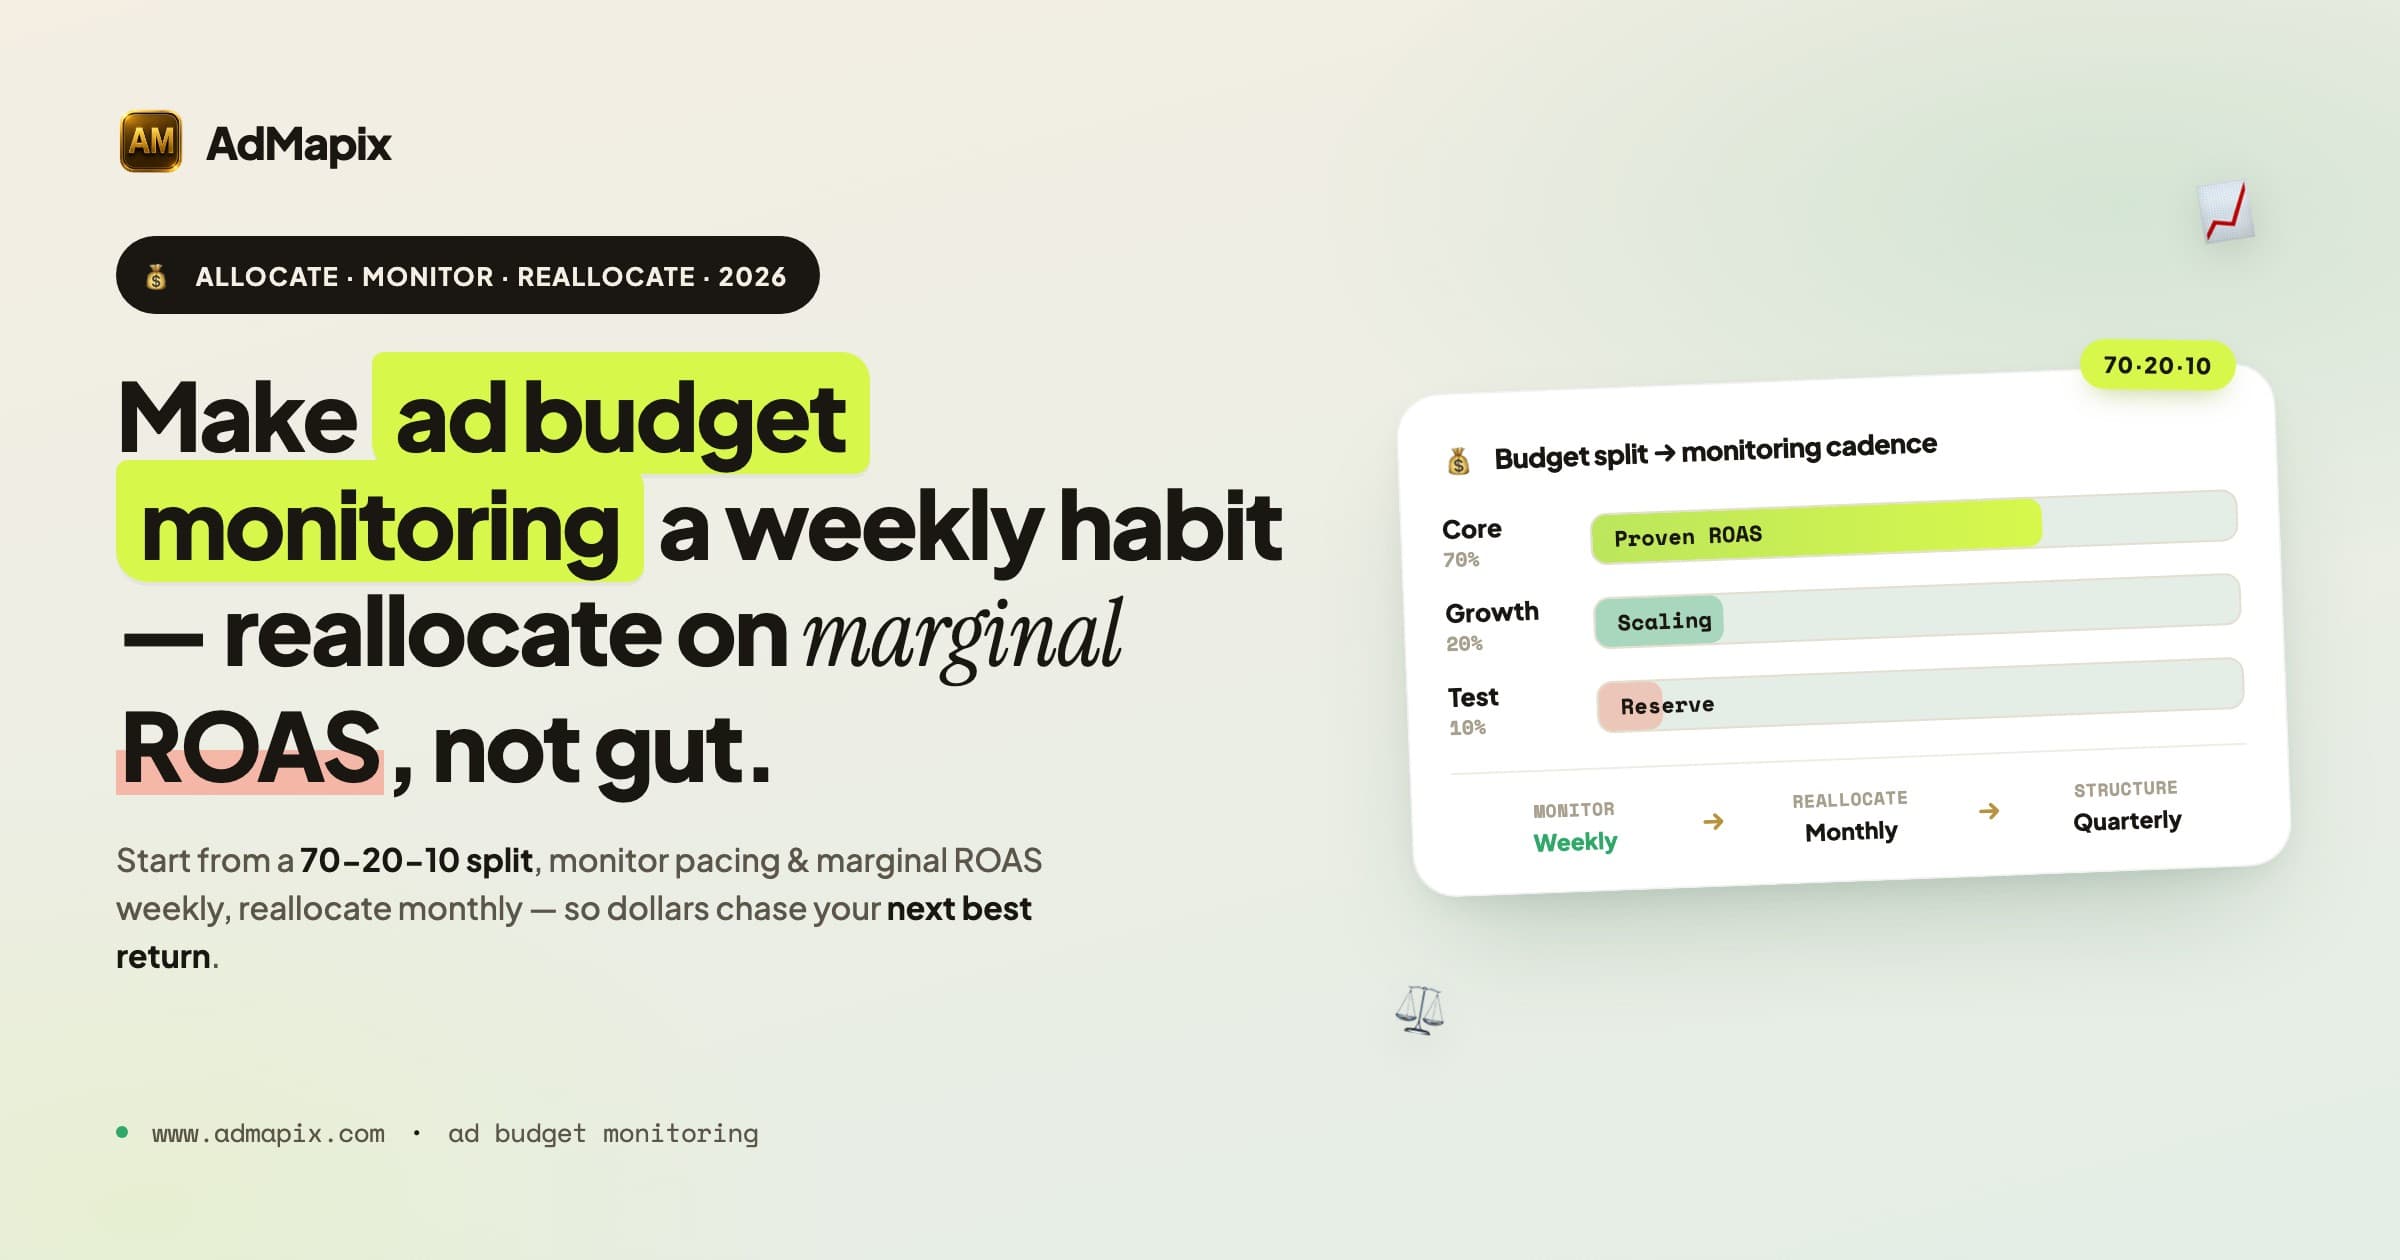
Ad budget optimization isn't about spending less — it's about monitoring which dollars are working, tracking how that changes week to week, and reallocating with rigor instead of gut feel. Most teams treat budget as a number they set in a planning meeting and revisit quarterly. The teams that win treat it as a living signal they monitor continuously and adjust on a disciplined cadence.
This guide is the complete 2026 framework for ad budget monitoring, tracking, and optimization. It is written for performance marketers, media buyers, PPC and paid social managers, growth leads, and agency strategists who own a paid media budget and need a repeatable system to allocate it — across channels, campaigns, and regions — using data they already have. It covers the structural budget split, marginal ROAS (the only metric that should drive reallocation), competitor ad budget signals, budget pacing and tracking, a weekly monitoring dashboard, and a month-long optimization workflow you can run forever.
The core principle, stated once up front: budget allocation is the highest-leverage decision in paid media, and the one most teams approach with the least rigor. You do not need enterprise marketing-mix modeling to fix that. You need a structure, a monitoring habit, and a few decision rules applied consistently.
If you need the broader competitor side of this, read our paid ads competitor research playbook and the competitor ad analysis framework. For the wider tool landscape, see marketing intelligence tools. This page is the operational budget system those research workflows feed into.
TL;DR — Ad Budget Monitoring & Optimization in 2026
- Monitoring is the missing habit. Most teams set a budget and check it quarterly. The framework here is to monitor pacing and marginal ROAS weekly and reallocate monthly. Tracking is what turns budget from a static plan into a performance lever.
- Structure before optimization. Start with a 70-20-10 split (Core / Growth / Test) so you never end up 100% in decaying proven channels with zero testing reserve.
- Marginal ROAS, not average ROAS, drives reallocation. Average ROAS hides diminishing returns. Optimization means equalizing the return on your next dollar across channels.
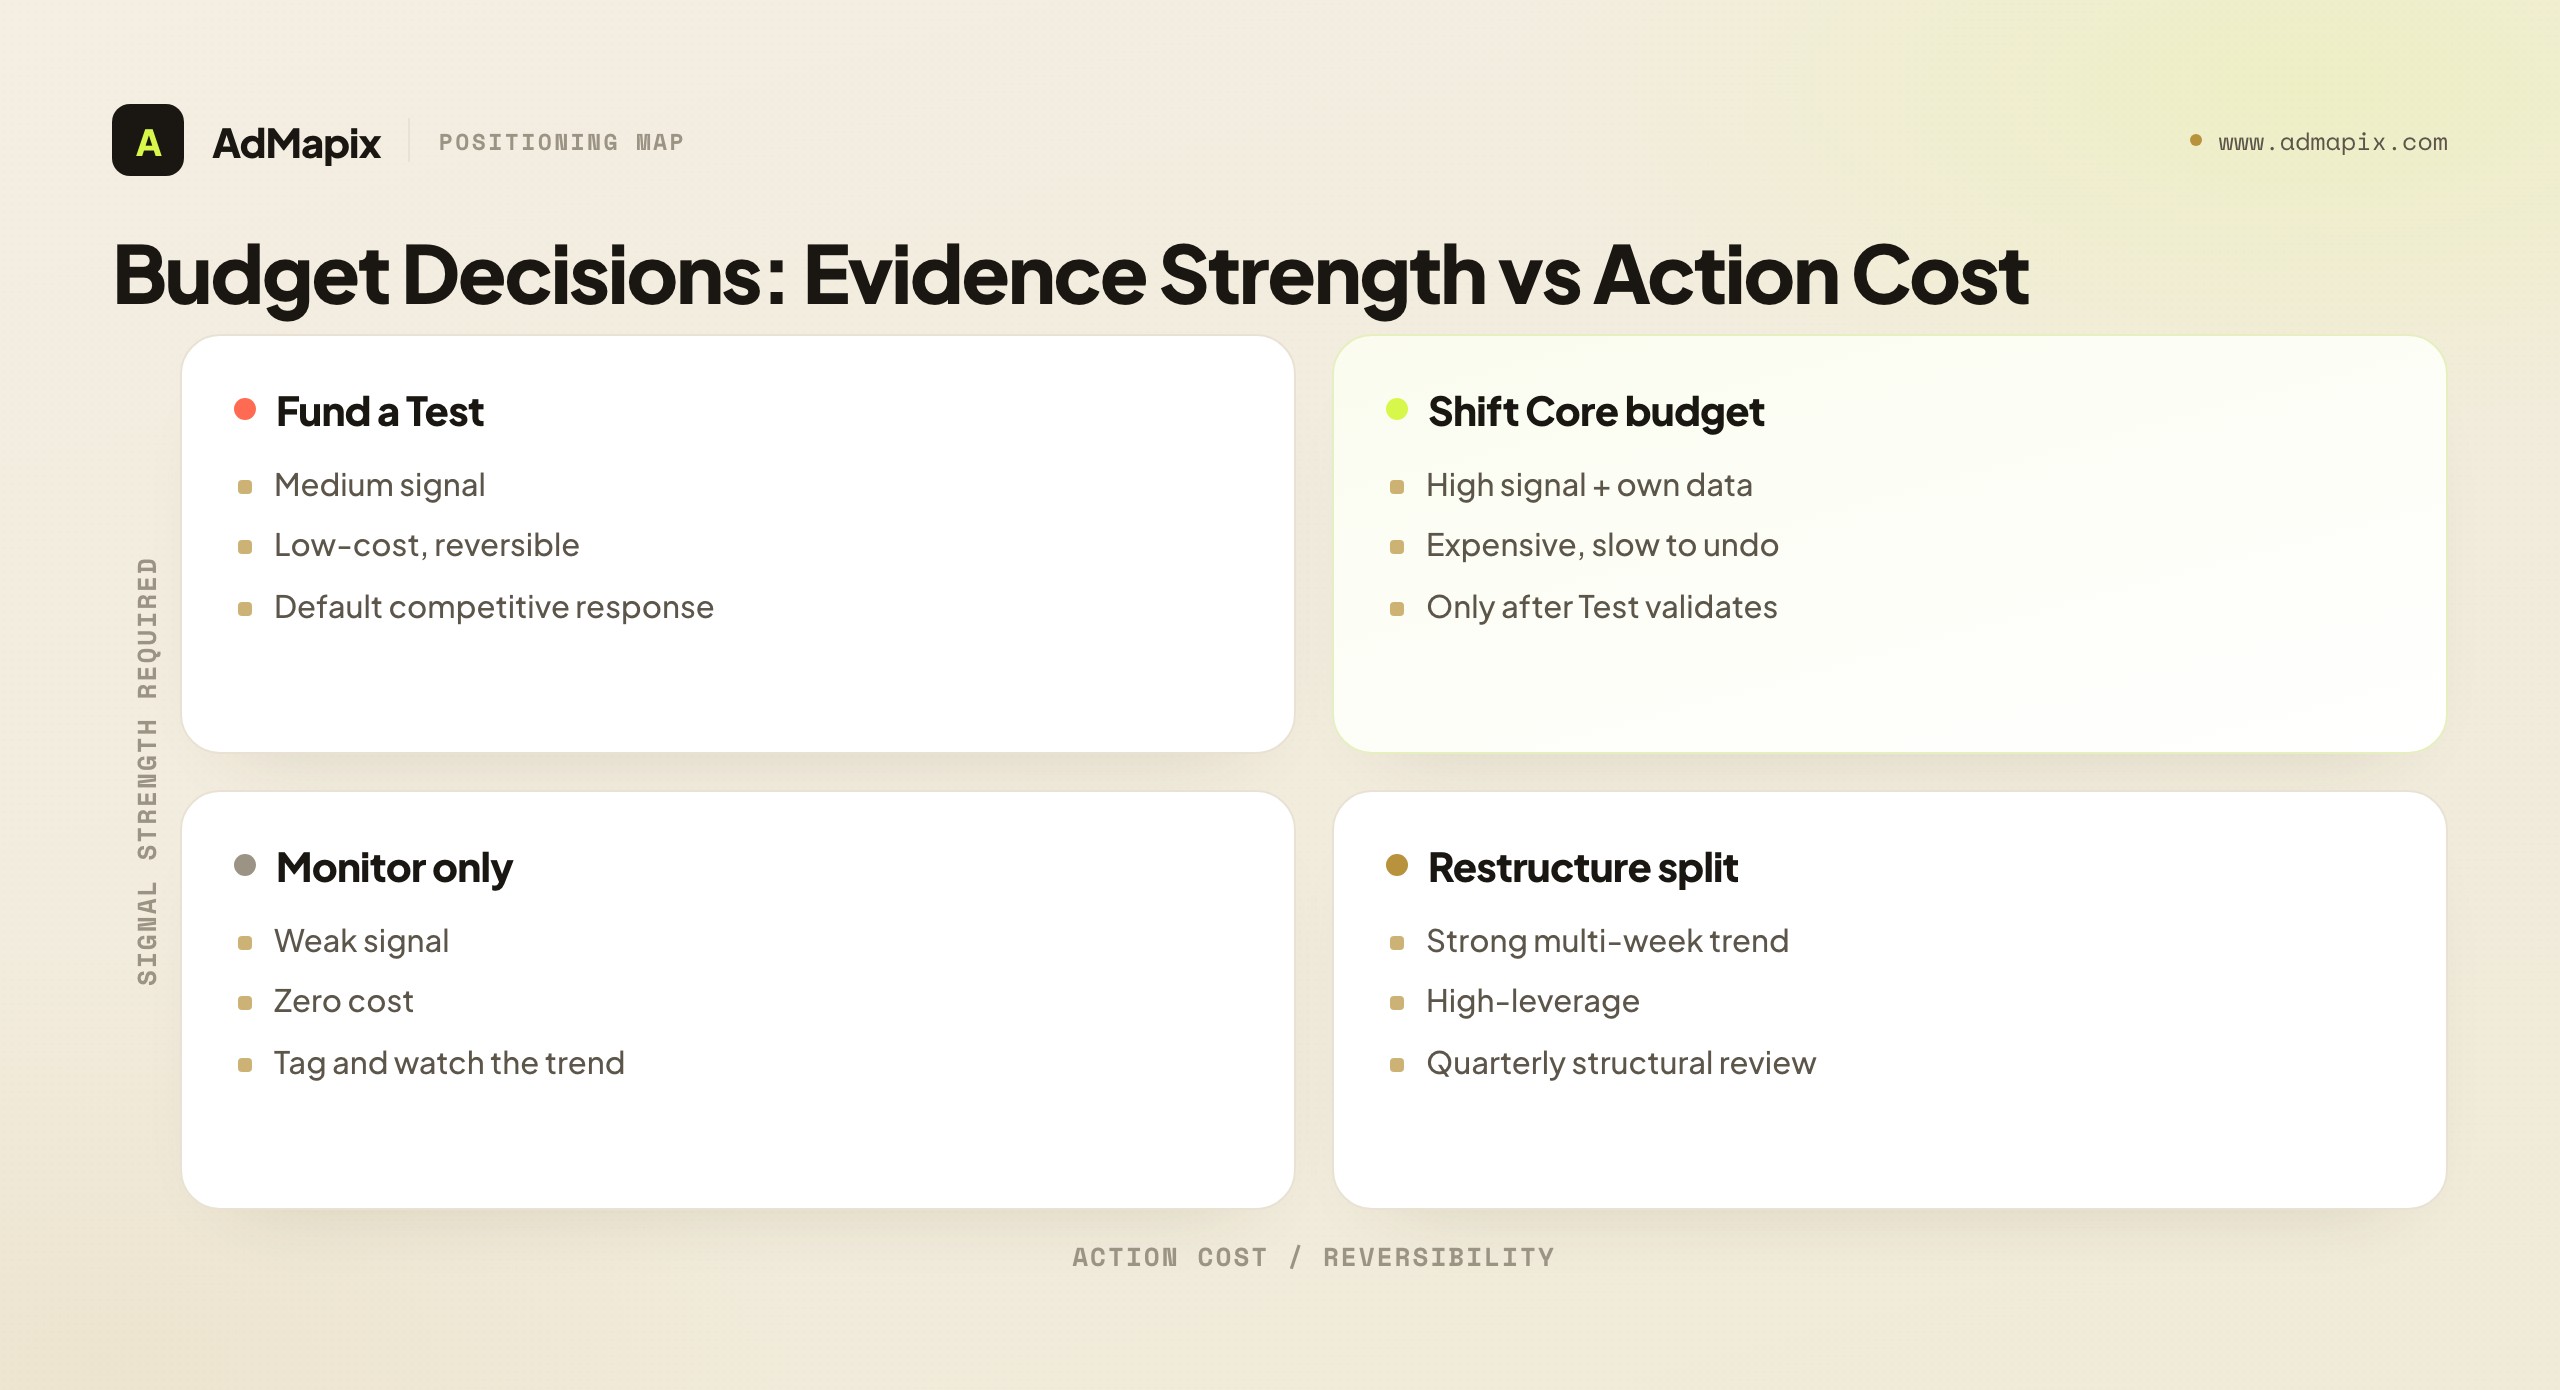
- Competitor ad budget is a signal you can partly observe — and must interpret, not chase. Rising Auction Insights overlap, new entrants, and cross-channel creative refreshes change your marginal ROAS even when you change nothing. Respond with a Test, not a reflexive Core budget increase.
- Pacing prevents the two classic failures: underspending (leaving cheap conversions on the table) and end-of-period dumps (buying low-quality volume to hit a number).
- The cadence is the system. Weekly monitoring, monthly reallocation, quarterly structural review. Daily reallocation is noise; annual is negligence.
Why Ad Budget Allocation Still Relies on Gut Feel
Ask most performance marketing teams how they decide budget splits across channels, and the honest answer is some version of "last year's split, adjusted a bit." Budget allocation is the highest-leverage decision in paid media — and the one most teams approach with the least rigor.
The reasons are understandable:
| Why it's hard | What it leads to |
|---|---|
| Cross-channel attribution is genuinely difficult | Teams trust platform-reported numbers that double-count |
| Platform-reported ROAS isn't comparable | Meta, Google, and TikTok each take credit differently |
| Competitive dynamics shift faster than planning cycles | Quarterly budgets are stale within weeks |
| Marginal returns are invisible without monitoring | Teams keep funding saturated channels past their efficient point |
| "It worked last year" feels safe | 100% of budget ends up in decaying core channels |
But there's a practical middle ground between "spreadsheet guesswork" and "enterprise marketing-mix modeling." This framework uses the data you already have — platform performance, competitive intelligence, marginal ROAS estimates, and pacing reports — to make better budget decisions every month. The unlock isn't a new model. It's a monitoring habit attached to a decision structure.
Monitoring vs Tracking vs Optimization: Get the Words Right
These three words get used interchangeably, and the sloppiness costs money. They are distinct activities with distinct cadences.
| Activity | What it means | Cadence | Output |
|---|---|---|---|
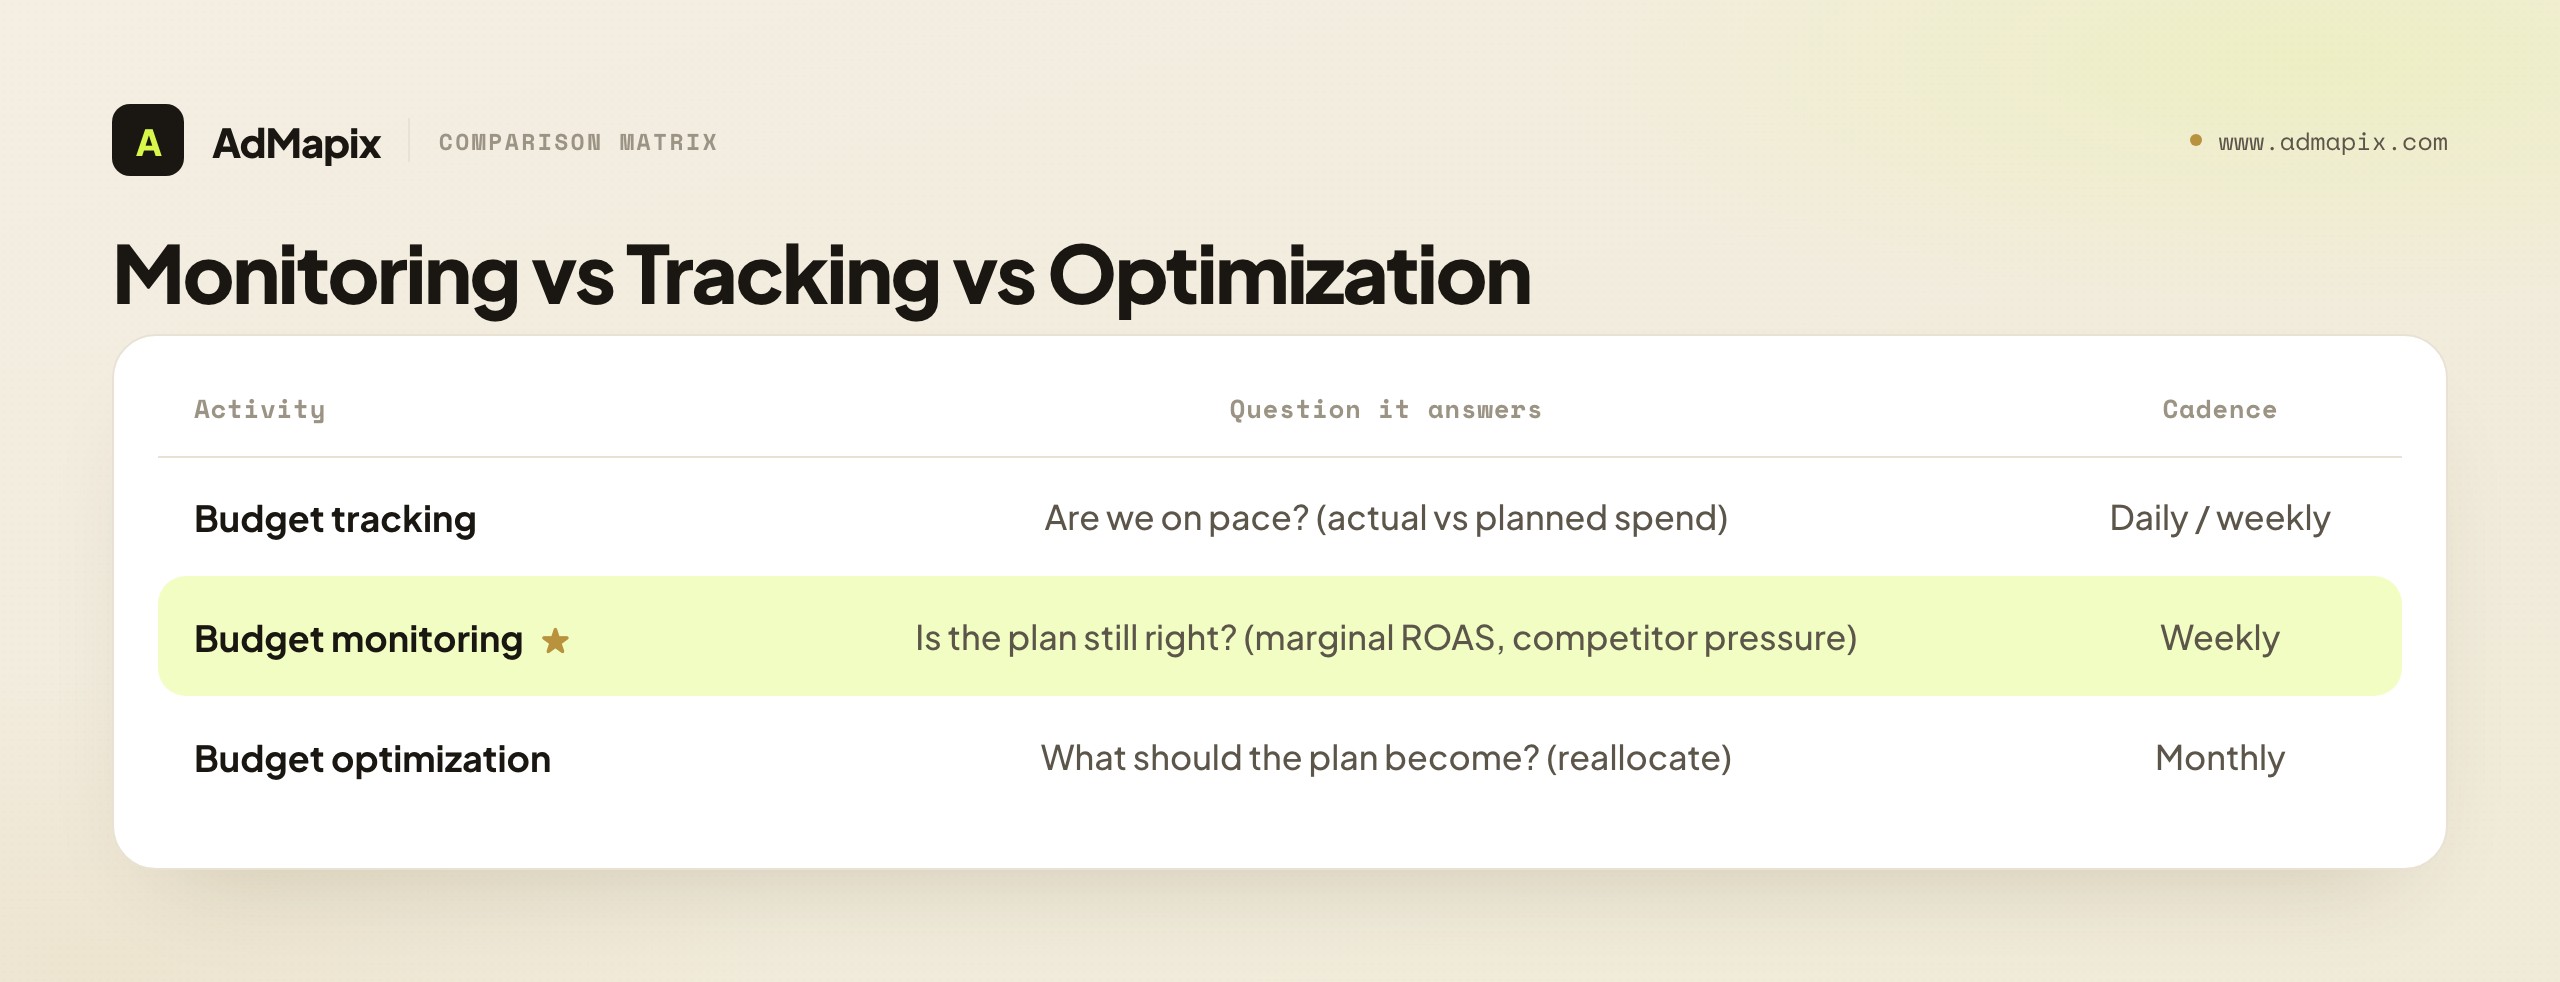
| Budget tracking | Is actual spend matching planned spend? (pacing) | Daily/weekly glance | Pace alerts: under, on, or over |
| Budget monitoring | Are the signals that justify the allocation still true? (marginal ROAS, competitor pressure, CPM) | Weekly | Confidence in the current split |
| Budget optimization | Reallocating dollars to equalize marginal ROAS and refresh the test reserve | Monthly | A new, justified budget split |
Tracking answers "are we on pace?" Monitoring answers "is the plan still right?" Optimization answers "what should the plan become?" You need all three, in that order. Optimizing without monitoring is reallocating on stale assumptions; monitoring without tracking means you discover an overspend after the money is gone.
The 70-20-10 Budget Architecture
Start with a structural budget split before optimizing within each bucket. This is a common venture-backed startup framework adapted for performance marketing. The structure exists to guarantee one thing: that you never stop testing.
| Bucket | % of budget | What it funds | Decision cycle |
|---|---|---|---|
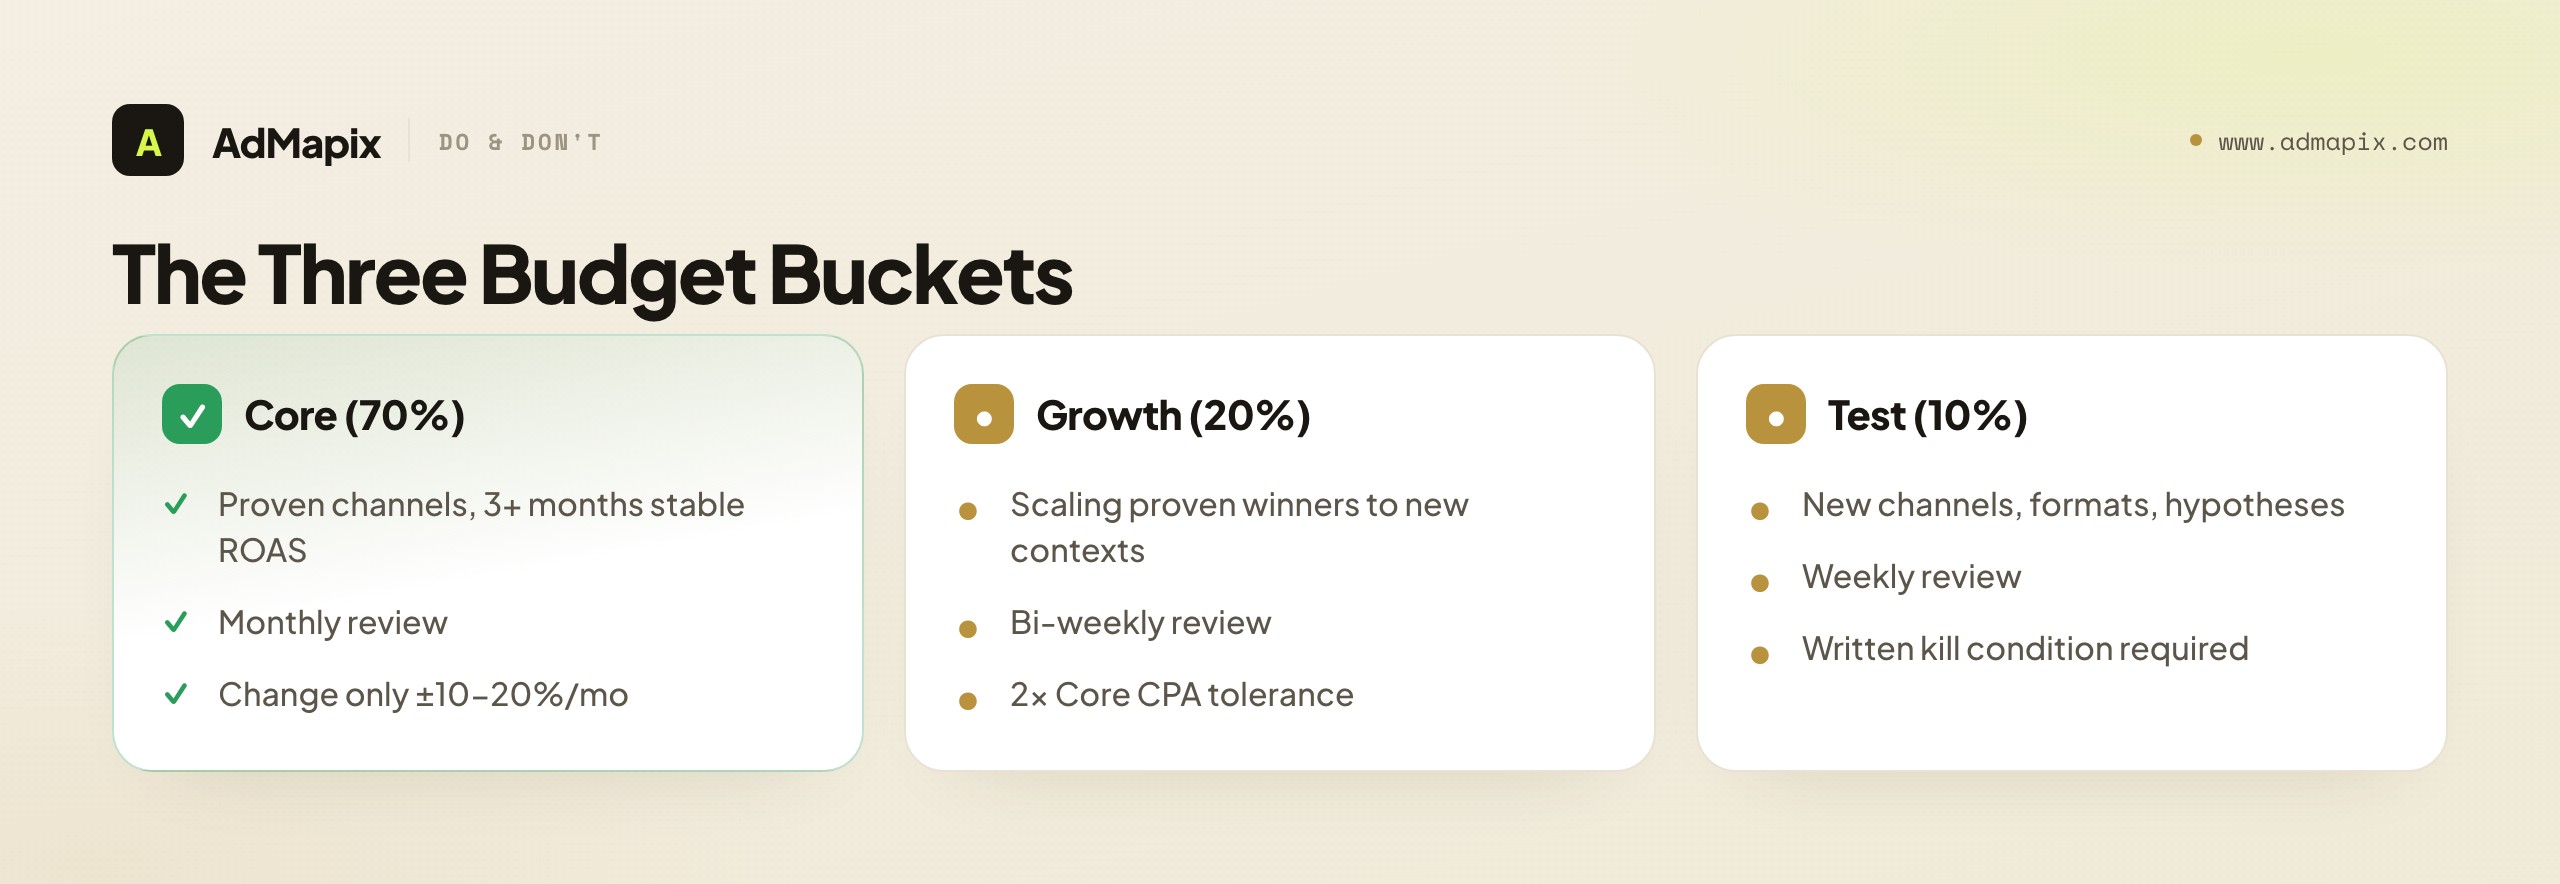
| Core (70%) | Proven channels and campaigns with consistent ROAS | Your top 2-3 channels that have delivered for 3+ months | Monthly review |
| Growth (20%) | Scaling proven channels to new audiences, regions, or formats | Existing channels × new angles (new creatives, geos, placements) | Bi-weekly review |
| Test (10%) | New channels, new formats, new audience hypotheses | Channels you haven't tested, format experiments, platform bets | Weekly review |
The percentages aren't rigid, but the structure is. Without a testing reserve, your budget becomes 100% core — and core performance decays over time as audiences saturate and competitors enter. The 10% test reserve is not optional spend; it is the R&D that keeps the other 90% from slowly dying.
Core bucket rules:
- Only channels with 3+ months of stable ROAS belong here.
- If a channel's ROAS drops below target for 3 consecutive weeks, move the delta to Growth.
- Core budget changes are incremental — ±10-20% per month maximum. Core is where stability lives; you don't yank it around on a single bad week.
Growth bucket rules:
- Fund scaling of what's working: if a Test campaign hits target ROAS for 2+ weeks, promote it to Growth.
- Growth campaigns get 2× the CPA tolerance of Core — you're paying for learning, not just conversions.
- Failure doesn't kill a Growth campaign immediately. Reduce budget 50% first; kill only if ROAS doesn't recover in 2 weeks.
Test bucket rules:
- Every test needs a written hypothesis, a success metric, and a kill condition before launch.
- No single test gets more than 20% of the Test bucket.
- Tests that fail their kill condition stop immediately — no "let's give it more time."
- Tests that work get promoted to Growth within 48 hours.
Adjusting the split for team maturity and goal
The 70-20-10 default fits a mature team in steady-state. Adjust it to your situation:
| Situation | Suggested split | Why |
|---|---|---|
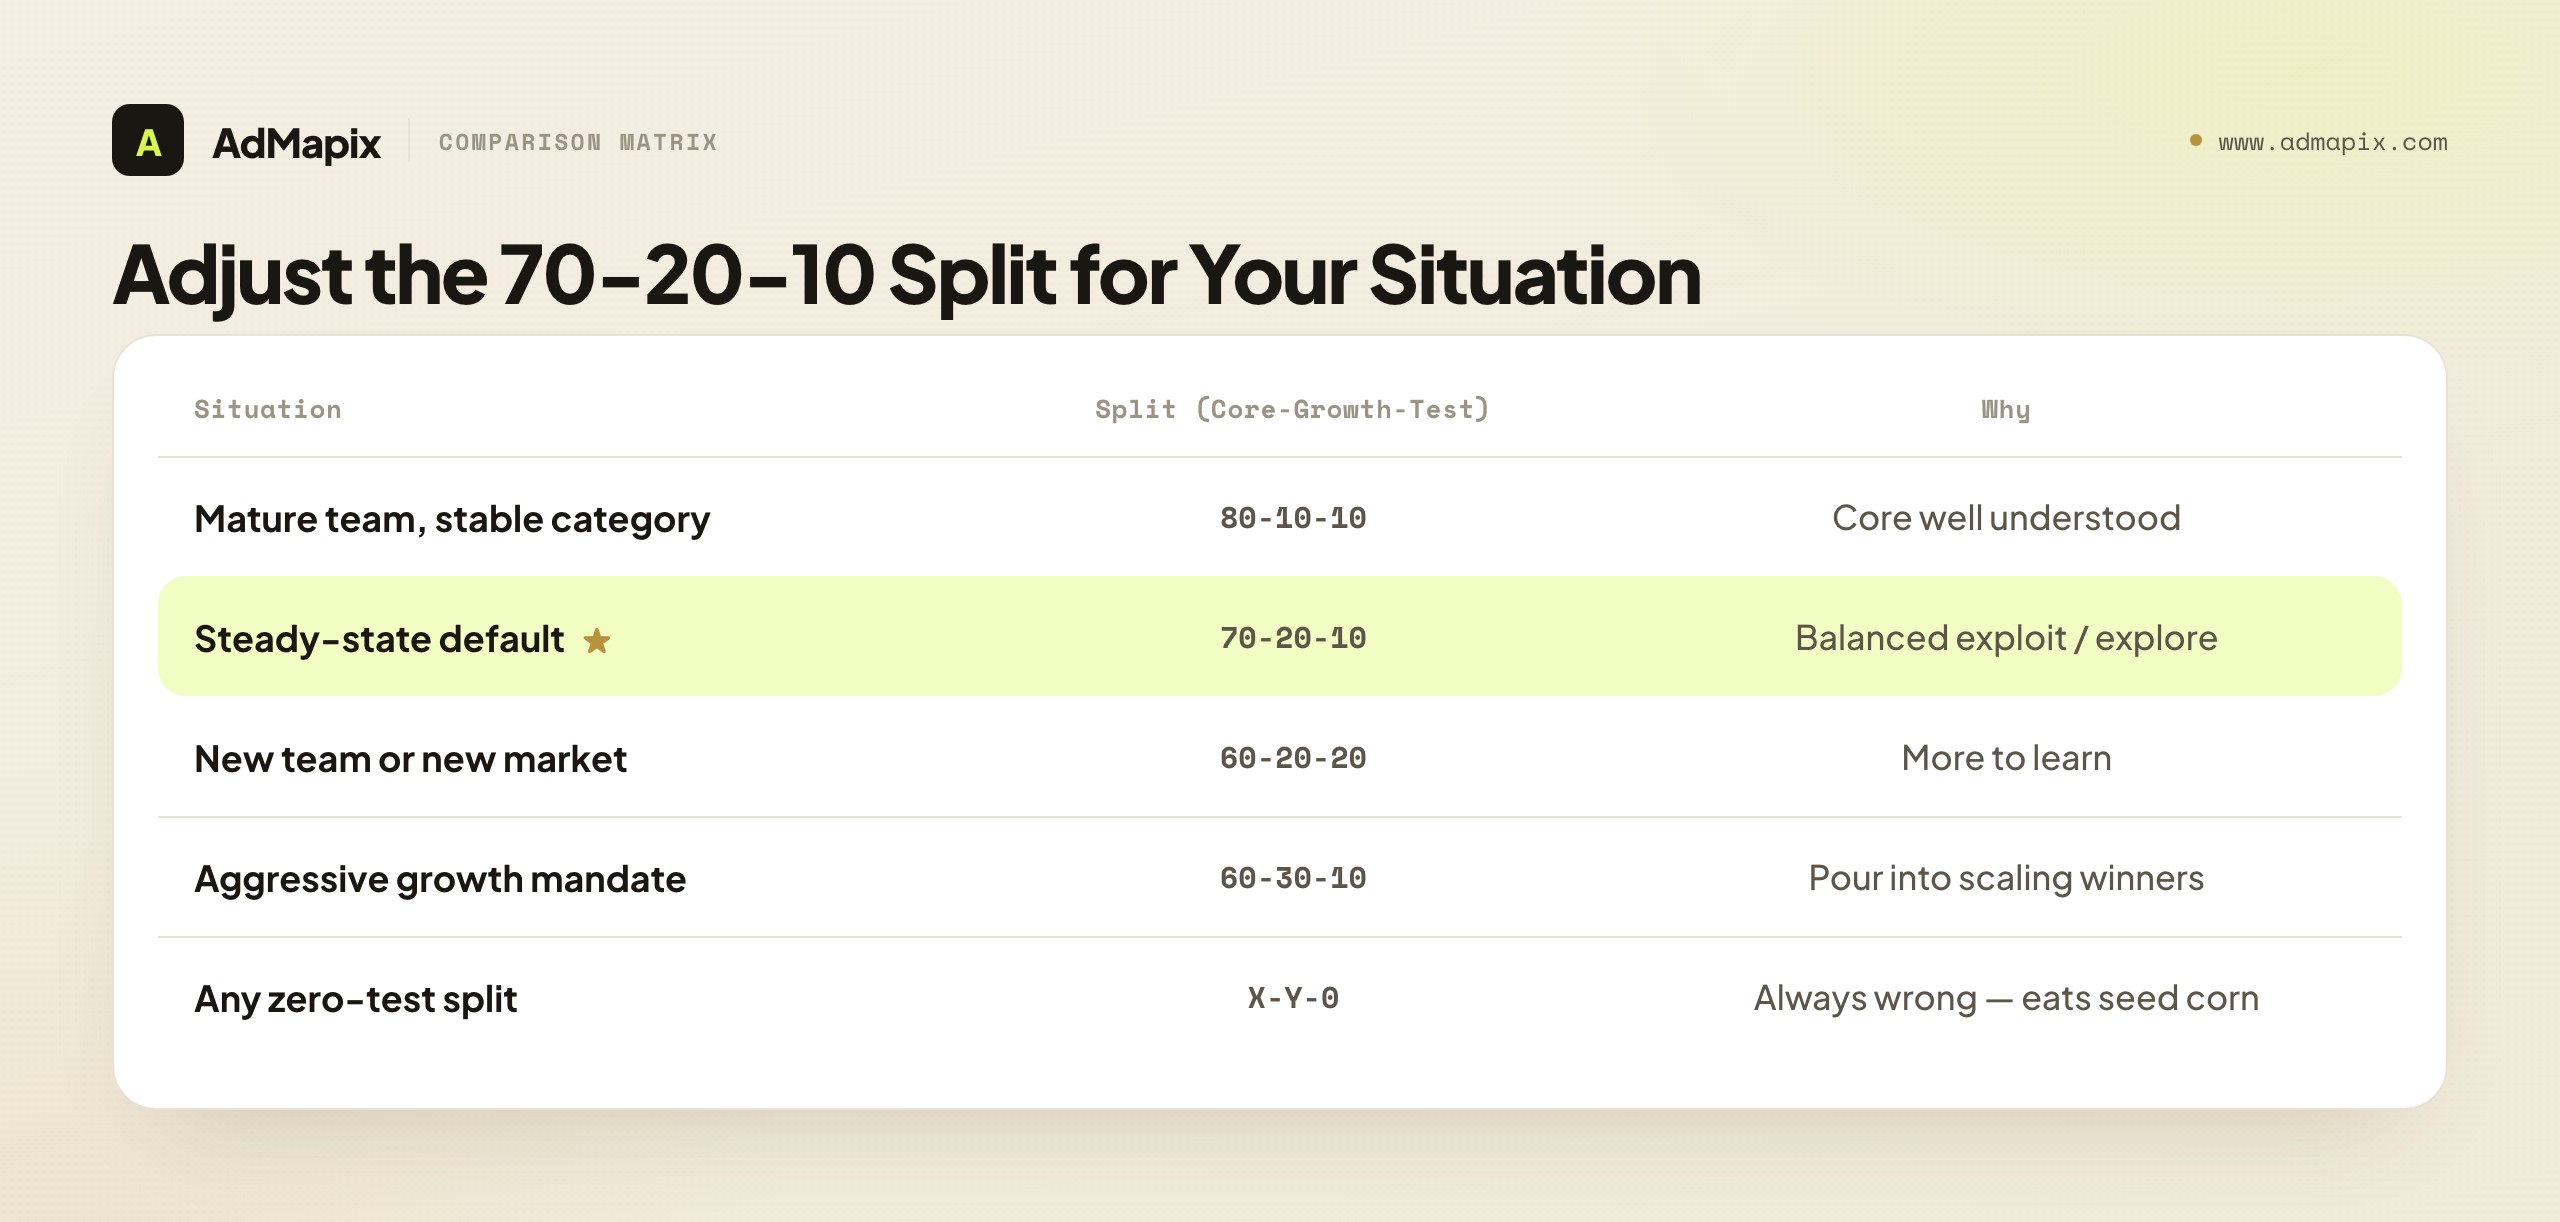
| Mature team, stable category | 80-10-10 | Core is well-understood; less to discover |
| Steady-state default | 70-20-10 | Balanced exploit/explore |
| New team or new market | 60-20-20 | More to learn; bigger test reserve |
| Aggressive growth mandate | 60-30-10 | Pour into scaling proven winners |
| Efficiency / profitability mandate | 80-15-5 | Protect proven ROAS, minimize risk |
The one split that is always wrong is X-Y-0 — any architecture with a zero test reserve. That is the budget equivalent of eating your seed corn.
Marginal ROAS: The Only Budget Metric That Matters
Average ROAS is a misleading metric for budget decisions. It blends your best-performing campaigns (which pull the average up) with your worst (which pull it down), and tells you nothing about what your next dollar will return. The right metric for budget allocation is marginal ROAS: the return on the next dollar you spend in a given channel or campaign at its current spend level.
How to estimate marginal ROAS without a data science team
You can approximate it from changes you've already made:
- Look at your last two budget changes for a channel (e.g., increasing Meta from $10K to $15K).
- Calculate
(change in revenue) / (change in spend)for that increment. - That's your approximate marginal ROAS for that channel at that spend level.
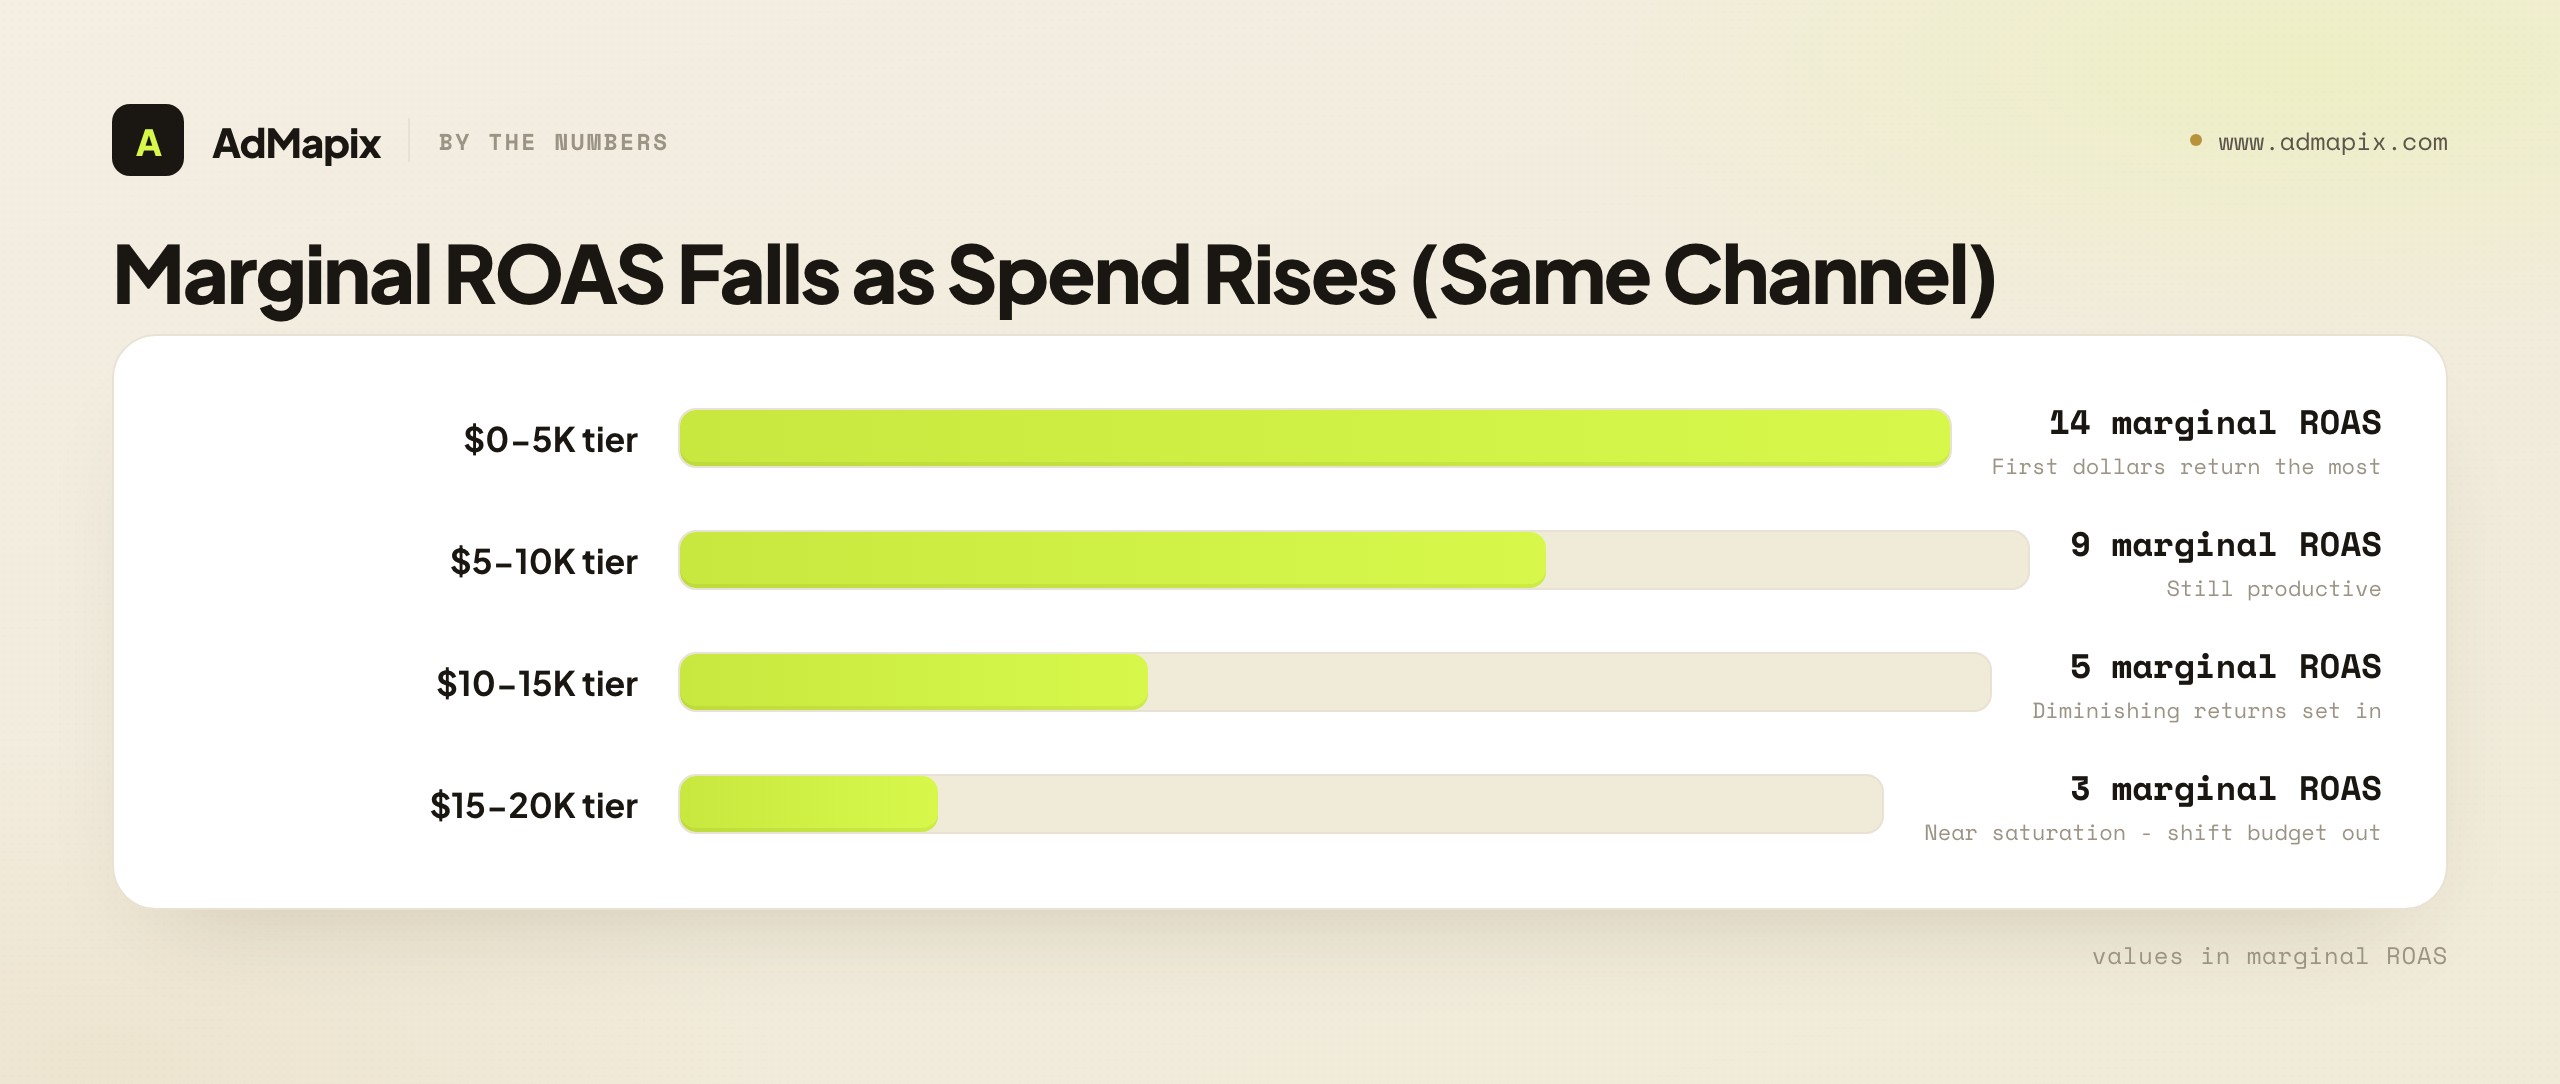
If increasing Meta from $10K to $15K generated $5K incremental revenue, marginal ROAS = 0.33. If increasing from $5K to $10K generated $12K incremental revenue, marginal ROAS = 1.4. Same channel, different spend levels, dramatically different marginal return.
The key insight: marginal ROAS almost always decreases as spend increases. Your first $5K in a channel generates higher returns than your next $5K, which beats the $5K after that. This is diminishing returns, and it is the single most important dynamic in budget optimization. Average ROAS hides it completely.
Budget optimization, stated precisely, is the work of equalizing marginal ROAS across channels — shifting dollars from channels where the next dollar returns little to channels where it returns more, until they converge or the high-return channel caps out on volume.
Decision rule: If Channel A's marginal ROAS is 0.8 and Channel B's is 1.4, shift budget from A to B until their marginal ROAS converges (or until B's volume caps out). Then re-measure. The point of convergence is your optimal allocation for this period — and it moves, which is why monitoring is continuous.
A worked marginal-ROAS reallocation
Suppose a team runs three channels and estimates marginal ROAS at current spend:
| Channel | Current monthly spend | Estimated marginal ROAS | Read |
|---|---|---|---|
| Google Search | $40K | 1.6 | Underfunded — next dollar still highly productive |
| Meta | $35K | 0.9 | Near saturation at this level |
| TikTok | $15K | 1.3 | Room to grow |
The optimization is obvious once you see the marginal numbers: shift budget out of Meta (0.9) and into Google Search (1.6) and TikTok (1.3). The team moves $8K from Meta to Google and $4K from Meta to TikTok, then re-measures next month. Average ROAS would never have surfaced this — Meta's average might look fine while its marginal dollar is barely breaking even.
Budget Pacing and Tracking
Optimization decides where money should go. Pacing and tracking make sure it actually goes there at the right speed. Two failure modes dominate, and both are invisible without tracking.
| Failure mode | What it looks like | Cost |
|---|---|---|
| Underpacing | Spend running 20%+ below plan mid-period | Cheap conversions left on the table; algorithms under-fed |
| End-of-period dump | Rushing to spend the remaining budget in the last days | Low-quality, expensive volume bought just to "hit the number" |
The fix is a simple pacing check you run at least weekly: compare actual spend to date against planned spend to date (not against the full-period budget). A campaign that's 60% through the month should be ~60% through its budget. Material drift in either direction is a flag.
| Pacing status | Trigger | Action |
|---|---|---|
| On pace | Within ±10% of planned-to-date | No action |
| Underpacing | 10%+ below planned-to-date | Check delivery: bid caps, budget caps, narrow targeting, low Quality Score |
| Overpacing | 10%+ above planned-to-date | Check for runaway campaigns, CPM spikes, or a creative going viral (good or bad) |
Pacing also interacts with the algorithm. Modern automated campaigns (Performance Max, Advantage+) need stable, sufficient budgets to exit the learning phase. Yanking budget up and down daily keeps them perpetually re-learning and raises your effective CPA. Pace smoothly; reallocate on a cadence, not on a whim.
Competitor Ad Budget Signals
Marginal ROAS isn't only a function of your own spending — it's affected by what competitors do. When a competitor increases presence in your auction set, your marginal ROAS can drop even if you changed nothing. You cannot see a competitor's exact budget (that's private), but you can monitor strong directional signals of competitor ad spend and respond intelligently.
| Competitive signal | What it tells you | Budget implication |
|---|---|---|
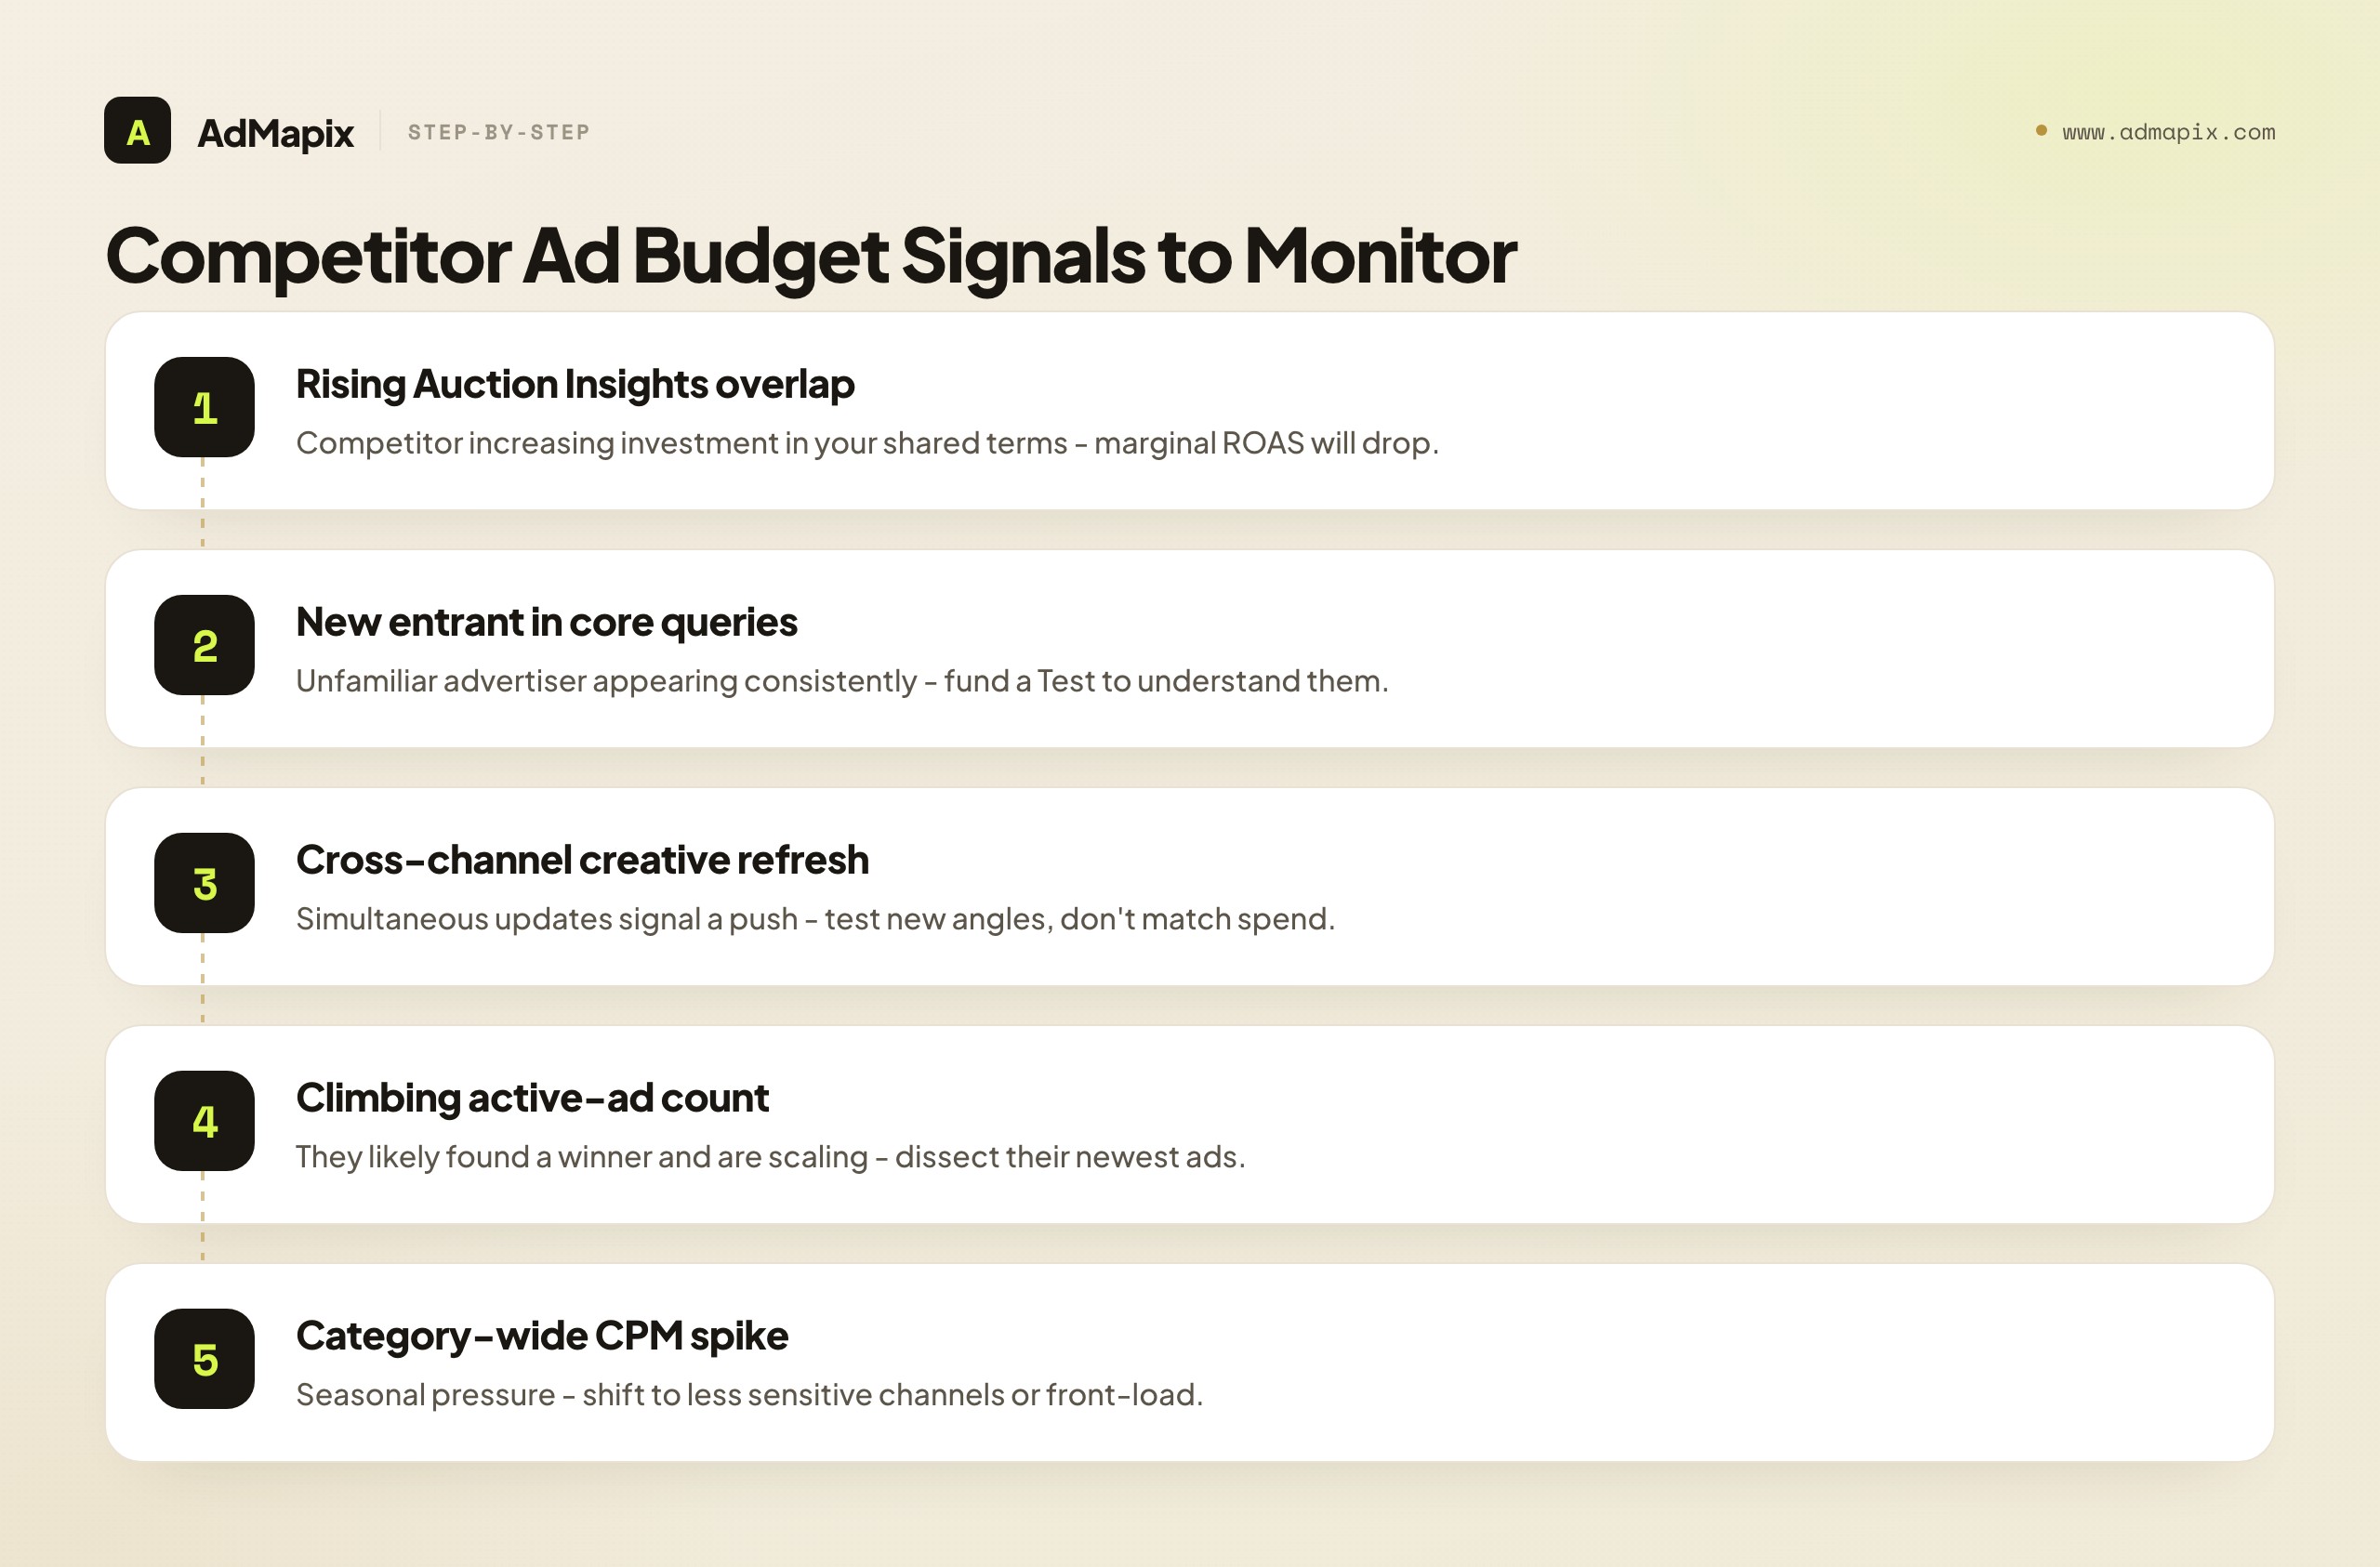
| Rising overlap rate in Auction Insights | A competitor is increasing investment in your shared keyword space | Marginal ROAS on those terms will likely drop. Options: defensive bids, shift to less contested terms, or test new angles |
| New competitor entering your core query set | An unfamiliar advertiser appearing consistently in Auction Insights | Allocate a Test budget to understand their positioning before touching Core |
| Competitor creative refresh across channels | A rival updates creatives on Meta, Google, and TikTok simultaneously | Usually a campaign push. Do not match spend — test new angles with existing budget first |
| Rising competitor active-ad count | A competitor's ad library count is climbing fast | They likely found a winner and are scaling. Dissect their newest creatives before reacting |
| Seasonal CPM spikes (category-wide) | CPMs rising across your category, not just your account | If CPMs are up 30%+, shift 10-15% to less seasonally-sensitive channels, or front-load before the peak |
The governing rule: don't change Core budget for competitive reasons alone. Competitive signals should trigger a Test, and only if the Test validates the move should Core budget shift. Chasing a competitor's spend increase dollar-for-dollar is how budget wars start — and the advertiser with worse unit economics loses them.
To monitor competitor ad budget signals systematically rather than by manual tab-hopping, you need a competitive intelligence layer. This is exactly where paid ads competitor research connects to budget: the research surfaces the signals, and this framework decides what to do with them. Tools like AdMapix reports consolidate competitor creative and activity across networks so the signals reach you before your marginal ROAS quietly erodes.
The Weekly Budget Monitoring Dashboard
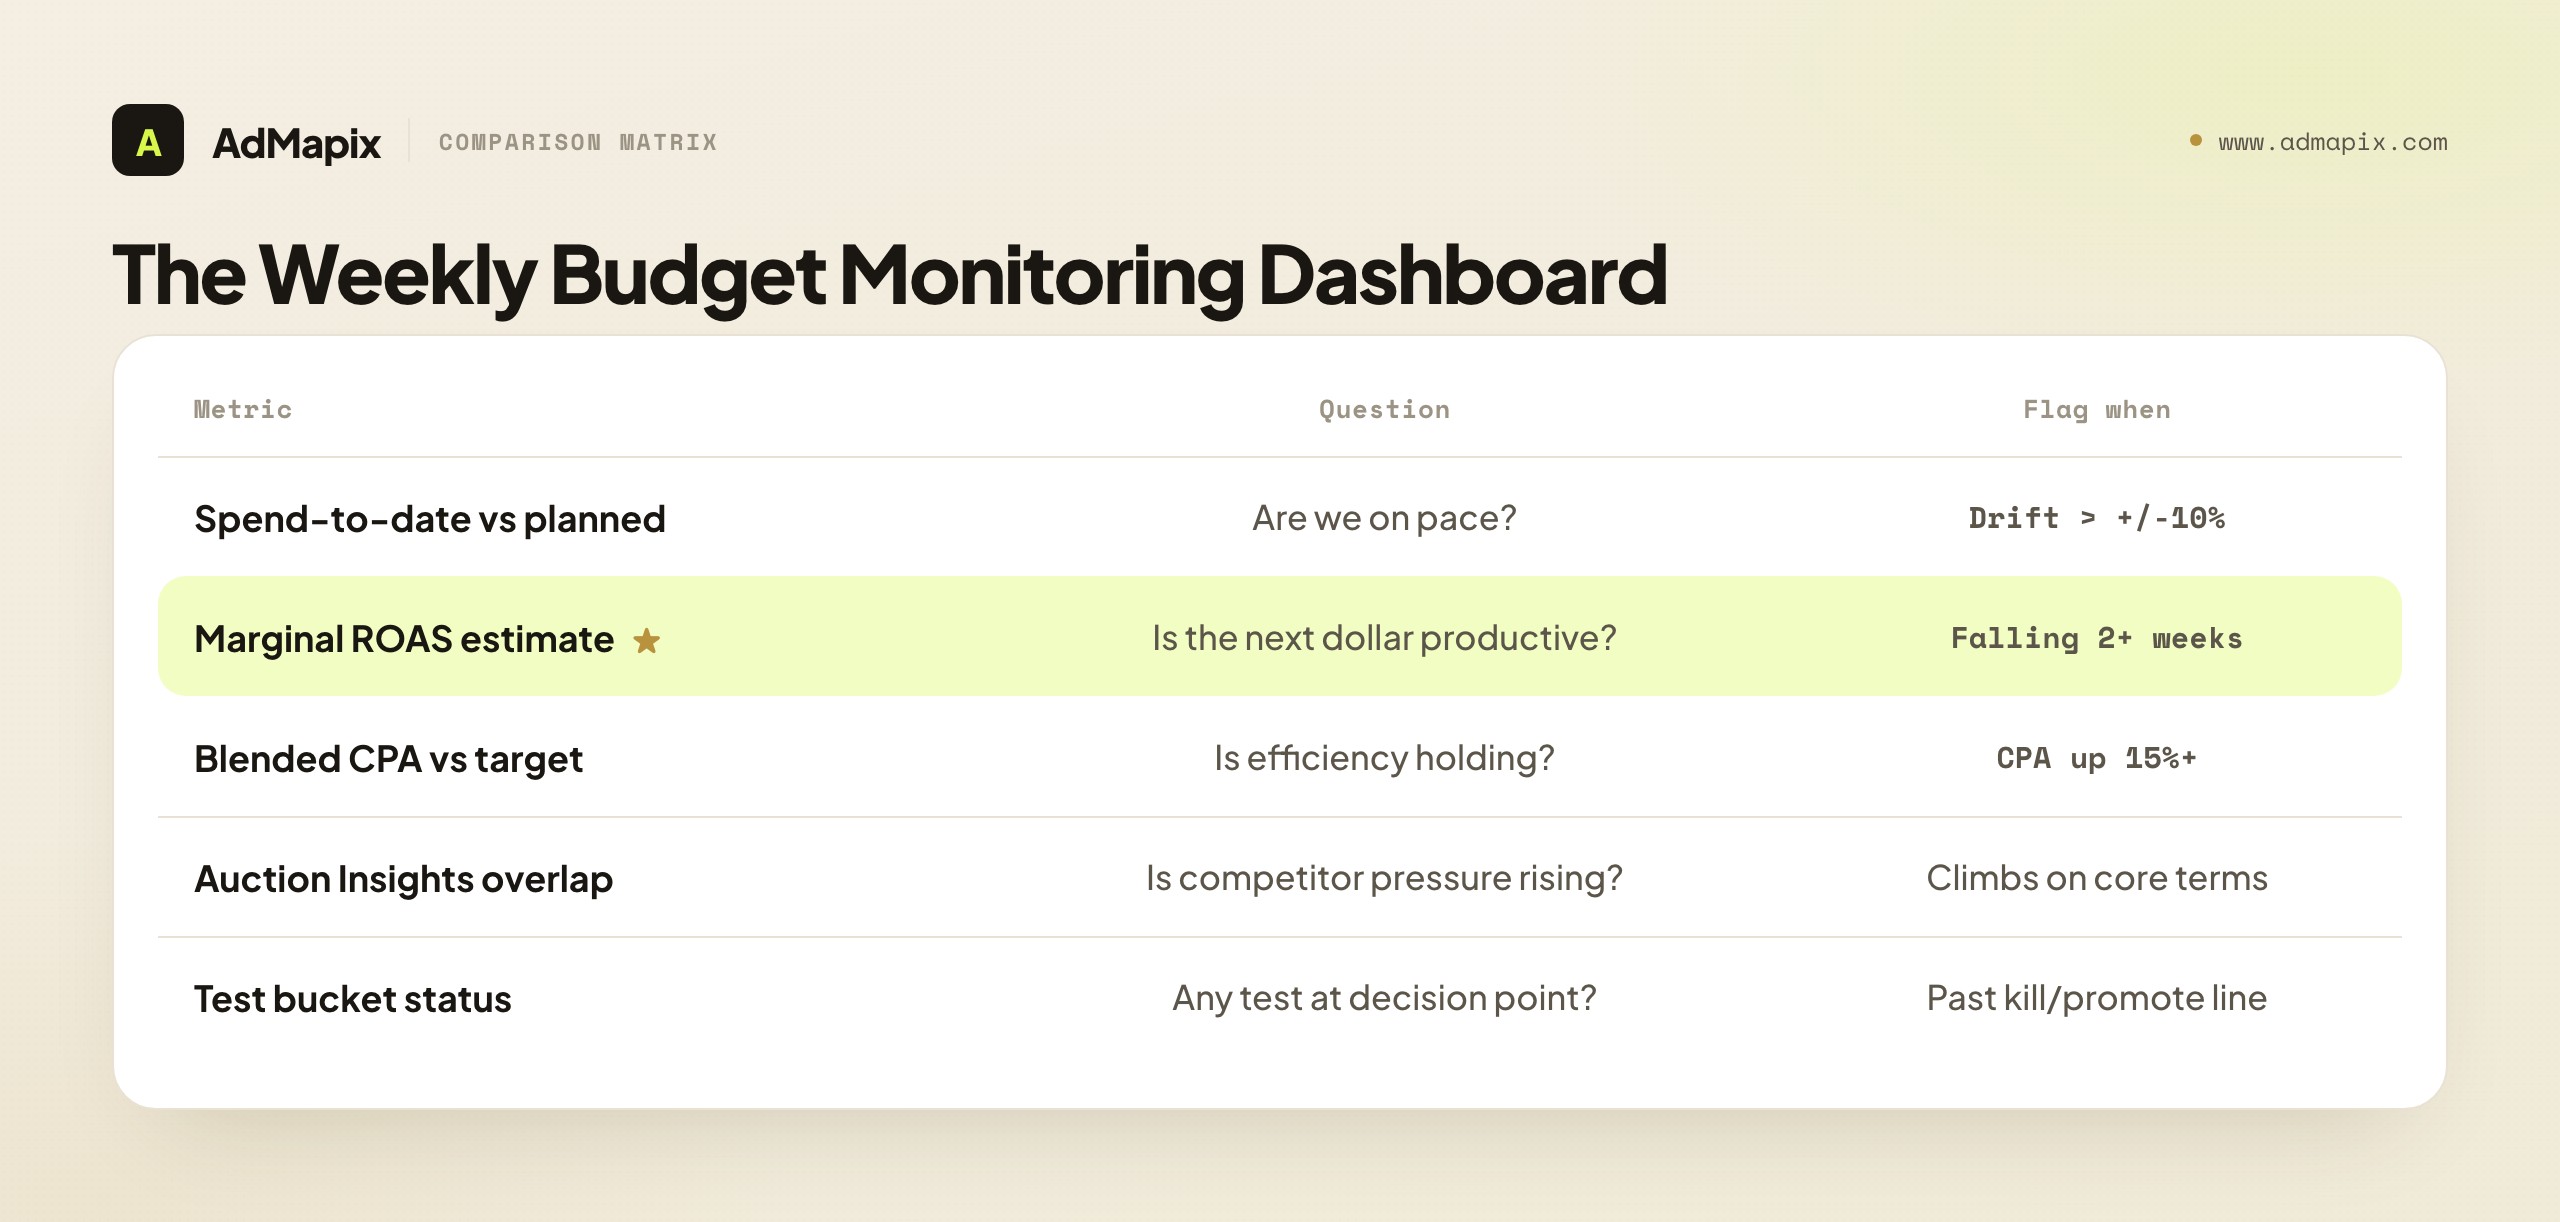
Monitoring only works if it's lightweight enough to actually do every week. You do not need a custom BI build — you need a single view that answers five questions in under fifteen minutes. Track these by channel, refreshed weekly:
| Metric | Question it answers | Flag when |
|---|---|---|
| Spend-to-date vs planned-to-date | Are we on pace? | Drift > ±10% |
| Marginal ROAS estimate | Is the next dollar still productive here? | Below target or falling 2+ weeks |
| Blended CPA / target CPA | Is efficiency holding? | CPA up 15%+ |
| Auction Insights overlap | Is competitive pressure rising? | Overlap climbs on Core terms |
| Test bucket status | Are tests hitting kill/promote conditions? | Any test past its decision point |
The discipline is to look at trends, not single weeks. One bad week is noise; three weeks of falling marginal ROAS is a signal. The dashboard's job is not to trigger daily reactions — it's to surface the multi-week patterns that justify a monthly reallocation. Daily budget twiddling based on this dashboard is the opposite of the intent; it feeds algorithm instability and noise-based decisions.
A practical setup: one row per channel, one column per metric, color-coded green/amber/red against thresholds. Anything amber gets watched; anything red gets investigated and either explained or actioned at the monthly review. That's it. The value is in doing it consistently, not in building it elaborately.
The Monthly Budget Optimization Workflow
This is the engine of the whole framework: a repeatable four-week cycle that turns continuous monitoring into a disciplined monthly reallocation. Each week has one job.
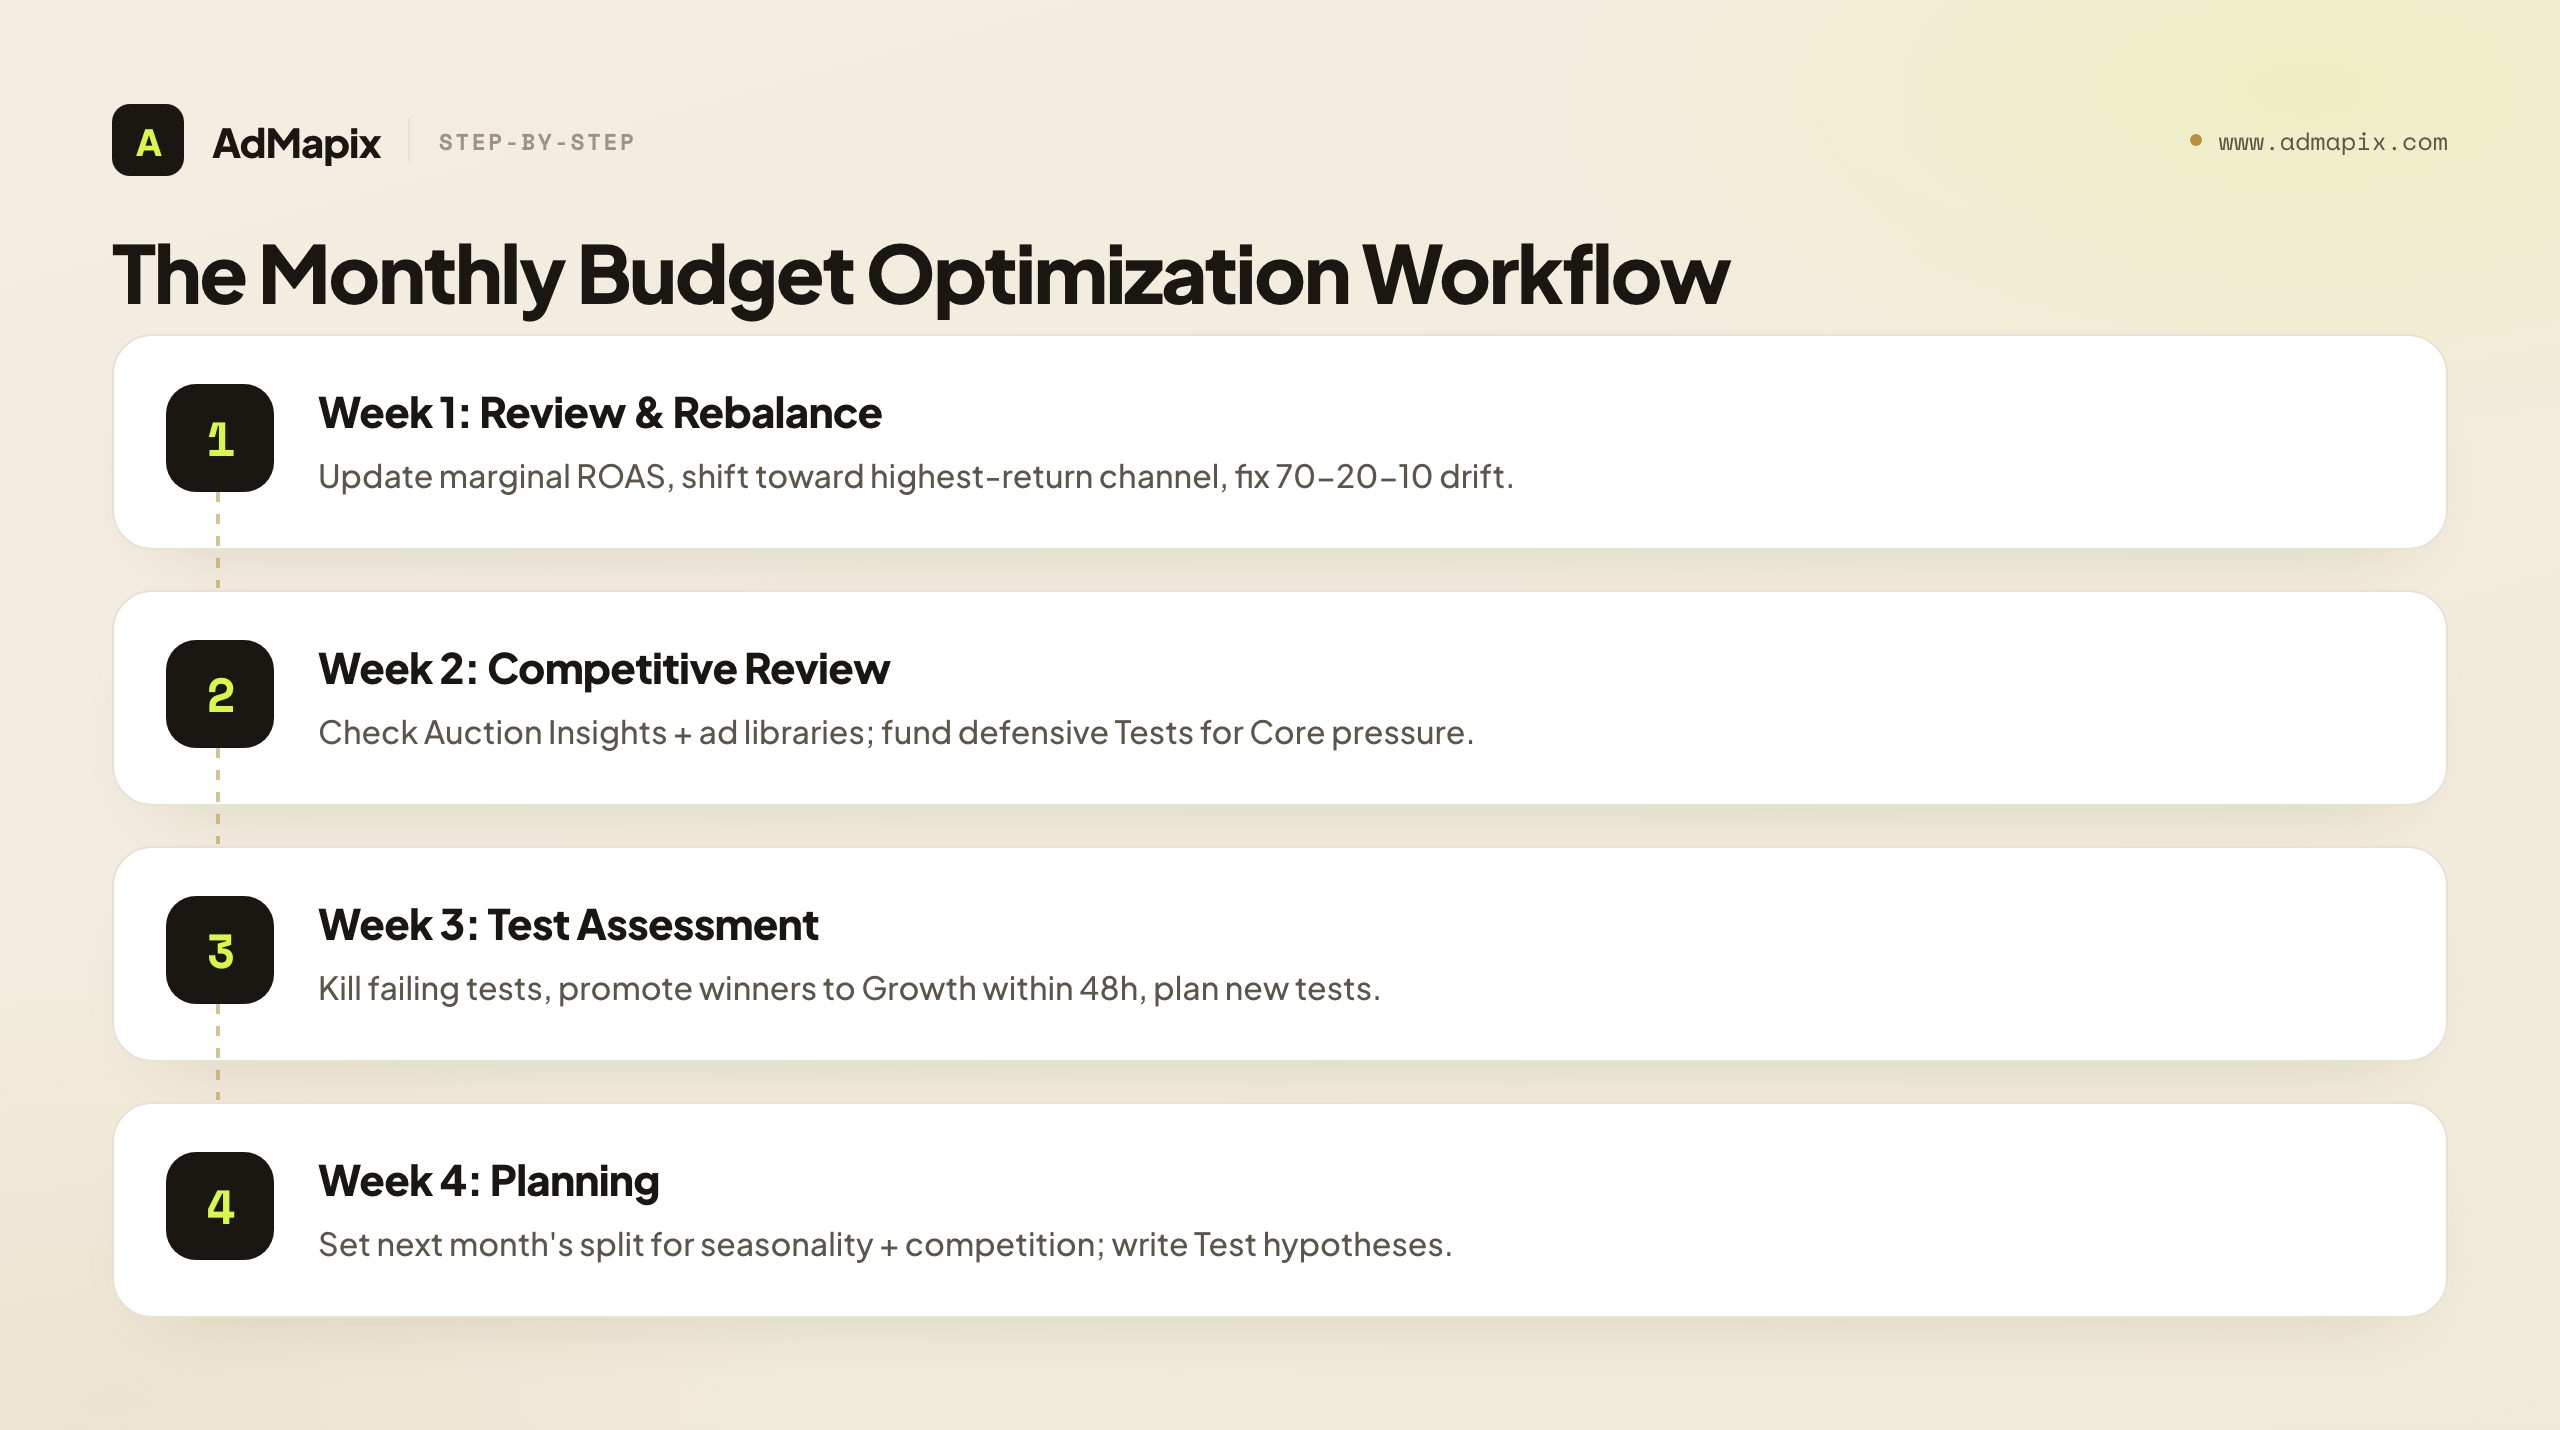
Week 1: Review & Rebalance
- Update marginal ROAS estimates for each channel using the last 4-6 weeks of spend and revenue data.
- Compare marginal ROAS across channels side by side.
- If one channel sits significantly below the others, propose a shift: reduce that channel's budget 10-20%, add it to the channel with the highest marginal ROAS (respecting volume caps).
- Audit the 70-20-10 split. Has Core quietly drifted to 85%? Shift back toward 70% by topping up Growth and Test. Core drift is the most common silent failure — testing reserves evaporate first.
Week 2: Competitive Review
- Pull Auction Insights, check the Google Ads Transparency Center, and review the Meta and TikTok ad libraries.
- Identify any competitor budget or strategy changes — overlap shifts, new entrants, creative refreshes, active-ad-count jumps.
- If competitive pressure is rising in a Core channel, fund a defensive Test (new creatives, new audiences, new angles) from the Test bucket. Do not raise Core budget yet — let the Test tell you whether the move is justified.
Week 3: Test Assessment
- Review every active Test campaign against its pre-written kill condition.
- Kill failing tests immediately — no extensions, no sunk-cost reasoning.
- Promote winning tests (target ROAS held 2+ weeks) to the Growth bucket within 48 hours.
- Plan next week's new tests, each with a written hypothesis, success metric, and kill condition.
Week 4: Planning
- Set next month's budget architecture.
- Adjust the Core/Growth/Test split for what's coming: upcoming seasonal CPM changes, competitive landscape shifts, and this month's test results.
- Write one hypothesis per open Test slot for next month so Week 1 starts with a loaded pipeline, not a blank page.
The cadence matters more than any single number. Monthly reallocation is slow enough to avoid noise and fast enough to catch competitive and seasonal shifts. Quarterly is too slow; daily is pure noise.
Mistakes That Wreck Budget Optimization
Most budget waste traces to a handful of repeatable errors. Audit your process against these before every monthly review.
Mistake 1: Optimizing on Average ROAS
The most common and most expensive error. Average ROAS hides diminishing returns and keeps you over-funding saturated channels. Always reallocate on marginal ROAS — the return on the next dollar, not the average of all dollars.
Mistake 2: Running a Zero Test Reserve
When pressure rises, the test budget is the first thing teams cut. It's also the worst thing to cut, because it's the only budget that finds your next winner. A 100%-core budget feels efficient and is slowly fatal. Protect the test reserve like payroll.
Mistake 3: Chasing Competitor Spend
Seeing a competitor scale up and immediately matching their budget is how you lose a bidding war on someone else's terms. Competitive signals trigger a Test, not a Core increase. The advertiser with worse unit economics loses every spend war — make sure that isn't you.
Mistake 4: Daily Reallocation
Twiddling budgets daily based on noisy data keeps automated campaigns perpetually re-learning, raises effective CPA, and substitutes activity for strategy. Monitor weekly, reallocate monthly. Stability is a feature, not laziness.
Mistake 5: Trusting Platform-Reported ROAS Across Channels
Every platform takes credit differently, so Meta's reported ROAS and Google's reported ROAS are not comparable. Use a consistent attribution lens (even an imperfect one applied uniformly) and lean on incrementality and your own first-party revenue data for cross-channel decisions.
Mistake 6: Ignoring Pacing Until Period-End
If you only look at budget at month-end, you'll discover underpacing too late to recover the cheap conversions, or you'll dump budget on low-quality volume to hit a number. Track pacing weekly against planned-to-date, not against the full-period total.
Mistake 7: Reallocating Without Monitoring the Signals
Shifting budget on last quarter's marginal ROAS, before checking whether competitive pressure or CPMs have changed, is reallocating on stale assumptions. Monitor first, then optimize. Order matters.
A Worked Example: One Month of Budget Optimization
Frameworks are easier to trust when you watch one run on a real budget. Here is a complete month for a fictional ecommerce brand — call it "Harbor Goods" — running $90,000/month across three channels. Follow how monitoring turns into a justified reallocation, and notice how often the disciplined answer is "test," not "shift Core."
Starting position. Harbor entered the month with a drifted split: Core had quietly crept to 84% of budget, Growth was 12%, and Test had shrunk to 4% — well below the 10% floor. Channel spend was Google Search $42K, Meta $36K, and TikTok $12K. The team's blended ROAS looked acceptable on the surface, which is exactly why nobody had questioned the allocation in two months. That complacency is the most common precondition for budget waste: things look fine in aggregate while the marginal dollar quietly rots.
Week 1 — Review & Rebalance. The team pulled the last six weeks of spend-and-revenue deltas and estimated marginal ROAS per channel. Google Search came in around 1.5 — its last budget bump had returned strongly, meaning it was underfunded. Meta came in around 0.85 — its last bump barely broke even, a clear saturation signal at $36K. TikTok came in around 1.25 with room to grow. The average-ROAS view had hidden all of this; Meta's average still looked healthy because its early dollars were efficient even though its marginal dollar was not. The team also flagged the Core drift to 84% and resolved to rebuild the Test reserve. Their proposed move: pull $6K out of Meta (low marginal return), send $4K to Google Search and $2K to TikTok, and top up the Test bucket back toward 10% from the savings of a paused underperforming Growth campaign.
Week 2 — Competitive Review. Before committing, they checked the competitive picture, because a marginal-ROAS shift made on stale competitive assumptions is a guess. In Auction Insights, a known rival's overlap rate on Harbor's top Google Search terms had climbed from 28% to 39%. That partly explained why Google Search, despite high marginal ROAS, was getting more expensive to win. The disciplined read: the competitor pressure justified a defensive Test (new ad angles and a tighter landing page on the contested terms) funded from the rebuilt Test bucket — not an automatic Core bid war. On Meta, the team noticed a competitor had refreshed creatives across Meta and TikTok simultaneously, a likely campaign push. Per the framework, they did not match spend; they queued a creative-angle Test instead.
Week 3 — Test Assessment. Two Test campaigns from the prior month hit their decision points. One — a new TikTok hook format — had held target ROAS for two weeks, so it was promoted to Growth within 48 hours and folded into the $2K TikTok increase. The other — an untested display channel — had blown past its kill condition with a 0.4 ROAS, so it was killed immediately with no "give it more time" debate. The defensive Test on the contested Google terms was launched with a written hypothesis ("a switching-cost-led landing page will hold conversion rate against the rival's pressure") and a two-week kill condition.
Week 4 — Planning. With the new marginal-ROAS picture, the competitive context, and the test results in hand, Harbor set next month's architecture: a corrected 72-18-10 split, Meta reduced to $30K, Google Search raised to $46K, TikTok raised to $14K, and a loaded Test pipeline with one written hypothesis per slot. The team also noted an upcoming seasonal CPM spike (covered next) and pre-decided to front-load a portion of Q4 budget before the peak rather than bid into it.
The month's lesson mirrors the whole framework: the average numbers said "everything's fine," while the marginal numbers said "you're over-funding a saturated channel and starving two productive ones." Monitoring surfaced the gap; the structure turned it into a justified, reversible set of moves; and the test reserve — nearly eliminated at the start — was rebuilt before it cost Harbor its next winner.
Budget Decision Playbook: Common Scenarios
Most budget decisions are variations on a handful of recurring situations. Here is how the framework resolves the ones that come up almost every month, so you're applying rules rather than improvising under pressure.
"A core channel's ROAS dropped this week." One week is noise. Check pacing first (did a CPM spike or a creative going stale inflate cost?), then look at the trend. If marginal ROAS has fallen for one week, monitor. If it's fallen for three consecutive weeks, that channel has crossed the Core rule threshold — move the delta to Growth and investigate whether the cause is creative fatigue, audience saturation, or rising competitor pressure. Do not cut Core budget on a single bad week; that's how you destabilize a learning-phase campaign and make the problem worse.
"A competitor just tripled their active-ad count." This is a scaling signal, not a budget command. They likely found a winner. The right move is to dissect their newest creatives and fund a Test that adapts the underlying insight — not to match their spend. Matching a competitor's budget increase dollar-for-dollar cedes the initiative and starts a war on their terms. Let the Test tell you whether there's a real angle worth scaling into Growth.
"We have leftover budget with a week to go." Resist the end-of-period dump. Buying low-quality volume to hit a spend number is value destruction dressed up as diligence. Better options, in order: let it underspend and report the efficiency; redirect it to your highest-marginal-ROAS channel if that channel has volume headroom; or move it into the Test bucket to launch a hypothesis you'd otherwise have deferred. Spending money badly is worse than not spending it.
"Leadership wants to cut the budget 20%." Cut from the bottom of the marginal-ROAS stack, not across the board. An even 20% cut everywhere removes your most productive dollars alongside your least productive ones. Instead, rank every channel and campaign by marginal ROAS and remove spend from the lowest-return end until you hit the target. Protect the Test reserve unless the cut is severe — losing your pipeline of future winners is the hidden cost of panic cuts.
"Leadership wants to scale the budget 50%." Scale into marginal ROAS, not evenly. Pour the increase into the channels whose next dollar still returns well, and watch for the point where their marginal ROAS converges with the next channel down. A 50% budget increase dumped proportionally across all channels will drive your blended ROAS down, because you'll be funding the saturated tail. Increase the Test bucket too — bigger budgets need bigger pipelines to absorb growth productively.
"A test is borderline — close to but not quite hitting target." This is what the pre-written kill condition is for. If it didn't hit the condition, it failed; kill it without renegotiating the rules after the fact. The whole point of writing the success metric and kill condition before launch is to remove the sunk-cost emotion from this exact moment. A graveyard of "let's give it two more weeks" tests is where test budgets go to die.
The pattern across all of these: let the rules decide, and let marginal ROAS rank the dollars. The framework's value is precisely that it pre-commits you to disciplined responses before the pressure of the moment arrives.
Channel-Specific Budget Nuances
The framework is channel-agnostic, but each major platform has budget mechanics worth respecting. Ignoring them is how a sound allocation gets undermined by platform behavior.
Google Search and Performance Max
Search budget is the most marginal-ROAS-legible of all channels, because intent is explicit and Auction Insights gives you real account-side competitor signal. But two cautions apply. First, Performance Max blends Search, Shopping, Display, and YouTube inventory, which makes its reported ROAS less decomposable — treat PMax as one budget unit and judge it on incremental revenue, not its internal channel mix. Second, Search marginal ROAS is highly sensitive to competitor overlap; when a rival crowds your terms, the next dollar buys less, and the right first response is usually a Quality Score and landing-page audit, not a bid increase. Budget pacing on Search also matters less for the learning phase and more for not missing high-intent impressions during the hours and days your buyers actually search.
Meta (Advantage+ and manual)
Meta is where the learning-phase budget trap bites hardest. Advantage+ campaigns need stable, sufficient budgets to exit learning and optimize; volatile daily budget changes keep them perpetually re-learning and inflate CPA. This is the single biggest reason to reallocate Meta budget monthly and pace it smoothly rather than reacting to daily swings. Meta's marginal ROAS also saturates relatively predictably as you scale a winning audience-creative combination — when the next budget bump stops returning, the fix is usually a new creative angle (more top-of-funnel reach) rather than simply more budget into a fatigued ad set. Treat creative refresh as a budget-efficiency lever, not just a brand task.
TikTok
TikTok budget rewards creative volume more than almost any channel. Because hook fatigue is fast, a TikTok budget increase without a fresh creative pipeline often just accelerates fatigue and lowers marginal ROAS. Budget the channel with creative throughput in mind: a rising TikTok allocation should be matched by a rising rate of new hooks tested. TikTok's competitor signal is more about creative patterns (via the Creative Center) than auction overlap, so the competitive budget read here is "are rivals saturating an angle?" more than "are rivals outbidding me?"
Cross-channel reconciliation
The hardest budget problem is comparing marginal ROAS across channels when each platform reports conversions differently. The pragmatic answer is not a perfect attribution model — it's a single, consistent lens applied uniformly (for example, a unified last-click or a data-driven model in one analytics layer), plus periodic incrementality checks (geo holdouts or scaled-back tests) on your two largest channels. An imperfect lens applied consistently beats five platform-reported ROAS numbers that each flatter their own channel.
Seasonal Budget Planning
Seasonality breaks naive budget rules, because the same dollar buys wildly different value in a CPM trough versus a peak. The two patterns to plan around are demand seasonality (your buyers are more active) and cost seasonality (CPMs rise category-wide as every advertiser piles in — Q4 retail being the textbook case).
The core seasonal moves:
- Front-load before cost peaks. If CPMs reliably spike 30-50% in your peak window, a dollar spent two weeks before the peak often buys more conversions than a dollar spent during it. Pull some budget forward rather than bidding into the most expensive auctions of the year.
- Protect efficiency channels during spikes. When category CPMs surge, shift a slice of budget toward channels and placements with lower seasonal sensitivity (often Search intent over broad social reach, or less contested geos).
- Pre-decide the peak split. Set the seasonal architecture in the Week 4 planning step before the peak arrives. Scrambling to reallocate mid-peak means making high-stakes decisions in the noisiest, most expensive conditions.
- Don't confuse seasonal lift with channel improvement. A channel's ROAS rising in December is usually demand, not a permanent gain. When you measure marginal ROAS for reallocation, compare like-for-like periods so seasonal noise doesn't trick you into over-funding a channel that simply benefited from the calendar.
Seasonality is also a competitive-signal amplifier: everyone refreshes creative and raises budgets at once, so the monitoring dashboard's Auction Insights and CPM rows will light up. Read those as category-wide, not competitor-specific, and resist the urge to interpret a seasonal CPM spike as a single rival attacking you.
Communicating Budget Decisions to Leadership
A budget framework that lives only in the media buyer's head is fragile — the first time leadership questions a reallocation, an undocumented decision looks like a guess. The same monitoring discipline that improves your decisions also makes them defensible, and presenting them well is part of the job.
Three habits make budget decisions legible to non-specialists. First, anchor every reallocation to marginal ROAS, stated plainly: "we moved budget out of Meta because its next dollar was returning $0.85 while Google's was returning $1.50" is a sentence any executive understands, and it reframes the conversation from "why are you cutting Meta?" to "why would we keep funding the lower-return dollar?" Second, show the test reserve as insurance, not waste. Leadership often eyes the 10% Test bucket as cuttable; the counter is that it's the only budget that finds next year's Core channels, and the cost of a zero-test reserve is invisible until a proven channel decays and there's nothing in the pipeline to replace it. Third, separate the controllable from the competitive. When efficiency drops, the monitoring dashboard lets you say whether the cause is internal (a slipped Quality Score, creative fatigue) or external (a competitor scaling into your auctions, a seasonal CPM spike) — and that distinction changes what leadership should expect and fund.
The deeper point is that the cadence itself is the credibility. A team that reviews budget on a documented monthly rhythm, with a written rationale per shift and a tracked outcome per test, earns the latitude to make bolder reallocations — because the track record shows the discipline behind them. Budget authority is granted to teams that can show their work, and this framework is, more than anything, a way to always have the work to show.
How This Scales by Budget Size and Role
The framework is the same at every scale, but the depth and tooling change. Match the effort to the size of the budget.
| Budget size / role | What to prioritize | What to keep simple |
|---|---|---|
| < $10K/mo (solo / small DTC) | 70-20-10 by hand, weekly pacing glance, marginal ROAS on top 2 channels | Skip elaborate dashboards; a spreadsheet is fine |
| $10K-$100K/mo (in-house team) | Full weekly monitoring dashboard, monthly workflow, competitor signal review | One consistent attribution lens, not five models |
| $100K+/mo (scale / enterprise) | Incrementality testing, automated pacing alerts, formal marginal ROAS modeling | Don't over-engineer the test bucket rules |
| Agency (per client) | Repeatable monthly workflow as a deliverable, competitor monitoring per client | Standardize the dashboard across clients |
The through-line: the discipline is identical; only the instrumentation scales. A $5K/month founder and a $5M/month enterprise both win by monitoring marginal ROAS, protecting a test reserve, and reallocating on a cadence. The enterprise just automates what the founder does in a spreadsheet.
The 2026 Budget Monitoring Tool Stack
You can run this entire framework on free and first-party tools, and small teams should. As budget and competitor count grow, manual monitoring stops scaling. Here's how the stack layers up.
| Layer | Tools | When you need it |
|---|---|---|
| Pacing & performance | Native platform reporting (Google Ads, Meta, TikTok), a unified spreadsheet | Always — this is your ground truth |
| Cross-channel view | Looker Studio / a BI layer, or a unified ads dashboard | When 3+ channels make spreadsheets painful |
| Competitor budget signals | Google Ads Transparency Center, Meta Ad Library, Auction Insights | Always — these are the free competitive signals |
| Consolidated competitor intelligence | AdMapix and similar ad-intelligence platforms | When monitoring competitor activity across networks by hand costs more than the tool |
The free competitive surfaces are strong for spot-checks but have known limits: commercial ads vanish from libraries when they stop (no history), there's no cross-platform consolidation, and there are no performance signals beyond impressions ranges. A consolidation layer like AdMapix reports snapshots competitor creative so nothing is lost, normalizes multiple networks into one workspace, and surfaces activity changes — exactly the competitor ad budget signals this framework turns into Test decisions. See pricing for recurring-workflow tiers and best ad spy tools 2026 for side-by-side comparisons. If you run one or two channels with few competitors, the free surfaces are genuinely enough.
Optimizing Budget When Conversion Signal Is Incomplete
Every budget framework assumes you can measure what each channel returns. Since iOS 14.5, the GDPR enforcement wave, and the deprecation of third-party cookies, that assumption is shaky. Platform-reported conversions are increasingly modeled rather than observed, attribution windows disagree, and the same sale often gets claimed by two channels at once. Reallocating on numbers you only half-trust is how budgets drift toward whichever platform reports most aggressively — usually the one with the loosest attribution.
The fix is not to wait for perfect data; it is to widen the evidence you act on. Three adjustments keep the 70-20-10 framework honest under signal loss:
Anchor on incrementality, not last-click. Run a periodic geo holdout or a scaled-back spend test on your largest channel once a quarter. If pausing 20% of a channel's budget in matched regions barely moves revenue, that channel's reported ROAS is borrowing credit from organic or brand demand. Marginal ROAS measured this way survives attribution chaos because it compares outcomes, not click paths.
Trust blended efficiency as the tiebreaker. When per-channel numbers conflict, blended ROAS (total revenue ÷ total ad spend) and marginal cost per acquisition at the account level are harder to game. If channel dashboards say everything is profitable but blended efficiency is sliding, a channel is double-counting — protect the test reserve and investigate before scaling.
Lengthen the decision window. Signal loss adds noise to any single week. Reallocate on a trailing two-to-four-week view rather than reacting to a noisy seven days, and treat one unusually strong or weak week as a flag to watch, not a trigger to move money.
Competitor signals matter more, not less, in a low-signal environment: when your own conversion data is fuzzy, a rival's sustained spend on a query or creative is independent evidence that the segment is still paying out. That is exactly the kind of directional confirmation AdMapix reports consolidate when first-party measurement gets noisy.
FAQ
What is an ad budget optimization framework?
It's a structured system for deciding how to allocate paid media spend across channels, campaigns, and time periods based on performance data rather than historical precedent or intuition. This framework combines a structural split (70-20-10 Core/Growth/Test), marginal ROAS analysis, competitor ad budget signals, weekly pacing and monitoring, and a monthly reallocation cadence. The goal is to monitor which dollars work and continuously shift budget toward the most productive next dollar.
How do I monitor and track my ad budget effectively?
Run three distinct activities on three cadences: track pacing (actual vs planned spend-to-date) at least weekly; monitor the signals behind your allocation (marginal ROAS, competitor pressure, CPMs) weekly; and optimize (reallocate) monthly. Use a simple dashboard with one row per channel and columns for pace, marginal ROAS, CPA, Auction Insights overlap, and test status, color-coded against thresholds. The value is consistency, not complexity.
How do I split my ad budget across channels?
Use the 70-20-10 architecture as a starting point: 70% to proven channels with stable ROAS, 20% to scaling proven channels into new contexts, 10% to testing new channels and hypotheses. Adjust for maturity and goal — newer teams often need 60-20-20, mature teams 80-10-10, aggressive-growth mandates 60-30-10. The only architecture that's always wrong is any split with a zero test reserve.
What is marginal ROAS and why does it matter?
Marginal ROAS measures the return on the next dollar you spend in a channel, not the average return across all spending. It matters because average ROAS hides diminishing returns — your first dollars in a channel return more than your later ones. Optimization is the work of shifting budget from channels with low marginal ROAS to channels with higher marginal ROAS until they converge. Estimate it from your last two budget changes: (change in revenue) ÷ (change in spend).
How can I track or estimate a competitor's ad budget?
You cannot see a competitor's exact budget — it's private — but you can monitor strong directional signals: rising Auction Insights overlap rate, new advertisers entering your core query set, simultaneous cross-channel creative refreshes, and climbing active-ad counts in public ad libraries. Treat these as indicators of competitor spend direction, not precise figures, and respond with a Test budget rather than a reflexive Core increase.
How often should I reallocate ad budget?
Monthly for the Core/Growth split, weekly for Test bucket decisions and pacing checks, and quarterly for major structural changes like entering a new channel or region. Daily reallocation leads to noise-based decisions and keeps automated campaigns perpetually re-learning, which raises CPA. Annual reallocation misses competitive and seasonal shifts entirely. Monthly is the cadence that balances signal against stability.
How do competitive signals affect budget decisions?
Rising competitive pressure can reduce your marginal ROAS even if you haven't changed anything — a competitor crowding your auctions drives up CPMs and CPCs on shared terms. When competitive signals appear, fund a competitive-response Test from your Test budget before shifting Core budget. Differentiate creatively rather than chasing the competitor's spend increase, because the advertiser with worse unit economics loses spend wars.
What is budget pacing and why does it matter?
Pacing is whether your actual spend is tracking your planned spend over time. Underpacing leaves cheap conversions on the table and under-feeds the algorithms; end-of-period dumps buy low-quality, expensive volume just to hit a number. Check pacing weekly against planned-to-date (not the full-period budget) and keep spend smooth, because volatile budgets push automated campaigns back into the learning phase and raise effective CPA.
How does AdMapix support budget optimization?
AdMapix provides the competitive intelligence layer of budget optimization: tracking competitor ad presence across channels, surfacing creative pattern changes, and flagging when competitors increase activity. That competitive context is essential for interpreting marginal ROAS changes — when your efficiency drops, the signals tell you whether a competitor is the cause and whether to fund a Test. See reports or review pricing.
Related Reading
- Paid ads competitor research playbook — how to surface the competitor signals this framework consumes
- Competitor ad analysis framework — the broader strategic research framework
- Marketing intelligence tools — the wider tool landscape
- Best ad spy tools 2026 — side-by-side tool comparisons
- How to spy on competitors' ads in 2026 — tactical competitor monitoring
- Google Ads Transparency Center guide — the Google competitive-signal layer
- Paid user acquisition — channel-level UA strategy that feeds budget decisions
Authoritative Sources
- Google Ads Auction Insights documentation
- Google Ads Transparency Center
- Meta Ad Library
- Google Performance Max overview
- Meta Advantage+ shopping campaigns
Bottom Line
Ad budget optimization is a monthly discipline, not a quarterly panic. The framework is straightforward: structure your budget (70-20-10), measure marginal ROAS instead of average, monitor competitor and pacing signals weekly, and never run a zero test reserve. The instrumentation scales with your budget, but the discipline is identical from $5K to $5M a month.
The biggest budget mistake isn't spending on the wrong channel. It's spending 100% on what used to work and 0% on finding what will work next. Monitor continuously, reallocate on a cadence, protect the test reserve, and let marginal ROAS — not gut feel or competitor anxiety — decide where the next dollar goes.
When manual monitoring of competitor budget signals stops scaling, start with AdMapix reports to consolidate the competitive intelligence this framework runs on.
See what competitors are really running
Search 6M+ ad creatives, landing pages, and weekly spend across 200+ countries. No credit card, no commitment.
Related Articles
Ad Optimization Best Practices: The 2026 Performance Playbook
The definitive 2026 guide to ad optimization best practices — a high-output creative production system, statistically honest A/B testing, budget governance and pacing rules, the metrics that matter, structured account hygiene, an optimization cadence, and an FAQ that settles the hard questions performance teams keep arguing about.

Pathmatics Alternative in 2026: Ad Spend Intelligence vs. Creative Workflow
A complete 2026 buyer's guide to choosing a Pathmatics alternative — why teams look past Pathmatics (now Sensor Tower), what it actually measures, a layered comparison of spend-intelligence suites versus creative-workflow tools across coverage, data type, price, and fit, who should choose which, a practical migration plan, the honest limits of estimated spend, and where a lighter cross-network creative tool like AdMapix fits.

Moat Alternative in 2026: Ad Verification vs. Creative Intelligence
A complete 2026 buyer's guide to choosing a Moat alternative — why teams look past Oracle Moat, what Moat actually does (viewability, invalid traffic, brand safety), the critical split between the ad-verification layer and the creative-intelligence layer, a layered comparison across coverage and fit, who should choose which, a practical migration plan, the honest limits of public creative data, and where a creative-research tool like AdMapix fits.