
Rips by Triumph Ad Strategy in 2026: The Standing Start — 6 Billion Impressions From a Fleet With No Creative Older Than 134 Days
A creative-level teardown of Triumph Arcade's US user acquisition for Rips by Triumph, the only title in this teardown series ranking on both the US download chart and the revenue chart. Its top 30 ad entries account for 5.98 billion impressions in the 30 days to 2026-08-19, and not one was first seen before 2026-04-07. A single 47-second asset launched 2026-06-30 carries 63.0% of that total — 9.9 times the second-largest entry — and the account runs zero playables.
Triumph Arcade's Rips by Triumph is the only product in this teardown series that appears on both the US download chart and the US revenue chart. It sits at #65 on downloads (1,154,817, +1.77%) and #23 on revenue (+11.67%). Its top 30 US creatives account for 5,975,902,009 impressions.
Not one of those 30 creatives existed six months ago. The oldest was first observed on 2026-04-07 — 134 days before this pull. The single asset carrying 63.0% of all impressions was first seen on 2026-06-30 and has been running for 50 days.
That one creative delivers 9.9x the impressions of the second-largest entry in its own account, and it had full exposure to the measurement window — it was first seen twenty days before the window opened. Rips did not build to this position. It arrived at it from a standing start.
Executive summary (TL;DR)
- There is no back catalogue. All 30 measured creatives were first seen between 2026-04-07 and 2026-08-10. Mean age 52.2 days, median 49 days. The entire dual-chart position is being held by five months of output.
- One asset is 63% of everything. Creative #1 (47 seconds, first seen 2026-06-30) has delivered 3,762,917,412 impressions across 1,409,949 placements. The next 29 combined deliver 2.2 billion.
- Concentration is extreme even by this series' standards. One entry holds 63.0% of the fleet's 30-day impressions; the second holds 6.3%. A 9.9x gap between first and second is the widest in any account measured on this date.
- Zero playables. Not one of the 30 creatives carries a playable attachment — unique among the publishers measured in this series, where attachment rates run from 4/15 to 29/30.
- Shipping every 4.5 days. 30 assets in 134 days, with 12 launched in the last 30 days and 6 in the last 19.
- Retirement has just started. 27 of 30 were live on the pull date. The three that stopped — 2026-07-30, 2026-08-15 and 2026-08-15 — are all on the Android store record, and all three stopped within the last four weeks.
- The Android fleet is bigger but quieter. 17 of 30 creatives run under the Android package, but they deliver only 24.5% of impressions.
All figures are AdMapix third-party estimates for the United States, pulled 2026-08-19. Methodology at the end.
Where Rips by Triumph sits on the US charts
Two separate ranking pulls place the same product ID in two different places.
| Chart | Position | Value | Change | Publisher record |
|---|---|---|---|---|
| US downloads | #65 | 1,154,817 | +1.77% | Triumph Arcade |
| US revenue (estimated index) | #23 | 128,175,730 | +11.67% | Triumph Arcade |
Both rows resolve to iOS product ID 6751921248. That matters, because the download chart in this period is dominated by messaging apps, streaming services and AI assistants — Rips is one of a minority of games in the top 100 at all, and one of a much smaller minority appearing on the revenue chart as well.
For context on the revenue chart: MONOPOLY GO! sits at #29 with -6.53%, six places below Rips, and Scopely's title has been in market for years. Rips is above it and growing at +11.67%.
The revenue absolute values here are an index whose unit is not documented, so we use only the rank and the growth rate. The rank and the direction are the point: a product that most US media buyers had not heard of in March is now out-earning MONOPOLY GO!'s position on this chart, on the back of an ad fleet that did not exist in March either.
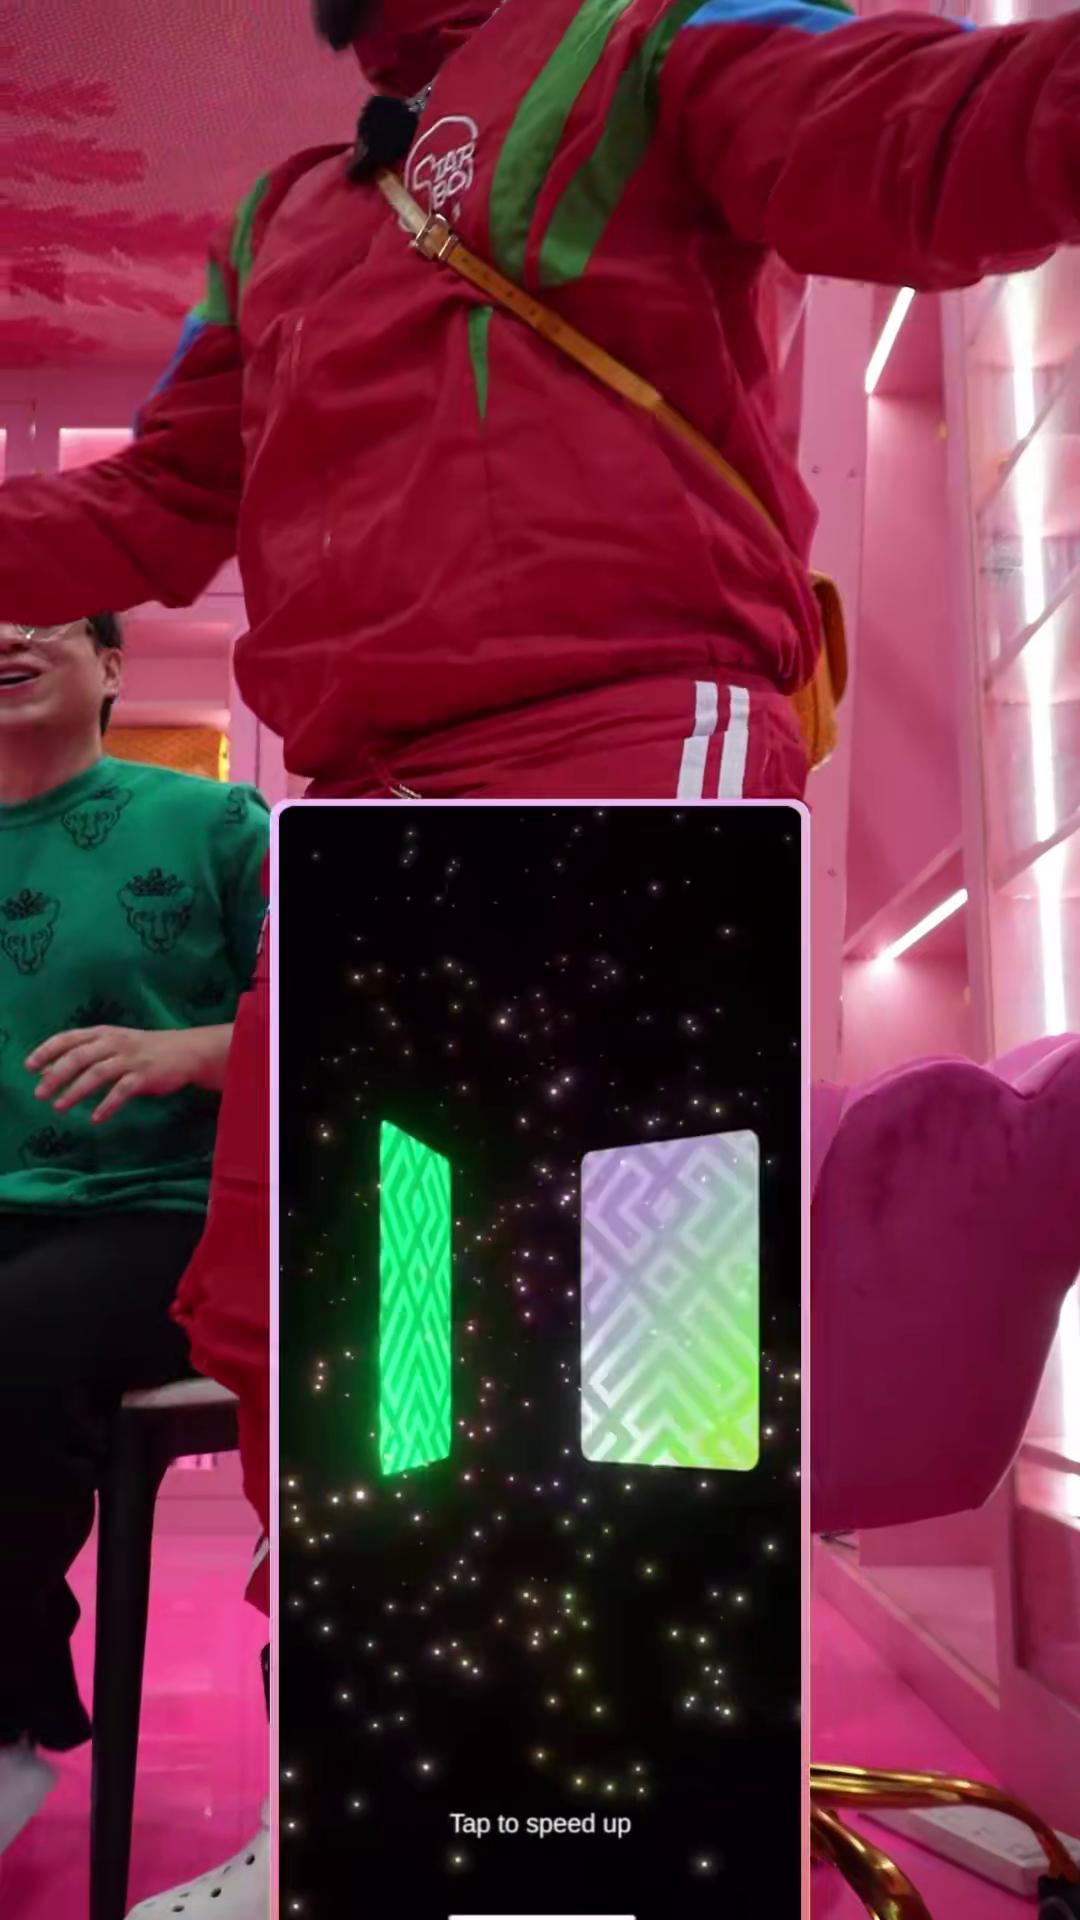 Rips by Triumph's top creative: 3,762,917,412 impressions across 1,409,949 placements, 47 seconds, first seen 2026-06-30 and still running after 50 days. It carries 63.0% of the measured fleet.
The fleet at a glance: 30 creatives, none older than 134 days
| # | Impressions | Placements | Impr/placement | First seen | Last seen | Days live | Duration | Store record |
|---|---|---|---|---|---|---|---|---|
| 1 | 3,762,917,412 | 1,409,949 | 2,669 | 2026-06-30 | live | 50 | 47s | iOS |
| 2 | 378,676,911 | 161,815 | 2,340 | 2026-07-24 | live | 26 | 55s | Android |
| 3 | 181,691,954 | 69,790 | 2,603 | 2026-08-02 | live | 17 | 55s | iOS |
| 4 | 136,332,697 | 36,057 | 3,781 | 2026-07-26 | 2026-08-15 | 24 | 17s | Android |
| 5 | 124,071,634 | 47,889 | 2,591 | 2026-04-07 | live | 134 | 55s | iOS |
| 6 | 111,076,044 | 25,471 | 4,361 | 2026-05-19 | live | 92 | 25s | Android |
| 7 | 110,204,666 | 29,900 | 3,686 | 2026-05-21 | live | 90 | 55s | Android |
| 8 | 91,969,510 | 27,818 | 3,306 | 2026-07-24 | live | 26 | 31s | Android |
| 9 | 91,169,534 | 23,672 | 3,851 | 2026-06-07 | live | 73 | no video duration | Android |
| 10 | 83,058,075 | 26,945 | 3,083 | 2026-06-28 | live | 52 | 39s | Android |
| 11 | 70,593,930 | 19,249 | 3,667 | 2026-05-20 | live | 91 | 22s | Android |
| 12 | 67,911,658 | 25,550 | 2,658 | 2026-08-02 | live | 17 | 55s | iOS |
| 13 | 66,188,365 | 26,417 | 2,506 | 2026-07-24 | live | 26 | 31s | Android |
| 14 | 58,913,626 | 14,715 | 4,004 | 2026-05-27 | live | 84 | 45s | Android |
| 15 | 56,396,125 | 21,312 | 2,646 | 2026-07-15 | live | 35 | 27s | iOS |
| 16 | 46,501,820 | 11,970 | 3,885 | 2026-05-19 | live | 92 | 47s | Android |
| 17 | 46,298,319 | 17,023 | 2,720 | 2026-05-29 | live | 82 | 6s | iOS |
| 18 | 46,228,735 | 17,850 | 2,590 | 2026-07-02 | live | 48 | 47s | iOS |
| 19 | 44,956,680 | 14,309 | 3,142 | 2026-08-01 | live | 18 | 22s | iOS |
| 20 | 43,756,600 | 16,827 | 2,600 | 2026-08-06 | live | 13 | 27s | iOS |
| 21 | 42,816,498 | 13,351 | 3,207 | 2026-06-30 | live | 50 | 21s | Android |
| 22 | 40,684,485 | 45,826 | 888 | 2026-07-21 | 2026-07-30 | 29 | 47s | Android |
| 23 | 40,137,546 | 11,082 | 3,622 | 2026-07-30 | 2026-08-15 | 20 | 41s | Android |
| 24 | 38,994,841 | 13,203 | 2,953 | 2026-06-28 | live | 52 | 28s | iOS |
| 25 | 36,868,244 | 8,995 | 4,099 | 2026-05-29 | live | 82 | 32s | Android |
| 26 | 35,173,050 | 13,558 | 2,594 | 2026-08-01 | live | 18 | 55s | iOS |
| 27 | 33,951,544 | 10,746 | 3,159 | 2026-08-10 | live | 9 | 51s | iOS |
| 28 | 32,323,568 | 8,939 | 3,616 | 2026-05-30 | live | 81 | 25s | Android |
| 29 | 28,086,379 | 6,530 | 4,301 | 2026-05-16 | live | 95 | 17s | Android |
| 30 | 27,951,559 | 11,322 | 2,469 | 2026-07-09 | live | 41 | 19s | iOS |
| Total | 5,975,902,009 | 2,188,080 | 2,731 | — | — | 52 avg | — | — |
Read the "First seen" column from top to bottom. Every value begins with 2026. There is no 2025 output in this fleet at all, and the fleet extends past this sample — a third page of results adds 15 more creatives between 13,185,478 and 26,987,776 impressions, totalling a further 285,335,534.
For comparison, every other publisher measured in this series has assets running from 2024 or early 2025. Playrix has a creative live since 2024-02-21. Hungry Studio has two live since 2025-04-05. Triumph Arcade's oldest measurable US asset is four and a half months old.
The 63% creative
Creative #1 deserves its own section because everything else in this account is a rounding error beside it.
| Metric | Creative #1 | Rest of fleet (29 assets) |
|---|---|---|
| Impressions | 3,762,917,412 | 2,212,984,597 |
| Share of fleet | 63.0% | 37.0% |
| Placements | 1,409,949 | 778,131 |
| Impressions per placement | 2,669 | 2,844 |
| Days live | 50 | 52.3 avg |
| Share of fleet impressions | 63.0% | 1.3% avg |
The per-placement rate is the interesting part. Creative #1 is not being served more densely than the rest of the account — at 2,669 impressions per placement it is actually slightly below the fleet average of 2,731 and well below the top performers on that metric. It is simply being bought into 1.4 million placements, which is 1.8x the placement count of the other twenty-nine creatives put together.
That is a volume decision, not a delivery-quality one. Triumph found one asset that worked and pointed essentially the entire budget at it.
The risk profile of that is worth stating plainly. A fleet where 63% of delivery sits on a single 50-day-old file has no cushion. If that creative fatigues, there is no 400-day veteran sitting behind it to absorb the spend — the second-largest asset in the account is 26 days old and delivers at one-tenth the rate.
 Creative #2 — 55 seconds, 378,676,911 impressions in 26 days. The largest asset on the Android package, and one-tenth the size of the iOS leader.
Delivery density: 2,469 to 4,361, and one exception
Impressions per placement measures how densely each asset is served inside the placements it reaches. Across the 27 live creatives, Rips runs between 2,340 and 4,361, with a median of 3,083.
That band is high. To put it in context against the other advertisers pulled on the same date:
| Advertiser | Fleet impr/placement | Range across sampled creatives |
|---|---|---|
| MONOPOLY GO! (Scopely) | 8,027 | 4,757 – 8,492 |
| Whatnot (Whatnot Inc.) | 3,341 | 1,545 – 6,835 |
| Rips by Triumph (Triumph Arcade) | 2,731 | 888 – 4,361 |
| Magic Sort! (Grand Games) | 1,496 | 1,319 – 8,154 |
| Courtyard (Courtyard, Inc.) | 566 | 413 – 3,314 |
| Arrows – Puzzle Escape (Lessmore) | 119 | 116 – 134 |
| Block Blast! (Hungry Studio) | 31 | 21 – 50 |
Rips sits in the upper third. It is buying the kind of inventory where a creative that gets served is served hard — full-screen, high-completion surfaces rather than the small-format placements that produce sub-100 rates.
One creative breaks the band. Creative #22 recorded 45,826 placements but only 40,684,485 impressions — 888 per placement, less than half the fleet floor. It is also the shortest-lived asset in the account: first seen 2026-07-21, last seen 2026-07-30, nine days in market.
The combination reads as a test that went into different inventory and was killed quickly. Triumph gave it nine days, saw a delivery profile three times worse than everything else in the account, and switched it off. That is the only asset in the fleet with both an anomalous rate and a short life, and it is the clearest single piece of evidence that this account is being actively watched rather than left to run.
 Creative #4 — 17 seconds, 136,332,697 impressions at 3,781 per placement, the second-highest density in the account. First seen 2026-07-26, last seen 2026-08-15. One of only three assets in the fleet that has stopped.
Two store records, two different fleets
The 30 creatives resolve to two distinct store records: iOS product ID 6751921248 and the Android package com.triumpharcade.tcg. Both are the same product; the ad platform treats them as separate advertisers.
| Store record | Creatives | Impressions | Share | Placements | Impr/placement | Avg age | Still live |
|---|---|---|---|---|---|---|---|
iOS 6751921248 | 13 | 4,510,300,111 | 75.5% | 1,689,328 | 2,670 | 41 days | 13 / 13 |
Android com.triumpharcade.tcg | 17 | 1,465,601,898 | 24.5% | 498,752 | 2,939 | 61 days | 14 / 17 |
Three things fall out of this split.
The Android fleet is older and larger by count. Seventeen creatives averaging 61 days, against thirteen averaging 41. Triumph started on Android and scaled on iOS: eight of the nine assets first seen in May 2026 are Android, while five of the six assets launched in August are iOS.
All the retirement is on Android. Every one of the three stopped creatives sits on the Android package. The iOS fleet has a 100% survival rate — thirteen launched, thirteen still running.
Android delivers denser but buys far less. At 2,939 impressions per placement the Android assets are slightly ahead of iOS on density, but they occupy under a quarter of the placements. Strip creative #1 out of the iOS side and the two platforms look almost identical (iOS 2,675 vs Android 2,939) — the entire iOS advantage is that one file.
For anyone benchmarking this account, the practical warning is that a single-platform pull would mislead you badly. Look only at iOS and you see a 13-asset fleet with a 63%-concentrated leader and zero churn. Look only at Android and you see a 17-asset fleet with active retirement and no dominant creative. Neither picture is Rips.
 Creative #3 — 55 seconds, 181,691,954 impressions. Launched 2026-08-02, so it covers only the last 17 days of the measurement window and is understated relative to the leader, and it is already the third-largest entry in the account.
The build order: one creative in April, twenty-nine after
Sorting by first-seen date rather than impressions changes the story completely.
| First seen | Impressions | Duration | Impr/placement | Days live | Status |
|---|---|---|---|---|---|
| 2026-04-07 | 124,071,634 | 55s | 2,591 | 134 | live |
| 2026-05-16 | 28,086,379 | 17s | 4,301 | 95 | live |
| 2026-05-19 | 111,076,044 | 25s | 4,361 | 92 | live |
| 2026-05-19 | 46,501,820 | 47s | 3,885 | 92 | live |
| 2026-05-20 | 70,593,930 | 22s | 3,667 | 91 | live |
| 2026-05-21 | 110,204,666 | 55s | 3,686 | 90 | live |
| 2026-05-27 | 58,913,626 | 45s | 4,004 | 84 | live |
| 2026-05-29 | 46,298,319 | 6s | 2,720 | 82 | live |
| 2026-05-29 | 36,868,244 | 32s | 4,099 | 82 | live |
| 2026-05-30 | 32,323,568 | 25s | 3,616 | 81 | live |
| 2026-06-07 | 91,169,534 | no video duration | 3,851 | 73 | live |
| 2026-06-28 | 83,058,075 | 39s | 3,083 | 52 | live |
| 2026-06-28 | 38,994,841 | 28s | 2,953 | 52 | live |
| 2026-06-30 | 3,762,917,412 | 47s | 2,669 | 50 | live |
| 2026-06-30 | 42,816,498 | 21s | 3,207 | 50 | live |
| 2026-07-02 | 46,228,735 | 47s | 2,590 | 48 | live |
| 2026-07-09 | 27,951,559 | 19s | 2,469 | 41 | live |
| 2026-07-15 | 56,396,125 | 27s | 2,646 | 35 | live |
| 2026-07-21 | 40,684,485 | 47s | 888 | 29 | stopped 2026-07-30 |
| 2026-07-24 | 378,676,911 | 55s | 2,340 | 26 | live |
| 2026-07-24 | 91,969,510 | 31s | 3,306 | 26 | live |
| 2026-07-24 | 66,188,365 | 31s | 2,506 | 26 | live |
| 2026-07-26 | 136,332,697 | 17s | 3,781 | 24 | stopped 2026-08-15 |
| 2026-07-30 | 40,137,546 | 41s | 3,622 | 20 | stopped 2026-08-15 |
| 2026-08-01 | 44,956,680 | 22s | 3,142 | 18 | live |
| 2026-08-01 | 35,173,050 | 55s | 2,594 | 18 | live |
| 2026-08-02 | 181,691,954 | 55s | 2,603 | 17 | live |
| 2026-08-02 | 67,911,658 | 55s | 2,658 | 17 | live |
| 2026-08-06 | 43,756,600 | 27s | 2,600 | 13 | live |
| 2026-08-10 | 33,951,544 | 51s | 3,159 | 9 | live |
Launch volume by month: April 1, May 9, June 5, July 9, August 6 — with August only nineteen days old at the pull date.
Three observations that a plain impressions ranking hides:
The cadence is accelerating, not slowing. Six creatives in nineteen days works out to one every 3.2 days, against a fleet-wide average of one every 4.5 days. Twelve of the thirty assets — 40% of the fleet — were first seen inside the last thirty days.
Nothing before 2026-06-30 predicted 2026-06-30. Thirteen creatives shipped before the breakout, at volumes between 28.1 million and 124.1 million. The fourteenth delivered 3.76 billion. That is a 30x step change against the best prior asset, from a 47-second video that is not obviously distinguishable in format from creative #16 (also 47s, 46.5 million) or creative #18 (also 47s, 46.2 million).
The account kept shipping anyway. Sixteen more creatives entered after the breakout. A team that believed it had found the answer would have stopped producing. Triumph accelerated instead, which suggests it does not treat creative #1 as repeatable.
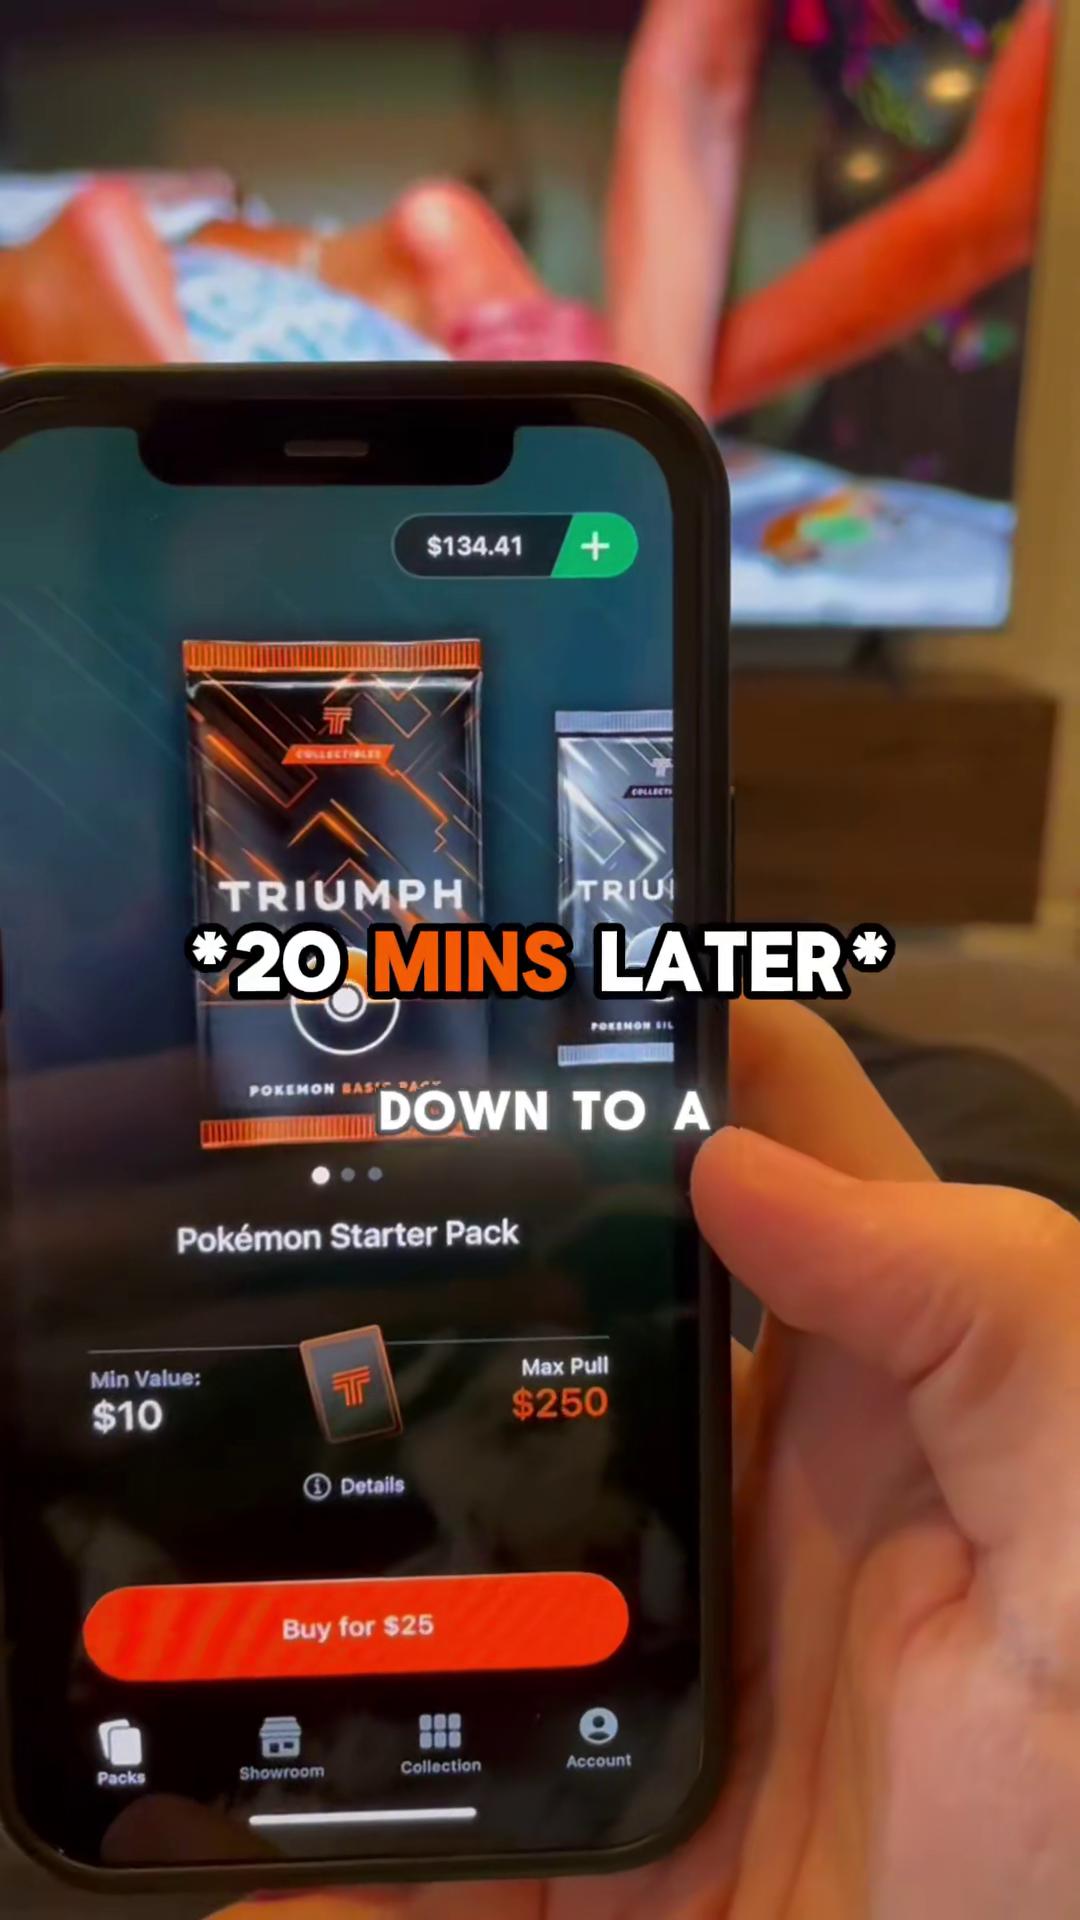 Creative #5 — 55 seconds, 124,071,634 impressions, first seen 2026-04-07. The oldest asset in the entire fleet at 134 days, and still running.
Duration: short by count, long by volume
Rips ships across an unusually wide range of runtimes — 6, 17, 17, 19, 21, 22, 22, 25, 25, 27, 27, 28, 31, 31, 32, 39, 41, 45, 47, 47, 47, 51, 55, 55, 55, 55, 55, 55 seconds, plus one asset with no recorded duration.
| Duration band | Creatives | Impressions | Share | Avg impressions | Avg impr/placement |
|---|---|---|---|---|---|
| 41–60s | 13 | 4,927,065,041 | 82.4% | 379,005,003 | 2,868 |
| 21–40s | 12 | 718,998,480 | 12.0% | 59,916,540 | ~3,270 |
| 1–20s | 4 | 238,668,954 | 4.0% | 59,667,238 | ~3,290 |
| No video duration | 1 | 91,169,534 | 1.5% | 91,169,534 | 3,851 |
The headline split is misleading on its own. The 41–60 second band carries 82.4% of impressions, but 3.76 billion of that 4.93 billion is creative #1. Remove the leader and the long band drops to 1,164,147,629 impressions across twelve assets — an average of 97 million each, against 59.9 million for the 21–40 second group and 59.7 million for the sub-20 second group.
So the honest reading is: Triumph produces short and long at roughly the same success rate, and one long asset happened to break out.
Density tells a cleaner story. Creatives at 40 seconds or under average 3,279 impressions per placement; creatives over 40 seconds average 2,868. Shorter assets are being served more densely. Every creative in the fleet with a rate above 4,000 — #6 (25s), #14 (45s), #25 (32s), #29 (17s) — is short or mid-length except one.
And the outlier at the bottom of the runtime scale is instructive: creative #17 is six seconds long and has delivered 46,298,319 impressions at 2,720 per placement, comfortably inside the normal band. A six-second cut and a fifty-five-second cut convert placements at the same rate here.
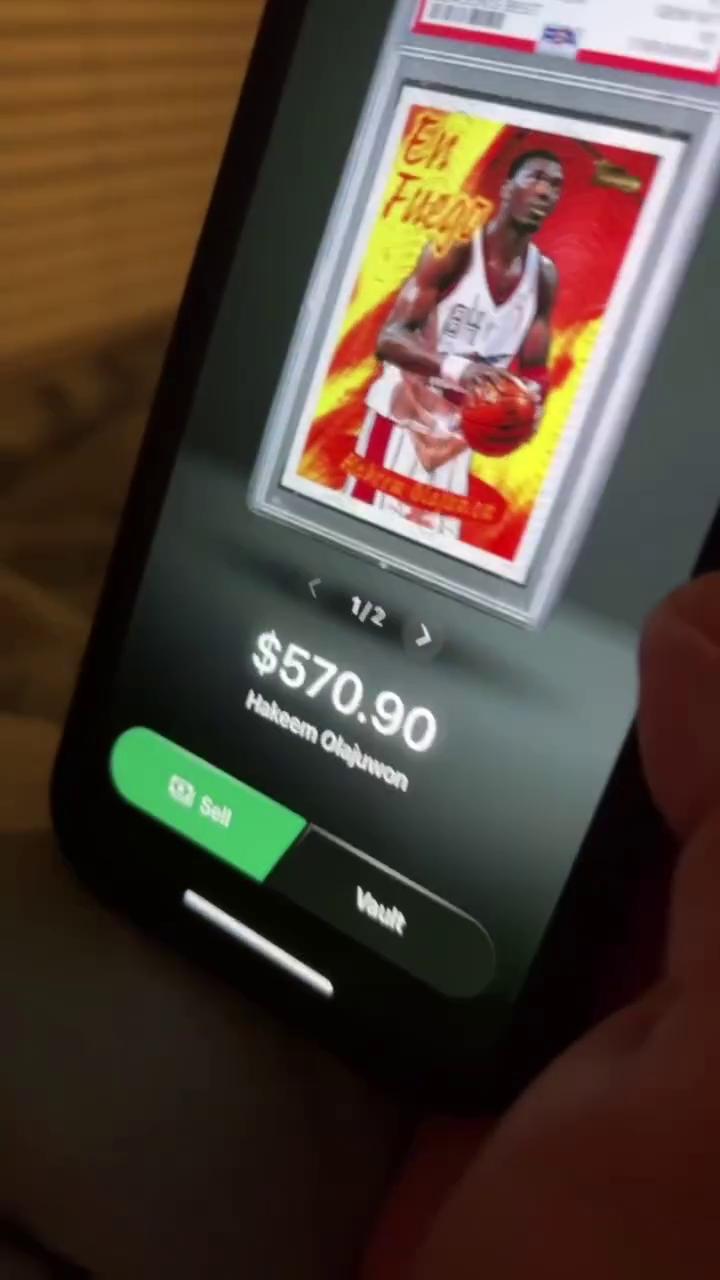 Creative #6 — 25 seconds, 111,076,044 impressions at 4,361 per placement, the densest delivery in the account. First seen 2026-05-19, still running after 92 days.
 Creative #9 — the only asset in the fleet with no recorded video duration. 91,169,534 impressions at 3,851 per placement, first seen 2026-06-07, still running after 73 days.
No playables, anywhere
Across all 30 creatives, zero carry a playable attachment. That is unique among the accounts measured in this series.
| Publisher | Playable attachment rate |
|---|---|
| Block Blast! (Hungry Studio) | 29 / 30 |
| Magic Sort! (Grand Games) | 9 / 10 |
| Arrows – Puzzle Escape (Lessmore) | 9 / 10 |
| Township (Playrix) | 18 / 30 |
| Whatnot (Whatnot Inc.) | 4 / 10 |
| MONOPOLY GO! (Scopely) | 2 / 10 |
| Rips by Triumph (Triumph Arcade) | 0 / 30 |
The pattern across the table is not random. The playable-heavy accounts are puzzle games — products where the ad's job is to demonstrate a mechanic the viewer can grasp in three seconds of interaction. The playable-light accounts are products where the proposition is an outcome rather than a mechanic.
Rips sits at the extreme end of that second group. The ad copy the platform records confirms it: "Open Packs. Get Valuable Cards. Cash O…" appears on twelve of the thirty creatives, "Rip. Reveal. Triumph." on six, and "Rips by Triumph just launched! Download Today!" on another six. All three are outcome claims. None of them describe an interaction.
There is nothing to make playable about opening a pack. The tension is in what is inside, and a playable that lets you open a fake pack destroys the thing being sold. Triumph appears to have reasoned this out and skipped the format entirely rather than shipping playables because the placement inventory asks for them.
That decision has a cost worth naming: interactive-only placements are closed to this account. Given that Rips is buying inventory at 2,731 impressions per placement — near the top of the measured range — the trade looks deliberate. It is buying fewer placement types, harder.
 Creative #10 — 39 seconds, 83,058,075 impressions at 3,083 per placement, 52 days live. Representative of the mid-fleet: video only, no playable, high delivery density.
Concentration: one asset, 63% of the account
An earlier version of this article ranked the fleet by impressions ÷ days-live and presented the result as a re-ranking that revealed "what is happening now". That section has been removed, because the metric could not do what it claimed.
The impression field is a rolling 30-day value. Dividing it by each asset's days-live mixed a fixed 30-day numerator with denominators from 9 to 50 days — inflating every asset younger than the window and deflating the one older than it. Recomputed correctly, by dividing every asset by the same 30-day window, the "intensity" ranking becomes an exact rescaling of the impression ranking: there is no re-ranking. The full correction is in the methodology note.
What survives is the concentration itself, which needs no rate at all:
| Rank | Impressions | Share | First seen | Duration | Covers full window |
|---|---|---|---|---|---|
| 1 | 3,762,917,412 | 63.0% | 2026-06-30 | 47s | yes |
| 2 | 378,676,911 | 6.3% | 2026-07-24 | 55s | no |
| 3 | 181,691,954 | 3.0% | 2026-08-02 | 55s | no |
| 4 | 136,332,697 | 2.3% | 2026-07-26 | 17s | no |
| 5 | 91,969,510 | 1.5% | 2026-07-24 | 31s | no |
One creative is 63.0% of everything this account delivered in the 30 days to 2026-08-19. The second is 6.3%. That ratio — 9.9x between first and second — is the real finding, and it is a straight comparison of two impression totals measured over the same window.
The asset's age makes the concentration more striking rather than less. It was first seen 2026-06-30, twenty days before the measurement window even opened, so it had full exposure to all thirty days. The fourteen assets launched after 2026-07-20 did not — and they still account for a meaningful slice of the remainder, which is the strongest thing that can honestly be said about the account's newer output.
A caveat on the assets below rank one. Twelve of the thirty entries were first seen after the window opened and three stopped before it closed, so eighteen of thirty cover the full window. Those eighteen account for 80.5% of window impressions. The partially-exposed entries are understated relative to the leader, and no per-day rate in this article attempts to correct for that — the article simply does not use per-day rates.
The collectibles bracket: Rips against Courtyard and Whatnot
Rips competes for attention with two other US apps built on buying, opening and reselling physical collectibles. Both are measurable and both are buying.
| Metric | Rips by Triumph | Courtyard | Whatnot |
|---|---|---|---|
| Creatives sampled | 30 | 10 | 10 |
| Total impressions | 5,975,902,009 | 223,274,373 | 310,997,880 |
| Total placements | 2,188,080 | 394,147 | 93,089 |
| Impressions per placement | 2,731 | 566 | 3,341 |
| Top creative impressions | 3,762,917,412 | 125,020,321 | 96,421,370 |
| Top entry, share of its fleet | 63.0% | 27.9% | 31.4% |
| Oldest sampled asset | 134 days | 284 days | 275 days |
| Still live | 27 / 30 | 9 / 10 | 8 / 10 |
| Playable attachment | 0 / 30 | 0 / 10 | 4 / 10 |
Two things stand out.
Rips is running a different order of magnitude. Its top ten creatives out-deliver Courtyard's entire measured fleet by 22.7x and Whatnot's by 16.3x. Courtyard appears on the US revenue chart at #48 with a growth figure that is essentially a launch artefact; Whatnot appears on the download chart at #35 with -27.6%. Neither is buying at Rips's level.
Nobody in this bracket uses playables. Courtyard runs 0/10, Rips 0/30, Whatnot 4/10. This is the strongest evidence that the format choice is category logic rather than a Triumph idiosyncrasy — three independent teams selling the same "open it and see what you got" proposition all converged on video.
Where they differ is density. Whatnot buys at 3,341 impressions per placement from only 93,089 placements — narrow and extremely dense. Courtyard buys at 566 across 394,147 placements — wide and thin. Rips does both: 2,188,080 placements at 2,731. It is the only one of the three operating at scale and at high density, which is consistent with a budget large enough to clear the premium inventory rather than fill around it.
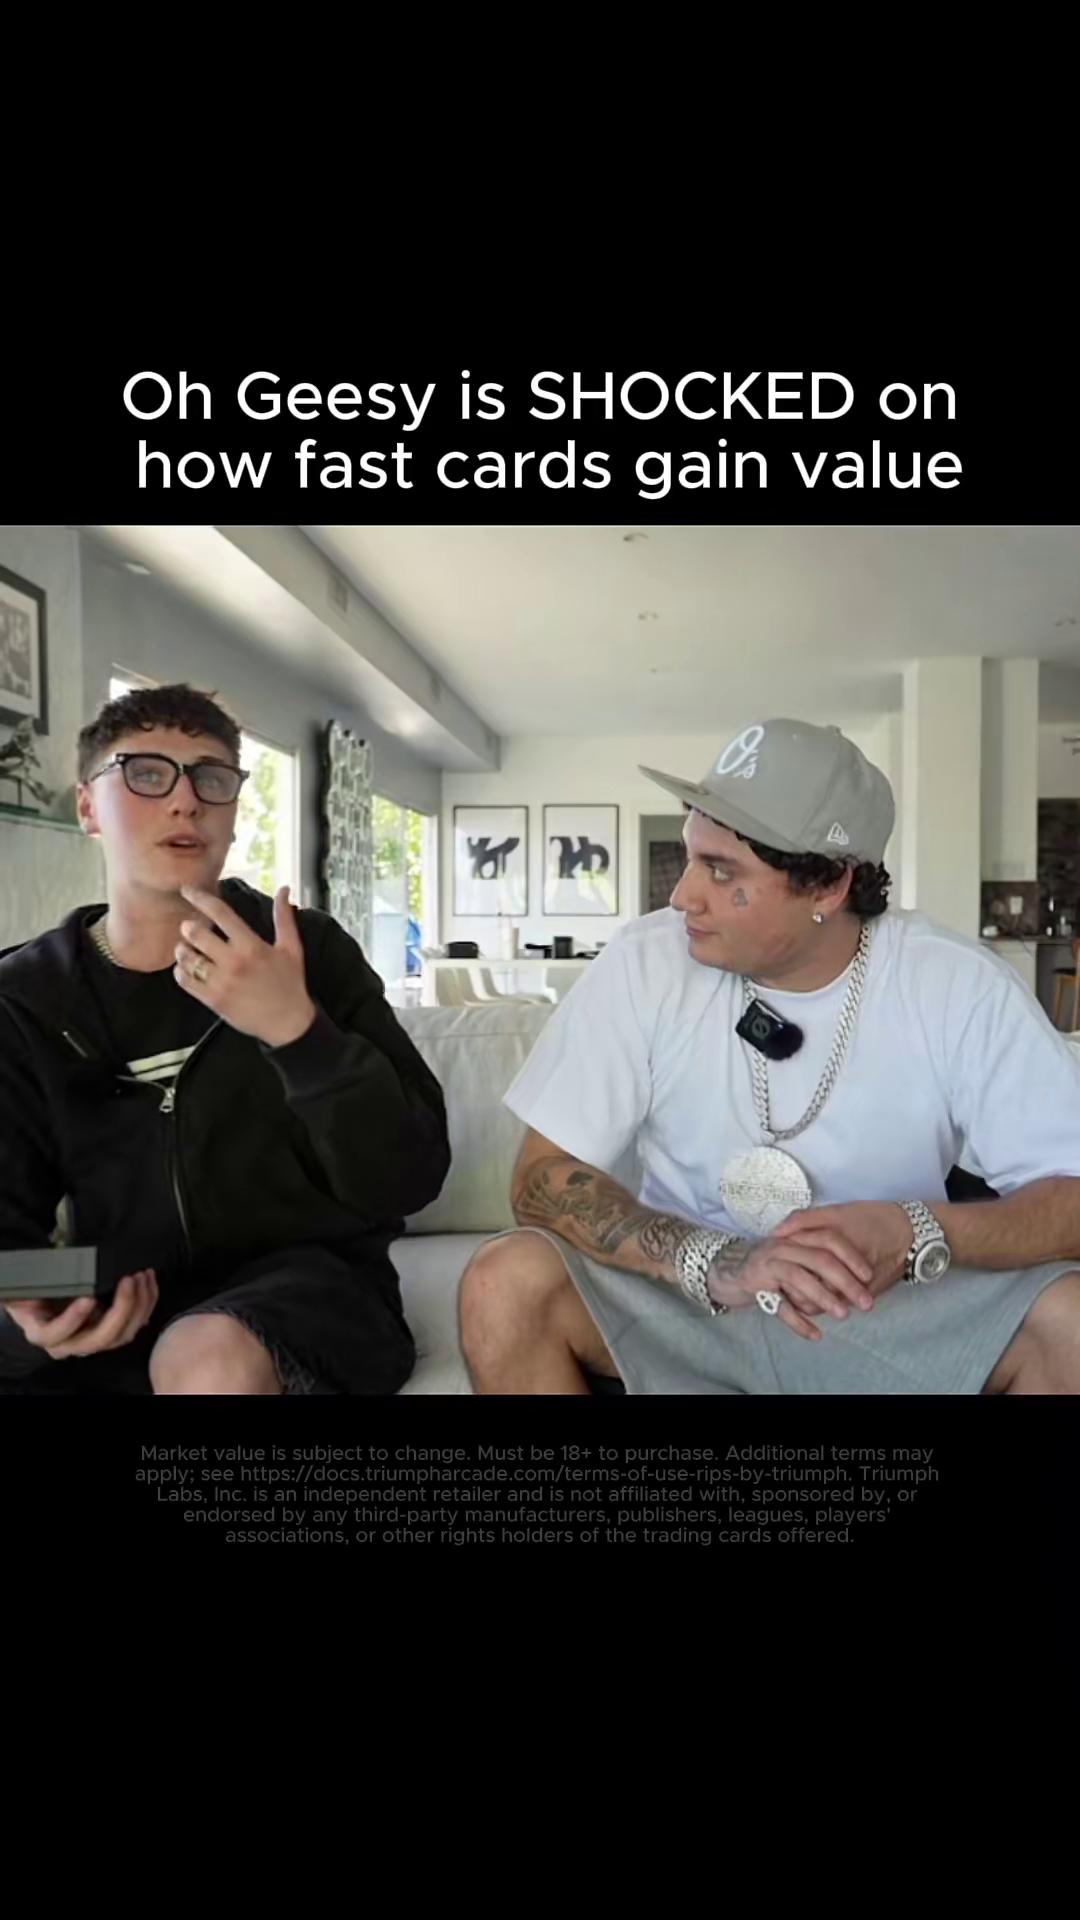 Creative #17 — six seconds, the shortest asset in the fleet. 46,298,319 impressions at 2,720 per placement, first seen 2026-05-29, still running after 82 days.
What the copy tells you, and what it does not
The platform records ad copy for eighteen of the thirty creatives. Three distinct strings account for all of them:
| Copy | Creatives | Read |
|---|---|---|
| "Open Packs. Get Valuable Cards. Cash O…" (truncated in source) | 12 | Mechanic plus payout. The dominant message. |
| "Rip. Reveal. Triumph." | 6 | Three-beat brand line. No claim, no CTA. |
| "Rips by Triumph just launched! Download Today!" | 6 | Recency framing. Still running four months post-launch. |
Twelve creatives carry no recorded copy at all, so this is a partial view and should be treated as such.
What is visible is a very narrow message set. Thirty creatives, three lines. Compare that with the variety of runtimes — twenty distinct durations across the same thirty assets — and a picture forms of a team that varies execution aggressively while holding the proposition fixed.
The third line is the one worth flagging for competitive analysts. "Just launched" is still in rotation on six creatives, the newest of which entered the fleet well after the app's actual launch window. Launch framing is being used as a hook, not as a fact. If you are tracking a competitor's launch date from their ad copy, this account is a demonstration of why that fails.
 Creative #29 — 17 seconds, 28,086,379 impressions across just 6,530 placements at 4,301 per placement, the second-densest asset in the fleet. First seen 2026-05-16, still running after 95 days.
What transfers to your UA program
If you run media buying: instrument concentration, and check what your impression field actually measures before you build a rate on it. This account is 63.0% one asset — a single point of failure that no cumulative-volume leaderboard makes obvious until it is already the top row. What you cannot do on this data source is divide by days-live to find rising assets early: the impression field is a rolling 30-day window, so that division inflates anything younger than the window and deflates anything older. Re-pull the same fixed window weekly and watch each asset's share move. That is the version of the idea that survives contact with the data.
If you run creative production: Rips ships one asset every 4.5 days across twenty distinct runtimes with three lines of copy. That is variance in execution against a fixed message. The alternative — a fixed format with rotating messages — is what most teams do, and it is not what produced the outlier here. The one thing that did not vary was the proposition.
If you run competitive intelligence: pull both store records. The iOS record shows 13 creatives, zero retirement and a 63%-concentrated leader. The Android record shows 17 creatives, three retirements and no dominant asset. Reporting either one as "the fleet" would be wrong, and the developer names attached to the two records differ in the source data even though the product is the same.
If you are competing with Rips: the concentration is the exposure. 63% of delivery sits on one 50-day-old file with no veteran asset behind it. The fleet has never had to survive a creative failure, because it has not had one yet. The three retirements so far were all small, all recent and all on the secondary platform.
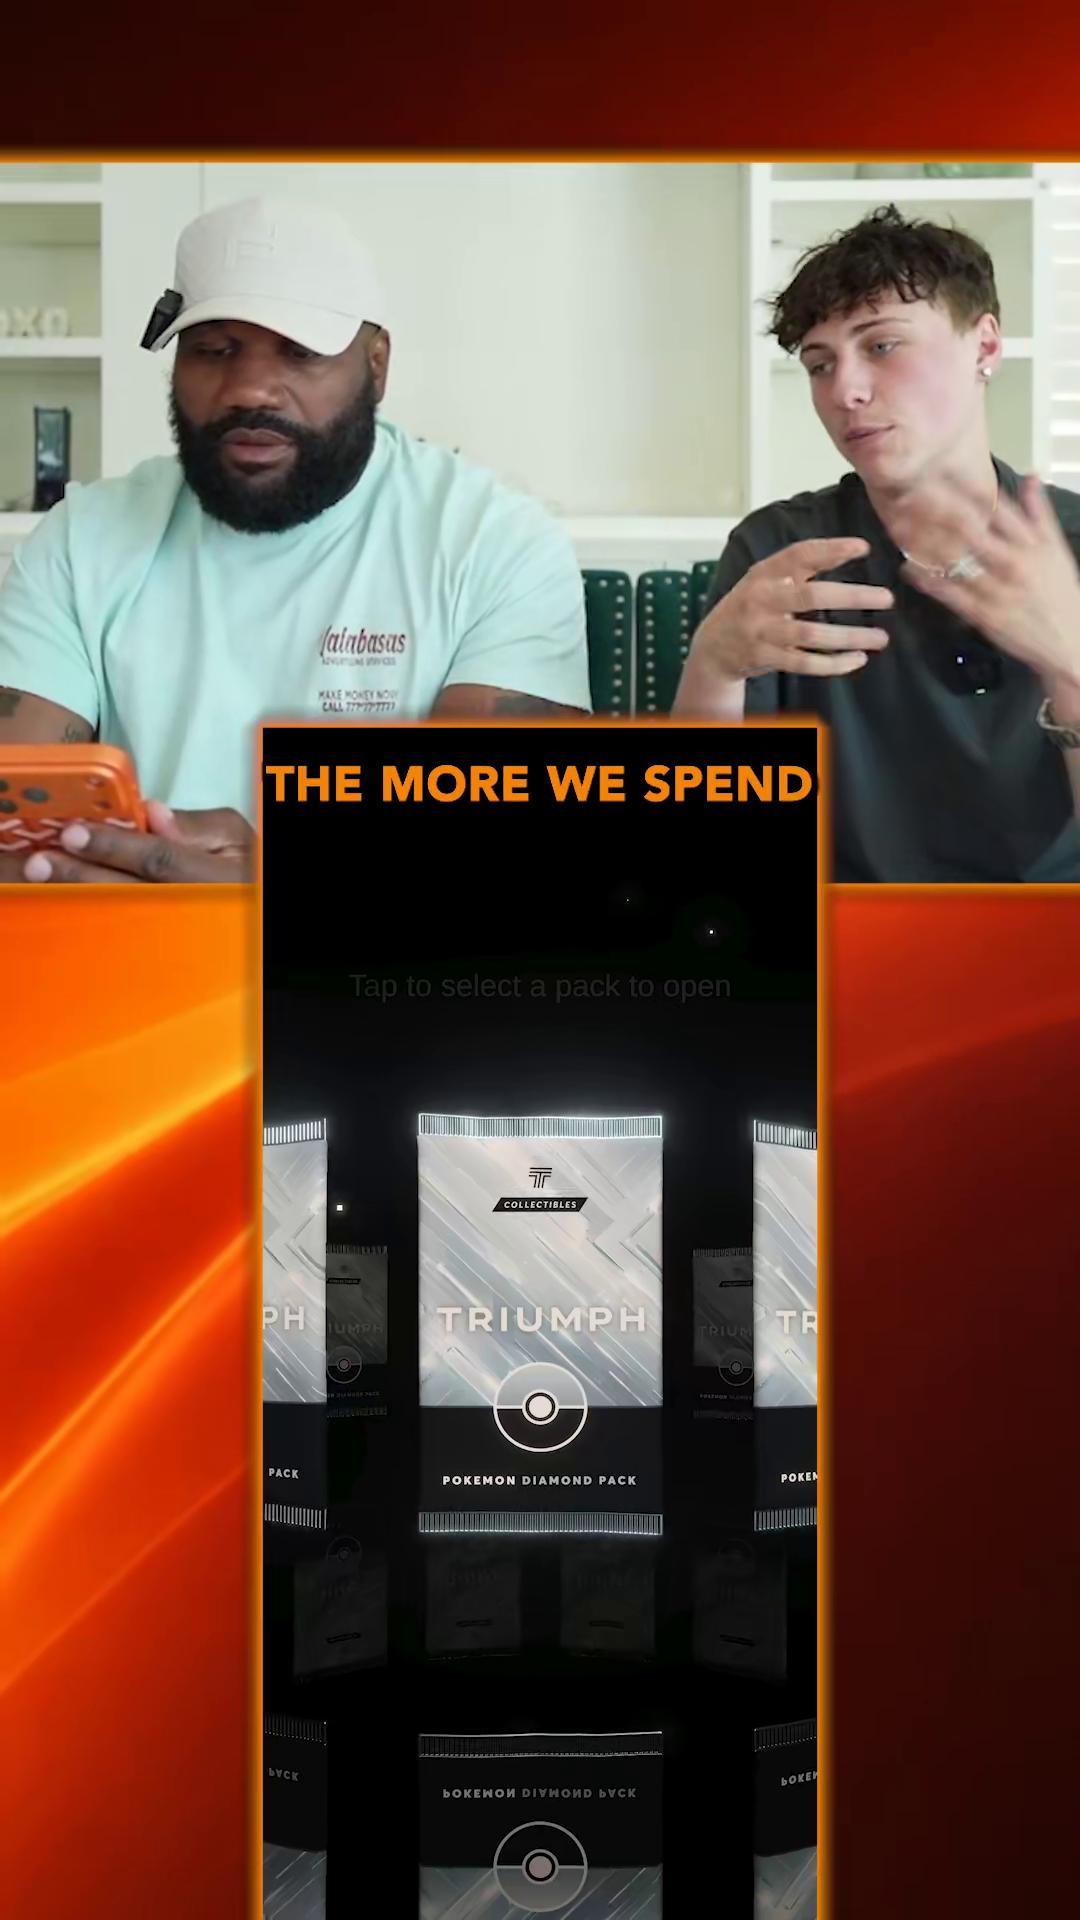 Creative #20 — 27 seconds, 43,756,600 impressions. First seen 2026-08-06, so it covers only 13 of the window's 30 days. One of six entries launched in the nineteen days before this pull.
The question this fleet cannot answer
Rips is growing on both charts: downloads +1.77%, revenue +11.67%. The ad fleet is accelerating: twelve of thirty creatives launched in the last month. Retirement has begun but is confined to three small Android assets.
What the data cannot tell you is whether the 63% creative is at its peak or still climbing, and the distinction matters enormously.
If it is still climbing, the sixteen assets shipped after it are insurance the account does not need yet, and Triumph is in the strongest position of any advertiser in this series.
If it has peaked, the account has a problem that its own production cadence is already responding to. Nothing in the current fleet is positioned to absorb 3.76 billion impressions of demand. The second-largest entry would need to grow roughly 10x, and creative #3 — the largest recent launch, at 181.7 million in a partial window — would need to grow further still.
The observable that separates these is simple: track creative #1's impressions-per-day across the next four weeks. If it holds near 75 million, the peak has not arrived. If it drops below 40 million while the fleet's aggregate holds, the succession is working. If both drop, the account is in trouble and the chart positions will follow.
That is one query a week.
A falsifiable prediction
Prediction: by 2026-11-01, creative #1 will no longer account for 63% of Rips by Triumph's measured US impressions — its share will fall below 50% — and the fleet will contain at least one creative first seen after 2026-08-19 with more than 500 million cumulative impressions.
The basis: the account shipped sixteen entries after its breakout and six in the last nineteen days, which is not the behaviour of a team that thinks one asset is sufficient. Meanwhile creative #1's share can only fall if the rest of the fleet grows, and the rest of the fleet currently holds 37.0% of window impressions against creative #1's 63.0%.
The interesting failure mode is the opposite one: if creative #1's share rises above 63% by November, Triumph will have failed to reproduce its own result across four months and thirty attempts, and the dual-chart position becomes dependent on a single ageing file. We will re-pull and report either way.
How to reproduce this teardown
- Pull both store records separately. Search by product name, then group by the store ID attached to each creative. A product with an iOS App Store ID and an Android package will show up as two advertisers, often with different developer names attached.
- Sort by first-seen date as well as by impressions. The impressions ranking here puts a 50-day-old asset at the top and buries the fact that the entire fleet is younger than five months. The date ranking makes it the first thing you see.
- Compute impressions ÷ days live for every asset and re-rank. This is what surfaces a breakout while it is still breaking out.
- Compute impressions ÷ placements and look at the spread, not the average. In this account the spread is 888 to 4,361, and the single value at the bottom identifies the only creative that was killed for performance reasons.
- Check last-observed dates on every asset. Twenty-seven of thirty were live on the pull date; the three that were not are the only evidence in this dataset that anyone is managing the account.
- Record playable attachment as a binary per creative. Zero out of thirty is a strategic statement, and it only becomes visible when you compare it against category peers.
Methodology and data notes
- Source: AdMapix creative search and ranking APIs, queried 2026-08-19, country filter
US, sorted by impressions descending. - Sample: the top 30 ad entries by impressions matching
Rips by Triumph, verified by store record. All 30 resolve to either iOS product ID6751921248(Triumph Arcade) or Android packagecom.triumpharcade.tcg(Triumph Labs Inc.). The fleet extends beyond this sample; a third page returns 15 further entries between 13,185,478 and 26,987,776 impressions. - Measurement window. The
impressionfield is a rolling 30-day value, not a lifetime total. Verified directly on this source: a default query returns figures identical to a query bounded bystart_date2026-07-20 /end_date2026-08-19, and shifting the start by one day changes every figure. All impression, placement and density figures here describe the 30 days ending 2026-08-19. - Correction: a removed section. An earlier version of this article carried an "Intensity: re-ranking by impressions per day" section, reported the leading creative at 75,258,348 impressions per day, and called that the highest daily delivery rate measured anywhere in this series. All of it has been removed. The rate was computed as windowed impressions ÷ days-since-first-seen, which divided a fixed 30-day numerator by denominators from 9 to 50 days — inflating every entry younger than the window and deflating the one older than it. Dividing every entry by the window length instead makes the "intensity" ranking an exact rescaling of the impression ranking, so no re-ranking exists. The cross-advertiser intensity comparison was removed for the same reason, compounded by the fact that the figures it cited from other articles were computed the same incorrect way. The concentration finding that replaces it uses only impression shares measured over one window.
- Window coverage. Eighteen of the thirty entries cover the full 30-day window; twelve were first seen after it opened and three stopped before it closed. The eighteen full-coverage entries account for 80.5% of window impressions, above the 60% threshold at which windowed comparisons remain usable. Entries with partial exposure are understated relative to the leader and are flagged where they appear.
- Fingerprint deduplication. The 30 entries resolve to 28 distinct video files (
videoFp), so entry counts in this article overstate distinct production by roughly 7% — the smallest gap measured in this series, and consistent with an account that ships new video rather than re-pairing existing video with new end cards. Impressions are reported per entry and are not double-counted, so no volume figure is affected. - Two store entries. The fleet spans iOS
6751921248(13 entries, 75.5% of impressions, 2,679.5 per placement) and Androidcom.triumpharcade.tcg(17 entries, 24.5%, 2,966.5 per placement). The blended fleet figure of 2,731 impressions per placement is a correct weighted average but is a mix of two separately-bought product records rather than a single property of the title. - Entity verification: creatives were matched to the product by store ID, not by app name. The
developerIdfield is not stable across records in this source — the same app can carry different developer IDs on different creatives and on the ranking endpoint — so it was not used as a join key. - "Days live" is the span between the first-observed timestamp and the pull date. It is a date span and is unaffected by the windowing of the impression field. An entry is treated as live only if its last-observed date equals 2026-08-19. Three entries did not meet that test and are labelled with their actual last-observed dates: 2026-07-30, 2026-08-15 and 2026-08-15.
- "Placements" (
showCnt) counts recorded creative appearances, not unique users or unique publishers. Impressions-per-placement is a distribution-shape indicator, not a frequency metric; the absolute value is only meaningful compared across creatives measured the same way. - Impressions are third-party estimates, not publisher-reported figures and not spend. They support relative comparison and should not be converted to dollar figures.
- Revenue figures are an estimated index whose unit is not documented in the source. Only the rank (#23) and the growth rate (+11.67%) are used here. Download figures are US-region estimates for the current ranking period.
- Cross-references to MONOPOLY GO!, Courtyard, Whatnot, Township, Block Blast!, Magic Sort! and Arrows – Puzzle Escape come from pulls made on the same date with the same method and country filter.
- Store listings: App Store and Google Play.
- Coverage is limited to creatives observable through third-party ad monitoring, and figures change as new creatives enter rotation.
Frequently Asked Questions
How many ads is Rips by Triumph running in the US? At least 45 measurable creatives as of 2026-08-19; the top 30 by impressions total 5,975,902,009 impressions across 2,188,080 placements, and 27 of those 30 were still live on the pull date. A third page of results adds 15 more assets totalling 285,335,534 impressions, so the true fleet is larger than the sample analysed here.
What is Rips by Triumph's best-performing ad creative? A 47-second video first seen 2026-06-30, carrying 3,762,917,412 impressions across 1,409,949 placements in the 30 days to 2026-08-19 — 63.0% of the measured fleet, and 9.9x the second-largest entry in the same account. Because it was first seen twenty days before the window opened, it had full exposure to all thirty days, unlike the fourteen entries launched inside the window.
How old is Rips by Triumph's oldest ad creative? 134 days. The oldest asset in the top 30 was first seen on 2026-04-07 and is a 55-second video with 124,071,634 impressions. No creative in this fleet predates April 2026, which is unique among the publishers measured in this series — Playrix, Hungry Studio and Vita Studio all run assets first seen in 2024 or early 2025.
Does Rips by Triumph use playable ads? No. Zero of 30 creatives carry a playable attachment, the only account measured in this series with none at all. Its two closest category peers behave similarly: Courtyard runs 0 of 10 and Whatnot 4 of 10, against 29 of 30 for the puzzle title Block Blast!. The proposition being advertised is an outcome — opening a pack and finding out what is inside — rather than a mechanic a playable could demonstrate.
How does Rips by Triumph compare to MONOPOLY GO! on ad volume? On a like-for-like top-10 basis over the same 30-day window, Rips's ten largest US entries total 5,071,168,437 impressions against MONOPOLY GO!'s 3,345,226,092 — 1.52x more. Rips is also far more concentrated: its top entry is 63.0% of its fleet against MONOPOLY GO!'s 27.9%, and MONOPOLY GO!'s leading asset was last observed on 2026-07-29 and is no longer live.
Why does Rips by Triumph appear twice with different developer names?
Because the ad platform treats the iOS and Android listings as separate advertiser records: iOS product ID 6751921248 is attributed to "Triumph Arcade" and Android package com.triumpharcade.tcg to "Triumph Labs Inc." Both are the same product. The iOS record carries 13 creatives and 75.5% of impressions; the Android record carries 17 creatives and 24.5%, and all three of the account's retired creatives sit on the Android side.
Is Rips by Triumph growing or declining? Growing on both measures. US downloads are +1.77% period-over-period at 1,154,817, and it holds #23 on the US revenue chart at +11.67% — six places above MONOPOLY GO!, which is at -6.53%. Creative production is accelerating in step: 12 of its 30 measured creatives were first seen in the 30 days before 2026-08-19.
Want to see whether a competitor's fleet has any history behind it? Per-creative impressions, placement counts, first-seen and last-seen dates, duration and playable attachment are all live in AdMapix, filterable by country, publisher and store ID — including the platform split that hides half of an account like this one. Create a free account to run this teardown on any title in your category, or see plans for full historical access.
Data source: AdMapix third-party ad intelligence estimates, United States, retrieved 2026-08-19. Impression, download and revenue figures are modelled estimates for comparative analysis and are not publisher-reported. Revenue values are an index with an undocumented unit; only rank and growth rate are used. Figures change as new creatives enter rotation.
Related Reading
- Ad strategy teardowns (series index) — every teardown in the series, in publication order
- Mobile game ads guide: formats, examples and research — the format matrix, research workflow and KPI guardrails every teardown in this series applies
- Township — two fleets in one account — 5% of impressions driving 71% of delivery
- Bus Traffic Fever! — one asset carrying 66% of a 3B-impression fleet
- MONOPOLY GO! — one creative at 1.85B impressions inside a 7-billion machine
Turn these observations into your next creative study
Open the creative library and select samples for your market, network and research question.
Related Articles
Gossip Harbor Ad Strategy in 2026: One 25-Second Video File Carries 70.5% of Everything
A creative-level teardown of Microfun's US user acquisition for Gossip Harbor. Fifteen ad entries account for 6,381,902,914 impressions, all still live — but they resolve to only fourteen distinct video files, and one 25-second file appearing under two entries carries 70.5% of all delivery. The whole interactive layer is a single playable shared across five entries. Rewritten from scratch after the underlying data changed roughly 2x in one day; the correction is documented in full.
Meowdoku Ad Strategy in 2026: The Quiet Machine — Two SKUs, No Batches, No Sweeps, 637 Million Impressions
Meowdoku sits at #8 on the US download chart with the least dramatic ad operation in this series: no launch batches, no synchronized resets, no format experiments. Just a steady one-or-two-a-week drip of 27–60-second cat-sudoku videos across two separate store SKUs — 637 million model-estimated impressions, 13 of 15 top creatives still live, and a placement fingerprint that splits cleanly along SKU lines. Sometimes the playbook is that there is no playbook drama.
PineDrama Ad Strategy in 2026: The Flood — 4.5-Minute Ads, Seven Copies per Video, and a Fleet That Dies Before It Peaks
PineDrama is the second-fastest riser on the US download chart, yet its biggest ad creative holds just 719K model-estimated impressions — and its entire top 15 went dark by August 5. We reconstruct TikTok Pte. Ltd.'s short-drama flood playbook from the AdMapix index: one 273-second video multiplexed under seven different copy lines, creator-style #ad distribution, by-asset synchronized retirements, and the methodological lesson an owned-inventory giant teaches every ad-intelligence reader.