
Township Ad Strategy in 2026: Two Fleets in One Account — 5% of Placements Deliver 71% of Impressions, and One Creative Has Run for 910 Days
A creative-level teardown of Playrix's US user acquisition for Township. Its 30 measured creatives split into two populations that never overlap: seven deliver 1,120 to 1,410 impressions per placement, the other twenty-three deliver 25 to 33. The seven take 5.1% of placements and produce 71.4% of impressions. The same split appears across Gardenscapes and Homescapes, and Township's oldest active creative was first seen on 2024-02-21 — 910 days before this pull.
Playrix's Township does not run one ad fleet in the US. It runs two, inside the same account, and they behave nothing alike.
Seven of its thirty measured creatives deliver between 1,120 and 1,410 impressions per placement. The other twenty-three deliver between 25 and 33. There is nothing in between — no creative in this account lands anywhere in the 34-to-1,119 range. Those seven assets occupy 5.1% of all placements and produce 71.4% of all impressions.
The split is not a Township quirk. Pull Gardenscapes and Homescapes on the same day and the same two populations appear, with the same boundaries. Across fifty Playrix creatives measured in the US, twenty-five run at 1,075–1,454 and twenty-five run at 25–58, and the field that separates them is visible in the data before you compute anything.
And one of those high-density assets was first observed on 2024-02-21. It was still running on 2026-08-19 — 910 consecutive days, the oldest active creative measured anywhere in this teardown series — 212 days clear of the runner-up, a Whiteout Survival playable at 698.
Executive summary (TL;DR)
- The fleet is bimodal, not distributed. 7 creatives at 1,120–1,410 impressions per placement; 23 at 25–33. A 46x gap with an empty middle.
- 5.1% of placements, 71.4% of impressions. The seven high-density assets account for 674,314,069 of the fleet's 944,824,903 impressions from just 496,432 of its 9,659,844 placements.
- The discriminator is
demoadCnt. Every high-density creative carries a value between 44 and 183. Every low-density creative carries 1 to 4. Fifty Playrix creatives across three titles, zero exceptions. - A 910-day creative, still live. First seen 2024-02-21, 30 seconds,
demoadCnt183. Homescapes has one at 961 days and Gardenscapes one at 779 — this is a house pattern, not an accident. - Same day, same length, 50x apart. Three 45-second creatives launched on 2025-05-30. Two land at 1,356 and 1,362 impressions per placement; the third lands at 27.
- Almost nothing is switched off. 29 of 30 delivery rows were live on the pull date. The one exception stopped 2026-07-29.
- Thirty rows, twenty-eight assets. Deduplicating by fingerprint leaves 17 distinct videos and 13 distinct playables; eleven rows are playable-only. Only two rows re-use a video another row already carries, so row counts and asset counts are nearly identical here — unlike most fleets in this series.
- Township is growing. US downloads 850,227, +2.03% — one of a small minority of games in the US top 100 with a positive change this period.
All figures are AdMapix third-party estimates for the United States, pulled 2026-08-19. Methodology at the end.
Where Township sits on the US charts
Township records 850,227 US downloads at +2.03% period-over-period, placing it at #95 on the download chart, published by Playrix under iOS product ID 638689075. The title also appears in Traditional Chinese as 夢想小鎮 under the same product ID.
The +2.03% deserves a note. In the US top 100 for this period, positive growth is unusual: the chart is full of double-digit declines, including MONOPOLY GO! at -14.23%, Block Blast! at -22.63% and Meowdoku! at -27.00%. A thirteen-year-old farm-and-city builder posting a gain is not what the surrounding rows look like.
| Title | US downloads | Change | Publisher |
|---|---|---|---|
| Township | 850,227 | +2.03% | Playrix |
| Block Blast! | 1,127,181 | -22.63% | Hungry Studio |
| Rips by Triumph | 1,154,817 | +1.77% | Triumph Arcade |
| Gossip Harbor | 758,507 | -19.06% | Microfun Limited |
| MONOPOLY GO! | 699,537 | -14.23% | Scopely |
Playrix does not appear on the US revenue chart in this pull, so no revenue comparison is available here.
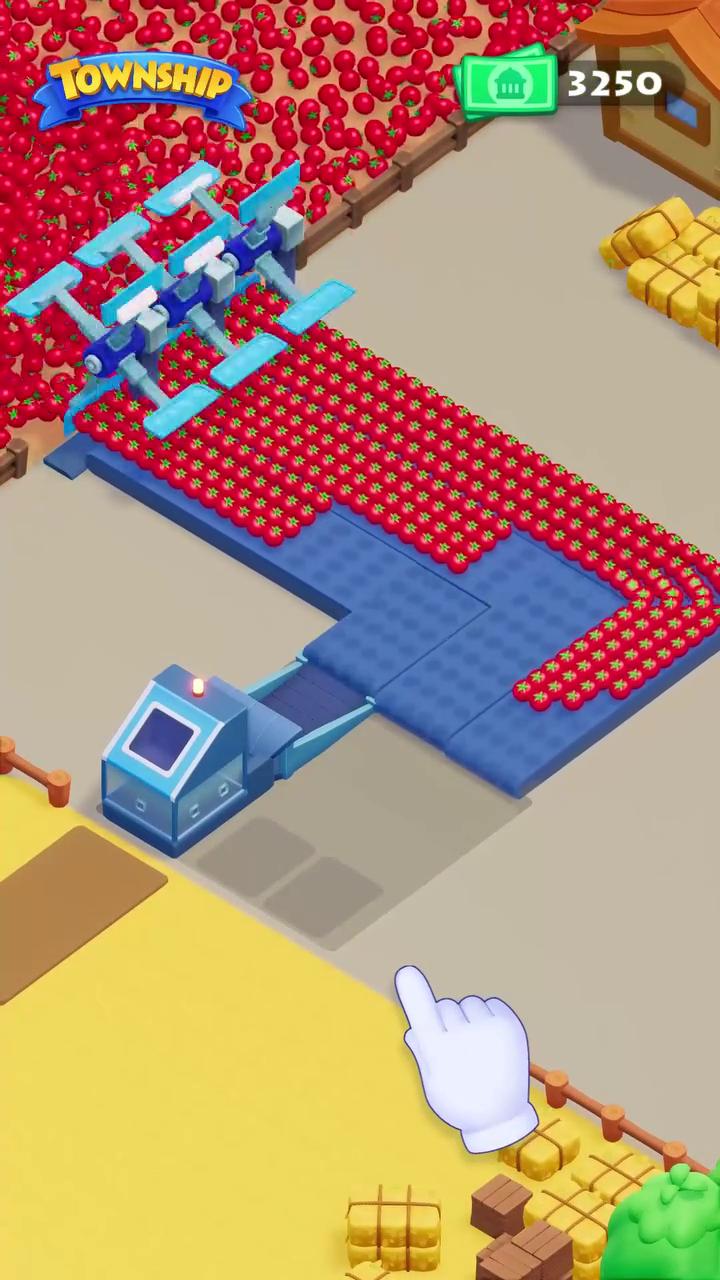 Township's top creative: 564,388,105 impressions across 416,109 placements, 45 seconds, first seen 2025-05-30 and still running after 446 days. At 1,356 impressions per placement it sits in the high-density population.
The fleet at a glance: 30 creatives, 29 still live
| # | Impressions | Placements | Impr/placement | First seen | Last seen | Days live | Duration | demoadCnt | Store record |
|---|---|---|---|---|---|---|---|---|---|
| 1 | 564,388,105 | 416,109 | 1,356 | 2025-05-30 | live | 446 | 45s | 132 | iOS |
| 2 | 112,636,988 | 3,861,412 | 29 | 2025-12-23 | live | 239 | no video duration | 4 | iOS |
| 3 | 53,737,010 | 38,116 | 1,410 | 2026-04-01 | live | 140 | 59s | 50 | Android |
| 4 | 51,097,620 | 1,619,969 | 32 | 2026-03-09 | live | 163 | no video duration | 2 | iOS |
| 5 | 20,923,766 | 15,177 | 1,379 | 2026-04-03 | live | 138 | 59s | 52 | Android |
| 6 | 20,843,261 | 15,462 | 1,348 | 2026-04-07 | live | 134 | 59s | 51 | Android |
| 7 | 19,045,244 | 609,331 | 31 | 2025-04-05 | live | 501 | no video duration | 4 | iOS |
| 8 | 16,962,350 | 558,563 | 30 | 2026-06-05 | live | 75 | 59s | 2 | iOS |
| 9 | 10,309,001 | 378,860 | 27 | 2026-06-16 | live | 64 | 119s | 1 | iOS |
| 10 | 6,687,385 | 220,312 | 30 | 2026-05-16 | live | 95 | no video duration | 2 | iOS |
| 11 | 6,548,218 | 5,848 | 1,120 | 2026-04-01 | live | 140 | 59s | 44 | Android |
| 12 | 6,443,916 | 222,270 | 29 | 2026-07-07 | live | 43 | 59s | 1 | iOS |
| 13 | 5,769,954 | 221,004 | 26 | 2026-01-28 | live | 203 | 59s | 1 | Android |
| 14 | 5,472,907 | 216,694 | 25 | 2026-04-04 | live | 137 | 59s | 1 | Android |
| 15 | 5,419,325 | 3,978 | 1,362 | 2025-05-30 | live | 446 | 45s | 159 | Android |
| 16 | 4,830,190 | 152,152 | 32 | 2026-04-02 | live | 139 | 59s | 3 | iOS |
| 17 | 4,520,434 | 154,372 | 29 | 2026-07-22 | live | 28 | no video duration | 2 | iOS |
| 18 | 3,761,982 | 130,147 | 29 | 2026-07-23 | live | 27 | no video duration | 2 | iOS |
| 19 | 2,866,409 | 111,147 | 26 | 2026-05-07 | live | 104 | no video duration | 1 | Android |
| 20 | 2,722,874 | 96,241 | 28 | 2026-05-06 | live | 105 | 59s | 1 | Android |
| 21 | 2,536,213 | 84,997 | 30 | 2025-09-16 | live | 337 | no video duration | 4 | iOS |
| 22 | 2,454,384 | 1,742 | 1,409 | 2024-02-21 | live | 910 | 30s | 183 | Android |
| 23 | 2,317,681 | 89,679 | 26 | 2026-06-06 | live | 74 | 59s | 3 | iOS |
| 24 | 2,289,989 | 76,982 | 30 | 2026-07-28 | live | 22 | 59s | 3 | iOS |
| 25 | 2,041,360 | 75,369 | 27 | 2025-05-30 | live | 446 | 45s | 2 | Android |
| 26 | 1,932,697 | 72,376 | 27 | 2026-07-23 | live | 27 | no video duration | 2 | iOS |
| 27 | 1,888,781 | 59,141 | 32 | 2026-05-06 | live | 105 | 59s | 2 | iOS |
| 28 | 1,625,105 | 60,107 | 27 | 2026-01-24 | live | 207 | 59s | 3 | iOS |
| 29 | 1,438,298 | 43,943 | 33 | 2026-07-04 | 2026-07-29 | 46 | no video duration | 2 | iOS |
| 30 | 1,313,456 | 48,344 | 27 | 2026-07-14 | live | 36 | no video duration | 1 | Android |
| Total | 944,824,903 | 9,659,844 | 98 | — | — | 186 avg | — | — | — |
The fleet-level figure of 98 impressions per placement is meaningless as an average. No creative in this account is anywhere near 98. It is the arithmetic result of averaging two populations that share nothing.
Read the last two columns together. Every row with demoadCnt above 43 has a delivery rate above 1,100. Every row with demoadCnt below 5 has a rate below 34. The dataset contains no counter-example.
The two populations
| Population | Creatives | Impressions | Share of impressions | Placements | Share of placements | Impr/placement | demoadCnt range |
|---|---|---|---|---|---|---|---|
| High density | 7 | 674,314,069 | 71.4% | 496,432 | 5.1% | 1,358 | 44 – 183 |
| Low density | 23 | 270,510,834 | 28.6% | 9,163,412 | 94.9% | 30 | 1 – 4 |
Nearly ninety-five percent of Township's recorded ad appearances belong to the low-density group, and they produce under thirty percent of the impressions. Five percent of appearances produce seventy-one percent.
Here is the entire high-density population:
| Impressions | Placements | Impr/placement | Duration | First seen | Days live | demoadCnt | Store record |
|---|---|---|---|---|---|---|---|
| 564,388,105 | 416,109 | 1,356 | 45s | 2025-05-30 | 446 | 132 | iOS |
| 53,737,010 | 38,116 | 1,410 | 59s | 2026-04-01 | 140 | 50 | Android |
| 20,923,766 | 15,177 | 1,379 | 59s | 2026-04-03 | 138 | 52 | Android |
| 20,843,261 | 15,462 | 1,348 | 59s | 2026-04-07 | 134 | 51 | Android |
| 6,548,218 | 5,848 | 1,120 | 59s | 2026-04-01 | 140 | 44 | Android |
| 5,419,325 | 3,978 | 1,362 | 45s | 2025-05-30 | 446 | 159 | Android |
| 2,454,384 | 1,742 | 1,409 | 30s | 2024-02-21 | 910 | 183 | Android |
Three properties they all share, and one they do not:
- All seven are live. None has ever been retired.
- None carries a playable attachment. Zero out of seven, against 18 of the 23 low-density creatives.
- All seven are video with a recorded duration — 30, 45, 45, 59, 59, 59, 59 seconds. Not one is a format with no duration recorded.
- They are not uniformly large. Volumes run from 2,454,384 to 564,388,105 — a 230x range. Density is a property of the inventory these assets reach, not of how successful they are.
That last point is the one that matters for competitive analysis. The 910-day creative delivers at 1,409 impressions per placement, essentially identical to the fleet's top asset at 1,356 — while carrying 0.3% of fleet impressions against the leader's 59.7%. Two creatives with the same delivery physics and a 230-fold difference in outcome.
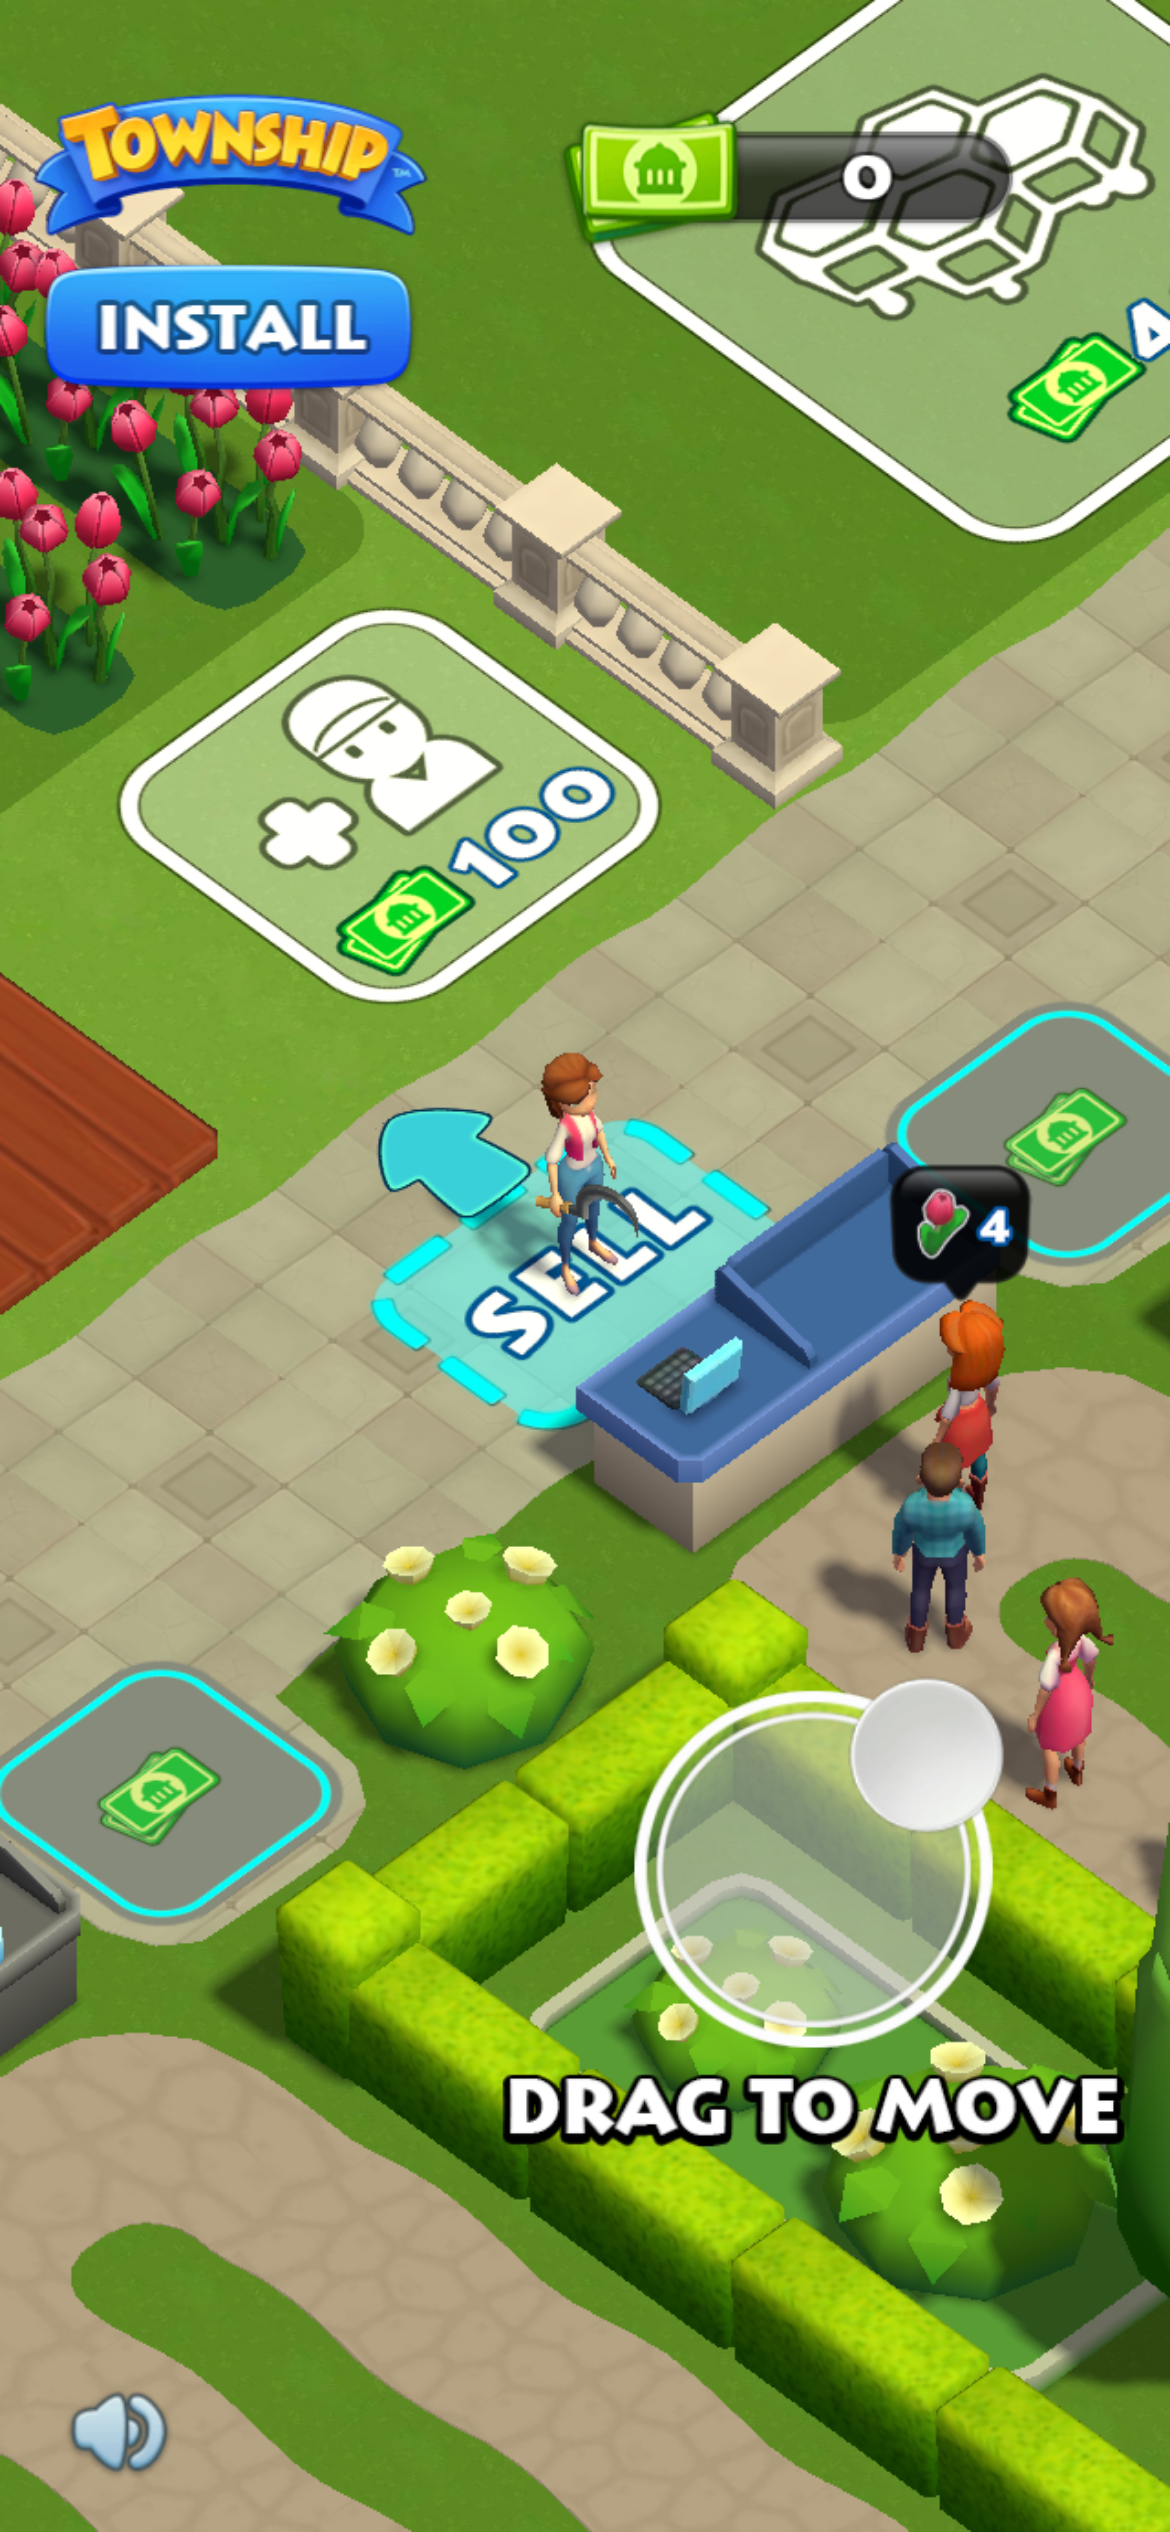 Creative #2 — no recorded video duration, 112,636,988 impressions across 3,861,412 placements. That is the highest placement count in the fleet and a delivery rate of 29, squarely in the low-density population.
What the split is not
Before reading anything into the two populations, it is worth ruling out the obvious explanations. None of them survives the data.
It is not duration. Fourteen creatives in this fleet are 59 seconds long. Ten of them deliver between 25 and 32 impressions per placement. Four deliver between 1,120 and 1,410. Same product, same runtime, same country, 45x apart.
It is not platform. The high-density group contains one iOS creative and six Android. The low-density group contains twelve iOS and eleven Android. Both platforms run both populations, and within the high-density group the two platforms are indistinguishable (iOS 1,356, Android 1,369).
It is not age. The high-density group spans 134 to 910 days. The low-density group spans 22 to 501. The oldest creative in the account is high-density; the second-oldest is low-density.
It is not size. High-density volumes run from 2.5 million to 564 million. Low-density volumes run from 1.3 million to 113 million. The ranges overlap heavily.
It is not the playable attachment on its own. It correlates — 0 of 7 versus 18 of 23 — but the correlation breaks the moment you look outside Playrix. Magic Sort! (Grand Games) attaches playables to 9 of 10 creatives and delivers at 1,496 impressions per placement, comfortably inside Township's high band. Block Blast! attaches to 29 of 30 and delivers at 31. The format does not determine the rate.
What is left is the field the source labels demoadCnt, and it separates the two groups perfectly with a gap between 4 and 44 that contains no creative at all. We do not know from public data what operational decision that field encodes. What we can say is that it is a reliable, pre-computed marker for two structurally different kinds of buying inside a Playrix account, and it works across the portfolio.
The 2025-05-30 triplet: the cleanest evidence in the dataset
On a single day, Playrix launched three 45-second Township creatives. All three were still running 446 days later.
| Impressions | Placements | Impr/placement | demoadCnt | Store record |
|---|---|---|---|---|
| 564,388,105 | 416,109 | 1,356 | 132 | iOS |
| 5,419,325 | 3,978 | 1,362 | 159 | Android |
| 2,041,360 | 75,369 | 27 | 2 | Android |
Same day. Same runtime. Same product. Two of the three deliver at ~1,360 impressions per placement; the third delivers at 27 — 50 times lower.
Two of the three sit on the same Android store record, so platform cannot explain the gap either. The only variable that moves with the outcome is demoadCnt: 132 and 159 against 2.
This is as close to a controlled experiment as public creative data offers, and it says the delivery regime is decided at the buying layer, not by the asset. Playrix shipped the same creative concept into two different kinds of inventory on the same day and got results two orders of magnitude apart on a per-placement basis.
 Creative #3 — 59 seconds, 53,737,010 impressions from only 38,116 placements. At 1,410 impressions per placement it is the densest asset in the account, and it carries
 demoadCnt 50.
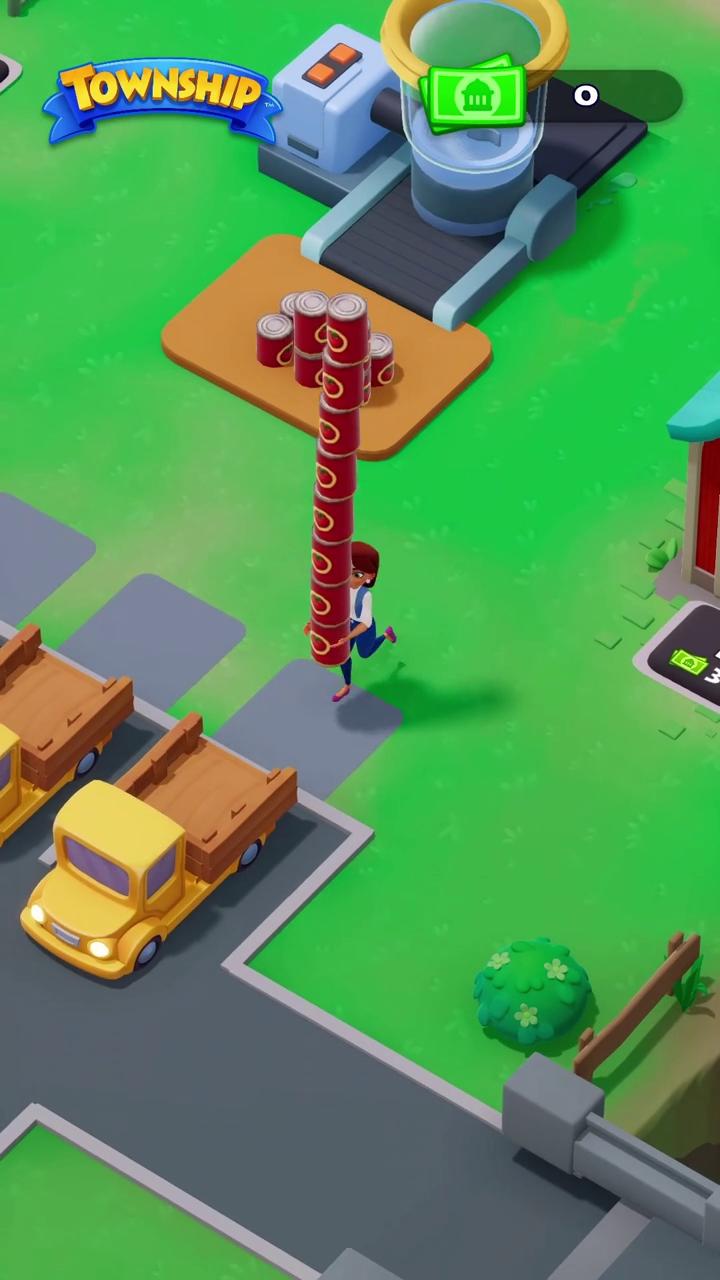 Creative #5 — 59 seconds, 20,923,766 impressions across 15,177 placements at 1,379 per placement. First seen 2026-04-03, one of four high-density assets launched within a week of each other.
The 910-day creative
Creative #22 was first observed on 2024-02-21 and was still recording placements on 2026-08-19. That is 910 consecutive days — two years and six months.
It is a 30-second video on the Android store record, carrying demoadCnt 183, and it has delivered 2,454,384 impressions across 1,742 placements. At 1,409 impressions per placement it is the second-densest asset in the account. At 0.3% of fleet impressions it is also one of the smallest.
It is not being protected because it wins. It is being run because Playrix does not appear to turn things off.
Look at the other long-lived assets:
| First seen | Days live | Impressions | Share of fleet | Impr/placement | Population |
|---|---|---|---|---|---|
| 2024-02-21 | 910 | 2,454,384 | 0.3% | 1,409 | high |
| 2025-04-05 | 501 | 19,045,244 | 2.0% | 31 | low |
| 2025-05-30 | 446 | 564,388,105 | 59.7% | 1,356 | high |
| 2025-05-30 | 446 | 5,419,325 | 0.6% | 1,362 | high |
| 2025-05-30 | 446 | 2,041,360 | 0.2% | 27 | low |
| 2025-09-16 | 337 | 2,536,213 | 0.3% | 30 | low |
Five creatives past 365 days, delivering 593,348,418 impressions combined — 62.8% of the fleet. Almost all of that is one asset. Strip out creative #1 and the remaining four veterans contribute 3.1%.
And the pattern extends across the publisher's portfolio. Homescapes has a creative first seen 2024-01-01 — 961 days — still live. Gardenscapes has one from 2024-07-01 — 779 days — still live. Township's 910-day asset is the middle of the Playrix distribution, not the tail.
For context, the next-longest-running creative in this teardown series is a Whiteout Survival playable at 698 days, followed by Last War at 507 and Vita Mahjong at 467. Playrix has three titles running assets older than Vita Mahjong's, simultaneously.
 Creative #7 — no recorded video duration, 19,045,244 impressions across 609,331 placements, first seen 2025-04-05 and still running after 501 days. The oldest low-density asset in the fleet.
 Creative #22 — 30 seconds, first seen 2024-02-21, still running after 910 days. The oldest active creative measured anywhere in this series — 212 days clear of the runner-up — and the second-densest in the account at 1,409 impressions per placement.
The Playrix portfolio: the same split, three times
If the two-population structure were a Township artefact, it would not repeat. It repeats.
| Title | Creatives sampled | High-density count | High-density impr/placement | Low-density count | Low-density impr/placement | Oldest active asset |
|---|---|---|---|---|---|---|
| Township | 30 | 7 | 1,120 – 1,410 | 23 | 25 – 33 | 910 days |
| Gardenscapes | 10 | 9 | 1,112 – 1,426 | 1 | 52 | 779 days |
| Homescapes | 10 | 9 | 1,075 – 1,454 | 1 | 58 | 961 days |
| Combined | 50 | 25 | 1,075 – 1,454 | 25 | 25 – 58 | — |
Fifty creatives across three titles. Twenty-five in the high band, twenty-five in the low band, and no creative anywhere between 58 and 1,075. The demoadCnt marker predicts which side every one of them lands on.
Where the titles differ is the mix. Gardenscapes and Homescapes are dominated by the high-density population — 95.7% and 99.7% of impressions respectively. Township is at 71.4%. And in placement terms the divergence is sharper still: Homescapes runs 93.0% of its placements through the high-density regime, Gardenscapes 46.2%, and Township only 5.1%.
So Township is the title where Playrix leans hardest on the low-density regime. Whether that reflects a different audience strategy, a different placement mix, or simply a bigger low-cost testing programme is not resolvable from creative data. But it is a measurable difference in how one publisher runs three products that otherwise look identical in the ad library.
 Creative #15 — 45 seconds, 5,419,325 impressions from just 3,978 placements at 1,362 per placement,
 demoadCnt 159. Launched the same day as the fleet leader and running the same 446 days.
Two store records, two very different mixes
The 30 creatives resolve to two store records: iOS product ID 638689075 and Android package com.playrix.township. Both are published by Playrix; the source assigns them different developer IDs.
| Store record | Creatives | Impressions | Share | Placements | Impr/placement | Avg age | High-density assets |
|---|---|---|---|---|---|---|---|
iOS 638689075 | 18 | 814,711,979 | 86.2% | 8,810,722 | 93 | 147 days | 1 of 18 |
Android com.playrix.township | 12 | 130,112,924 | 13.8% | 849,122 | 153 | 245 days | 6 of 12 |
The iOS record is where the volume is — 86.2% of impressions and 91.2% of placements — but almost all of it runs through the low-density regime. Its single high-density asset happens to be the fleet leader.
The Android record is the opposite: half its creatives are high-density, its average asset is 98 days older, and it holds the 910-day veteran and both surviving members of the 2025-05-30 triplet's high band.
The practical warning is the same one that applies to every multi-platform account in this series: a single-record pull produces a materially wrong picture. Look only at iOS here and you would conclude Township runs a broad, low-density fleet with one anomalous winner. Look only at Android and you would conclude it runs a small, dense, veteran-heavy fleet. Neither is Township.
Duration: 59 seconds is the house length
| Duration band | Creatives | Impressions | Share |
|---|---|---|---|
| 41–60s | 17 | 724,224,792 | 76.7% |
| No video duration | 11 | 207,836,726 | 22.0% |
| Over 60s | 1 | 10,309,001 | 1.1% |
| 21–40s | 1 | 2,454,384 | 0.3% |
Fourteen of the seventeen assets in the 41–60 second band are exactly 59 seconds. Three are 45 seconds. Township is not experimenting with runtime; it is producing one length and occasionally a second.
That makes the two 30-second and 119-second outliers worth naming.
The 30-second asset is the 910-day creative. It is the only sub-40-second video in the fleet and the oldest thing in it. Whatever produced it is not the process producing today's 59-second assets.
The 119-second asset is creative #9, first seen 2026-06-16, delivering 10,309,001 impressions across 378,860 placements at 27 per placement. A two-minute ad is unusual in any mobile game fleet, and this one sits firmly in the low-density population — it is not a premium-inventory experiment, it is a long cut being served into the same cheap surfaces as everything else in that group.
Eleven creatives have no recorded video duration at all, carrying 22.0% of impressions. All eleven are low-density, with rates between 26 and 33.
 Creative #9 — 119 seconds, the longest asset in the fleet. 10,309,001 impressions across 378,860 placements at 27 per placement, first seen 2026-06-16.
Build order and cadence
Sorted by first-seen date, Township's fleet is a thin trickle through 2024 and 2025 followed by a dense 2026.
| Period | Creatives launched | Impressions | Share |
|---|---|---|---|
| 2024 | 1 | 2,454,384 | 0.3% |
| 2025 | 6 | 706,067,235 | 74.7% |
| 2026 (through 19 Aug) | 23 | 236,303,284 | 25.0% |
Seven creatives launched before 2026 carry three-quarters of the fleet's impressions. Twenty-three launched in 2026 carry one quarter.
That is not a decline in creative quality — it is a consequence of the mix. Of the seven pre-2026 assets, three are high-density including the leader. Of the twenty-three 2026 assets, four are high-density and they were all launched inside a single week (2026-04-01, 04-01, 04-03, 04-07).
That week is the most interesting date in the build order. Playrix put four high-density Android assets into market in seven days and has not launched another one in the 134 days since. Everything shipped after 2026-04-07 — nineteen creatives — is low-density.
By month, 2026 launches run: January 2, March 1, April 6, May 4, June 3, July 7. The July figure is the highest of the year, and every one of those seven assets is low-density.
Two readings are available and the data does not settle between them. Either Playrix has shifted Township's buying toward the low-density regime deliberately, or the high-density assets are simply produced on a slower cycle and the next batch has not arrived. The observable that separates them is whether a new creative with demoadCnt above 40 appears before the end of 2026.
 Creative #13 — 59 seconds, 5,769,954 impressions across 221,004 placements at 26 per placement. Same runtime as four high-density assets in the same account, and a 54x lower delivery rate.
 Creative #17 — no recorded video duration, 4,520,434 impressions in 28 days. One of seven assets launched in July 2026, all of them low-density.
Intensity: the leader is also the fastest
These impressions are a rolling 30-day window (2026-07-20 to 2026-08-19), not lifetime accumulation. Twenty-five of the thirty rows covered that window end to end, accounting for 98.5% of window impressions, so a per-day figure is meaningful here — but only with the window as the denominator for every row, never "days live".
| Rank | Impressions (30d) | Days live | Per-day (÷30) | Population |
|---|---|---|---|---|
| 1 | 564,388,105 | 446 | 18,812,937 | high |
| 2 | 112,636,988 | 239 | 3,754,566 | low |
| 3 | 53,737,010 | 140 | 1,791,234 | high |
| 4 | 51,097,620 | 163 | 1,703,254 | low |
| 5 | 20,923,766 | 138 | 697,459 | high |
| 6 | 20,843,261 | 134 | 694,775 | high |
| 7 | 16,962,350 | 75 | 565,412 | low |
| 8 | 10,309,001 | 64 | 343,633 | low |
| 9 | 6,443,916 | 43 | 214,797 | low |
| 10 | 4,520,434 | 28 | 150,681 | low |
With a shared denominator the ranking is simply the impressions ranking — which is the point: age buys nothing in this account. A 446-day creative and a 28-day creative are separated by their delivery, not by their tenure.
Creative #1 is the largest asset by a factor of five, still delivering 564,388,105 impressions in the last thirty days after 446 days in market. That is unusual — in most accounts measured in this series the intensity leader is a recent asset out-pacing an older, larger one. Here the 446-day veteran is still the most intense thing in the fleet by 2.7x.
For scale against the other accounts pulled on the same date:
| Advertiser | Largest creative, 30-day impressions | Age |
|---|---|---|
| Township (Playrix) | 564,388,105 | 446 days |
| Block Blast! (Hungry Studio) | 42,906,272 | 256 days |
Cross-advertiser figures elsewhere in this series were originally computed as impressions ÷ days-live, which is invalid against a rolling window; only the two rows above have been recomputed on the 30-day basis and are safe to compare here.
Township is not competing on burst. It is competing on duration: a creative still supplying over half a billion impressions a month after more than a year.
What transfers to your UA program
If you run media buying: check whether your own account has two populations. Compute impressions ÷ placements per creative and plot the distribution rather than the mean. If it is bimodal, your reporting average is describing a fleet that does not exist — Township's fleet average of 98 corresponds to zero of its thirty creatives. Any bid, budget or fatigue rule keyed to a fleet-wide average is being calibrated against a number nothing in the account produces.
If you run competitive intelligence: find the pre-computed marker before you compute anything. In Playrix accounts the demoadCnt field sorts every creative into the correct population with no exceptions across 50 assets and three titles. Fields like this exist in most ad-intelligence datasets and are usually ignored because their definition is unclear. Their predictive value does not depend on knowing what they mean.
If you run creative production: Township ships one runtime. Fourteen of seventeen video assets in the main band are exactly 59 seconds, and the delivery data shows runtime explains nothing — 59-second assets appear at both 25 and 1,410 impressions per placement. If your team is debating cut lengths in this genre, this dataset says the argument is downstream of a decision being made somewhere else entirely.
If you are competing with Playrix: the exploitable feature is the retirement policy, or the absence of one. Township has a creative that has been running since February 2024, Homescapes since January 2024, Gardenscapes since July 2024. Those are assets that have not been re-evaluated in more than two years, occupying inventory in a category where the rest of the field turns creative over in weeks.
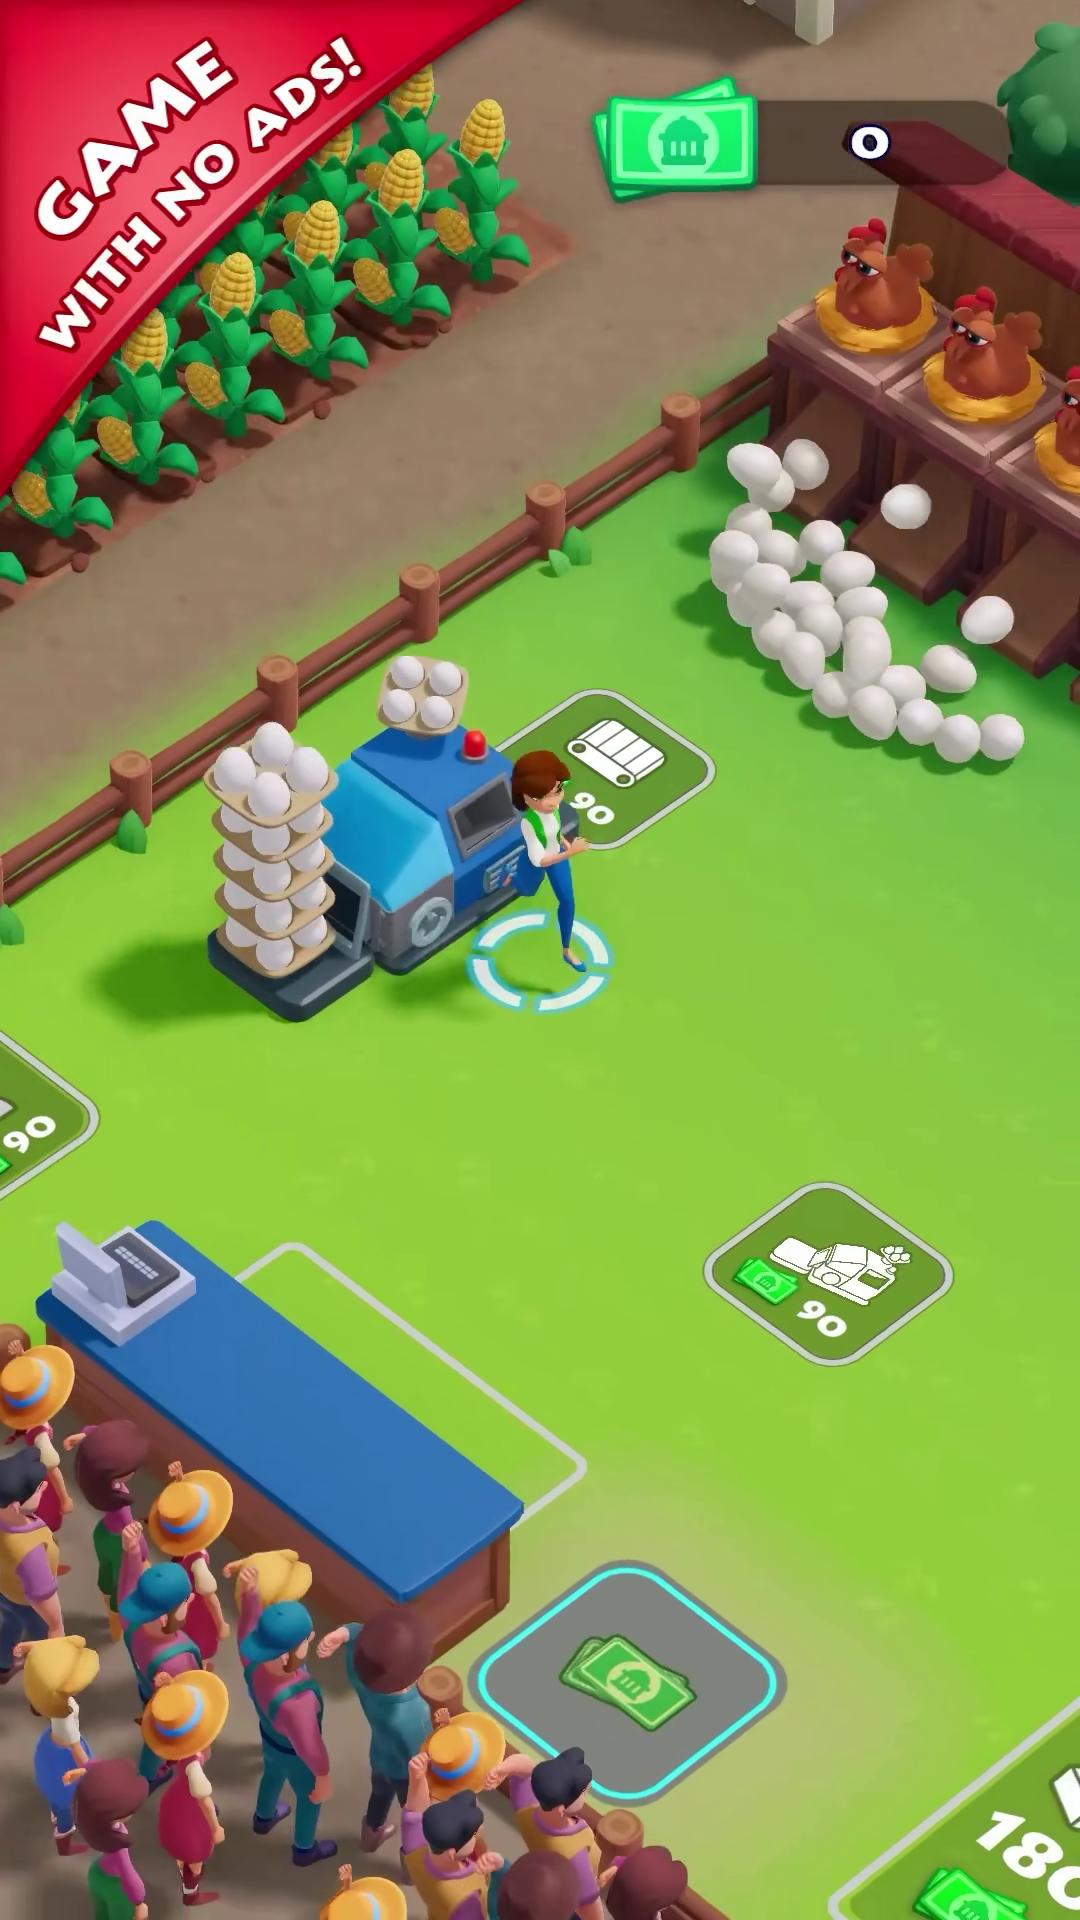 Creative #24 — 59 seconds, 2,289,989 impressions in 22 days at 30 per placement. The newest 59-second asset in the fleet and, like every creative launched since April, low-density.
Township against the wider farm-and-builder field
Township's direct genre rivals are harder to measure than its stablemates, because the category is fragmented and several competitors run very small US fleets.
| Title | Publisher | Creatives sampled | Impressions | Impr/placement | Oldest active asset |
|---|---|---|---|---|---|
| Township | Playrix | 30 | 944,824,903 | 98 (bimodal: 30 / 1,358) | 910 days |
| Gardenscapes | Playrix | 10 | 538,477,167 | 651 (bimodal: 52 / 1,349) | 779 days |
| Homescapes | Playrix | 10 | 526,661,935 | 1,258 (bimodal: 58 / 1,349) | 961 days |
| Family Island | Melsoft Games | 4 | 2,636,803 | 3,048 | 237 days |
The Family Island row carries a caveat: only four creatives in a ten-result sample resolved to Melsoft's store record, and three of the four were last observed before the pull date. On that evidence Melsoft is running a very small, very dense US fleet and has recently wound most of it down — but four creatives is not a fleet analysis, and this row should be read as a scale marker rather than a comparison.
The substantive point is that Township's real peer group is its own portfolio. Playrix's three measured titles deliver 2.01 billion combined impressions in the US with an identical two-population structure and creatives running for two-and-a-half years. No independent competitor in this genre is operating at anything like that scale or that time horizon.
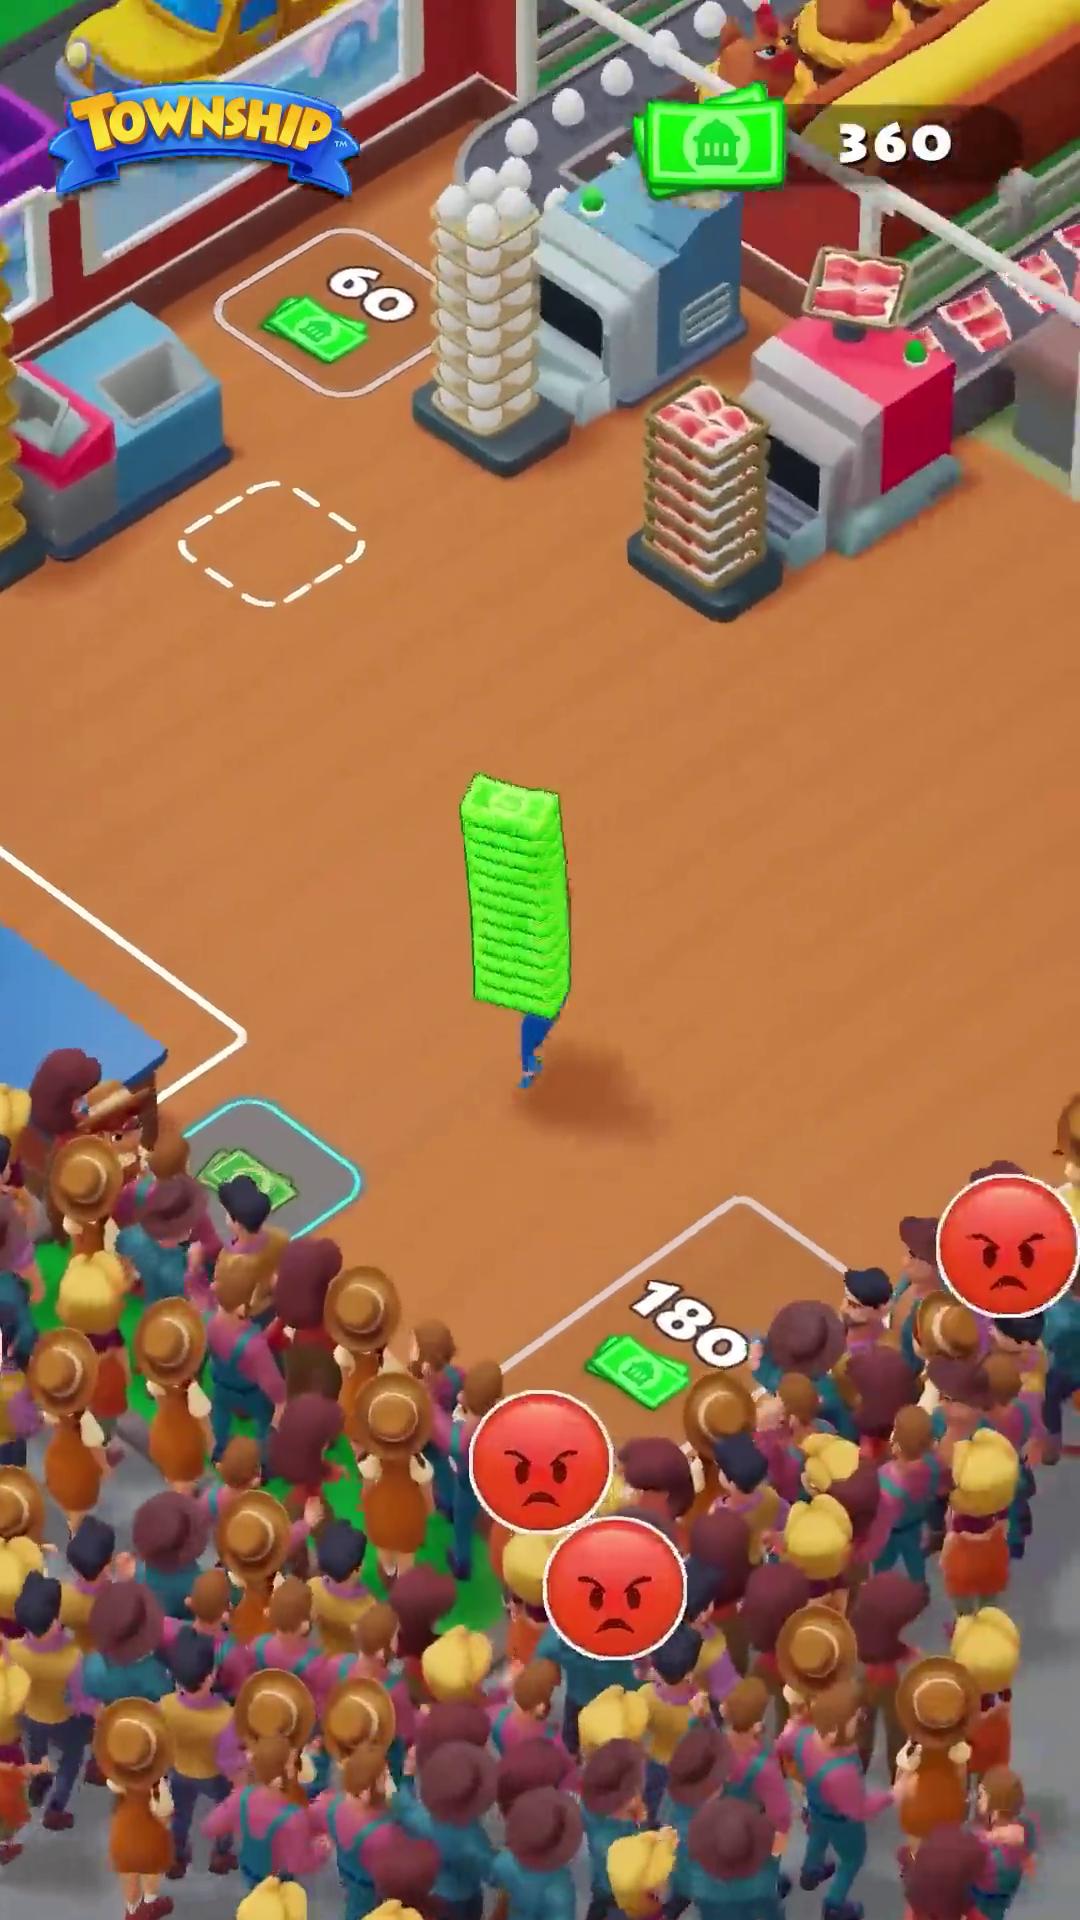 Creative #28 — 59 seconds, 1,625,105 impressions across 60,107 placements at 27 per placement, first seen 2026-01-24 and still running after 207 days.
What the copy shows
The platform records ad copy for only four of the thirty creatives, all carrying the same string: "BUILD YOUR DREAM TOWN! Welcome to Towns…" (truncated in the source). The remaining twenty-six have no recorded copy.
That is too thin to support a hook analysis, and it would be dishonest to build one. What it does establish is that where copy is visible, Township is running a single unvaried message — the same product proposition it has used for years, with no seasonal or offer-based variation captured in this sample.
Combined with the runtime finding — one length, repeated — the picture is of a fleet that varies almost nothing at the creative layer. The variance in this account is all on the buying side.
A falsifiable prediction
Prediction: the 910-day creative (30 seconds, first seen 2024-02-21) will still be live on 2027-02-21, reaching 1,096 days; and the high-density population will still contain no creative first seen after 2026-04-07 when re-pulled on 2026-11-01.
The basis for the first half: Playrix has not retired a single creative from the high-density population in any of its three measured titles, and it is currently running assets of 910, 961 and 779 days simultaneously. A 910-day asset surviving another 186 days is the conservative call.
The basis for the second half: nineteen consecutive creatives launched since 2026-04-07 have all landed in the low-density population. Either that is a deliberate shift, in which case the pattern holds, or the high-density batch is on a cycle longer than four months, in which case it also holds through November.
The interesting failure mode is a new high-density asset appearing, because it would date the production cycle for that population — something no amount of analysis of the current fleet can do. We will re-pull and report either way.
How to reproduce this teardown
- Pull placement counts alongside impressions. Every finding in this article is invisible in an impressions-only view. Township's leader and its 910-day veteran look like completely different assets by volume and identical by delivery rate.
- Plot the distribution of impressions ÷ placements, do not average it. A bimodal fleet produces a mean that describes no creative in the account. Look for gaps in the distribution, not central tendency.
- Check every available metadata field against the populations you find. Here
demoadCntsorted 50 creatives across three titles with zero errors. Test the fields you have before assuming the split is unexplainable. - Rule out the obvious variables explicitly. Duration, platform, age, size and playable attachment were each checked against the split here and each failed. Publishing the split without ruling those out would have produced a wrong conclusion.
- Pull the publisher's other titles. The Township split alone is a curiosity. The same split in Gardenscapes and Homescapes makes it a structural fact about how the publisher buys.
- Check last-observed dates on every asset. Twenty-nine of thirty were live here; the single exception, which stopped 2026-07-29, is the only retirement evidence in the dataset.
Methodology and data notes
- Source: AdMapix creative search and ranking APIs, queried 2026-08-19, country filter
US, sorted by impressions descending. - Sample: the top 30 creatives by impressions matching
Township, verified by store record. All 30 resolve to iOS product ID638689075or Android packagecom.playrix.township, both published by Playrix. The fleet extends beyond this sample; a third page returns 15 further creatives between 618,868 and 1,256,807 impressions. - Entity verification: creatives were matched to the product by store ID, not app name. The
developerIdfield is not stable in this source — the same product carries different developer IDs on its iOS and Android records — so it was not used as a join key. The title also appears as 夢想小鎮 (Township) on the ranking endpoint under the same product ID. demoadCntis a field returned by the source whose operational definition is not documented publicly. This article uses it strictly as an observed marker that correlates perfectly with the two delivery populations across 50 Playrix creatives; no causal claim is made about what it represents.- "Days live" is the span between the first-observed timestamp and the pull date. A creative is treated as live only if its last-observed date equals 2026-08-19. One creative did not meet that test and is labelled with its actual last-observed date, 2026-07-29.
- "Creative" versus "row." Each record returned by the creative index is a delivery record, not necessarily a distinct asset file: the same video can be trafficked under several rows with different end cards. For this fleet the two counts nearly coincide — 30 rows deduplicate to 17 video fingerprints plus 13 playable fingerprints, with 11 rows carrying a playable and no video, and only two rows sharing a video with another row. Impression and placement figures are per-row throughout and are unaffected by deduplication.
- "Placements" (
showCnt) counts recorded creative appearances, not unique users or unique publishers. Impressions-per-placement is a distribution-shape indicator, not a frequency metric. - Impressions are third-party estimates, not publisher-reported figures and not spend. Download figures are US-region estimates for the current ranking period.
- Cross-references to Gardenscapes, Homescapes, Family Island, Rips by Triumph, Block Blast!, Magic Sort!, MONOPOLY GO! and Whatnot come from pulls made on the same date with the same method and country filter. The Family Island sample is four creatives and is flagged as such in the text.
- Store listings: App Store and Google Play. Publisher information is available at Playrix.
- Coverage is limited to creatives observable through third-party ad monitoring, and figures change as new creatives enter rotation.
Frequently Asked Questions
How many ads is Township running in the US? At least 45 measurable creatives as of 2026-08-19; the top 30 by impressions total 944,824,903 impressions across 9,659,844 placements, and 29 of those 30 were still live on the pull date. A third page of results adds 15 more assets totalling 14,377,597 impressions, so the true fleet is larger than the sample analysed here.
What is Township's best-performing ad creative? A 45-second video first seen 2025-05-30, carrying 564,388,105 impressions across 416,109 placements — 59.7% of the measured fleet. It is also the fleet's intensity leader at 1,265,444 impressions per day, still the fastest asset in the account after 446 days in market.
How old is Township's oldest ad creative? 910 days. A 30-second video first observed on 2024-02-21 was still recording placements on 2026-08-19 — the oldest active creative measured anywhere in this teardown series, 212 days clear of the runner-up (a Whiteout Survival playable, 698 days). It carries only 0.3% of Township's impressions, so it survives because Playrix does not retire assets rather than because it performs.
Why do Township's ad creatives have such different delivery rates?
Because the fleet contains two structurally separate populations. Seven creatives deliver 1,120 to 1,410 impressions per placement while twenty-three deliver 25 to 33, with no creative in between. The seven high-density assets take 5.1% of placements and produce 71.4% of impressions. The split tracks a metadata field the source labels demoadCnt — 44 to 183 for the high group, 1 to 4 for the low group — and holds across 50 creatives spanning Township, Gardenscapes and Homescapes without a single exception.
Is the two-population split just about ad length or platform? No, and both are ruled out directly by the data. Fourteen Township creatives are exactly 59 seconds: ten deliver at 25–32 and four at 1,120–1,410. On platform, the high-density group contains both iOS and Android assets, and the two platforms are indistinguishable within it (1,356 versus 1,369). Three 45-second creatives launched on the same day, 2025-05-30, split 1,356 / 1,362 / 27.
Is Township growing or declining? Growing, modestly. US downloads are 850,227 at +2.03% period-over-period, which puts it among a small minority of games in the US top 100 with a positive change — the surrounding rows include Block Blast! at -22.63%, Gossip Harbor at -19.06% and MONOPOLY GO! at -14.23%.
Does Township use playable ads? Eighteen of its thirty creatives carry a playable attachment, all of them in the low-density population — none of the seven high-density assets has one. But playable attachment does not explain the delivery split: Magic Sort! attaches playables to 9 of 10 creatives and delivers at 1,496 impressions per placement, while Block Blast! attaches to 29 of 30 and delivers at 31.
Want to know whether your own fleet is actually two fleets? Per-creative impressions, placement counts, first-seen and last-seen dates, duration and the metadata fields that separate delivery regimes are all live in AdMapix, filterable by country, publisher and store ID. Create a free account to run this teardown on any title in your category, or see plans for full historical access.
Data source: AdMapix third-party ad intelligence estimates, United States, retrieved 2026-08-19. Impression and download figures are modelled estimates for comparative analysis and are not publisher-reported. Figures change as new creatives enter rotation.
Related Reading
- Ad strategy teardowns (series index) — every teardown in the series, in publication order
- Mobile game ads guide: formats, examples and research — the format matrix, research workflow and KPI guardrails every teardown in this series applies
- Grand Games — 13.7B impressions behind just 4 videos — a permutation machine
- Rips by Triumph — the standing jump — 5.98B impressions, no creative older than the launch
- Bus Traffic Fever! — one asset carrying 66% of a 3B-impression fleet
Turn these observations into your next creative study
Open the creative library and select samples for your market, network and research question.
Related Articles
Rips by Triumph Ad Strategy in 2026: The Standing Start — 6 Billion Impressions From a Fleet With No Creative Older Than 134 Days
A creative-level teardown of Triumph Arcade's US user acquisition for Rips by Triumph, the only title in this teardown series ranking on both the US download chart and the revenue chart. Its top 30 ad entries account for 5.98 billion impressions in the 30 days to 2026-08-19, and not one was first seen before 2026-04-07. A single 47-second asset launched 2026-06-30 carries 63.0% of that total — 9.9 times the second-largest entry — and the account runs zero playables.
Gossip Harbor Ad Strategy in 2026: One 25-Second Video File Carries 70.5% of Everything
A creative-level teardown of Microfun's US user acquisition for Gossip Harbor. Fifteen ad entries account for 6,381,902,914 impressions, all still live — but they resolve to only fourteen distinct video files, and one 25-second file appearing under two entries carries 70.5% of all delivery. The whole interactive layer is a single playable shared across five entries. Rewritten from scratch after the underlying data changed roughly 2x in one day; the correction is documented in full.
Meowdoku Ad Strategy in 2026: The Quiet Machine — Two SKUs, No Batches, No Sweeps, 637 Million Impressions
Meowdoku sits at #8 on the US download chart with the least dramatic ad operation in this series: no launch batches, no synchronized resets, no format experiments. Just a steady one-or-two-a-week drip of 27–60-second cat-sudoku videos across two separate store SKUs — 637 million model-estimated impressions, 13 of 15 top creatives still live, and a placement fingerprint that splits cleanly along SKU lines. Sometimes the playbook is that there is no playbook drama.