
Roblox Ad Strategy in 2026: Creatives Launched in Three Days Carry 61% of Current US Delivery
A creative-level teardown of Roblox Corporation's US user acquisition, measured across the 30-day window ending 2026-08-19. Creatives first observed between 2026-07-02 and 2026-07-04 carry 930,645,210 of the window's 1,514,986,345 impressions — 61.4% — six weeks after launch. Roblox's iOS and Android creatives deliver at rates that differ by a factor of 105.
Roblox Corporation's US creatives delivered 1,514,986,345 impressions in the 30-day window ending 2026-08-19. 61.4% of that — 930,645,210 impressions — comes from creatives first observed in a single three-day window, 2026-07-02 to 2026-07-04. Widen it to everything first seen in July 2026 and the share reaches 71.3%.
Six weeks after those three days, a cohort launched in seventy-two hours is still carrying nearly two-thirds of everything Roblox delivers. That is a concentration of dependency, not a drip-feed.
A note on what these numbers are. The impression figures returned by this data source are rolling 30-day values, not lifetime totals. Everything below describes the window 2026-07-20 → 2026-08-19 unless stated otherwise. That distinction matters for one specific claim, which gets its own section: a cohort's share of current delivery is not the same thing as what that cohort produced when it launched.
There is a second finding underneath the first, and it is stranger. Roblox's iOS creatives deliver 2,004 impressions per placement. Its Android creatives deliver 19. Same game, same publisher, same country, same month — a 105x gap in how densely the two halves of the account are served.
Executive summary (TL;DR)
- The measurement is a 30-day window. 6,788 creative records, 814 distinct creative images, 1,514,986,345 impressions delivered between 2026-07-20 and 2026-08-19. These are not lifetime totals; the source returns rolling 30-day values.
- The top creative is a 30-second video first seen 2026-07-02, delivering 177,423,529 impressions across 34,564 placements in the window — 5,133 impressions per placement, the highest density in the account. It was still running on the pull date.
- 61.4% of window delivery comes from three days. Creatives first observed 2026-07-02 to 2026-07-04 carry 930,645,210 impressions, six weeks after they launched.
- Concentration is brutal. The top 100 creatives carry 93.6% of all impressions. The median record in the fleet delivers 13 impressions.
- iOS is the entire business. App ID
431946152(developer1873720918) accounts for 99.1% of impressions from 4,730 records. The Android packagecom.roblox.client(developer990293287) contributes 0.87% from 2,005 records. - Relative to the casual titles it shares a chart with, Roblox barely advertises. Vita Mahjong's single best creative carries 2.99x more impressions than Roblox's entire measured fleet. Roblox still out-downloads it 1.6 to 1.
- Five lines of copy carry the fleet. 675 records run "Test your reflexes, strategy, and bravery on Roblox." Four more lines account for another 1,684 records.
- Almost everything is 30 seconds or under. In the top 200 by impressions, the 26–31 second band holds 105 delivery rows — 85 distinct video files — and 932,667,584 impressions.
All figures are AdMapix third-party estimates for the United States, pulled 2026-08-19. Methodology and sampling limits are documented at the end.
Where Roblox sits on the US charts
On the US download ranking pulled the same day, Roblox is #14 overall and #3 among games, recording 2,029,022 downloads at -8.91% period-over-period. The publisher is Roblox Corporation, iOS product ID 431946152, developer ID 1873720918.
Only two games rank above it: Netflix Game Controller (2,192,963, -33.49%) and Meowdoku! (2,158,898, -27.00%). Roblox's -8.91% is the shallowest decline of the three.
| US download rank (games) | Title | Downloads | Change | Publisher |
|---|---|---|---|---|
| 1 | Netflix Game Controller | 2,192,963 | -33.49% | Netflix, Inc. |
| 2 | Meowdoku! | 2,158,898 | -27.00% | Oakever Games |
| 3 | Roblox | 2,029,022 | -8.91% | Roblox Corporation |
| 4 | Smash Fest! | 1,788,419 | -17.66% | Flow Games |
| 5 | Block Out! – Color Sort Puzzle | 1,768,050 | — | Play Time Games |
| 6 | Magic Sort! | 1,306,077 | -17.85% | Grand Games A.Ş. |
| 7 | Vita Mahjong | 1,256,369 | -25.41% | Vita Studio |
| 10 | Block Blast! | 1,127,181 | -22.63% | Hungry Studio |
| 11 | Fortnite | 1,014,136 | -10.60% | Epic Games Inc. |
| 17 | MONOPOLY GO! | 699,537 | -14.23% | Scopely |
Hold that table. The rest of this teardown is about how differently these titles buy, and how little the buying explains the ranking.
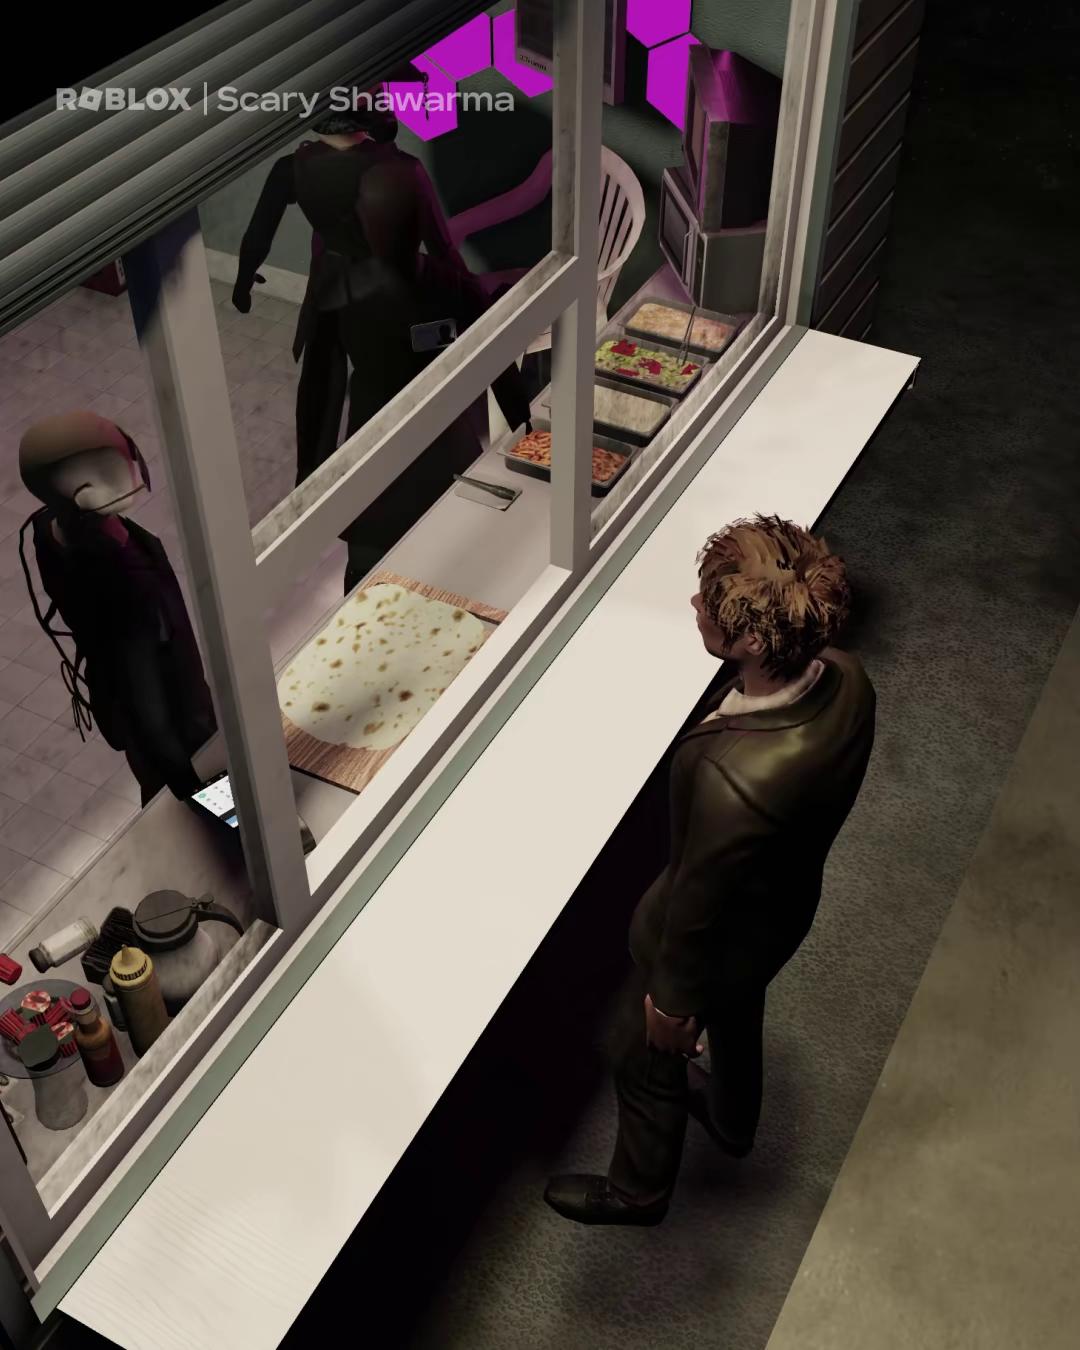 Roblox's top US creative: 177,423,529 impressions in the 30-day window across 34,564 placements, 30 seconds, first seen 2026-07-02, still running after 48 days. At 5,133 impressions per placement it is the densest-delivering asset in the account.
The three-day cohort that still carries the account
Group the window's delivery by when each creative was first observed and one three-day span dominates.
| First-seen window | Creative records | Window impressions | Share of window |
|---|---|---|---|
| 2026-07-02 to 2026-07-04 | 1,168 | 930,645,210 | 61.4% |
| Rest of July 2026 | 1,969 | 150,225,167 | 9.9% |
| All of July 2026 | 3,137 | 1,080,870,377 | 71.3% |
| Everything else (2024-07 to 2026-06, plus August) | 3,651 | 434,115,968 | 28.7% |
Four of the window's top five creatives were first observed on 2026-07-02 or 2026-07-03. So were seven of the top twelve. Creatives that entered the market across seventy-two hours in early July were still producing 61.4% of Roblox's US delivery six weeks later.
Read that as a statement about dependency, not about a launch spike. These figures measure 2026-07-20 → 2026-08-19; the three-day cohort's own launch period sits outside the window entirely. What the table shows is which creatives are carrying the account now.
Here is the same window's delivery grouped by first-seen month:
| Month first seen | Records | Impressions |
|---|---|---|
| 2025-06 | 41 | 29,405,309 |
| 2025-11 | 117 | 125,994,174 |
| 2025-12 | 64 | 29,237,378 |
| 2026-02 | 39 | 17,325,565 |
| 2026-03 | 62 | 59,377,546 |
| 2026-04 | 140 | 37,353,824 |
| 2026-05 | 748 | 38,511,071 |
| 2026-06 | 1,245 | 71,356,363 |
| 2026-07 | 3,137 | 1,080,870,377 |
| 2026-08 (partial, to the 19th) | 1,008 | 23,952,799 |
It is tempting to read that table as a production history — creative volume climbing (140 in April, 748 in May, 1,245 in June) while impressions stayed flat, then July switching the budget on. That reading is wrong, and it is worth showing why, because it is the single easiest mistake to make with this data source.
Every impression figure in that table is delivery inside the 2026-07-20 → 2026-08-19 window. The May cohort's 38.5 million is not what those creatives produced in May; it is what they were still producing three months later. To find out what May actually looked like, you have to query the May window directly.
We did:
| Query window | Rows sampled | Total impressions in that window |
|---|---|---|
| 2026-05-01 → 2026-05-31 | top 594 | 530,447,967 |
| 2026-07-01 → 2026-07-31 | top 600 | 1,302,462,547 |
Roblox was buying substantially in May. Its top 594 creatives delivered over half a billion impressions inside that month alone. The claim that "the buying only switched on in July" is false, and any analysis built on the single-window table above would have reached it.
What is true is that July was a step change. On comparable top-600 samples, July's in-month delivery is roughly 2.5x May's. And within the July window, creatives first seen in July already accounted for 1,075,550,607 of 1,302,462,547 impressions — 82.6% — so the new cohort took over its own month almost immediately, then went on to carry 61.4% of the following one.
(Those two rows are top-N samples at different windows, not full-fleet censuses; the pull caps out well before a complete count at any window. They establish the order of magnitude and the direction, which is what the claim needs.)
The August cohort is the one to watch. In the window measured here, 1,008 records first seen in August delivered 23,952,799 impressions between them. July's cohort is still carrying the account; August's has not yet been given anything to carry.
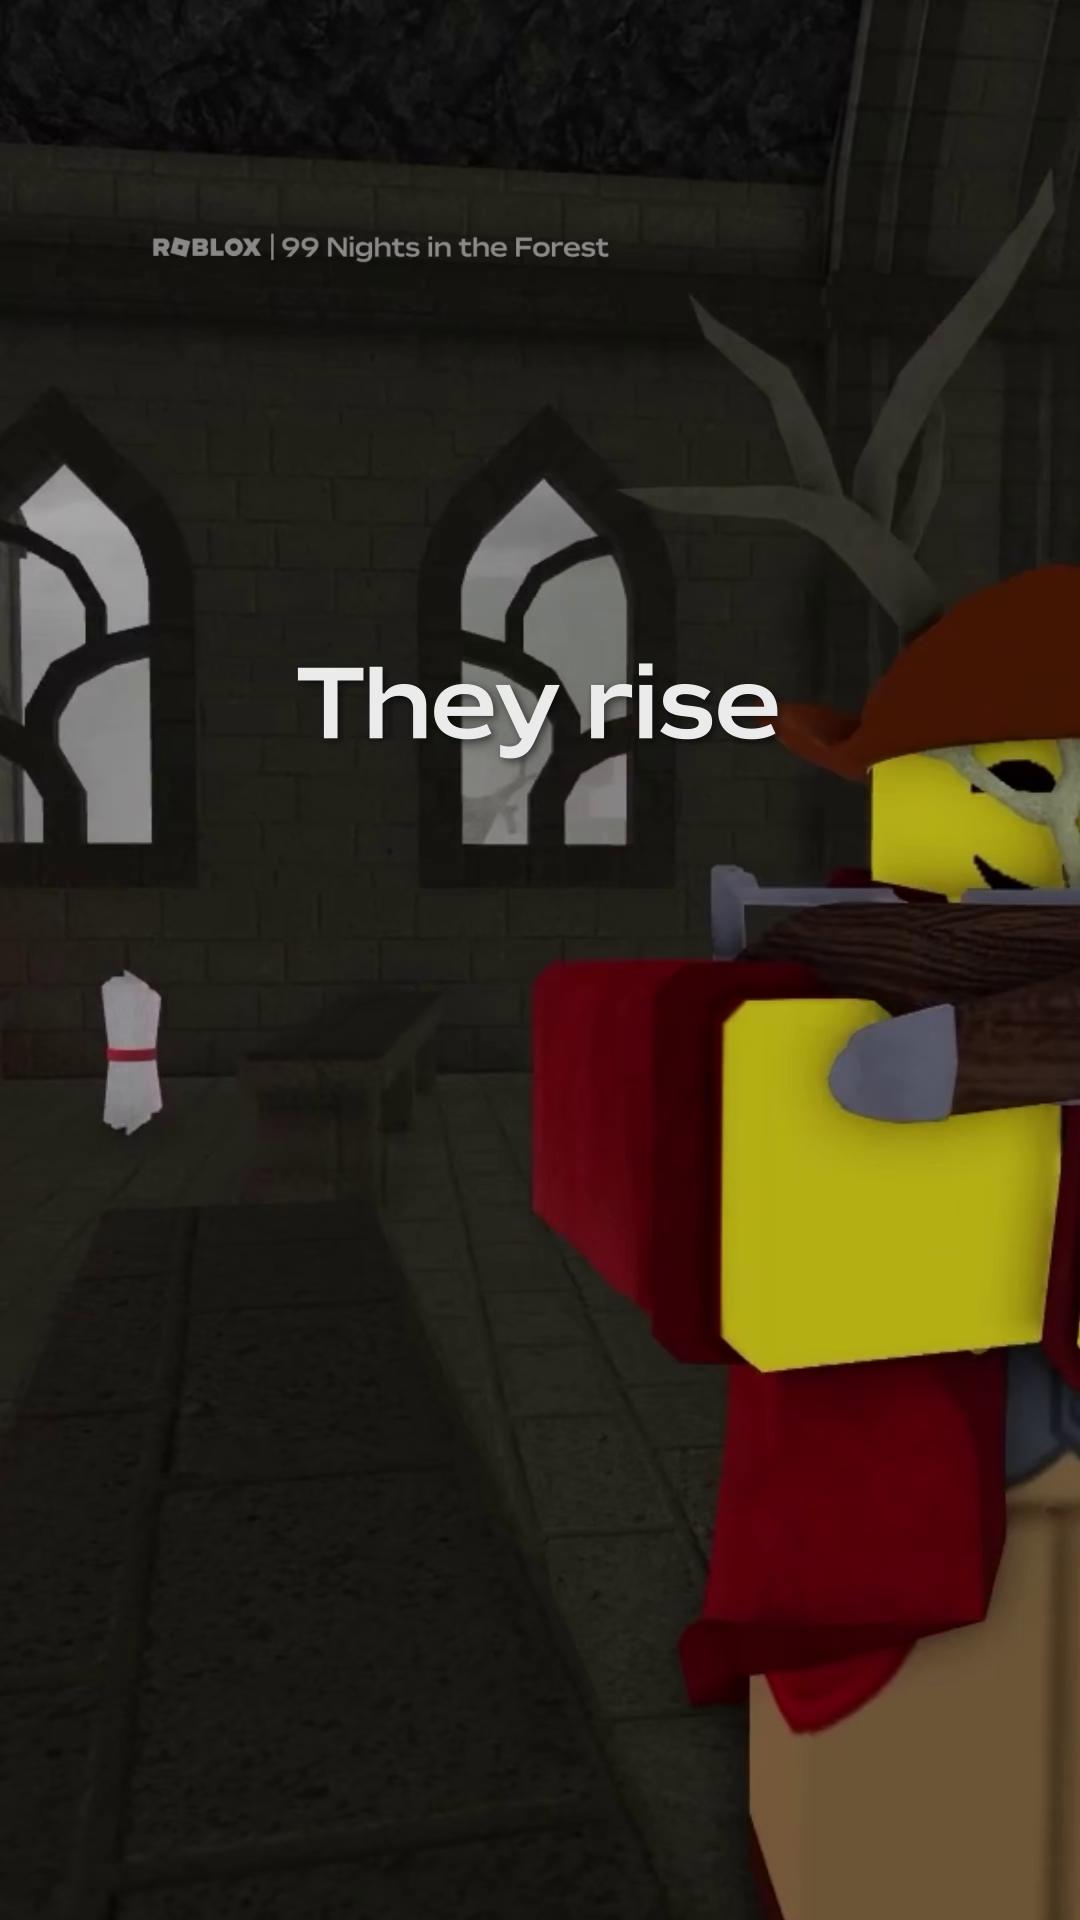 Creative #2 — 30 seconds, 124,969,657 impressions across 34,516 placements, first seen 2026-07-02. It ran almost exactly as many placements as the fleet leader (34,516 vs 34,564) but converted them into 30% fewer impressions.
The top twelve, creative by creative
Every one of these was first observed under the iOS entity, app ID 431946152, developer ID 1873720918. Every one carries demoadCnt of 3, indicating attached interactive units.
| # | Impressions | Placements | Impr/placement | First seen | Days live | Duration |
|---|---|---|---|---|---|---|
| 1 | 177,423,529 | 34,564 | 5,133 | 2026-07-02 | 48 | 30s |
| 2 | 124,969,657 | 34,516 | 3,621 | 2026-07-02 | 48 | 30s |
| 3 | 123,065,899 | 36,450 | 3,376 | 2026-07-03 | 47 | 20s |
| 4 | 81,278,751 | 28,341 | 2,868 | 2026-07-02 | 48 | 30s |
| 5 | 50,207,834 | 23,760 | 2,113 | 2025-11-14 | 278 | 30s |
| 6 | 47,419,205 | 16,253 | 2,918 | 2026-07-03 | 47 | 27s |
| 7 | 38,597,453 | 16,579 | 2,328 | 2026-07-03 | 47 | 30s |
| 8 | 38,200,906 | 15,630 | 2,444 | 2026-06-09 | 71 | 28s |
| 9 | 36,063,470 | 12,616 | 2,859 | 2026-07-03 | 47 | 28s |
| 10 | 34,849,248 | 13,202 | 2,640 | 2026-03-07 | 165 | 25s |
| 11 | 32,844,645 | 15,097 | 2,176 | 2026-07-16 | 34 | 15s |
| 12 | 22,831,745 | 8,422 | 2,711 | 2026-07-03 | 47 | 30s |
All twelve were still recording placements on 2026-08-19.
Creative #1 is the standout on two axes at once. It has the highest total, and at 5,133 impressions per placement it also has the highest delivery density — 42% above creative #2, which ran an almost identical number of placements. Two assets launched the same day, given the same placement volume, produced a 52-million-impression gap. Whatever separates them is inside the creative, not inside the media plan.
Creative #5 is the veteran: first seen 2025-11-14, still running 278 days later, and still ranked fifth on window delivery. It is the only pre-2026 asset in the top ten. Its 2,113 impressions per placement is the lowest density in the top ten — it holds its position on placement volume rather than intensity.
Creative #11 is the efficiency story. At 15 seconds it is half the length of most of the fleet, and it entered the market on 2026-07-16 — later than every creative above it except none. It still delivers 32,844,645 impressions in the window at 2,176 per placement, ahead of assets twice its length that have been running months longer.
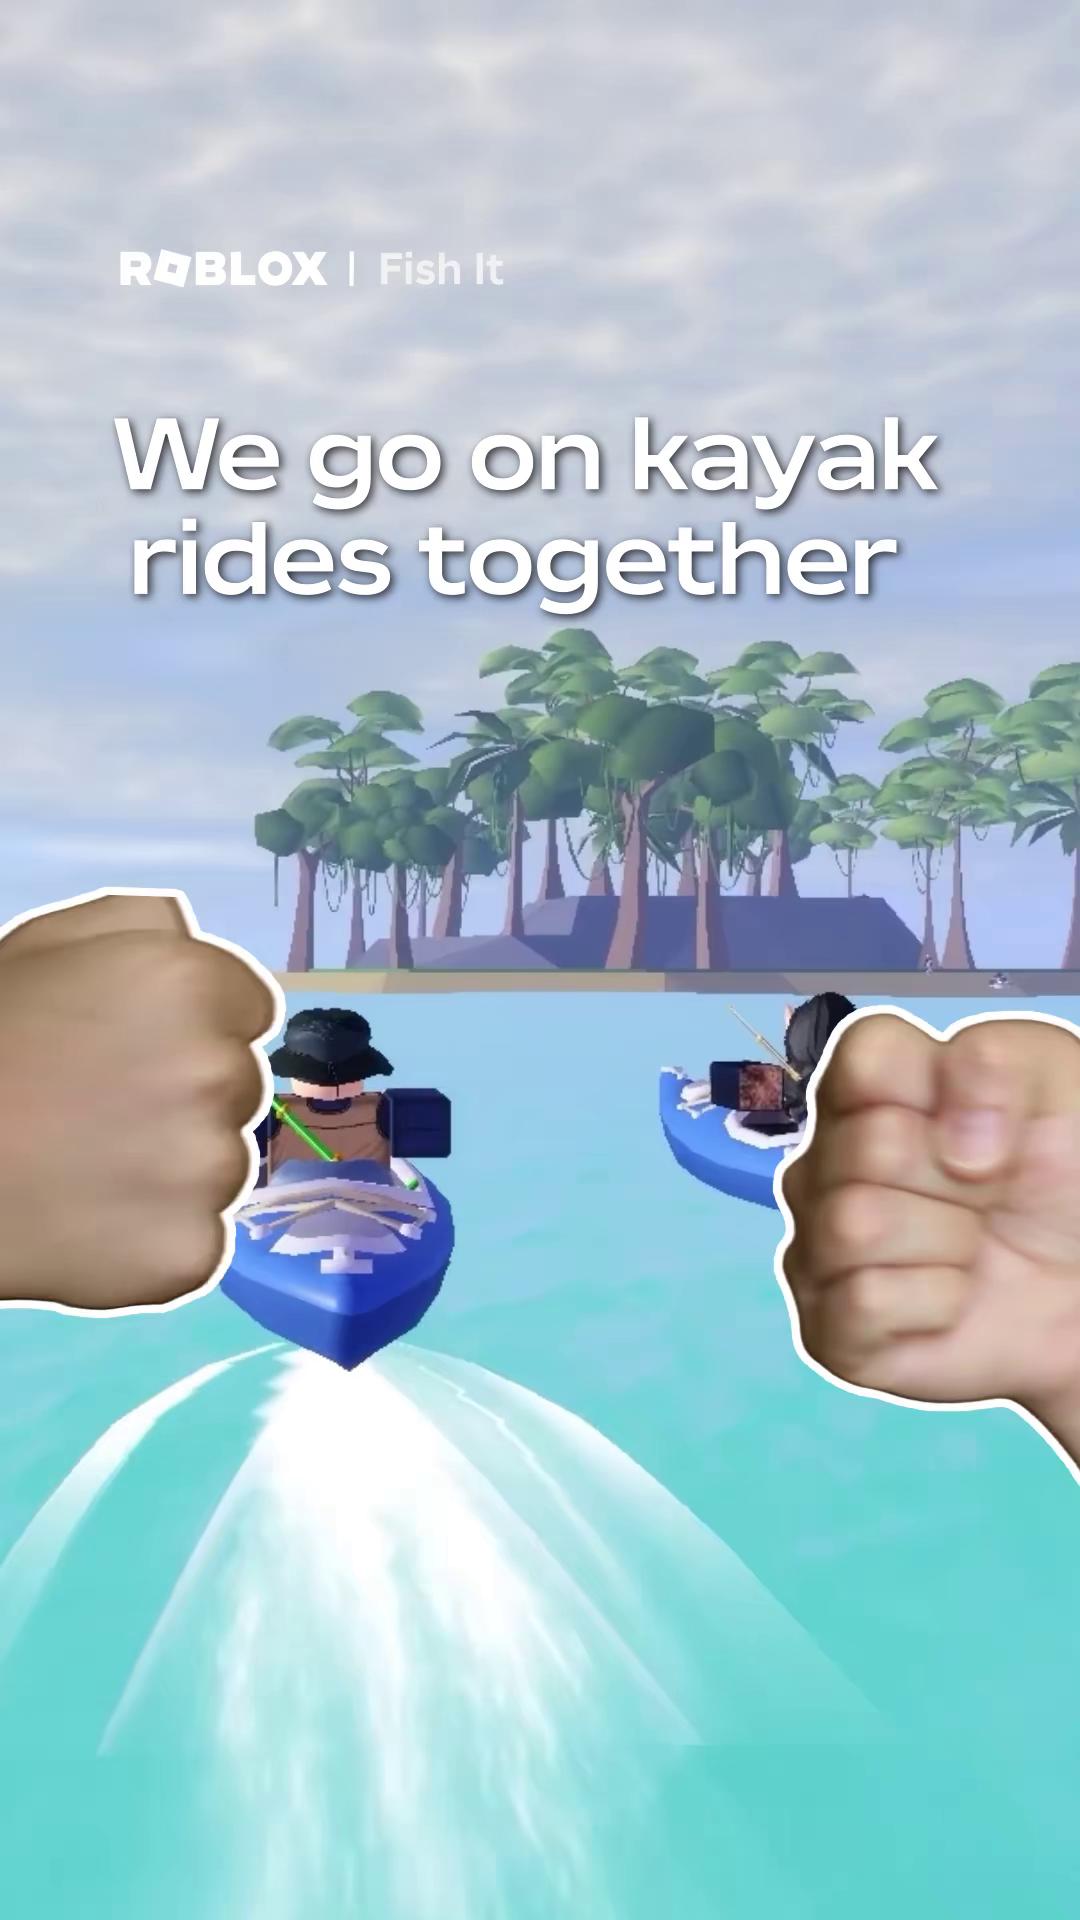 Creative #3 — 20 seconds, 123,065,899 impressions across 36,450 placements. It ran more placements than either creative above it and still finished third, at 3,376 impressions per placement.
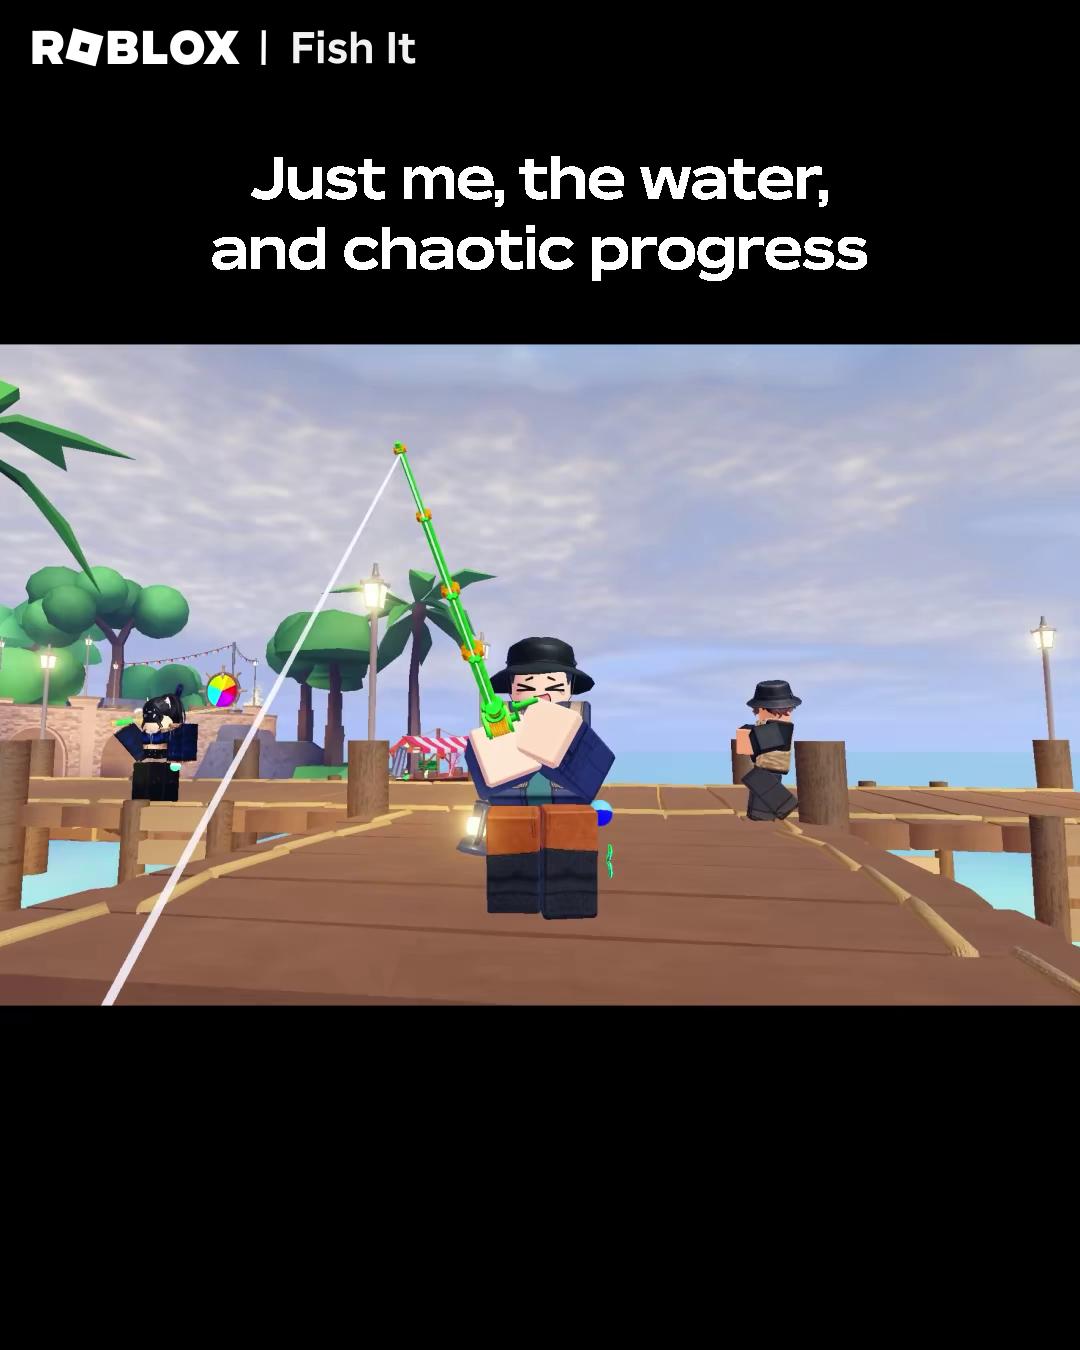 Creative #4 — 30 seconds, 81,278,751 impressions across 28,341 placements, first seen 2026-07-02. Fourth of the four assets launched on the fleet's biggest single day.
The 105x platform gap
This is the finding that should change how you read any competitor's fleet.
Roblox's creatives resolve to two distinct store entities in the data:
| Entity | Records | Impressions | Placements | Impr/placement | Share of impressions |
|---|---|---|---|---|---|
iOS 431946152 (dev 1873720918) | 4,730 | 1,501,817,653 | 749,482 | 2,004 | 99.1% |
Android com.roblox.client (dev 990293287) | 2,005 | 13,108,879 | 686,595 | 19 | 0.87% |
The two halves run comparable numbers of placements — 749,482 against 686,595, within 9% of each other. They produce impression totals that differ by a factor of 115.
Put differently: for every placement it wins, the iOS side of the account extracts 2,004 impressions and the Android side extracts 19. The median iOS record delivers 1 impression; the median Android record delivers 34. The iOS distribution is a small number of enormous winners on top of an enormous dead tail. The Android distribution is flat, small, and uniformly unproductive.
Why this matters more than it looks. If you pulled Roblox's fleet and ranked by placement count, you would conclude the account is split roughly evenly between platforms. It is not. On any measure of delivered attention, Roblox's US paid activity is an iOS program with an Android footnote attached.
We cannot tell from creative data alone whether this is a deliberate budget decision, a difference in the inventory each platform's campaigns reach, or an artefact of how each is observed. What we can say is that placement count and impression volume disagree violently here, and that anyone using placement count as a proxy for spend would get this account exactly backwards.
 Creative #6 — 27 seconds, 47,419,205 impressions across 16,253 placements, first seen 2026-07-03. Representative of the second tier of the July cohort: strong delivery density (2,918 per placement) on a fraction of the leader's placement volume.
Concentration: the head is the whole story
| Slice | Impressions | Share | Cumulative |
|---|---|---|---|
| Top 1 | 177,423,529 | 11.7% | 11.7% |
| Top 5 | 556,945,670 | 36.8% | 36.8% |
| Top 10 | 752,075,952 | 49.6% | 49.6% |
| Top 20 | 951,044,305 | 62.8% | 62.8% |
| Top 50 | 1,280,295,260 | 84.5% | 84.5% |
| Top 100 | 1,418,687,713 | 93.6% | 93.6% |
| Top 500 | 1,496,813,071 | 98.8% | 98.8% |
| Remaining 6,288 records | 18,173,274 | 1.2% | 100% |
The median record in Roblox's measured fleet delivers 13 impressions. Six thousand two hundred and eighty-eight records — 92.6% of everything observed — collectively deliver 1.2% of the impressions.
That tail is not a strategy. It is the residue of a system that generates and registers enormous numbers of creative variants, most of which are never given meaningful delivery. Reading a fleet like this by counting assets tells you nothing at all. Reading it by impression share tells you the account is about a hundred files wide.
Creative lifespan: nothing is protected, nothing is retired
| Days live | Records | Impressions | Share of impressions |
|---|---|---|---|
| 0 (never observed after first day) | 634 | 119,661 | 0.01% |
| 1–6 | 377 | 20,175,844 | 1.3% |
| 7–29 | 839 | 5,206,429 | 0.3% |
| 30–89 | 4,119 | 1,160,849,961 | 76.6% |
| 90–179 | 393 | 125,399,307 | 8.3% |
| 180–364 | 290 | 173,139,528 | 11.4% |
| 365+ | 136 | 30,095,615 | 2.0% |
Mean lifespan across the fleet is 59.4 days; the median is 44. The longest-running asset in the top 300 has been observed for 471 days (2025-04-29 to 2026-08-13) and carries 690,212 impressions — 0.05% of the fleet. The oldest still running on the pull date has been live 425 days (2025-06-20 to 2026-08-19) and carries 18,335,380.
The 30–89 day band carrying 76.6% of impressions is just the July cohort showing up in a different cut of the same data: those creatives were 34 to 48 days old on the pull date. There is no evidence here of a long-lived champion asset of the kind other publishers in this series protect for a year. Roblox's veterans are veterans by neglect, not by defence — the 471-day creative delivers 1,465 impressions a day, against the leader's 3.7 million.
2,012 records (29.6%) were still recording placements on the pull date, and they carry 94.4% of all impressions. The dead 70% of the fleet is dead weight in the literal sense: it contributes 5.6%.
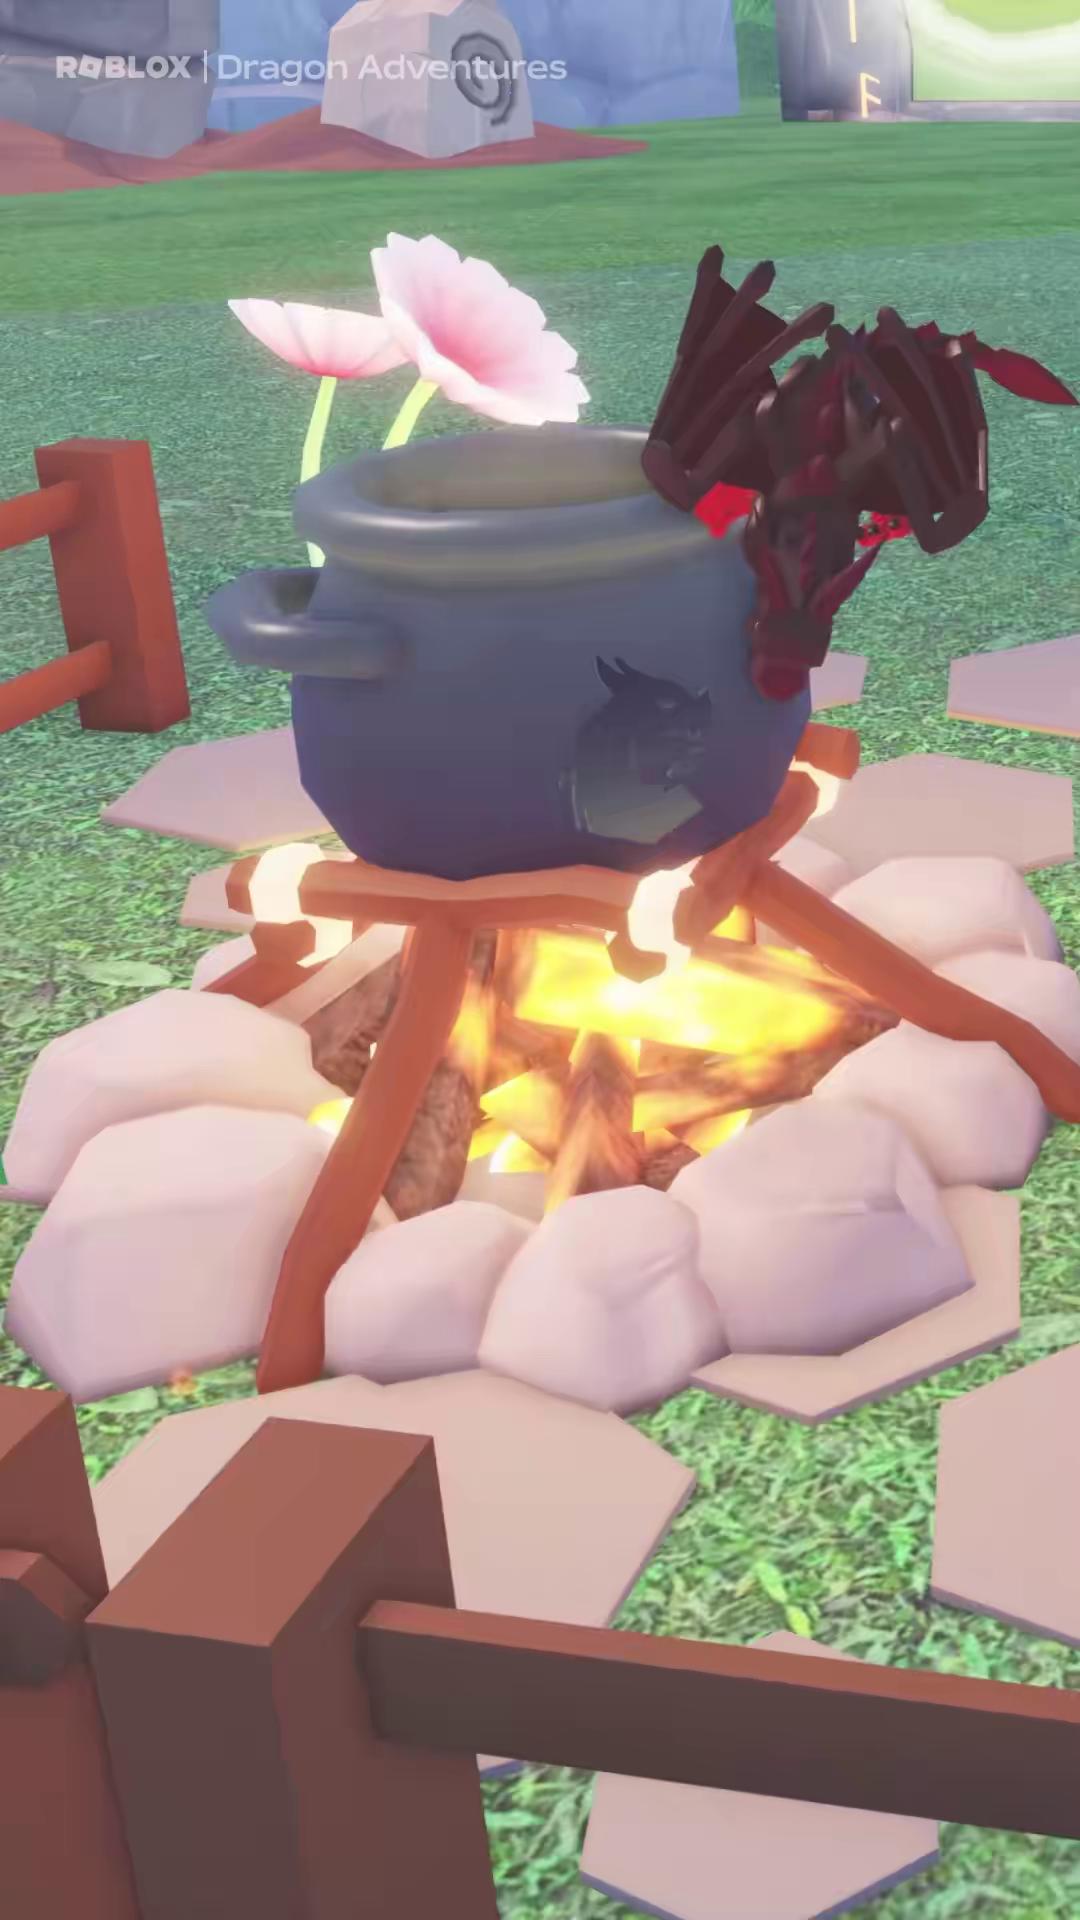 Creative #5 — 30 seconds, first seen 2025-11-14 and still running 278 days later with 50,207,834 impressions. The only pre-2026 asset in the top ten, and the closest thing Roblox has to a long-lived winner.
Duration: everything fits inside thirty seconds
Across the full fleet, the most common durations are 30s (1,804 records), 15s (950), 23s (629), 28s (562), 14s (528), 27s (463), 25s (440), 6s (342), 31s (251) and 26s (245).
Weighted by impressions, in the top 200 creatives:
A counting note before the table. Each row returned by the creative index is a delivery record, not necessarily a distinct video file — the same video is often trafficked under several rows. Across the top 200 rows, deduplicating by videoFp leaves 160 distinct videos. Impression figures are per-row and unaffected; asset counts are, so both are shown.
| Duration band | Rows | Video files | Impressions | Share |
|---|---|---|---|---|
| 26–31s | 105 | 85 | 932,667,584 | 63.7% |
| 16–25s | 42 | 26 | 295,237,236 | 20.2% |
| 1–15s | 52 | 48 | 235,260,918 | 16.1% |
| 32s+ | 1 | 1 | 1,499,540 | 0.1% |
| Total | 200 | 160 | 1,464,665,278 | 100% |
Exactly one creative in Roblox's top 200 runs longer than 31 seconds. Compare that to Vita Mahjong, whose fleet clusters at 44 to 60 seconds, or Meowdoku!, whose top creative is 59 seconds. Roblox has drawn a hard ceiling at half a minute and built everything under it.
The 1–15 second band is worth a second look, and it survives deduplication better than any other band: 52 rows resolve to 48 distinct videos, against the 26–31 second band's 105 rows resolving to 85. Roblox re-traffics its long cuts and ships its short cuts fresh. Those 48 videos carry 16.1% of top-200 impressions — and creative #11, at 15 seconds, out-paces most of the 30-second fleet on a per-day basis. If Roblox is testing a shorter format, the shorter format is winning on intensity even though it has not yet won on volume.
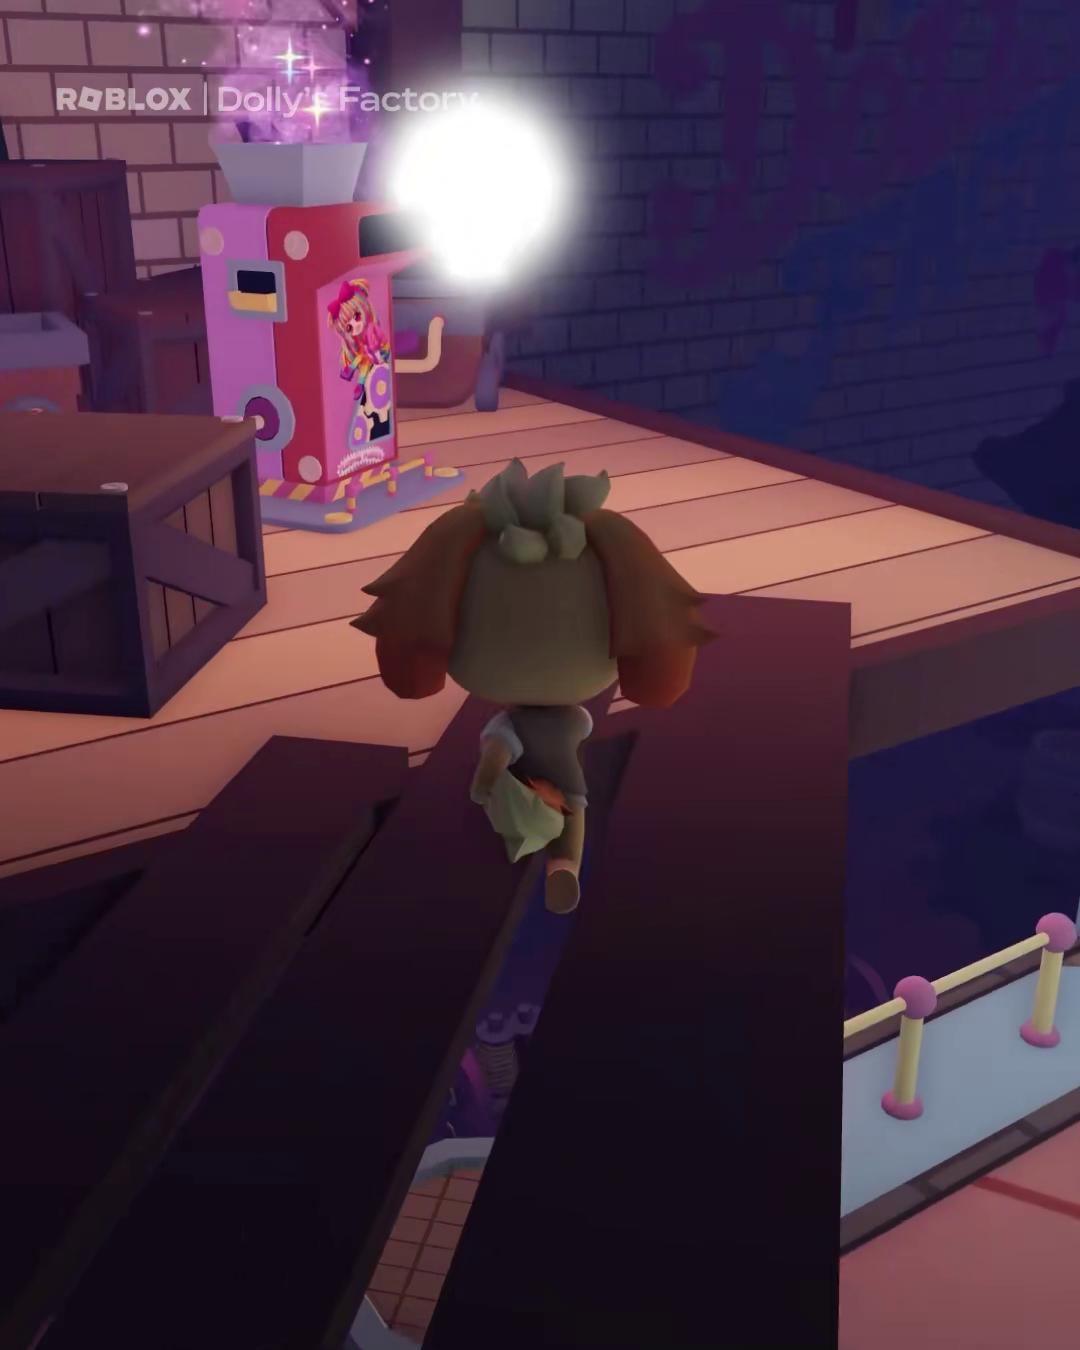 Creative #11 — 15 seconds, 32,844,645 impressions in the window, first seen 2026-07-16. The strongest short-form asset in the account, out-delivering assets twice its length that launched months earlier.
Five lines of copy
Where a mid-tier casual publisher writes hundreds of distinct hooks, Roblox writes five and repeats them.
| Ad copy | Records |
|---|---|
| "Test your reflexes, strategy, and bravery on Roblox." | 675 |
| "Customize your avatar with tons of hats, shirts, faces, gear, and more" | 429 |
| "Make friends, compete, and show your achievements." | 425 |
| "Grow your skills, conquer challenges, and rise to the top." | 422 |
| "There's always something new and exciting for you to join every day. Anytime, anywhere" | 408 |
| "Sparkle, shine, and show off your Roblox personality." | 72 |
Those six lines cover 2,431 records. Read them together and the positioning is unmistakable: not one of them describes a game. They describe a place with people in it — friendship, status, customisation, novelty, self-expression. There is no genre claim, no mechanic, no level, no puzzle. The word "Roblox" appears in only two of the six.
That is the correct copy strategy for a platform rather than a title, and it is a genuine strategic asset: Roblox never has to answer "what kind of game is it?", because the answer is "all of them." It also means Roblox's creative team is not solving the problem every casual publisher solves daily, which is finding a hook that survives another week in a saturated auction.
The trade-off shows up in the data. With five interchangeable lines and 814 distinct images, differentiation between assets has to come from the visual alone — which is exactly why creatives #1 and #2, launched the same day into the same placement volume, diverge by 52 million impressions.
How Roblox compares to the titles it shares a chart with
All figures below were pulled on 2026-08-19 with identical methodology, country filter and sort order.
| Title | Records | Total impressions | Top creative | Top 100 impressions | US downloads |
|---|---|---|---|---|---|
| Vita Mahjong | 6,944 | 11,133,701,196 | 4,529,362,167 | 10,981,004,623 | 1,256,369 |
| MONOPOLY GO! | 6,899 | 8,632,827,887 | 835,902,087 | 7,095,853,602 | 699,537 |
| Meowdoku! | 6,915 | 1,849,865,799 | 303,334,608 | 1,297,300,685 | 2,158,898 |
| Smash Fest! | 6,956 | 1,605,327,335 | 472,973,903 | 1,530,583,730 | 1,788,419 |
| Roblox | 6,788 | 1,514,986,345 | 177,423,529 | 1,418,687,713 | 2,029,022 |
| Block Blast! | 6,793 | 191,772,019 | 42,906,272 | 186,845,391 | 1,127,181 |
| Fortnite | 4,769 | 209,848,496 | 64,971,940 | 181,263,259 | 1,014,136 |
Roblox is the third-highest-downloading game on the US chart and fifth of seven on measured ad impressions.
The sharpest single comparison: Vita Mahjong's one best creative carries 4,529,362,167 impressions — 2.99 times Roblox's entire measured fleet. Vita Mahjong is a mahjong game from a publisher most people outside mobile UA have never heard of, ranked #7 among games with 1,256,369 downloads. Roblox out-downloads it 1.6 to 1 while running roughly one-seventh the paid air cover.
The comparison that does not work. It is tempting to divide each title's ad impressions by its downloads to get a "paid air cover per install" index. We are not publishing one, because the two figures have incompatible bases: impressions here are a rolling 30-day window while the download figures are the ranking provider's own period estimate. Dividing them produces a number that looks precise and means nothing. The impression comparison above stands on its own; the per-download normalisation does not.
That is the value of a platform with fifteen years of brand equity and organic search demand. It is also the reason the July burst is interesting: a publisher that does not need to buy volume chose to buy a great deal of it, in three days, in the middle of summer.
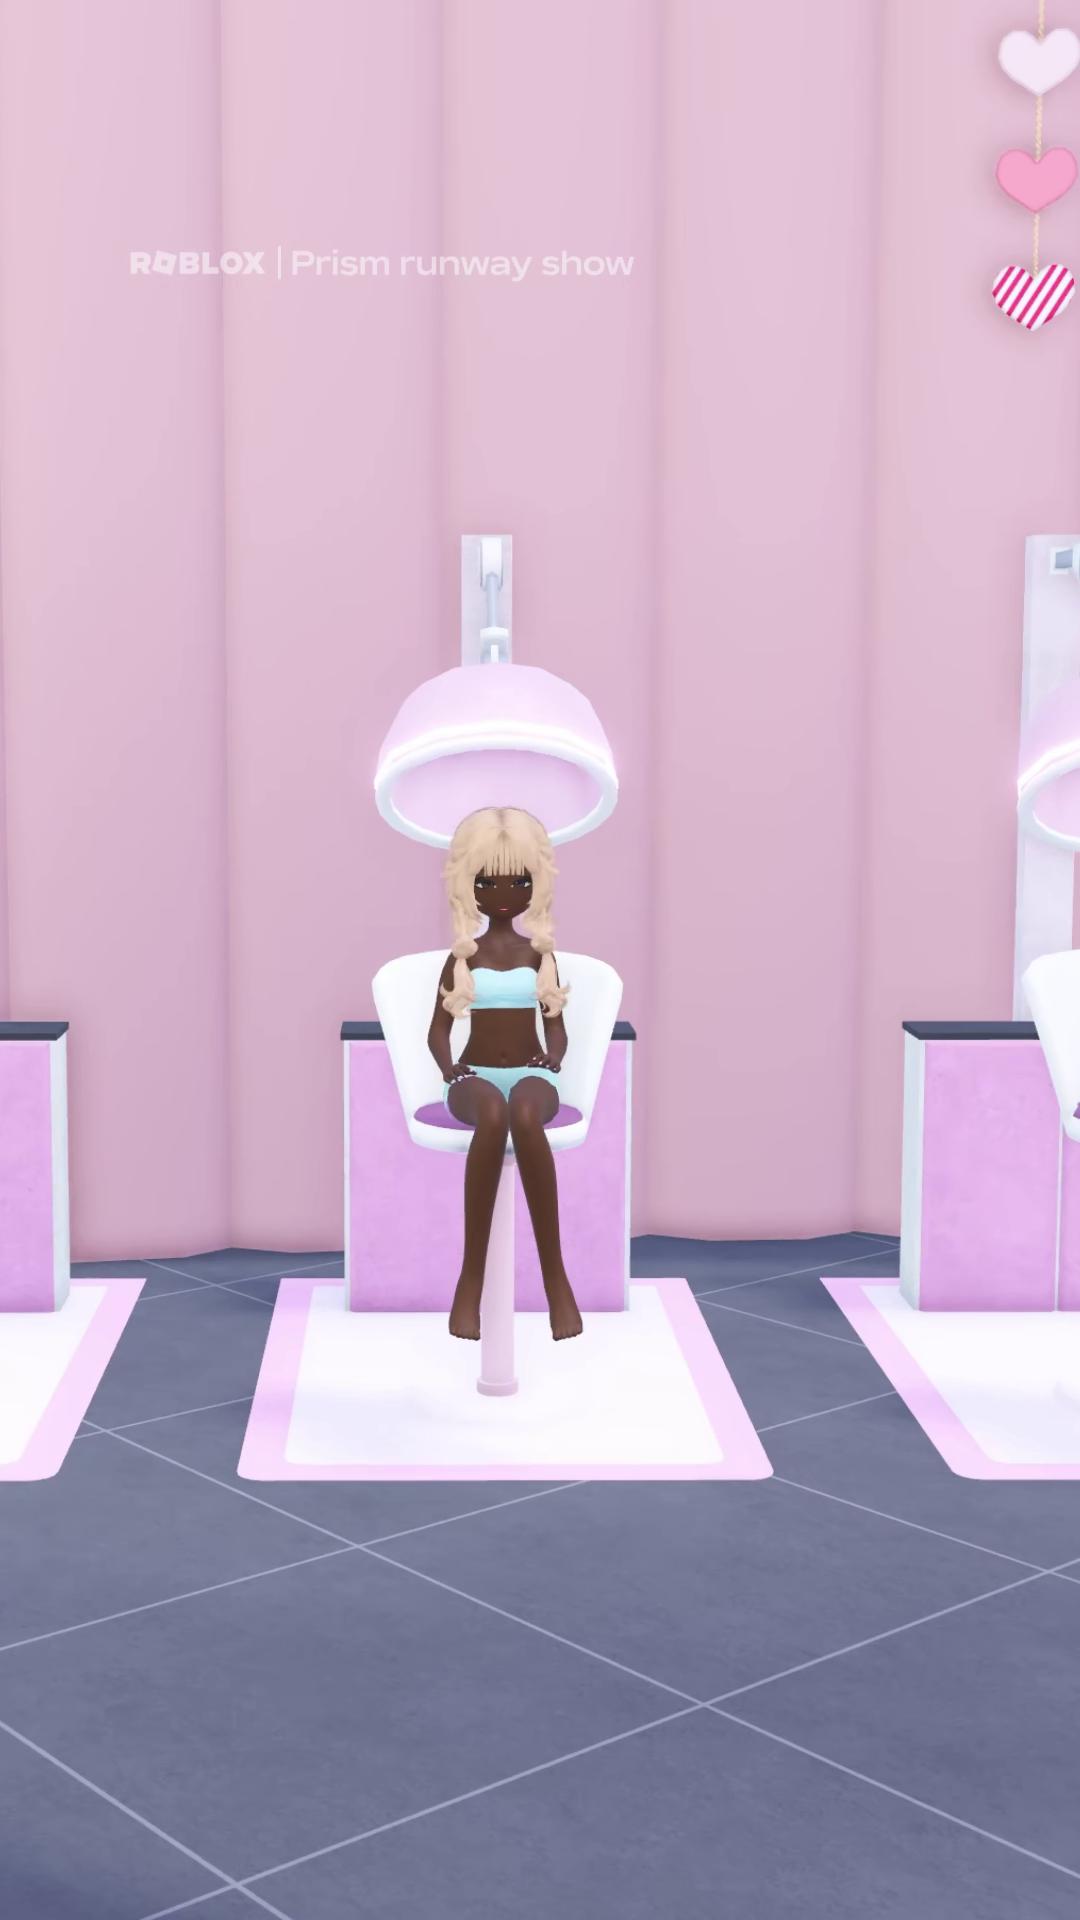 Creative #8 — 28 seconds, 38,200,906 impressions, first seen 2026-06-09 and running 71 days. One of the few pre-July assets to hold a top-ten position through the burst.
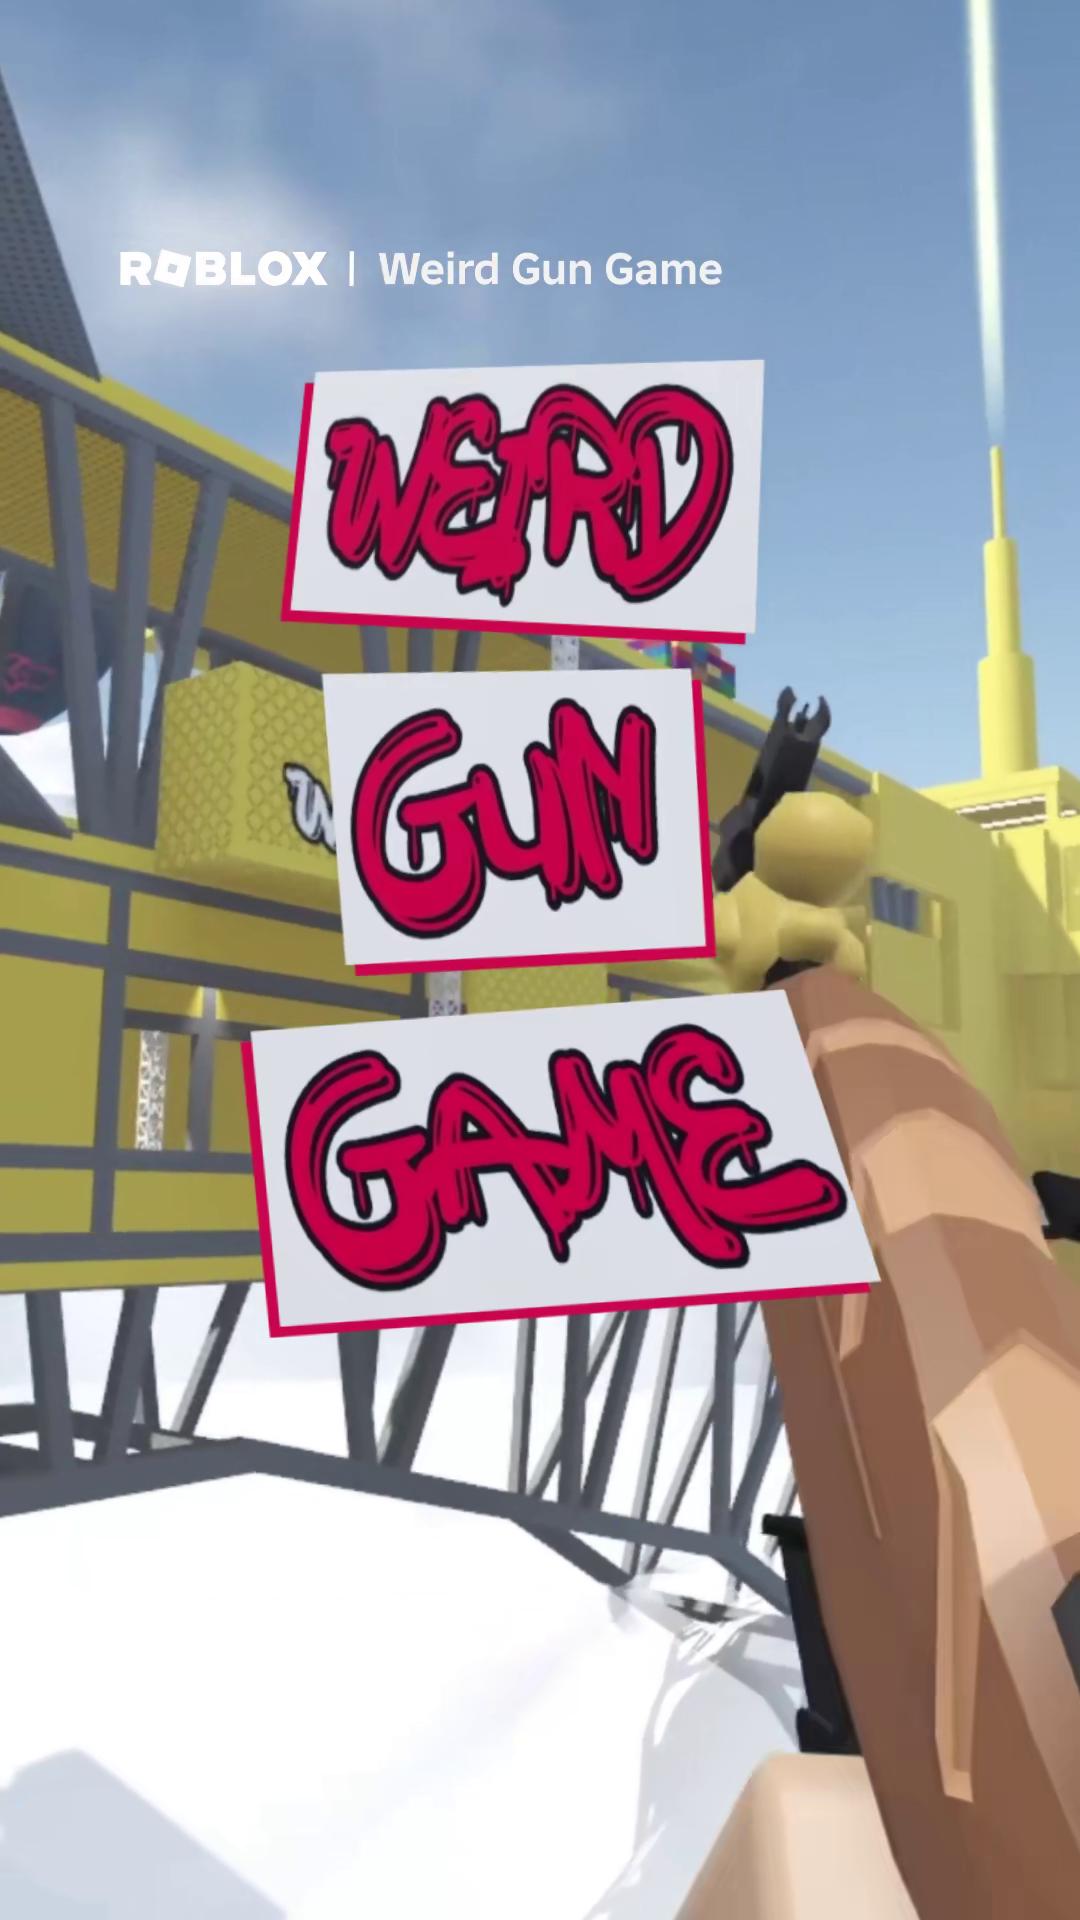 Creative #10 — 25 seconds, 34,849,248 impressions in the window, first seen 2026-03-07 and running 165 days. The second-oldest asset in the top ten, and evidence that Roblox's pre-July creatives are still delivering rather than switched off.
Why a summer burst, and what it says about the model
Three readings fit the data, and creative telemetry alone does not settle between them.
Reading one: it is seasonal, and it is about the US school calendar. A three-day launch in the first week of July puts maximum creative weight into the middle of the American summer holiday, when Roblox's core audience has the most unstructured time. On this reading the burst is a well-timed annual event and we should expect the fleet to go quiet through the autumn.
Reading two: it is defensive. Roblox is down 8.91% period-over-period. Netflix Game Controller and Meowdoku! are above it on the chart, both falling faster, but Smash Fest! and Block Out! are close behind and both are recent entrants. A publisher that has historically bought little may buy a lot when the top of the chart starts moving.
Reading three: it is a format test at scale. The fleet added 140 records in April, 748 in May and 1,245 in June while generating almost no impressions — that is the signature of building and registering inventory. July is when that inventory was funded. On this reading the burst is not a campaign but the end of a production ramp, and the interesting question is what happens to the 1,008 records added in the first nineteen days of August.
The August cohort is the discriminator. It has produced 23,952,799 impressions in nineteen days — 1.26 million a day across a thousand records, against creative #1's 3.7 million a day on its own. If August's cohort stays at that rate, reading one is right and July was a seasonal event. If August's cohort starts accelerating in September, reading three is right and July was the first of several funded waves.
What transfers to your UA program
If you run competitive intelligence: never estimate a competitor's activity from creative count, and never from placement count. Roblox's fleet contains 6,788 records; a hundred of them carry 93.6% of the delivery. Its iOS and Android halves run comparable placement volumes and differ 115-fold in impressions. Both of those trapdoors are invisible unless you compute impressions per placement per creative and sort by it.
If you run media buying against a platform-scale competitor: the useful signal is not their steady state, it is their burst timing. Roblox's baseline is low enough that you can operate alongside it for most of the year. For roughly six weeks after 2026-07-02 you were bidding against a fleet delivering more than three billion impressions a month. Knowing the date that starts is worth more than knowing the annual total.
If you run creative production: Roblox's five-line copy set is only available to a product that does not need to explain itself. If you are buying for a single title, the opposite discipline applies — but the duration finding does transfer. One creative in Roblox's top 200 runs longer than 31 seconds. Its best short-form asset, at 15 seconds, out-delivers most of its 30-second fleet despite launching later than almost all of them. If your team is producing 45- and 60-second cuts for a young-skewing audience, this dataset is an argument for testing the half-length version before the full-length one.
If you are competing with Roblox for the same young audience: the exposed flank is Android. 0.87% of Roblox's measured US impressions land on the Android side of its account, from 2,005 records that deliver 19 impressions per placement. Whatever is happening there — deliberate de-prioritisation or a measurement gap — it is not a wall of paid competition.
A falsifiable prediction
Prediction: on a re-pull at 2026-11-30 using the same 30-day-window default, no single Roblox creative first observed in August or September 2026 will exceed 100,000,000 window impressions, and the July 2026 cohort will still account for more than 40% of Roblox's measured US window delivery.
The basis: the August cohort has delivered 23,952,799 impressions across 1,008 records in nineteen days, a rate roughly 1.5% of what the July cohort achieved in its first nineteen. For an August or September asset to reach 100 million by the end of November it would need to run at more than five times the August cohort's current aggregate daily rate, on its own. Nothing in the fourteen months of baseline before July suggests Roblox funds a second burst that quickly.
The interesting failure mode is a September burst. If one arrives, reading three above is correct — July was a production ramp reaching the market, not a summer campaign — and Roblox has quietly become a continuous large-scale advertiser for the first time. We will re-pull and report either way.
How to reproduce this teardown
- Establish your measurement window before anything else. This source returns rolling 30-day impressions by default. Every conclusion below is a statement about one month of delivery, not about history, and the two are easy to confuse in exactly one direction: a cohort that looks like it "produced nothing" may simply have decayed since.
- Query a second window before claiming a spend change. The single-window table here appears to show Roblox's buying switching on in July. Querying May directly disproves it. One window can tell you who is carrying delivery now; it cannot tell you when the money started.
- Group by first-observed date. Impression rank tells you what is winning; first-seen date tells you which cohort is carrying the account. Those are different questions and only the second survives a change of window.
- Split by store entity and compute impressions per placement for each. Roblox's 105x iOS/Android gap is the single most misleading thing in the raw data and it takes one groupby to expose.
- Do not divide impressions by an asset's age. The impression field is a rolling 30-day value, so dividing it by a 278-day lifespan produces a number that means nothing. If you need a rate, divide by the window length — and if every asset in your sample predates the window, drop the rate column entirely, because it is then the totals column multiplied by a constant.
- Compare against titles on the same chart, pulled the same day and the same window. "Roblox runs 1.5 billion impressions" means nothing until you know a mahjong game two ranks below it runs 11.1 billion in the same thirty days.
Methodology and data notes
- Source: AdMapix creative search and ranking APIs, queried 2026-08-19, country filter
US, sorted by impressions descending. - Sample: all creative records returned for the keyword
Robloxacross 70 pages at 100 records per page, deduplicated on creative image, first-seen, last-seen, impressions, placements, duration and ad copy. This yielded 6,788 unique records containing 814 distinct creative images. - Measurement window (important): the
impressionfield returned by this API is a rolling 30-day value, not a lifetime total. Every impression figure here describes 2026-07-20 → 2026-08-19 (verified: an explicit query for those dates returns the same values as the default query). Pulling the same creatives with a wider window returns substantially larger numbers. No figure in this article is a cumulative or lifetime total, and no daily rate is derived by dividing window impressions by an asset's age — that calculation is invalid for anything older than the window, which is nearly everything here. - Cross-window figures: the May and July in-month totals cited in the cohort section come from separate explicit-window queries (
2026-05-01 → 2026-05-31and2026-07-01 → 2026-07-31), each sampled to roughly 600 rows. They are top-N samples, not censuses, and are used only to establish direction and order of magnitude. - Sampling limit, stated plainly: the pull terminates at 7,000 rows and Roblox reaches that boundary, so 6,788 is a sample size, not a fleet census. Because 93.6% of window impressions sit in the top 100 records, the impression totals and concentration figures are close to stable; the record count and the size of the low-impression tail are not. Cross-title comparisons in this piece use impressions rather than record counts for exactly this reason.
- Attribution: 4,730 records resolve to iOS app ID
431946152(developer1873720918) and 2,005 to Android packagecom.roblox.client(developer990293287), both published by Roblox Corporation — 99.2% of records. The remainder are third-party utilities such as skin and avatar tools that mention Roblox in their creative and are excluded from all Roblox-specific figures. Ranking-side identifiers match: the US download chart lists Roblox under product ID431946152, developer ID1873720918. - "Records" are not the same as "creatives." The 6,788 records contain 814 distinct creative images, so a single visual asset may be observed under multiple records. Where this article says "creative" in the context of the top-100 or top-12 tables, each entry is a distinct image; where it says "records," it means observation rows.
- "Days live" is the span between first-observed and last-observed timestamps. A record is treated as live only if its last-observed date equals the pull date, 2026-08-19.
- "Placements" (
showCnt) counts recorded creative appearances, not unique users or unique publishers. Impressions-per-placement is a distribution-shape indicator, not a frequency metric. - Impressions are third-party estimates, not publisher-reported figures and not spend. They support relative comparison and should not be converted to dollar figures.
- Download figures are US-region estimates for the current ranking period; "game rank" counts only entries carrying the games category tag within the top 300 of the overall chart.
- Store information is available on the Roblox App Store listing and corporate disclosures on the Roblox Corporation investor site.
- Coverage is limited to creatives observable through third-party ad monitoring. Owned channels, influencer spend, TV, and in-platform promotion are not visible here and are likely material for a publisher of this size.
Frequently Asked Questions
How many ads is Roblox running in the US? AdMapix measured 6,788 US creative records for Roblox in the 30-day window ending 2026-08-19, containing 814 distinct creative images and delivering 1,514,986,345 impressions in that window. Only 2,012 records were still recording placements on the pull date, and those carry 94.4% of all impressions. The record count is a floor rather than a complete total, because Roblox's fleet reaches the 7,000-row pull limit.
What is Roblox's best-performing ad creative? A 30-second video first seen 2026-07-02, carrying 177,423,529 impressions across 34,564 placements — 11.7% of the entire fleet. At 5,133 impressions per placement it also has the highest delivery density in the account — 42% above the creative launched the same day with almost identical placement volume.
When did Roblox launch its 2026 US ad campaign? Creatives first observed 2026-07-02 to 2026-07-04 carry 930,645,210 impressions — 61.4% of Roblox's US delivery in the 30-day window ending 2026-08-19 — and all of July accounts for 71.3%. July was a genuine step change: an explicit query of the July window returns roughly 2.5x the in-month delivery of an equivalent May query. But Roblox was already buying before then, delivering over 530 million impressions inside May alone, so this was an escalation rather than a switch being turned on.
Does Roblox advertise more than other top-charting mobile games? No. Roblox is #3 among games on the US download chart with 2,029,022 downloads, but fifth of seven titles measured on ad impressions. Vita Mahjong's single best creative carries 4,529,362,167 impressions — 2.99 times Roblox's entire measured fleet — while ranking four places lower on downloads.
Why do Roblox's iOS and Android ads perform so differently? Roblox's iOS creatives deliver 2,004 impressions per placement; its Android creatives deliver 19, a factor of 105. The two halves run comparable placement volumes (749,482 versus 686,595) but produce impression totals 115 times apart, so 99.1% of measured impressions land on iOS. Creative data cannot distinguish a budget decision from an inventory or measurement difference, but it does mean placement count is a badly misleading proxy for Roblox's spend split.
How long does Roblox run an ad creative? Mean observed lifespan is 59.4 days and the median is 44. The 30-to-89-day band carries 76.6% of all impressions, which is largely the July 2026 cohort. The longest-running asset in the top 300 has been observed for 471 days but delivers only 1,465 impressions a day, so Roblox's oldest creatives survive through neglect rather than because they are being defended.
How long are Roblox's video ads? Almost all are 30 seconds or shorter. The most common durations across the fleet are 30s, 15s, 23s and 28s, and exactly one creative in the top 200 by impressions runs longer than 31 seconds. This is a markedly tighter ceiling than mid-core casual publishers, whose fleets commonly cluster at 44 to 60 seconds.
Want to see when your competitors actually switch their budget on? Per-creative impressions, placement counts, first-seen and last-seen dates, store-entity attribution and duration are all live in AdMapix, filterable by country, publisher and app ID. Create a free account to run this teardown on any title in your category, or see plans for full historical access and API export.
Data source: AdMapix third-party ad intelligence estimates, United States, retrieved 2026-08-19. Impression and download figures are modelled estimates for comparative analysis and are not publisher-reported. Figures change as new creatives enter rotation.
Compare related game-ad strategies
Compare this study with the game-specific research below. Keep the country, date window, and creative format consistent, then compare opening hooks, gameplay sequences, and end cards. Estimated impressions from different samples are not a product-performance ranking.
Related Reading
- Ad strategy teardowns (series index) — every teardown in the series, in publication order
- Mobile game ads guide: formats, examples and research — the format matrix, research workflow and KPI guardrails every teardown in this series applies
- Vita Mahjong — the metronome — one creative running 467 days
- Township — two fleets in one account — 5% of impressions driving 71% of delivery
- Rips by Triumph — the standing jump — 5.98B impressions, no creative older than the launch
Turn these observations into your next creative study
Open the creative library and select samples for your market, network and research question.
Related Articles
Grand Games UA Playbook 2026: 13.7 Billion Impressions Built From Four Videos — Inside a Permutation Machine
A publisher-level teardown of Grand Games A.Ş. across Block Out! and Magic Sort! in the US. Sixty measured ad instances carry 13.7 billion impressions, but Block Out!'s entire 12.2-billion fleet resolves to just four distinct videos and eighteen playable end cards — one 59-second video appears in thirteen instances with thirteen different playables. The breakout that took it from 613 million to 8.1 billion was not a new video: it was a new playable attached to a video already 63 days old.
Township Ad Strategy in 2026: Two Fleets in One Account — 5% of Placements Deliver 71% of Impressions, and One Creative Has Run for 910 Days
A creative-level teardown of Playrix's US user acquisition for Township. Its 30 measured creatives split into two populations that never overlap: seven deliver 1,120 to 1,410 impressions per placement, the other twenty-three deliver 25 to 33. The seven take 5.1% of placements and produce 71.4% of impressions. The same split appears across Gardenscapes and Homescapes, and Township's oldest active creative was first seen on 2024-02-21 — 910 days before this pull.
Rips by Triumph Ad Strategy in 2026: The Standing Start — 6 Billion Impressions From a Fleet With No Creative Older Than 134 Days
A creative-level teardown of Triumph Arcade's US user acquisition for Rips by Triumph, the only title in this teardown series ranking on both the US download chart and the revenue chart. Its top 30 ad entries account for 5.98 billion impressions in the 30 days to 2026-08-19, and not one was first seen before 2026-04-07. A single 47-second asset launched 2026-06-30 carries 63.0% of that total — 9.9 times the second-largest entry — and the account runs zero playables.