
Bus Traffic Fever! Ad Strategy in 2026: One Asset Carrying 66% of a 3.0-Billion-Impression Fleet — and the Second Name Nobody Notices
A creative-level teardown of GOODROID's US user acquisition for Bus Traffic Fever!. Twenty-two ad instances carry 3,004,140,963 impressions, all still live after 139 days, and one asset alone carries 66.0%. The twenty-two instances resolve to just nine videos and eight playables. The title also runs under a second name — Bus Rush Fever! — on its Android listing, which is where most competitive analyses of this product go wrong.
GOODROID's Bus Traffic Fever! is running one of the most concentrated ad fleets we have measured. Twenty-two ad instances account for 3,004,140,963 impressions in the US, and a single asset carries 1,983,589,426 of them — 66.0% of the total. The next largest instance delivers 131,847,406, which is 15 times less.
Those twenty-two instances are not twenty-two pieces of production. On asset fingerprints they resolve to nine distinct videos and eight distinct playable end cards — and the fleet's twelve 58-second rows are only four video files.
All twenty-two instances were still live on 2026-08-19. Not one has been retired in the 139 days since the account opened on 2026-04-02.
Meanwhile, US downloads sit at 1,222,926, up +6.19% period-over-period. That looks unremarkable until you check the neighbourhood: of the 46 games in the top 250 of the US download chart, 32 are shrinking. Bus Traffic Fever! is one of fourteen going the other way.
But before any of that is usable, there is a naming problem to resolve — and it is the reason this title is easy to analyse wrongly.
What one row means here
Before any of the counts below, one definition has to be nailed down, because getting it wrong produces confidently false conclusions.
Each row returned by creative search is an ad instance: a distinct delivery record with its own impression count, placement count and date range. It is not automatically a distinct piece of production. Multiple instances routinely share the same underlying video, differing only in which playable end card is attached.
Checking asset fingerprints (videoFp and playHtmlFp) across the twenty-two instances returns:
| Count | |
|---|---|
| Ad instances | 22 |
| Distinct videos | 9 |
| Distinct playable end cards | 8 |
| Instances carrying a video | 18 |
| Instances with no video (playable or static) | 4 |
| Instances carrying a playable | 18 |
Impressions are reported per instance and are not double-counted, so every impression total in this article is unaffected by the distinction. What it changes is any claim about how many things GOODROID made.
Executive summary (TL;DR)
- One asset is the whole account. A playable-format instance first seen 2026-04-02 has delivered 1,983,589,426 impressions across 871,103 placements — 66.0% of fleet impressions and 64.2% of fleet placements. At 66,119,648 impressions per window-day it out-paces the other twenty-one instances combined (36,407,992) by 1.8x.
- Twenty-two instances, seventeen files. Nine distinct videos and eight distinct playables. Video
99f97afc…appears in five instances,30b55af6…in four. - Nothing has ever been switched off. 22 of 22 instances were live on the pull date. Average age 93.5 days; thirteen of the twenty-two have been running since April.
- The title runs under two names. The US App Store listing that appears on the download chart is Bus Traffic Fever! (
6759763476). The Android packagejp.co.goodroid.hyper.busflowis listed as Bus Rush Fever!. Both are GOODROID. The ad creatives themselves carry the title text "Bus Rush Fever!", including creatives attributed to the iOS listing. - Four instances on the Android listing carry 72.5% of impressions on 81.1% of placements. The eighteen iOS-listing instances carry 27.5% — but at a higher density, 3,222 impressions per placement against 1,979.
- 58 seconds is the house length — but it is four files, not twelve. Twelve of the eighteen video instances run 58 seconds; they resolve to four distinct videos. One instance is 59s, three are 29s, two are 30s.
- One row breaks the fleet's density band by 33x. Instance #20 recorded 138,635 placements — the second-highest count in the account — and returned 119 impressions per placement, against a fleet floor of 1,812.
- The 2026-07-31 relaunch is one new playable, not five new creatives. After a five-week gap, five instances launched across two days. They are two new videos, one new playable and two recycled April videos — and all five carry the same playable,
2d8264ea…. They deliver 3,937,646 impressions per window-day between them — behind the best single April video.
All figures are AdMapix third-party estimates for the United States, pulled 2026-08-19. Methodology at the end.
Two names, one game: how this was verified
This matters enough to handle before any numbers, because getting it wrong produces a completely different — and wrong — teardown.
Searching the creative database for Bus Traffic Fever and for Bus Rush Fever returns the same fifteen creatives, in the same order, with the same creative IDs. What changes between the two result sets is the app attached to each row: querying one name surfaces the iOS listing on some rows and the Android listing on others, and querying the second name swaps them.
Concretely, the top creative in both queries has creative ID 50fb1648ab5870e1e7bb4e39d178d400, impressions 1,983,589,426, first-seen 2026-04-02. Under one query it is attributed to jp.co.goodroid.hyper.busflow ("Bus Rush Fever!", developer ID 1635471560). Under the other it is attributed to 6759763476 ("Bus Traffic Fever!", developer ID 366495350). Same asset, two labels.
Three further checks confirm it is one product:
| Check | Result |
|---|---|
| Creative ID lists across both queries | Identical, in identical order across all 15 rows |
| Publisher string on both listings | GOODROID,Inc. on both |
Creative-owned title field | Reads "Bus Rush Fever!" on creatives whose appList resolves to the iOS "Bus Traffic Fever!" listing |
| Download-chart row | productId 6759763476 (the iOS listing) paired with developerId 1635471560 (the Android developer ID) |
That last row is the strongest single piece of evidence. The ranking record itself mixes the two listings — it carries the iOS product ID alongside the Android developer ID. The data provider already treats them as one entity; only the display names diverge.
The practical takeaway: the ad creatives brand the game as Bus Rush Fever! while the US App Store listing that ranks is Bus Traffic Fever!. Any analysis that joins creative data to chart data on app name will either split this product in two or miss half of it. Everything below is joined on appList[].id and developerId.
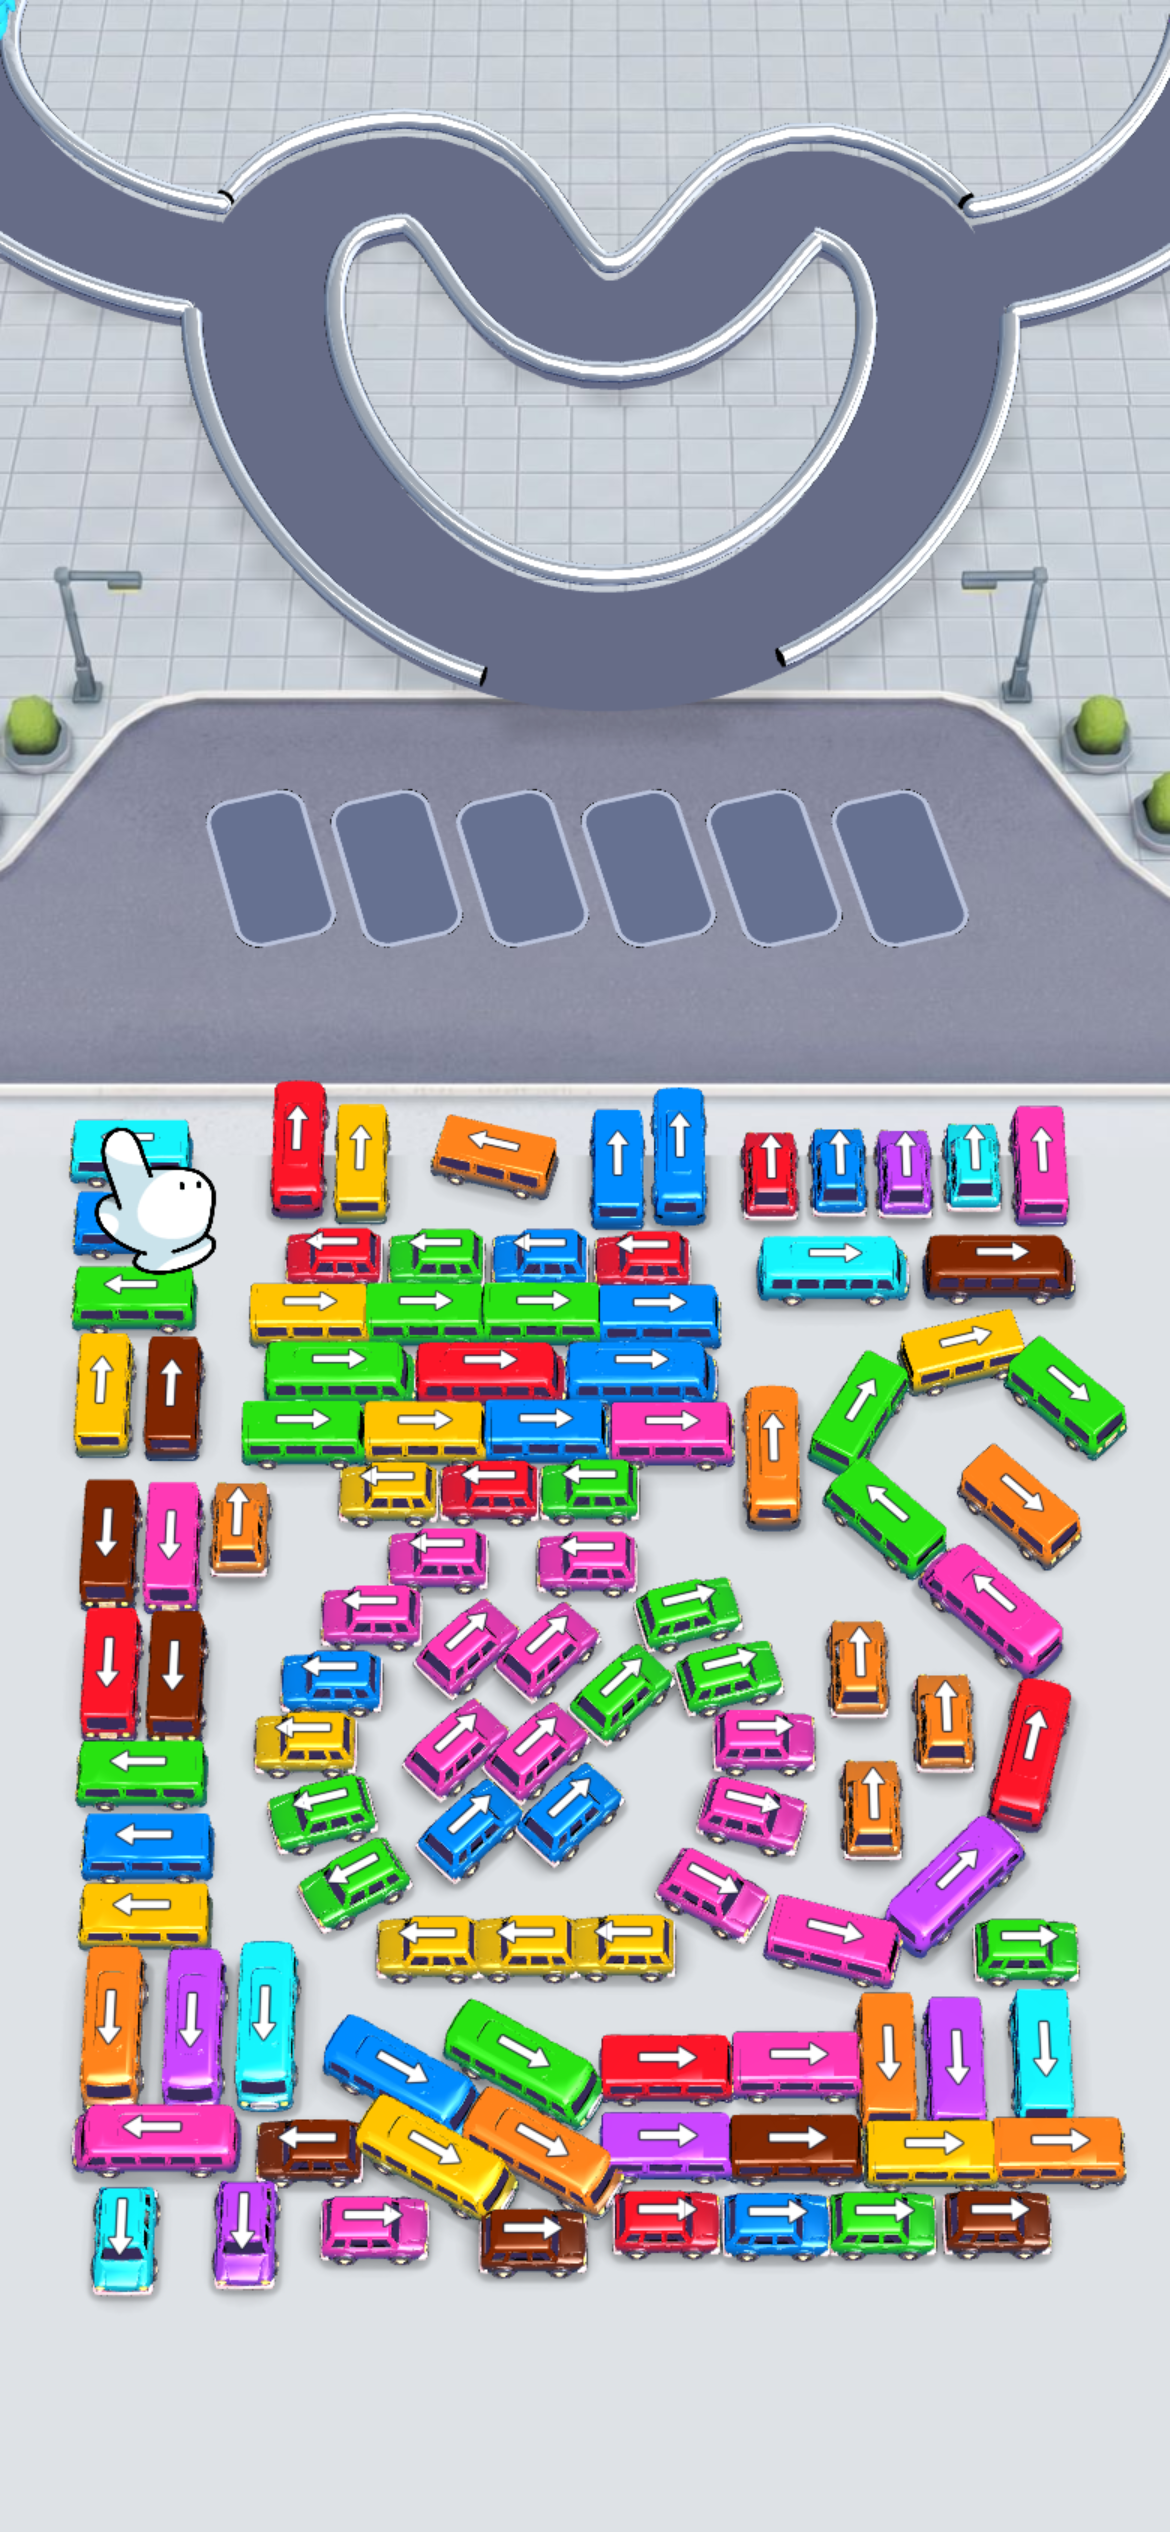 The asset that is 66.0% of the account: 1,983,589,426 impressions in the 30-day window across 871,103 placements, first seen 2026-04-02, still running after 139 days at 66,119,648 impressions per window-day. It is playable
 a4bf04a2…, which also appears attached to two video instances.
Where Bus Traffic Fever! sits on the US charts
| Metric | Value |
|---|---|
| US download rank | 57 |
| Downloads, current period | 1,222,926 |
| Downloads, prior period | 1,151,672 |
| Absolute change | +71,254 |
| Period-over-period change | +6.19% |
| Publisher | GOODROID,Inc. |
iOS app ID (chart productId) | 6759763476 — "Bus Traffic Fever!" |
| Android package | jp.co.goodroid.hyper.busflow — "Bus Rush Fever!" |
At rank 57 overall it is the eighth-highest-ranked game in the US top 250, ahead of Rips by Triumph, Block Blast!, Fortnite and Township.
The +6.19% is modest in isolation. In context it is not. Of the 46 titles in the top 250 that carry the games classification, 32 recorded a negative period-over-period change — roughly 70% of the category is contracting. Only six games sit in the narrow positive band between 0% and +15%:
| Rank | Title | Downloads | Prior period | Absolute change | Change | Publisher |
|---|---|---|---|---|---|---|
| 148 | Mahjong Blast | 616,774 | 542,141 | +74,633 | +13.77% | Nebula Studio |
| 57 | Bus Traffic Fever! | 1,222,926 | 1,151,672 | +71,254 | +6.19% | GOODROID,Inc. |
| 106 | Jewel Coloring | 768,849 | 728,906 | +39,943 | +5.48% | Ta Ta Game Technology Limited |
| 117 | 82-0.com | 704,287 | 667,724 | +36,563 | +5.48% | Vaulty Studios Inc. |
| 65 | Rips by Triumph | 1,154,817 | 1,134,706 | +20,111 | +1.77% | Triumph Arcade |
| 95 | Township | 850,227 | 833,346 | +16,881 | +2.03% | Playrix |
Bus Traffic Fever! is the highest-volume title in that group by a wide margin, and its +71,254 absolute increment is second only to Mahjong Blast's +74,633 — a title working off less than half the base. Against the other four it added more downloads than any of them, in some cases four times as many.
Growing 6.19% on 1.15 million is a harder problem than growing 13.77% on 542,141, and the ad data below shows what it costs.
The fleet at a glance: 22 instances, 17 files, zero retirements
| # | Impressions | Placements | First seen | Days live | Duration | Impr/placement | Video | Playable | Listing |
|---|---|---|---|---|---|---|---|---|---|
| 1 | 1,983,589,426 | 871,103 | 2026-04-02 | 139 | playable | 2,277 | — | P1 | Android |
| 2 | 131,847,406 | 43,555 | 2026-04-08 | 133 | 58s | 3,027 | V1 | P2 | iOS |
| 3 | 117,619,007 | 34,767 | 2026-04-02 | 139 | 58s | 3,383 | V1 | P1 | iOS |
| 4 | 113,598,455 | 62,694 | 2026-04-09 | 132 | playable | 1,812 | — | P2 | Android |
| 5 | 109,060,469 | 30,556 | 2026-04-18 | 123 | 58s | 3,569 | V2 | P3 | iOS |
| 6 | 100,291,298 | 25,204 | 2026-04-17 | 124 | 58s | 3,979 | V2 | — | iOS |
| 7 | 65,056,973 | 28,391 | 2026-06-03 | 77 | playable | 2,291 | — | P4 | Android |
| 8 | 37,079,664 | 12,804 | 2026-04-17 | 124 | 58s | 2,896 | V2 | P5 | iOS |
| 9 | 35,457,927 | 10,244 | 2026-06-03 | 77 | 58s | 3,461 | V1 | P4 | iOS |
| 10 | 35,155,286 | 13,499 | 2026-07-31 | 19 | 29s | 2,604 | V3 | P6 | iOS |
| 11 | 32,484,923 | 8,653 | 2026-04-18 | 123 | 30s | 3,754 | V4 | — | iOS |
| 12 | 32,399,218 | 8,281 | 2026-04-17 | 124 | 58s | 3,912 | V5 | — | iOS |
| 13 | 26,588,089 | 8,603 | 2026-04-09 | 132 | 29s | 3,091 | V6 | P2 | iOS |
| 14 | 26,142,670 | 10,255 | 2026-07-31 | 19 | 58s | 2,549 | V2 | P6 | iOS |
| 15 | 24,474,780 | 6,805 | 2026-05-26 | 85 | 58s | 3,597 | V1 | P7 | iOS |
| 16 | 22,351,625 | 8,638 | 2026-04-21 | 120 | 58s | 2,588 | V2 | P8 | iOS |
| 17 | 21,779,539 | 6,446 | 2026-06-25 | 55 | 59s | 3,379 | V7 | P2 | iOS |
| 18 | 21,390,811 | 9,629 | 2026-08-01 | 18 | 30s | 2,221 | V4 | P6 | iOS |
| 19 | 19,239,565 | 6,613 | 2026-07-31 | 19 | 29s | 2,909 | V8 | P6 | iOS |
| 20 | 16,561,128 | 138,635 | 2026-04-07 | 134 | 58s | 119 | V9 | P1 | Android |
| 21 | 16,201,055 | 6,418 | 2026-08-01 | 18 | playable | 2,524 | — | P6 | iOS |
| 22 | 15,771,649 | 5,214 | 2026-04-17 | 124 | 58s | 3,025 | V5 | P5 | iOS |
| Total | 3,004,140,963 | 1,357,007 | — | 93.5 avg | — | 2,214 fleet avg | 9 files | 8 files | — |
Three structural facts define this account.
Extreme concentration. Instance #1 takes 66.0%. The top two take 70.4%, the top three 74.3%. Remove instance #1 and the remaining twenty-one rows total 1,020,551,537 impressions — barely half of what that one file has delivered on its own.
Total retention. Every instance GOODROID has launched for this title since 2026-04-02 was still recording placements on 2026-08-19. There is not a single retirement in the dataset.
Two videos are doing most of the video work. Read the Video column: V1 appears in four rows, V2 in five. Between them those two files account for nine of the seventeen video rows and 604,324,846 impressions. The eight remaining videos appear once or twice each.
The impressions-per-placement column is where the account's one genuine anomaly lives. Twenty-one of the twenty-two rows fall between 1,812 and 3,979 — a tight 2.2x band, median 3,025. Instance #20 sits at 119, thirty-three times below the floor, on the strength of 138,635 placements that produced almost nothing. It is discussed in its own section below; the short version is that a single row can distort any fleet-level average you compute from this table, and this is that row.
 Creative #2 — 58 seconds, 131,847,406 impressions across 43,555 placements, first seen 2026-04-08. The largest video asset in the fleet, and still 15 times smaller than the playable leader.
The 1.98-billion-impression creative
Creative #1 deserves its own section because it is not merely the biggest asset — it is a different order of thing from everything else GOODROID runs for this title.
| Metric | Creative #1 | Rest of fleet (20 creatives) |
|---|---|---|
| Impressions | 1,983,589,426 | 1,020,551,537 |
| Placements | 871,103 | 347,269 |
| Impressions per placement | 2,277 | 2,891 |
| Impressions per window-day | 66,119,648 | 36,407,992 combined |
| First seen | 2026-04-02 | 2026-04-02 to 2026-08-01 |
| Days live | 139 | 18–139 |
| Format | Playable / no video duration | 4 playable+static, 16 video |
Read the impressions-per-window-day row carefully. One asset is accumulating 1.8 times faster than the other twenty-one rows combined.
It is also worth noting what instance #1 is not. Its impressions-per-placement rate of 2,277 is below the fleet median of 3,025 and below fifteen of the other twenty-one rows. It is not being served more densely than its siblings. It is winning on sheer placement volume — 871,103 appearances, 64.2% of every placement in the account.
That distinction matters for anyone trying to replicate this. GOODROID has not found a magic creative that the auction rewards with unusual delivery intensity. It has found a creative the auction is willing to place everywhere, and then let it run for 139 days without interruption.
The format is also informative: it is a playable/interactive unit with no video duration recorded, and it sits on the Android listing. The fleet's four no-duration rows carry 72.5% of fleet impressions, and they reference four distinct playable files.
The two listings: four instances, 72.5% of everything
| Store listing | Creatives | Impressions | Share of impressions | Placements | Share of placements | Impr/placement | Range |
|---|---|---|---|---|---|---|---|
Android jp.co.goodroid.hyper.busflow ("Bus Rush Fever!") | 4 | 2,178,805,982 | 72.5% | 1,100,823 | 81.1% | 1,979 | 119 – 2,291 |
iOS 6759763476 ("Bus Traffic Fever!") | 18 | 825,334,981 | 27.5% | 256,184 | 18.9% | 3,222 | 2,221 – 3,979 |
Four Android instances carry nearly three-quarters of the account. Eighteen iOS instances carry the rest.
Note the direction of the density gap: the iOS side runs at 3,222 impressions per placement against Android's 1,979 — the iOS assets are served more densely, they simply win far fewer placements. The Android aggregate is itself dragged down by instance #20 at 119; excluding that one row the Android group runs at 2,264, within 1.4x of iOS. This is a much milder version of the arrangement seen in Royal Smash!'s fleet on the same date, where the Android listing absorbed most placements at one-eleventh the density.
That relative similarity is itself a finding. GOODROID appears to be buying broadly the same kind of inventory on both platforms and simply spending far more on one of them. It is not running two structurally different media plans; it is running one plan weighted heavily to Android.
For competitive analysis, the consequence is blunt: if you profile this title using only its US App Store listing — which is what "Bus Traffic Fever!" is — you will see 825 million impressions across eighteen instances and conclude it is a mid-sized advertiser running a broad video strategy. You will miss 72.5% of its impressions and the single asset that defines the account.
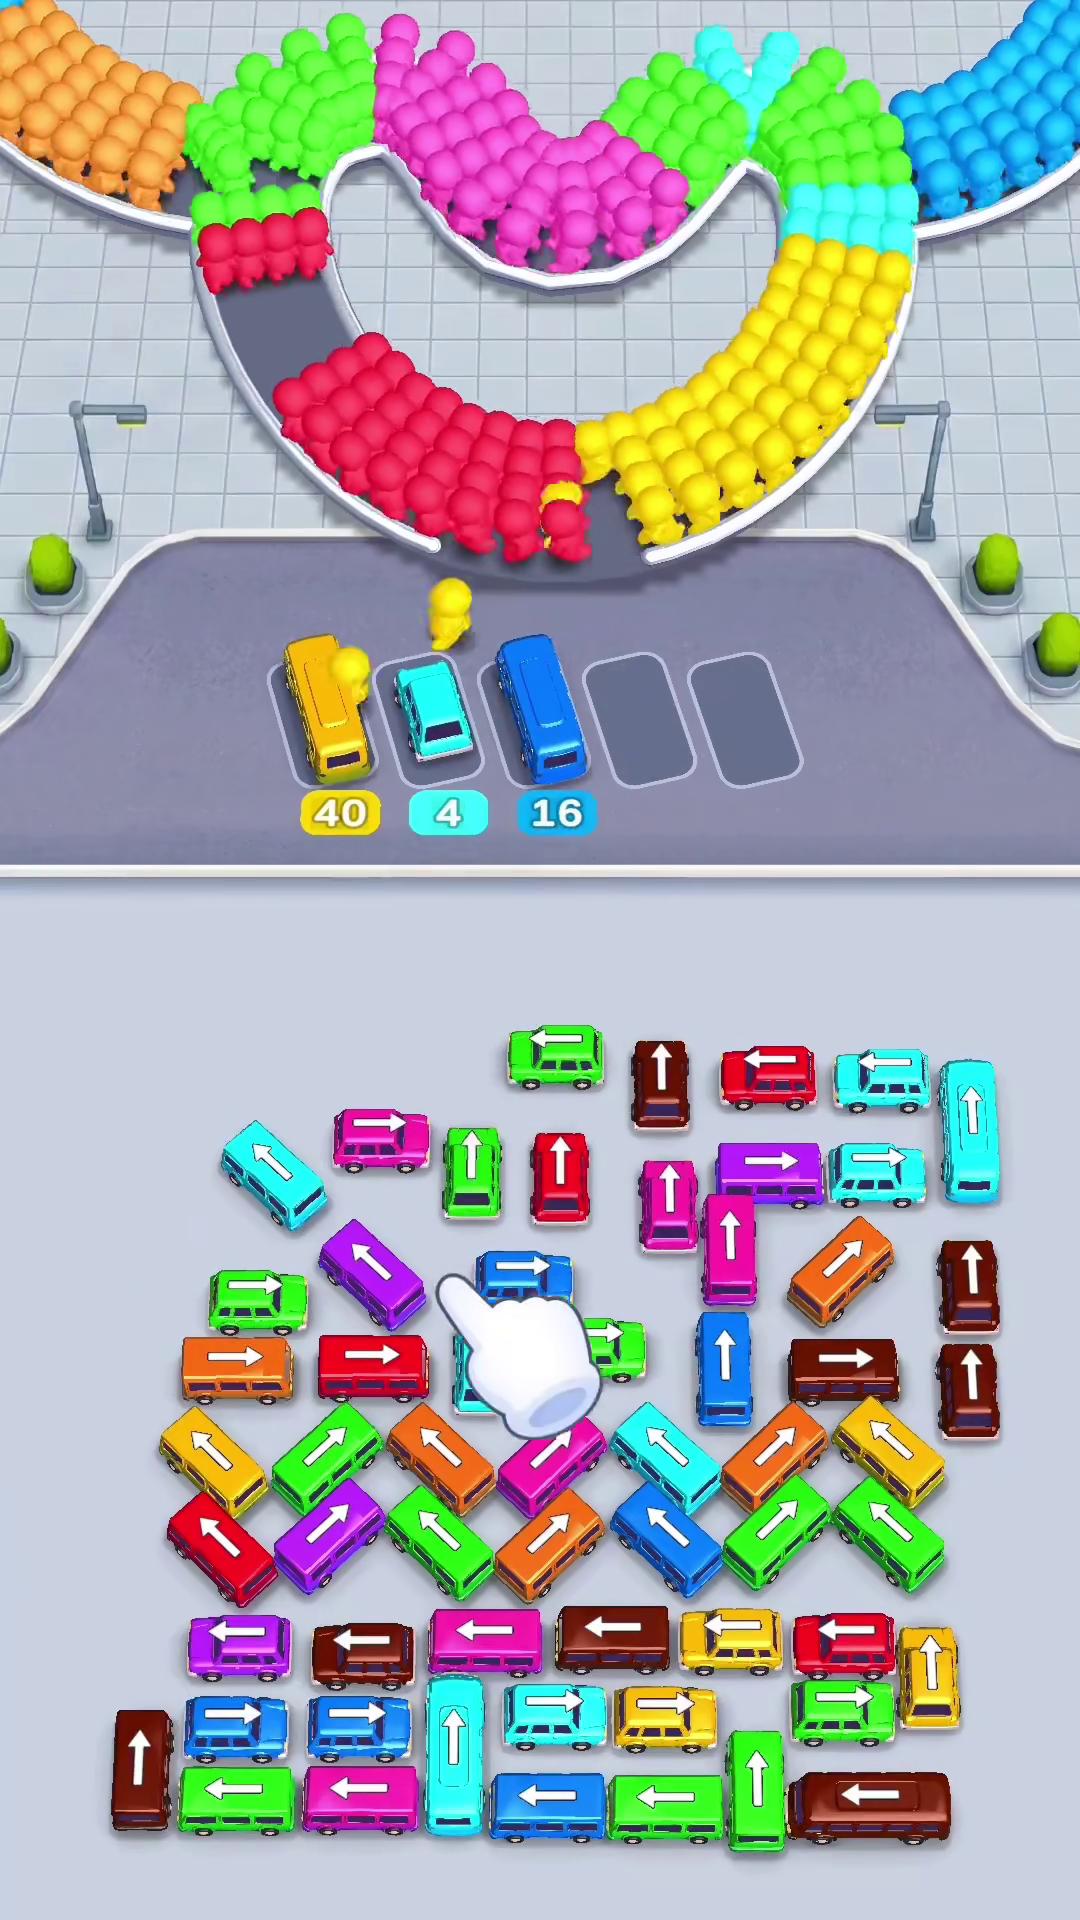 Creative #5 — 58 seconds, 109,060,469 impressions at 3,569 per placement, first seen 2026-04-18. Representative of the iOS-listing cohort: high delivery density, modest placement volume.
The build order: a big April, a long quiet, then August
| First seen | Instances added | Cohort impressions | Share of fleet | Cohort placements | Cohort impr/placement |
|---|---|---|---|---|---|
| 2026-04-02 | 2 | 2,101,208,433 | 69.9% | 905,870 | 2,320 |
| 2026-04-07 | 1 | 16,561,128 | 0.6% | 138,635 | 119 |
| 2026-04-08 | 1 | 131,847,406 | 4.4% | 43,555 | 3,027 |
| 2026-04-09 | 2 | 140,186,544 | 4.7% | 71,297 | 1,966 |
| 2026-04-17 | 4 | 185,541,829 | 6.2% | 51,503 | 3,603 |
| 2026-04-18 | 2 | 141,545,392 | 4.7% | 39,209 | 3,610 |
| 2026-04-21 | 1 | 22,351,625 | 0.7% | 8,638 | 2,588 |
| 2026-05-26 | 1 | 24,474,780 | 0.8% | 6,805 | 3,597 |
| 2026-06-03 | 2 | 100,514,900 | 3.3% | 38,635 | 2,602 |
| 2026-06-25 | 1 | 21,779,539 | 0.7% | 6,446 | 3,379 |
| 2026-07-31 | 3 | 80,537,521 | 2.7% | 30,367 | 2,652 |
| 2026-08-01 | 2 | 37,591,866 | 1.3% | 16,047 | 2,343 |
Grouped into phases:
| Phase | Dates | Instances | Impressions | Share | Combined impr/day |
|---|---|---|---|---|---|
| April build | 2026-04-02 → 2026-04-21 | 13 | 2,739,242,357 | 91.2% | 91,308,079 |
| Summer trickle | 2026-05-26 → 2026-06-25 | 4 | 146,769,219 | 4.9% | 4,892,307 |
| Late-July relaunch | 2026-07-31 → 2026-08-01 | 5 | 118,129,387 | 3.9% | 3,937,646 |
The account was essentially built in nineteen days. Thirteen instances launched between 2026-04-02 and 2026-04-21, and they still carry 91.2% of everything the fleet has ever delivered.
Then it went quiet. Four instances across the whole of May and June. Nothing at all in July until the last day of the month.
Then, on 2026-07-31 and 2026-08-01, five instances arrived in two days — the largest burst since April. What they actually contain is the most interesting thing in this teardown.
The late-July relaunch: one new playable, permuted
The five newest instances are 18–19 days old and have accumulated 118,129,387 impressions between them, only 3.9% of the fleet. On a per-day basis the picture is completely different.
| Instance | Impressions | Days live | Impressions per day | Duration | Video | Playable | First seen |
|---|---|---|---|---|---|---|---|
| #10 | 35,155,286 | 19 | 1,171,843 | 29s | V3 (new) | P6 | 2026-07-31 |
| #14 | 26,142,670 | 19 | 871,422 | 58s | V2 (from 2026-04-17) | P6 | 2026-07-31 |
| #18 | 21,390,811 | 18 | 713,027 | 30s | V4 (from 2026-04-18) | P6 | 2026-08-01 |
| #19 | 19,239,565 | 19 | 641,319 | 29s | V8 (new) | P6 | 2026-07-31 |
| #21 | 16,201,055 | 18 | 540,035 | playable | — | P6 | 2026-08-01 |
| Combined | 118,129,387 | — | 3,937,646 | — | 2 new + 2 recycled | 1 file | — |
(Rates in this table use the uniform ÷30 divisor applied throughout the article. All five rows entered part-way through the measurement window, so these figures understate what they delivered per day they were actually live — the combined figure over their own 18–19 day lives is 6,327,254. The uniform divisor is used anyway so that every rate in this teardown is comparable.)
Look at the Playable column. All five instances carry the same playable, 2d8264ea…. And two of the five videos are not new at all: V2 has been running since 2026-04-17 and V4 since 2026-04-18.
| What actually launched on 2026-07-31 / 08-01 | Count |
|---|---|
| Ad instances | 5 |
| New video files | 2 (29s each) |
| New playable files | 1 |
| Videos recycled from April | 2 |
| Genuinely new production | 3 files |
This is not a team ramping creative output back up. It is a team that made one new playable end card and two short videos, then permuted them against two assets it already had. The common element in every one of the five rows is the new playable — which is exactly the pattern documented in the Grand Games teardown, where a new playable attached to a 63-day-old video produced a 12x jump.
The late-July rows are all young enough to sit entirely inside the measurement window, so their daily rates are directly comparable to their own age. The April rows are not: their window figures cover only the last 30 days of a four-month life.
Once that is corrected, the late-July burst does not out-run the April fleet. Instance #2, the best April video, runs at 4,394,914 impressions per window-day — 3.8x the fastest late-July row (1,171,843). The burst is new, and it is delivering, but it is not yet competing with what April built.
There is also a format shift. The April cohort is dominated by 58-second video: twelve of the fleet's twenty-two instances are 58 seconds, and all twelve were first seen in April, May or June. Of the five late-July instances, two are 29 seconds, one is 30, one is a pure playable, and only one is 58 — and that 58 is a recycled April file. GOODROID's newest production is 29 seconds, half the length of its established standard.
Whether that reflects a genuine strategic shift or a test of shorter formats is not resolvable from 19 days of data. But both new videos are 29-second cuts, and the faster of them leads the late-July group.
 Instance #10 — 29 seconds, first seen 2026-07-31, carrying video V3, one of the two genuinely new files in this burst. At 1,171,843 impressions per window-day it leads the late-July group, though still behind the April fleet on window-corrected rates.
Duration: 58 seconds is the house length, and it is four files
| Duration | Instances | Distinct videos | Impressions | Share of fleet | Impr/placement |
|---|---|---|---|---|---|
| Playable / static (no video duration) | 4 | — | 2,178,445,909 | 72.5% | 2,249 |
| 58s | 12 | 4 | 669,056,841 | 22.3% | 1,997 |
| 29s | 3 | 3 | 80,982,940 | 2.7% | 2,820 |
| 30s | 2 | 1 | 53,875,734 | 1.8% | 2,947 |
| 59s | 1 | 1 | 21,779,539 | 0.7% | 3,379 |
Read the two count columns against each other. Thirteen of the eighteen video instances run 58 or 59 seconds, but they are only five distinct files. The convention is real — GOODROID has never shipped a video between 31 and 57 seconds — but it is a convention observed across nine pieces of production, not eighteen.
The 58-second band breaks down like this:
| Video file | Instances | Combined impressions | First seen |
|---|---|---|---|
99f97afc… | 5 | 294,925,726 | 2026-04-17 |
30b55af6… | 4 | 309,399,120 | 2026-04-02 |
6eedcc97… | 2 | 48,170,867 | 2026-04-17 |
38ed2cd9… | 1 | 16,561,128 | 2026-04-07 |
Two files account for nine of the twelve 58-second rows. GOODROID did not make eleven 58-second ads; it made four, and ran two of them repeatedly against different playables and different listings.
The aggregate density figure for the 58-second band — 1,997 impressions per placement — is also distorted by instance #20, the 119-per-placement outlier discussed below. Excluding that single row, the remaining eleven 58-second instances run at 3,324 per placement, the highest of any format in the fleet. Long-form video here is dense but narrow; interactive is broad but less dense.
The three 29-second instances are worth isolating because they are three genuinely distinct videos, and two of them are new. One dates from 2026-04-09 (instance #13, 3,091 per placement) and two from 2026-07-31 (2,604 and 2,909). The format existed from the beginning, sat unused for nearly four months, and then reappeared in the late-July burst — with new footage, not a recut of the April file.
That is a specific, readable decision: GOODROID tried a short cut in April, did not repeat it, and then came back to it at the end of July with two more. Something changed in the read between those dates.
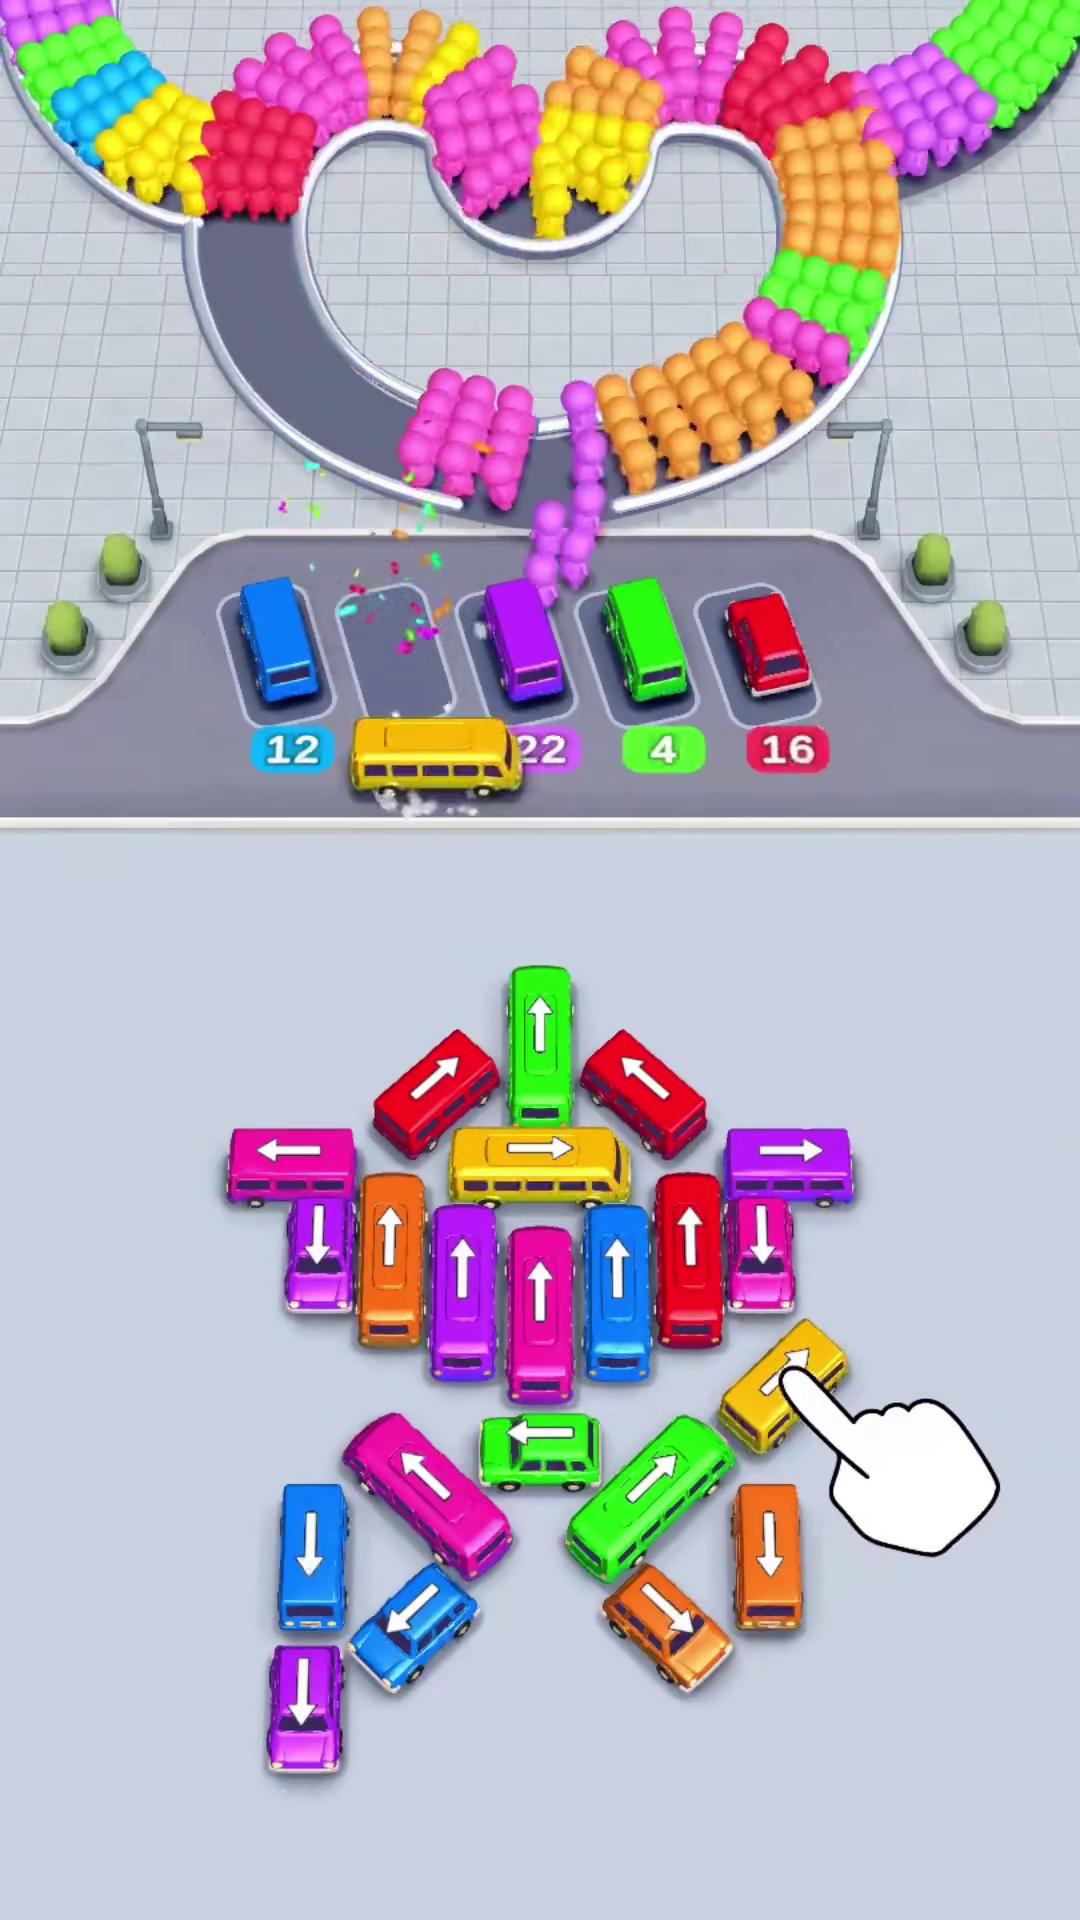 Instance #12 — 58 seconds, 32,399,218 impressions at 3,912 per placement, first seen 2026-04-17. It is video
 6eedcc97…, which also appears as instance #22 with a different playable attached and 15,771,649 impressions — the same file, half the delivery.
Instance #20: 138,635 placements, 119 impressions each
One row does not belong, and it is worth its own section because it is the kind of thing that silently ruins a fleet average.
Instance #20 is a 58-second video (38ed2cd9…) on the Android listing, first seen 2026-04-07, still running 134 days later. It recorded 138,635 placements — the second-highest count in the entire account, ahead of every asset except the leader — and returned 16,561,128 impressions, or 119 per placement.
The fleet floor excluding it is 1,812. This row is fifteen times below that floor and thirty-three times below the fleet median of 3,025.
| Instance #20 | Rest of fleet (21 rows) | |
|---|---|---|
| Placements | 138,635 | 1,218,372 |
| Impressions | 16,561,128 | 2,987,579,835 |
| Impressions per placement | 119 | 2,452 |
| Share of fleet placements | 10.2% | 89.8% |
| Share of fleet impressions | 0.6% | 99.4% |
Everything about it says "different inventory." An asset that appears 138,635 times and generates 119 impressions per appearance is being served into placement types that behave nothing like the rest of the account — small-format, low-yield surfaces where a creative is counted as present but barely seen.
Why this matters for competitive analysis: if you ranked this fleet by placement count instead of impressions, instance #20 would look like GOODROID's second-biggest bet. It is 0.6% of delivery. It also single-handedly moves the fleet-wide impressions-per-placement figure from 2,452 to 2,214 — a 10% distortion from one row in twenty-two. Any competitive tool that reports a single fleet-level density number for this account is reporting a number that describes neither the real fleet nor this outlier.
Playables: attached to 18 of 22, from eight files
Eighteen of the twenty-two instances carry a playable attachment, and those eighteen reference eight distinct playable files. Only four do not.
The reuse is heavily concentrated. Playable a4bf04a2… appears in three instances totalling 2,117,769,561 impressions — 70.5% of the entire fleet, more than every video file in the account put together. Playable f92a908e… appears in four instances, and 2d8264ea… — the one introduced on 2026-07-31 — appears in all five instances of the late-July wave.
Four instances record no video duration at all, and these are the pure interactive/static units. They carry 72.5% of fleet impressions — but that figure is almost entirely instance #1. Excluding it, the other three no-duration rows total 194,856,483 impressions, or 6.5% of the fleet.
So the honest description is: GOODROID attaches a playable to nearly everything, runs mostly long-form video, and happens to have one interactive unit that became the biggest asset in the account. The playable strategy did not produce a category of winners. It produced one winner.
Against the other US fleets measured on the same date:
| Publisher | Playable attachment | Pure interactive/static share of impressions |
|---|---|---|
| Block Out! (Grand Games) | 15 / 15 | 31.7% |
| Bus Traffic Fever! (GOODROID) | 18 / 22 | 72.5% (one asset = 66.0%) |
| Vita Mahjong (Vita Studio) | 12 / 15 | 13.0% |
| Gossip Harbor (Microfun) | 5 / 15 | 0% |
The same-keyword neighbour: Car Jam and a 1.07x band
Searching the same keyword space surfaces a second advertiser worth comparing: Car Jam - Parking bus games 3D (6505095234, published by BLANKZONET, developer ID 1286443394). It is a different company and a different product, and it appears alongside GOODROID's title because both compete for the same bus-and-traffic keyword space.
Its fleet is a near-perfect inversion of GOODROID's.
| Bus Traffic Fever! (GOODROID) | Car Jam (BLANKZONET) | |
|---|---|---|
| Creatives sampled | 21 | 9 |
| Total impressions | 3,004,140,963 | 495,829,462 |
| Total placements | 1,357,007 | 66,451 |
| Impressions per placement (fleet) | 2,214 | 7,462 |
| Impr/placement range | 1,812 – 3,979 (2.2x) | 7,239 – 7,777 (1.07x) |
| Creatives live | 21 / 21 | 9 / 9 |
| Average age | 93.5 days | 401.4 days |
| Oldest asset | 139 days | 501 days |
| Top creative share | 66.0% | 23.3% |
| Playable attachment | 18 / 21 | 9 / 9 |
Three things jump out.
Car Jam's delivery band is the tightest measured anywhere in this series. Nine creatives, all falling between 7,239 and 7,777 impressions per placement — a 1.07x spread. For comparison, the previous tightest fleet measured, Vita Mahjong, had a 1.15x spread across fourteen assets. BLANKZONET's is tighter still.
Car Jam buys 18x fewer placements per impression. It generated 495.8 million impressions from 66,451 placements. GOODROID needed 1.22 million placements for 2.99 billion. Whatever inventory BLANKZONET is buying, each appearance is worth roughly three times as much.
Car Jam's fleet is four times older. Four of its nine creatives were first seen on 2025-05-09 and are still running 467 days later. Two more date from 2025-04-05 — 501 days, the oldest active creatives in this comparison (four fleets elsewhere in the series run longer, topping out at Township's 910 days). All nine are live.
These are two coherent but opposite strategies aimed at overlapping audiences. GOODROID built its account in nineteen days, put everything behind one interactive asset, and buys enormous placement volume at moderate density. BLANKZONET has been running the same nine files for over a year, at a delivery density three times higher, and has added nothing new since 2026-02-11.
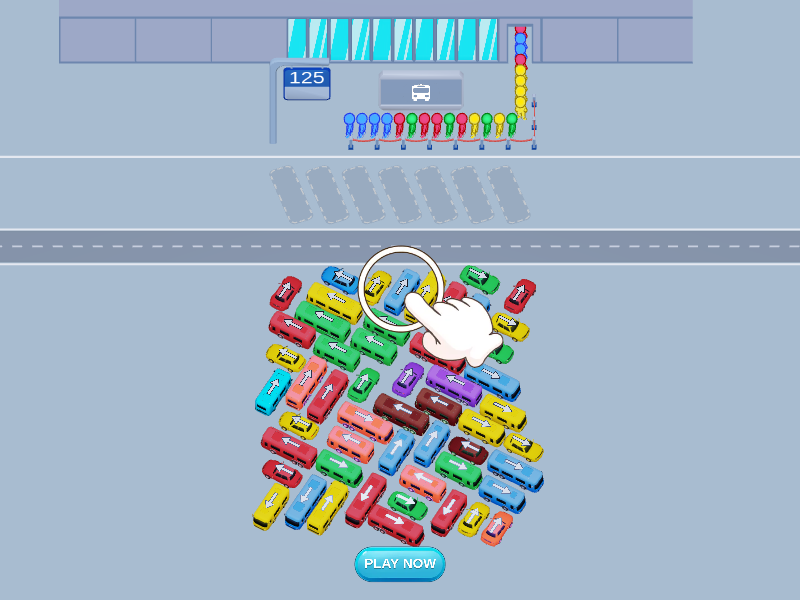 Car Jam's top creative — 115,753,248 impressions from just 15,222 placements, 7,604 per placement. First seen 2025-04-05 and still running 501 days later, the oldest active asset in this comparison.
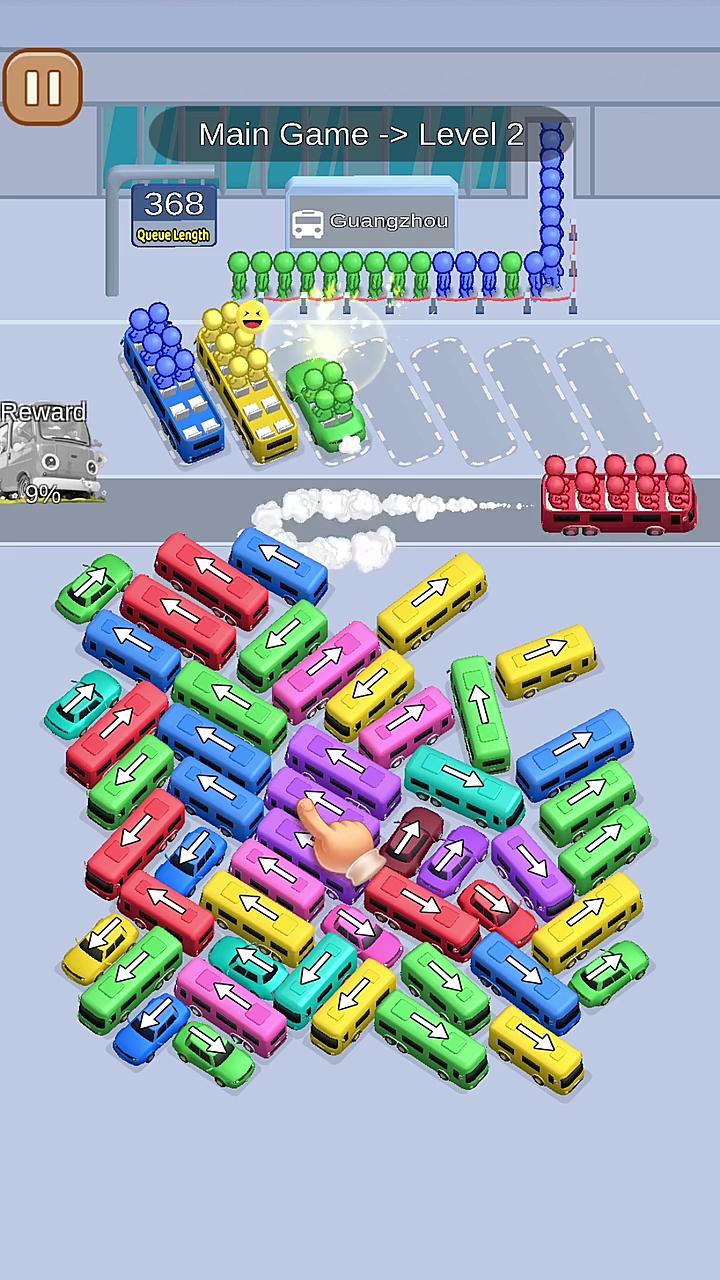 One of four Car Jam creatives first seen 2025-05-09 and still live after 467 days. All nine BLANKZONET assets deliver between 7,239 and 7,777 impressions per placement — a 1.07x spread.
GOODROID's second title: CubeAway - 3DPuzzle
GOODROID has a second product in the US top 250, and its behaviour supports the reading of Bus Traffic Fever! above.
CubeAway - 3DPuzzle appears at rank 239 with 435,037 downloads, up +40.58% period-over-period, publisher GOODROID,Inc., productId 6760325543 — which matches the iOS app ID observed on its creatives.
| Listing | Creatives sampled | Impressions | Placements | Impr/placement | Top creative | Top-creative first seen |
|---|---|---|---|---|---|---|
Android jp.co.goodroid.hyper.puzzle.arrows3dcubepuzzle | 7 | 394,695,054 | 230,024 | 1,716 | 327,264,779 | 2026-06-18 |
iOS 6760325543 | 3 | 22,068,080 | 10,558 | 2,090 | 12,412,025 | 2026-06-21 |
The same pattern repeats: two store listings under one publisher, the Android side carrying 94.7% of impressions, and one creative carrying 82.9% of the Android side. CubeAway's lead asset (327,264,779 impressions, first seen 2026-06-18) plays the same structural role that creative #1 plays for Bus Traffic Fever!.
This is a publisher-level pattern, not a product quirk. GOODROID's method appears to be: launch a dense burst of creative, find the one interactive asset the auction will place at scale, then put the account behind it and stop producing. Bus Traffic Fever! went quiet for five weeks after April. CubeAway's oldest creative dates from 2026-04-02 — the same day Bus Traffic Fever! opened — and its breakout arrived on 2026-06-18.
For a competitor, that means the thing to monitor is not GOODROID's creative volume. It is the arrival of a new no-duration asset on an Android package. That is where its accounts turn.
What +6.19% means in a market where 70% is falling
The download change deserves an honest treatment, because it is smaller than the numbers that usually justify a teardown.
What it supports: the US download estimate for this title rose from 1,151,672 to 1,222,926, an increase of 71,254, while 32 of the 46 ranked games in the top 250 declined. Over that period the fleet delivered 3.0 billion impressions and added five instances — containing three new files — at the end of July. Holding and slightly growing a 1.2-million-download base while most of the category contracts is a real result.
What it does not support: any claim about profitability, retention, or cost. A single creative delivering 1.98 billion impressions over 139 days represents a substantial and sustained spend commitment. Whether the +71,254 incremental downloads justified it is not observable from creative data.
What the creative data does add is that this looks like maintenance, not a growth push. Ninety-one percent of the fleet's impressions come from creatives launched in a nineteen-day window in April. The account then produced four creatives in two months. If GOODROID were chasing growth here, the production cadence would not look like that.
The number to watch is not the size of the next wave — it is what the next wave is made of. The late-July burst looks like a re-engagement if you count rows: five instances, 3,937,646 impressions per window-day between them, a format shift toward shorter cuts. Count files instead and it is three: one playable and two 29-second videos, permuted against two April assets. That is the cheapest possible way to refresh an account, and it is entirely consistent with the maintenance reading rather than contradicting it.
A genuine shift to a growth posture would look different in a specific, checkable way: a cohort containing four or more new video fingerprints, rather than one new playable attached to whatever is already running. That is the discriminator, and it costs one query to check.
 Instance #21 — a pure playable unit first seen 2026-08-01, 16,201,055 impressions in 18 days at 2,524 per placement. It carries playable
 2d8264ea… with no video attached — the same end card that appears in all four other instances of the late-July burst.
What transfers to your UA program
If you run media buying: the concentration here is the lesson, and it cuts both ways. GOODROID has one asset producing 66.0% of its impressions and has not retired anything in 139 days. That is enormously efficient in production cost and enormously fragile in risk terms. When instance #1 fatigues, 66.0% of the account's delivery fatigues with it, and the twenty-one backup rows combined only match its current daily rate — and those twenty-one rows are only sixteen distinct files, so the real bench is thinner than the row count suggests. If your account has a single creative above 50% of delivery, the replacement pipeline is the most important thing you are not working on.
If you run competitive intelligence: verify entity identity before you compute anything. This product runs under two names, its creatives carry the other name in their title text, and the ranking record itself pairs the iOS product ID with the Android developer ID. Joining on app name would have produced two half-fleets with no obvious sign anything was wrong. Join on appList[].id and developerId, and check whether querying the alternate name returns the identical creative ID list.
If you run creative production: the 58-second convention held for four months and then softened — but the more useful fact is that it was only ever four files. Twelve instances at exactly 58 seconds through spring resolve to four videos, two of which were recycled repeatedly; then a late-July burst whose two new videos are both 29 seconds. If your team has a fixed house length set months ago, that is a decision worth re-testing rather than inheriting — and you may also have far fewer distinct assets in market than your instance count suggests.
If you are competing with GOODROID: the exploitable structure is the production gap. Between 2026-06-25 and 2026-07-31 the account added nothing for five weeks. Its two US titles show the same rhythm — burst, find the winner, go quiet. Those quiet windows are when the fleet is least defended and most reliant on aging assets.
A falsifiable prediction
Prediction: by 2026-11-30, instance #1 will still be live and will still hold more than 50% of the fleet's window impressions; GOODROID will have launched at least one additional cohort; and that cohort will contain no more than three new video fingerprints.
The basis for the first half: this account has retired nothing in 139 days, and instance #1 is accumulating at 66,119,648 impressions per window-day — 1.8x the other twenty-one rows combined. Even if a new cohort triples the fleet's non-leader output, the leader's 1.98-billion head start does not fall below 50% within 103 days at any plausible rate.
The basis for the second half: GOODROID has now produced two bursts (April, then late July) separated by a fourteen-week gap. A third burst before end of November fits the observed cadence.
The third clause is the one worth betting on, and it is the clause the fingerprint data made possible. In 139 days GOODROID has produced nine video files for this title, seven of them inside a single April window. The late-July burst — its only new production in four months — contained two. A publisher that ships two new videos per wave is not going to ship four, and the permutation layer is doing the work that new footage would otherwise do.
The interesting failure mode is instance #1 disappearing. GOODROID has never retired an asset for this title, so the first retirement would be a genuine signal — and if it is the leader, the account changes character overnight. The second-most interesting failure mode is a cohort with five or more new videos, which would mean the production constraint I am inferring is not real.
How to reproduce this teardown
- Resolve the entity before pulling anything. Query the creative database with every name the product is known by. If two queries return the same creative ID list in the same order, you are looking at one product with multiple store listings, not two products.
- Never join creative data to chart data on app name. Join on
appList[].idagainst the chart row'sproductId, and cross-checkdeveloperId. In this case the chart row carries the iOSproductIdwith the AndroiddeveloperId— a mismatch that only shows up if you check both fields. - Compute each row's share of fleet impressions and of fleet placements separately. Instance #1 here is 66.0% of impressions and 64.2% of placements; instance #20 is 0.6% of impressions and 10.2% of placements. When those two figures diverge sharply, the row is doing something structurally different from its siblings.
- Split by store listing before computing any fleet average, and check for single-row distortion. The 2,214 fleet-wide impressions-per-placement figure describes neither the Android group (1,979) nor the iOS group (3,222) accurately — and the Android figure is itself pulled down from 2,264 to 1,979 by one outlier row.
- Sort by first-seen date and look for production gaps. The five-week silence between 2026-06-25 and 2026-07-31 is the most actionable thing in this dataset and is invisible in any impression-ranked view.
- Compute impressions per day against the measurement window, not the asset's age. The
impressionfield is a rolling 30-day figure, so the divisor must be the days each row spent inside that window — 30 for anything older, its own age for anything newer. Dividing by full age understates older assets in proportion to their age, and in this fleet that error was a factor of 4.6 on the leader.
Methodology and data notes
- Source: AdMapix creative search and ranking APIs, queried 2026-08-19, country filter
US, creatives sorted by impressions descending, sample size 30 per keyword. - Entity resolution: queries for
Bus Traffic FeverandBus Rush Feverreturned identical creative ID lists in identical order. TheappListentry surfaced on each row varies with the query keyword, alternating between iOS6759763476("Bus Traffic Fever!", developer ID366495350) and Androidjp.co.goodroid.hyper.busflow("Bus Rush Fever!", developer ID1635471560), both published byGOODROID,Inc.. The creative-ownedtitlefield reads "Bus Rush Fever!" on rows resolving to the iOS listing. The download-chart row carriesproductId6759763476withdeveloperId1635471560. All are treated as one product; listing-level figures are reported separately. No figure in this article was joined on app name. - Sample composition: the pull for this keyword returned 22 top rows attributable to GOODROID's bus title (by
developerId1635471560or366495350) plus rows belonging to6505095234(Car Jam, BLANKZONET) and other publishers. These are reported as separate fleets throughout and are never combined. - Measurement window (important): the
impressionfield returned by this API is a rolling 30-day figure, not a lifetime total. All impression figures in this article are for the window 2026-07-20 → 2026-08-19 (verified: an explicit query for those dates returns values identical to the default query, row for row). Pulling the same rows with a wider window returns substantially larger numbers. Wording such as "carries", "delivers" and "runs at" throughout refers to this 30-day window; nothing here is a lifetime cumulative figure. Daily rates here divide window impressions by 30, uniformly. The test for whether a rate column is usable at all is the share of window delivery coming from rows live for the entire window; this fleet sits at 96.1% (17 of 22 rows), comfortably above the ~60% threshold. Five rows entered mid-window and are therefore understated by the uniform divisor; they are flagged where it matters. - Rows are ad instances, not production assets. Each row is a distinct delivery record with its own impressions, placements and date range. Deduplicating on the
videoFpandplayHtmlFpasset fingerprints, the 22 rows resolve to 9 distinct videos and 8 distinct playables. Impressions are reported per row and are not double-counted, so all impression totals here are unaffected; every count of "how many things were made" is stated in asset terms and labelled as such. - Sampling boundary: this is the top 22 rows by impressions, carrying 85.8% of GOODROID's total measurable US delivery for this title. The remaining delivery sits in a long tail of very low-impression rows. The row count here is a sample size, not a fleet census.
- "Days live" is the span between first-observed and last-observed timestamps. All 21 GOODROID creatives and all 9 Car Jam creatives showed a last-observed date equal to the pull date and are treated as live.
- "Placements" (
showCnt) counts recorded creative appearances, not unique users or unique publishers. Impressions-per-placement is a distribution-shape indicator, not a frequency metric. - Impressions are third-party estimates, not publisher-reported figures and not spend. They support relative comparison and should not be converted to dollar figures.
- Download figures are US-region estimates for the current ranking period. The +6.19% is a period-over-period change in that estimate against a prior-period figure of 1,151,672. It is not a user-growth, revenue, or install-quality measure.
- Market context ("70% of ranked games declining") counts the 46 titles in the US top 250 carrying the games classification, of which 32 recorded a negative
growthPercenton the pull date. - CubeAway figures were pulled with the same method, sample size 10, and are keyed to the app IDs observed on those creatives; the chart join was verified on
productId6760325543. - Store information is available on the App Store listing. Publisher information is available at goodroid.co.jp.
- Coverage is limited to creatives observable through third-party ad monitoring.
Frequently Asked Questions
Are Bus Traffic Fever! and Bus Rush Fever! the same game?
Yes. Both names belong to one product published by GOODROID,Inc. — Bus Traffic Fever! is the US App Store listing (6759763476) and Bus Rush Fever! is the Android package (jp.co.goodroid.hyper.busflow). Querying either name returns an identical list of creative IDs in identical order, and the ad creatives themselves carry the title text "Bus Rush Fever!" even when attributed to the iOS listing.
How many ads is Bus Traffic Fever! running in the US? Twenty-two measurable ad instances as of 2026-08-19, totalling 3,004,140,963 impressions across 1,357,007 placements. Those instances resolve to nine distinct video files and eight distinct playables — 17 production assets, not 22. All twenty-two were still live on that date; GOODROID has not retired anything for this title since the account opened on 2026-04-02.
What is Bus Traffic Fever!'s best-performing ad creative? A playable-format instance first seen 2026-04-02, carrying 1,983,589,426 impressions across 871,103 placements — 66.0% of fleet impressions. At 66,119,648 impressions per window-day it accumulates 1.8x faster than the other twenty-one instances combined. Notably, its delivery density (2,277 per placement) is below the fleet median; it wins on placement volume, not intensity.
Why did Bus Traffic Fever!'s downloads grow while most games declined? US downloads rose from 1,151,672 to 1,222,926, a +6.19% change and +71,254 absolute, on a pull date when 32 of the 46 ranked games in the US top 250 recorded negative changes. The creative data shows 91.1% of fleet impressions come from twelve creatives launched in a nineteen-day window in April, which is consistent with sustained maintenance spend rather than a growth push.
How long are Bus Traffic Fever!'s ads? Twelve of the twenty-two ad instances are exactly 58 seconds and one is 59 — but those thirteen instances resolve to only five distinct video files, two of which account for nine of them. Three instances are 29 seconds (three distinct videos), two are 30 (one video), and four record no video duration at all. Excluding one outlier row, the 58-second band delivers at the highest density in the fleet, 3,324 impressions per placement.
What changed in GOODROID's advertising at the end of July 2026? After a five-week production gap, five ad instances launched on 2026-07-31 and 2026-08-01 — but they contain only three new files: two 29-second videos and one playable, permuted against two videos already running since April. All five carry the same playable. They represent 3.9% of window impressions and 3,937,646 impressions per window-day between them. Four of the five are 30 seconds or shorter, a departure from the fleet's 58-second standard.
How does Bus Traffic Fever! compare to Car Jam?
Car Jam (BLANKZONET, 6505095234) competes for the same keyword space with a nearly opposite strategy: nine instances averaging 401 days old, delivering 7,462 impressions per placement against GOODROID's 2,214, in an exceptionally tight 1.07x band. Car Jam produced 495,829,462 impressions from just 66,451 placements — roughly one-eighteenth of GOODROID's placement volume for one-sixth of the impressions.
Want to check whether a competitor is running under a second name you have not found? Creative IDs, store-listing IDs, developer IDs, per-creative impressions, placement counts and first-seen dates are all live in AdMapix, filterable by country, publisher and app ID. Create a free account to resolve any title in your category properly, or see plans for full historical access.
Data source: AdMapix third-party ad intelligence estimates, United States, retrieved 2026-08-19. Impression and download figures are modelled estimates for comparative analysis and are not publisher-reported. Figures change as new creatives enter rotation. </content> </invoke>
Related Reading
- Ad strategy teardowns (series index) — every teardown in the series, in publication order
- Mobile game ads guide: formats, examples and research — the format matrix, research workflow and KPI guardrails every teardown in this series applies
- Voodoo — Paper.io 2 and Hole.io are not being advertised, they are being farmed
- MONOPOLY GO! — one creative at 1.85B impressions inside a 7-billion machine
- Roblox — 1.5B US impressions, 61% of it launched inside three days
Turn these observations into your next creative study
Open the creative library and select samples for your market, network and research question.
Related Articles
Oakever Games UA Playbook 2026: 4.8 Billion Impressions, 1,320 Videos, and the Title That Spends Like a Winner but Doesn't Convert Like One
A publisher-level teardown of Oakever Games across Meowdoku!, Amaze GO! and Tile Explorer in the US. Nearly 2,500 measured ad instances carry 4.83 billion impressions off 1,320 distinct video assets. Amaze GO! carries the most impressions of the three and converts at a fifth of its siblings' rate — and the ad data also captures a live app rename, from Arrows GO! to Amaze GO!, in progress.

DramaBox Ad Strategy 2026: One Serial Hook Takes 75.5% of the Top 10
DramaBox's recent US Top 10 is a portfolio with a sharp center: one 111-second drama video fingerprint appears twice and contributes 75.5% of the visible scale, while shorter cuts test more story archetypes.
Pixel Flow! Ad Strategy 2026: One Playable Took 2.3 Billion Impressions in 30 Days, and Loom Games Rebuilt the Fleet Around It on 2026-08-04
Loom Games' Pixel Flow! runs the largest single creative we have measured: one playable with 2,298,804,130 US impressions across 2,113,657 placements inside a single 30-day window, 78.1% of the top-fifteen fleet. On 2026-08-04 Loom retired ten creatives and launched three on the same date — and every one of the ten retirements was a video, while all four of the fleet's pure playables were left untouched. Downloads are down 19.29%, revenue down 23.07%.