
Pixel Flow! Ad Strategy 2026: One Playable Took 2.3 Billion Impressions in 30 Days, and Loom Games Rebuilt the Fleet Around It on 2026-08-04
Loom Games' Pixel Flow! runs the largest single creative we have measured: one playable with 2,298,804,130 US impressions across 2,113,657 placements inside a single 30-day window, 78.1% of the top-fifteen fleet. On 2026-08-04 Loom retired ten creatives and launched three on the same date — and every one of the ten retirements was a video, while all four of the fleet's pure playables were left untouched. Downloads are down 19.29%, revenue down 23.07%.
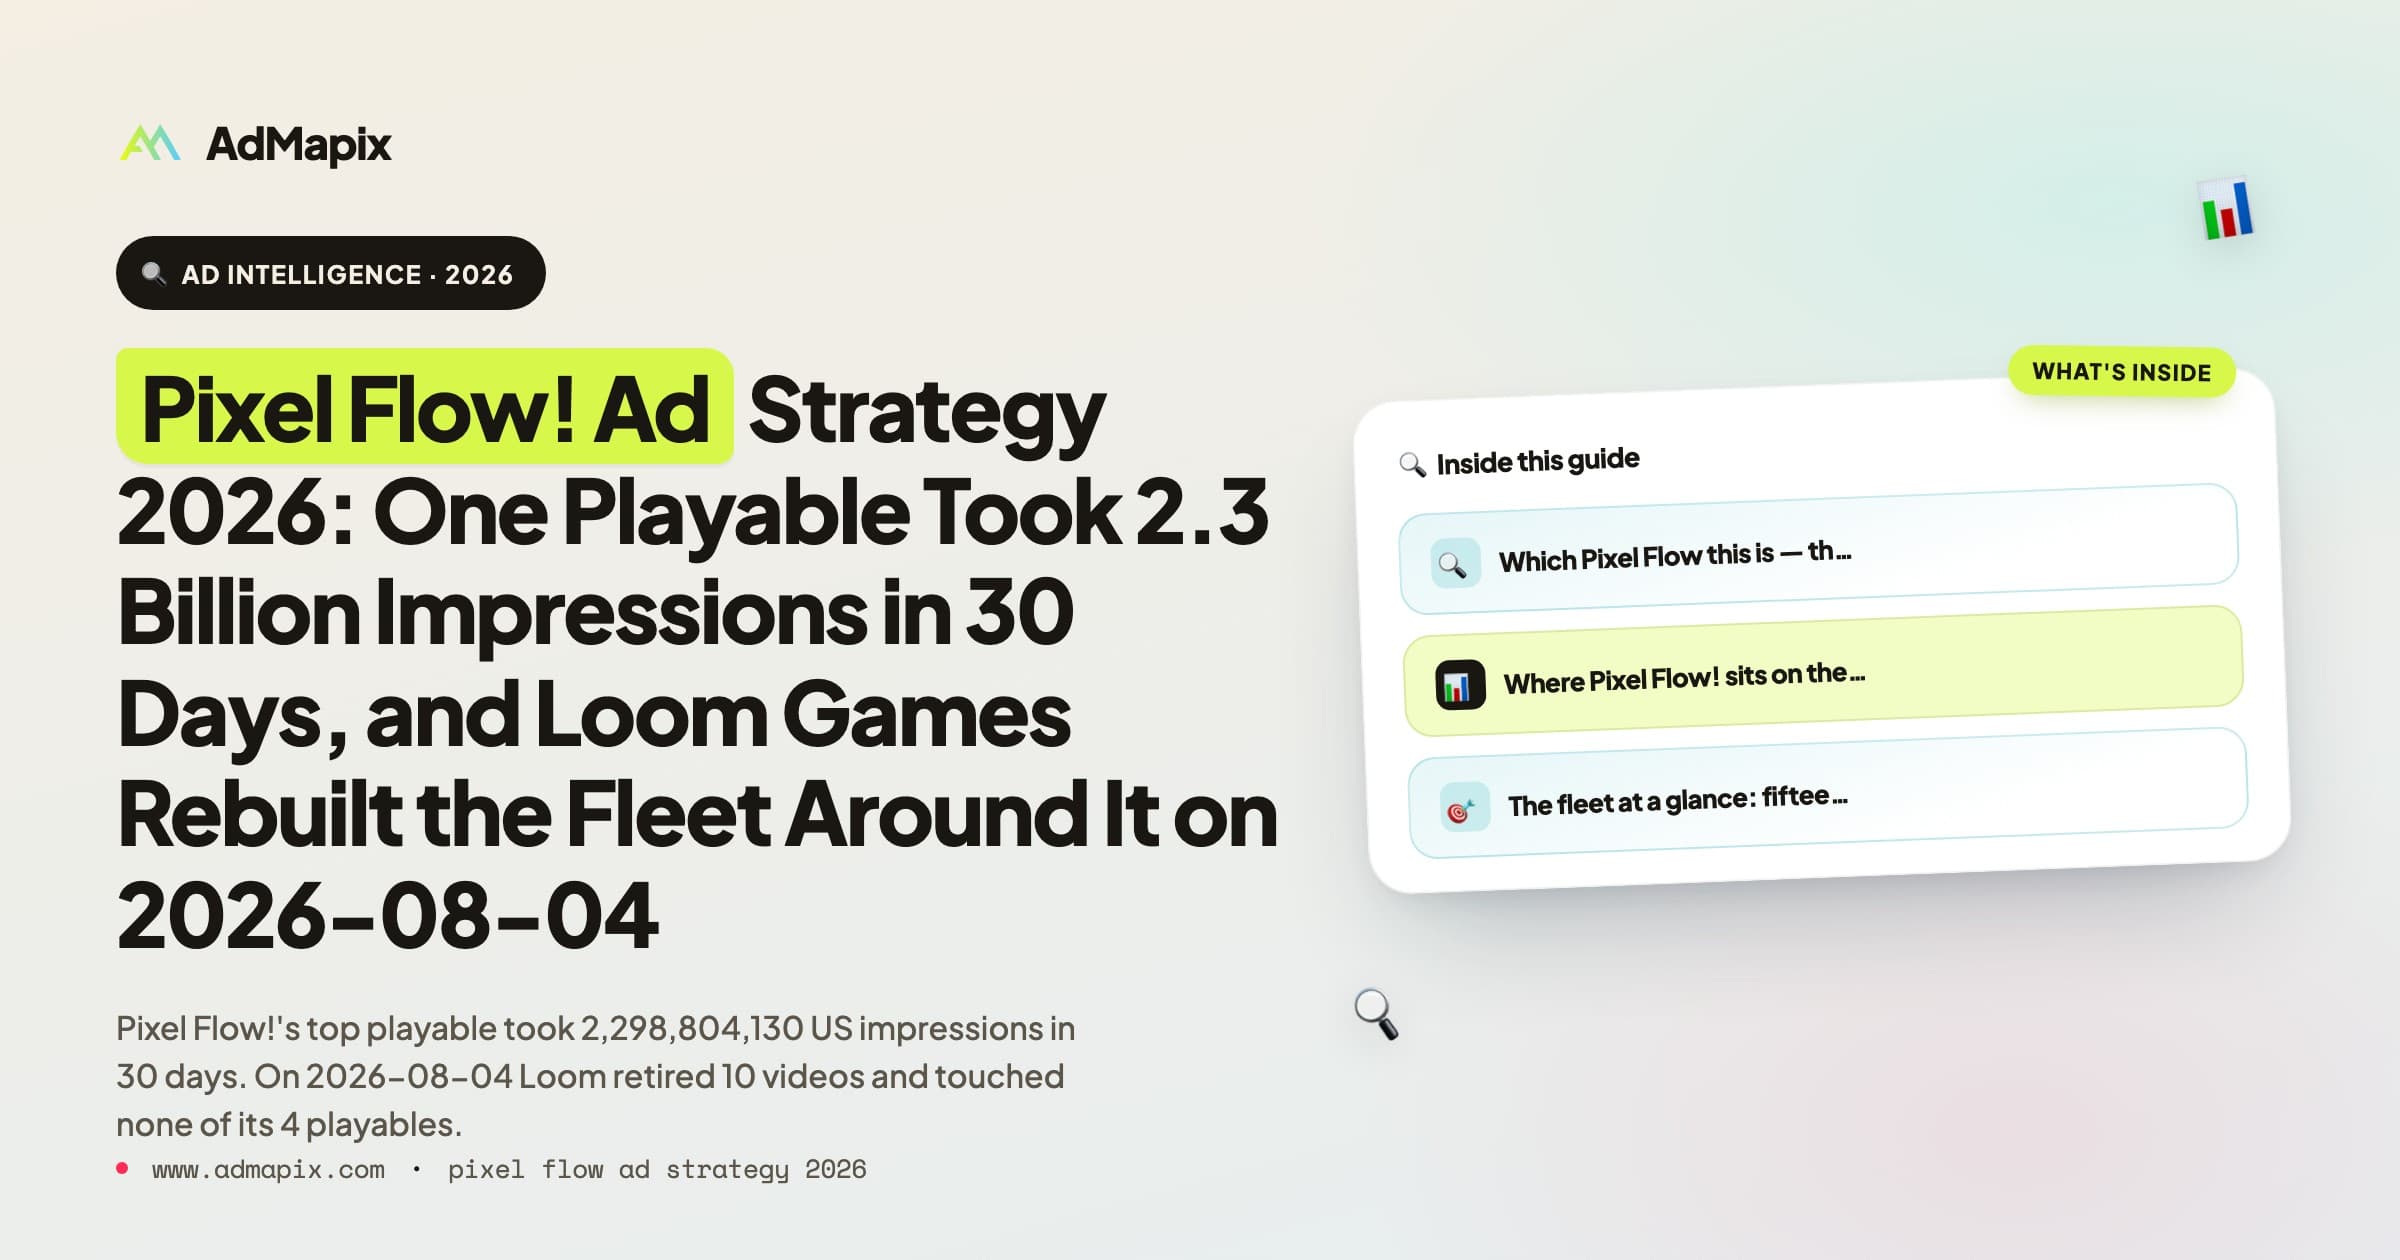
Loom Games' Pixel Flow! runs the single largest creative we have measured anywhere. One playable unit, first observed 2025-12-13, took 2,298,804,130 US impressions across 2,113,657 placements inside a single 30.6-day measurement window. It is 78.1% of the top-fifteen fleet, and at 75,199,437 impressions per window-day it delivers 7.1x faster than the next asset in the account.
On 2026-08-04, Loom Games retired ten of the forty-five creatives we sampled and launched three new ones on the same date. Every one of the ten retirements was a video. Not one of the fleet's four pure playables was touched — and those four carry 75.1% of the window's impressions between them.
That is the shape of this account: four interactive units doing three-quarters of the work, and a video layer that Loom churns a third of in a single day. It is being run that way into a decline — downloads -19.29%, revenue -23.07%.
Executive summary (TL;DR)
- The largest creative in this series. Creative #1, a playable, took 2,298,804,130 impressions across 2,113,657 placements at 1,087.6 per placement inside a 30.6-day window, first seen 2025-12-13 and live for all of it. At 75,199,437 impressions per window-day it is 7.1x the next-fastest asset.
- 2026-08-04 was a video purge. Ten of forty-five sampled creatives were last observed that date, carrying 147,124,346 window impressions. All ten were videos. Three creatives launched the same day.
- Playables are protected. All four pure playables were live on the pull date, at ages from 15 to 312 days, and none was touched by the purge. Videos: 28 of 41 live.
- December 2025 still dominates. Two creatives from that month are 76.7% of window volume and 65.1% of window-day output. The August cohort is 5.2% and 9.3%.
- Four playables carry 75.1%. Across 45 creatives, four pure playables hold 2,325,057,177 impressions at 1,082.1 per placement against forty-one videos' 770,251,218 at 574.8.
- Android is the account. 38 of 45 creatives resolve to
com.loomgames.pixelflowand carry 92.4% of impressions at 962.1 per placement. The seven iOS creatives carry 7.6% at 370.5. - Two runtimes, sixteen creatives each. 59-second and 60-second cuts are 32 of the 41 videos. They deliver at 447.4 and 529.9 respectively — a 1.18x gap for a one-second difference.
- The oldest asset is 305 days old and still live. A playable first seen 2025-10-11 is still running and produces 0.3% of the fleet's daily output.
- Both chart lines are falling. Download rank 143 at -19.29%; revenue rank 114 at -23.07%.
All figures are AdMapix third-party estimates for the United States, pulled 2026-08-19. Identity resolution and methodology at the end.
Which Pixel Flow this is — three name collisions
"Pixel Flow" returns four distinct products in the US result set, and three of them are not this one:
| Product | Unified product ID | Publisher | Lifetime materials | Lifetime impressions |
|---|---|---|---|---|
| Pixel Flow! | 6751056652 | Loom Games | 16,562 | 213,359,297,665 |
| Doodle Pixel Flow | 6758148662 | ACTIONFIT | 4 | 18,595,485 |
| Pixel Flow Shooter | com.funlab.pixel.flow.shooter | Funlab Games | — | 182,738 |
| Bus Jam: Pixel Flow | com.zi.crazy.busjam.traffic.sort.puzzle | Zero Immersive | — | 0 |
The scale gap makes this collision relatively forgiving — Doodle Pixel Flow's entire lifetime impression total is 18.6 million against Loom's 213.4 billion, a ratio of 11,474 to 1 — but a keyword pull will still return their creatives mixed in, and none of them appear in this teardown.
The identity record:
| Field | Value |
|---|---|
| Unified product name | Pixel Flow! |
| Unified product ID | 6751056652 |
| Unified company | Loom Games Oyun Yazilim ve Pazarlama Anonim Sirketi |
| Unified company ID | 1349571520 |
| Constituent product IDs | 6751056652 · com.loomgames.pixelflow |
| Category path | 602 → 60224 → 6022401 (Games → Puzzle) |
| Lifetime unique materials | 16,562 |
| Lifetime global impressions | 213,359,297,665 |
| Lifetime spend index | 228,925,990 |
And the two-company platform split that runs through this entire batch:
1349571520— "Loom Games Oyun Yazilim ve Pazarlama Anonim Sirketi", on iOS product6751056652778463702— "Loom Games A.Ş.", on Android packagecom.loomgames.pixelflow
Same company, one name written out in full Turkish and one abbreviated, two unrelated AdMapix IDs. Filter on the unified company ID — the iOS one — and you drop 38 of 45 creatives and 92.4% of the fleet's impressions.
Everything in this teardown is locked to unified product 6751056652, Loom Games, and to creatives resolving to one of its two constituent product IDs. Store listings: App Store and Google Play.
Where Pixel Flow! sits on the US charts
| Metric | Value |
|---|---|
| US download rank | 143 |
| Downloads (current period) | 622,046 |
| Download change | -19.29% |
| US revenue rank | 114 |
| Revenue index (current period) | 13,870,682 |
| Revenue change | -23.07% |
| Publisher | Loom Games |
| iOS app ID | 6751056652 |
| Android package | com.loomgames.pixelflow |
| AdMapix company IDs | 1349571520 (iOS) · 778463702 (Android) |
Pixel Flow! is one of the few titles in this batch that appears on both charts, and both are falling. Revenue is declining faster than downloads — -23.07% against -19.29% — which is the wrong way round for a title whose ad fleet is being expanded.
The puzzle category around it is falling too. On the same US download chart: Block Out! at rank 22 with 0.00% change, Magic Sort! at 44 with -17.85%, Block Blast! at 69 with -22.63%, Arrows – Puzzle Escape at 81 with -34.65%. Loom's -19.29% is unremarkable within that set — the category is contracting, and Pixel Flow! is contracting with it.
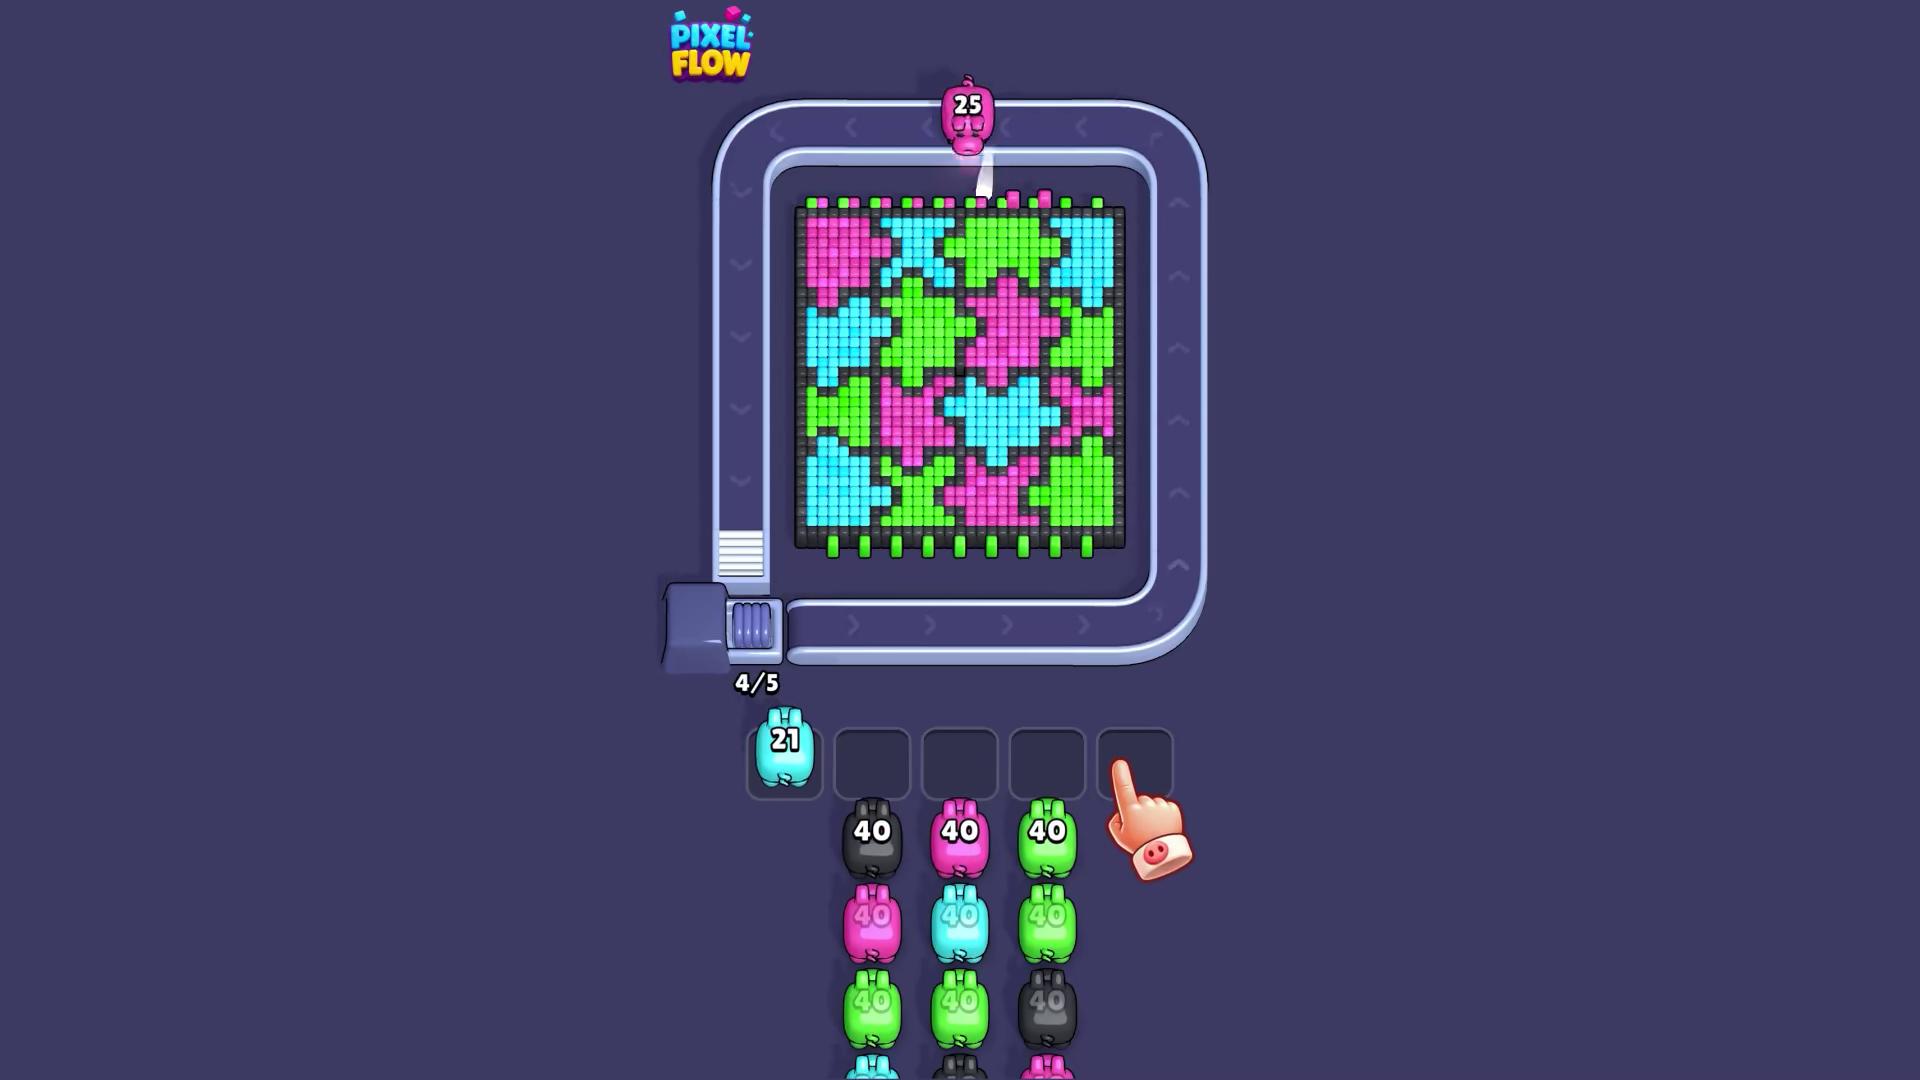 Creative #2 — a 59-second video on the iOS build, first observed 2026-08-04, the same day ten other creatives stopped. It took 154,459,662 impressions across 517,440 placements at 298.5 per placement during its 14.6 days inside the measurement window — 10,591,503 per window-day, the second-fastest asset in the account and one-seventh the rate of the playable at the top.
The fleet at a glance: fifteen creatives, four stopped on one day
| # | Window impressions | Share | Placements | Impr/placement | First seen | Last seen | Days since first seen | Days live in window | Format | Impr/window-day |
|---|---|---|---|---|---|---|---|---|---|---|
| 1 | 2,298,804,130 | 78.1% | 2,113,657 | 1,087.6 | 2025-12-13 | 2026-08-19 | 249 | 30.6 | playable | 75,199,437 |
| 2 | 154,459,662 | 5.2% | 517,440 | 298.5 | 2026-08-04 | 2026-08-19 | 15 | 14.6 | 59s | 10,591,503 |
| 3 | 141,407,727 | 4.8% | 284,390 | 497.2 | 2026-05-09 | 2026-08-19 | 102 | 30.6 | 59s | 4,625,809 |
| 4 | 75,550,480 | 2.6% | 27,402 | 2,757.1 | 2025-12-13 | 2026-08-19 | 249 | 30.6 | 53s | 2,471,440 |
| 5 | 61,191,776 | 2.1% | 73,280 | 835.0 | 2026-07-28 | 2026-08-04 | 22 | 7.2 | 59s | 8,440,380 |
| 6 | 36,522,911 | 1.2% | 110,366 | 330.9 | 2026-07-28 | 2026-08-19 | 22 | 22.3 | 60s | 1,638,774 |
| 7 | 32,929,808 | 1.1% | 23,643 | 1,392.8 | 2026-03-14 | 2026-08-19 | 158 | 30.6 | 59s | 1,077,266 |
| 8 | 22,333,289 | 0.8% | 22,791 | 979.9 | 2026-07-23 | 2026-08-04 | 27 | 11.7 | 60s | 1,904,959 |
| 9 | 19,572,573 | 0.7% | 19,031 | 1,028.5 | 2026-07-23 | 2026-08-04 | 27 | 11.6 | 60s | 1,685,737 |
| 10 | 19,391,743 | 0.7% | 29,013 | 668.4 | 2026-06-26 | 2026-08-19 | 54 | 30.6 | 60s | 634,365 |
| 11 | 19,372,723 | 0.7% | 29,257 | 662.2 | 2026-07-22 | 2026-08-19 | 28 | 28.3 | 60s | 684,219 |
| 12 | 18,857,148 | 0.6% | 27,500 | 685.7 | 2025-10-18 | 2026-08-19 | 305 | 30.6 | playable | 616,872 |
| 13 | 18,033,539 | 0.6% | 38,873 | 463.9 | 2026-05-10 | 2026-08-19 | 101 | 30.6 | 59s | 589,933 |
| 14 | 13,008,349 | 0.4% | 6,643 | 1,958.2 | 2025-11-14 | 2026-08-04 | 278 | 15.6 | 47s | 835,518 |
| 15 | 11,465,183 | 0.4% | 21,417 | 535.3 | 2026-04-07 | 2026-08-19 | 134 | 30.6 | 53s | 375,059 |
| Total | 2,942,901,041 | 100% | 3,344,703 | 879.9 | — | — | 118.1 avg | — | — | 111,371,271 |
Creative #1 is 78.1% of the fleet. That is the highest single-asset concentration in this teardown series — higher than Solitaire Associations Journey's 45.4%, higher than Mahjong Blast's 59.0%.
A note on the two rightmost columns, because they are easy to conflate. These impression figures are totals inside a 30.6-day window running 2026-07-20 to 2026-08-19; they are not lifetime totals. "Days since first seen" is a lifetime quantity ranging from 15 to 305 here, and it is the wrong denominator — dividing a 30-day impression count by 249 days of age understates creative #1's rate by a factor of eight. "Days live in window" is the overlap between each creative's observed life and the measurement window, and that is what the rate column divides by.
Do that correctly and creative #1 is not merely the biggest asset, it is also the fastest: 75,199,437 impressions per window-day against creative #2's 10,591,503, a 7.1x gap. The newest asset in the account is not catching it.
The impressions-per-placement column spans 298.5 to 2,757.1, a 9.24x range. Unlike Solitaire Associations Journey, where format made no difference, here the two populations are genuinely distinct.
The 2026-08-04 fleet swap
Thirteen of the forty-five sampled creatives had stopped by the pull date. Their last-observed dates:
| Last observed | Creatives | Window impressions | Format |
|---|---|---|---|
| 2026-08-04 | 10 | 147,124,346 | all 10 video |
| 2026-08-08 | 2 | 7,172,559 | video |
| 2026-08-18 | 1 | 2,819,237 | video |
Ten creatives, one date. And on that same date, three new creatives entered:
| Launched 2026-08-04 | Creatives | Window impressions | Impr/window-day |
|---|---|---|---|
| New cohort | 3 | 161,445,075 | 11,073,116 |
The composition is the finding. Every creative Loom retired on 2026-08-04 was a video, and every creative it has ever retired in this sample was a video. All four pure playables — aged 15, 249, 283 and 312 days at the pull date — were live. Thirteen of forty-one videos were not.
We are deliberately not framing this as "capacity removed versus capacity added". Both sides of that comparison would be window impressions divided by different window overlaps, and the retired assets stopped partway through the window while the new ones started partway through it. The quantity that is measured cleanly here is what kind of asset Loom was willing to kill, and the answer is unambiguous.
We verified that 2026-08-04 is not a monitoring artifact by checking the last-observed date distribution across seven unrelated US fleets pulled the same day: Solitaire Grand Harvest, Solitaire Cash, Solitaire Clash, Water Sort, Block Blast!, NBA 2K Mobile and eFootball. The date appears in none of them. Those accounts do have clustered stop dates — eFootball has ten of fifteen on 2026-08-12, NBA 2K Mobile five on 2026-08-13 — but they are account-specific, not a shared crawl boundary.
One coincidence we note without explaining: 82-0.com, an unrelated sports title from an unrelated publisher, also retired five of its top-fifteen creatives on 2026-08-04.
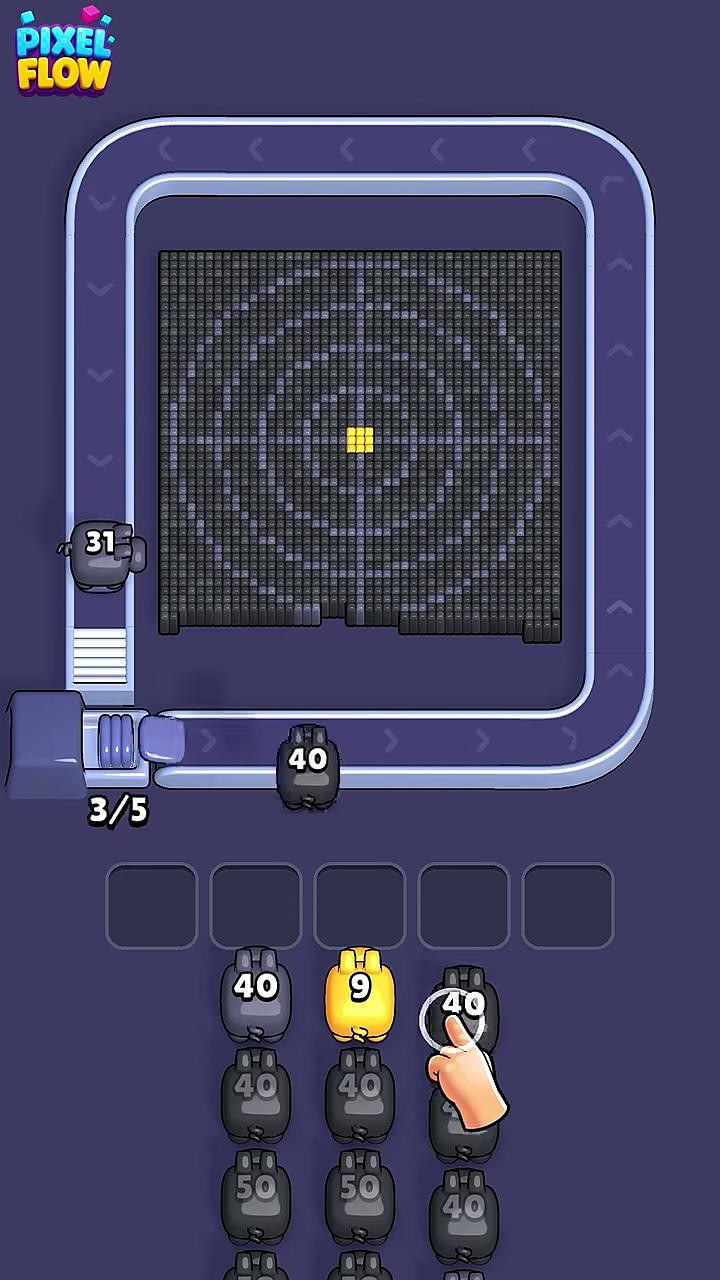 Creative #3 — 59 seconds, Android, first seen 2026-05-09 and still live after 102 days. 141,407,727 window impressions across 284,390 placements at 497.2 per placement, 4,625,809 per window-day. It survived the 2026-08-04 swap that removed ten of its siblings.
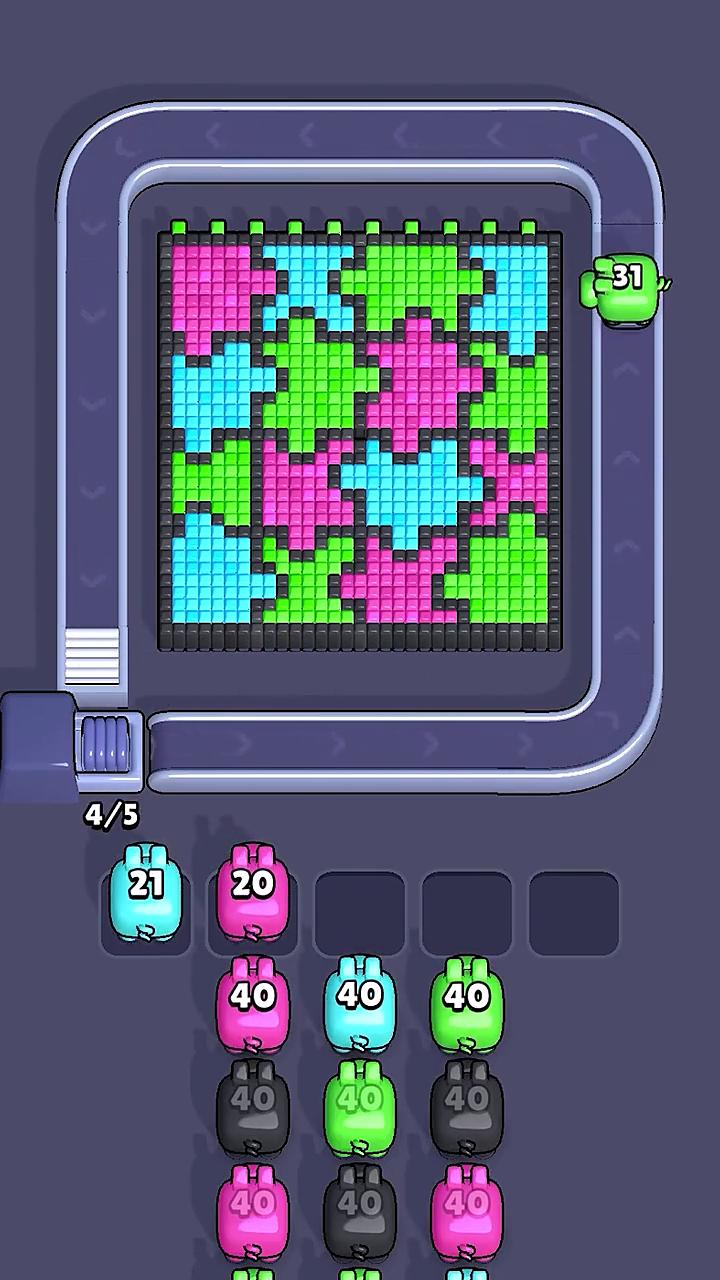 Creative #4 — 53 seconds, Android, first seen 2025-12-13 on the same date as the fleet's giant playable and still live after 249 days. 75,550,480 impressions across just 27,402 placements at 2,757.1 per placement, the densest asset in the account by a factor of 1.4 and by a factor of 9.2 over the newest creative.
Two December creatives are still three-quarters of the account
Grouping all forty-five sampled creatives by launch month, over the same 30.6-day measurement window:
| Cohort | Creatives | Window impressions | Share of volume | Impr/window-day | Share of output |
|---|---|---|---|---|---|
| 2025-10 | 3 | 26,879,774 | 0.9% | 879,527 | 0.7% |
| 2025-11 | 4 | 30,738,430 | 1.0% | 1,567,682 | 1.3% |
| 2025-12 | 2 | 2,374,354,610 | 76.7% | 77,670,876 | 65.1% |
| 2026-03 | 2 | 40,159,769 | 1.3% | 1,313,846 | 1.1% |
| 2026-04 | 8 | 45,199,643 | 1.5% | 1,478,724 | 1.2% |
| 2026-05 | 8 | 194,299,356 | 6.3% | 6,356,125 | 5.3% |
| 2026-06 | 1 | 19,391,743 | 0.6% | 634,365 | 0.5% |
| 2026-07 | 14 | 202,839,995 | 6.6% | 18,404,291 | 15.4% |
| 2026-08 | 3 | 161,445,075 | 5.2% | 11,073,116 | 9.3% |
Two creatives launched in December 2025 are 76.7% of this fleet's window volume and 65.1% of its per-day output. The seventeen creatives shipped across July and August 2026 are 11.8% and 24.7%.
The newer cohorts do sit slightly higher on output share than on volume share, and it is worth being precise about why, because the obvious reading is wrong. A creative that entered on 2026-08-04 was only alive for 14.6 of the window's 30.6 days, so its output rate is computed over a shorter denominator. Part of that gap is therefore mechanical, not strategic. Inside a single 30-day window you cannot cleanly separate "the new cohort is accelerating" from "the new cohort was only present for half the window" — and any analysis that reports a cohort's "share of cumulative volume" against its "share of current rate" from one window read is at risk of manufacturing a trend out of that arithmetic.
What the table does establish, and what does not depend on the denominator: December 2025 leads on both measures, by a wide margin, and it does so with two assets against seventeen.
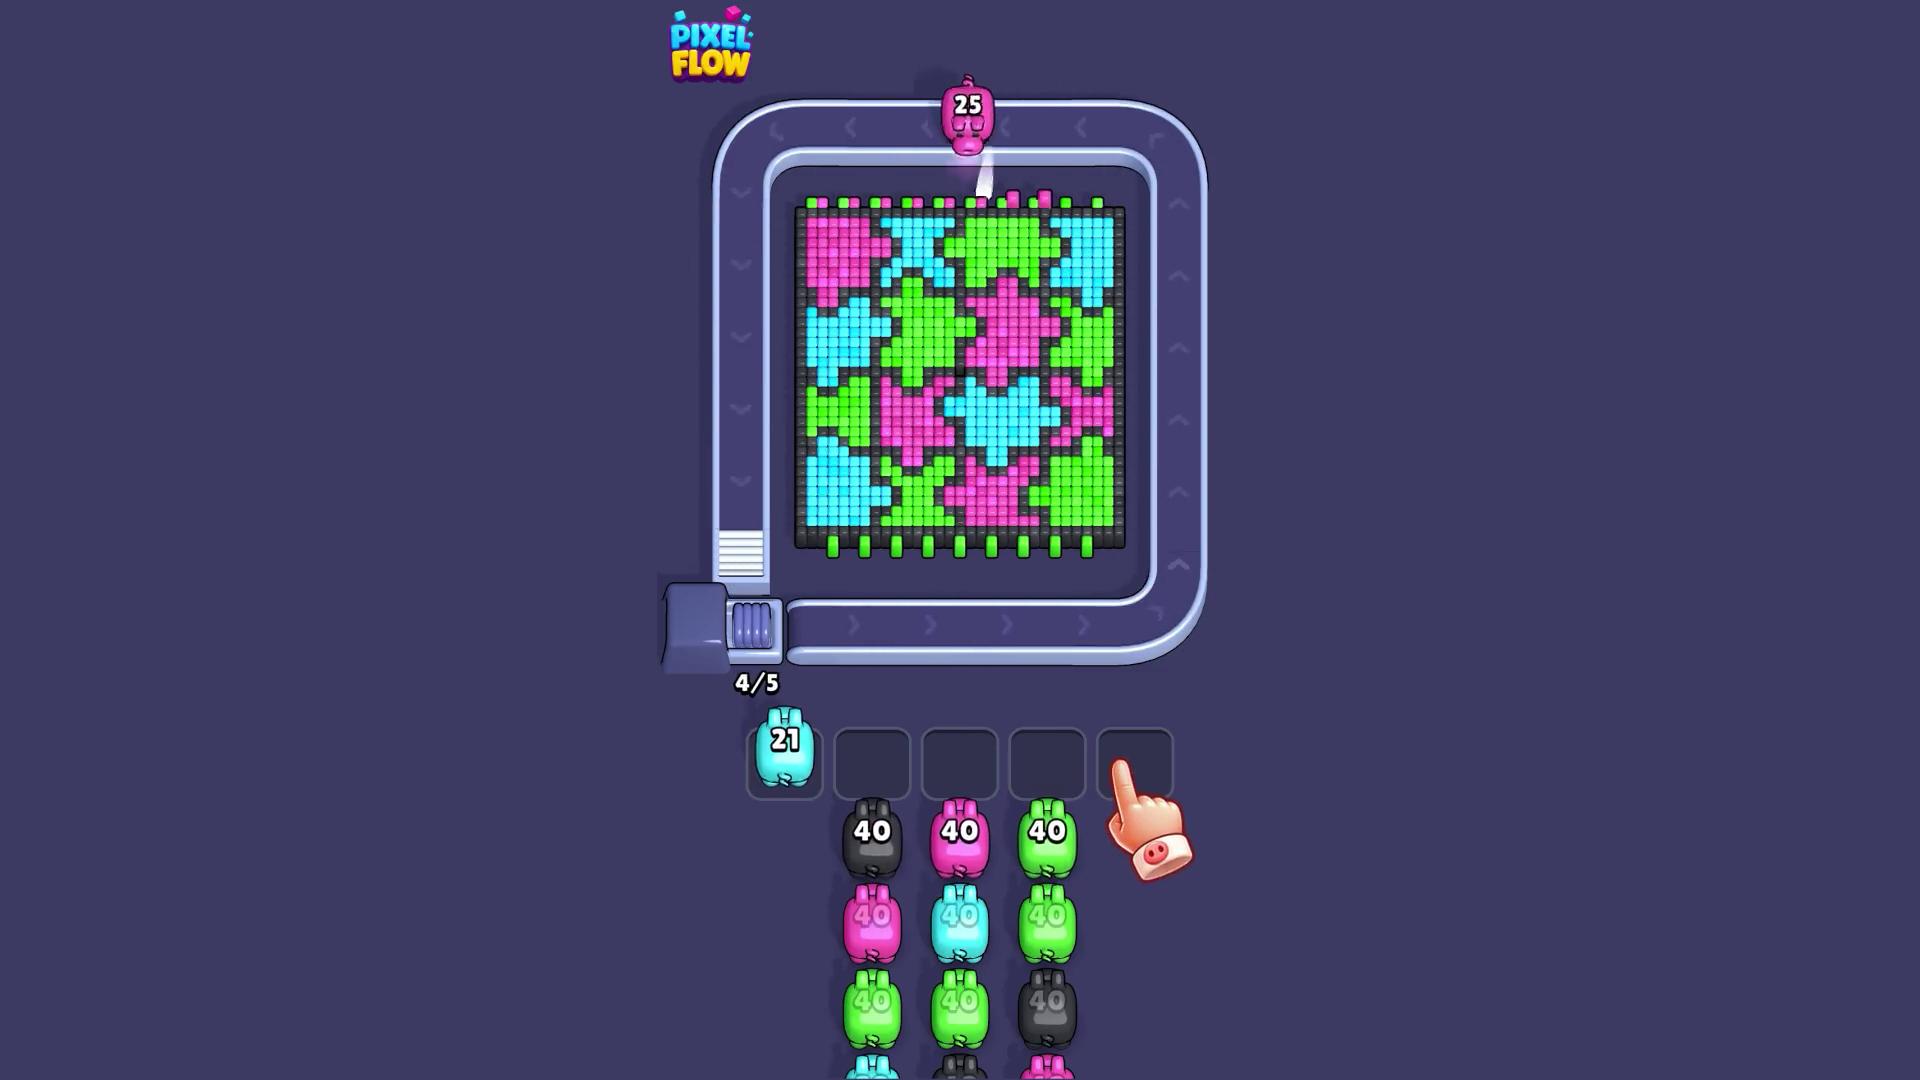 Creative #5 — 59 seconds, iOS, first seen 2026-07-28 and last seen 2026-08-04, giving it 7.2 days inside the measurement window. It took 61,191,776 impressions across 73,280 placements at 835.0 per placement — 8,440,380 per window-day, the third-fastest rate in the fleet. It was killed a week after launch in the 2026-08-04 batch.
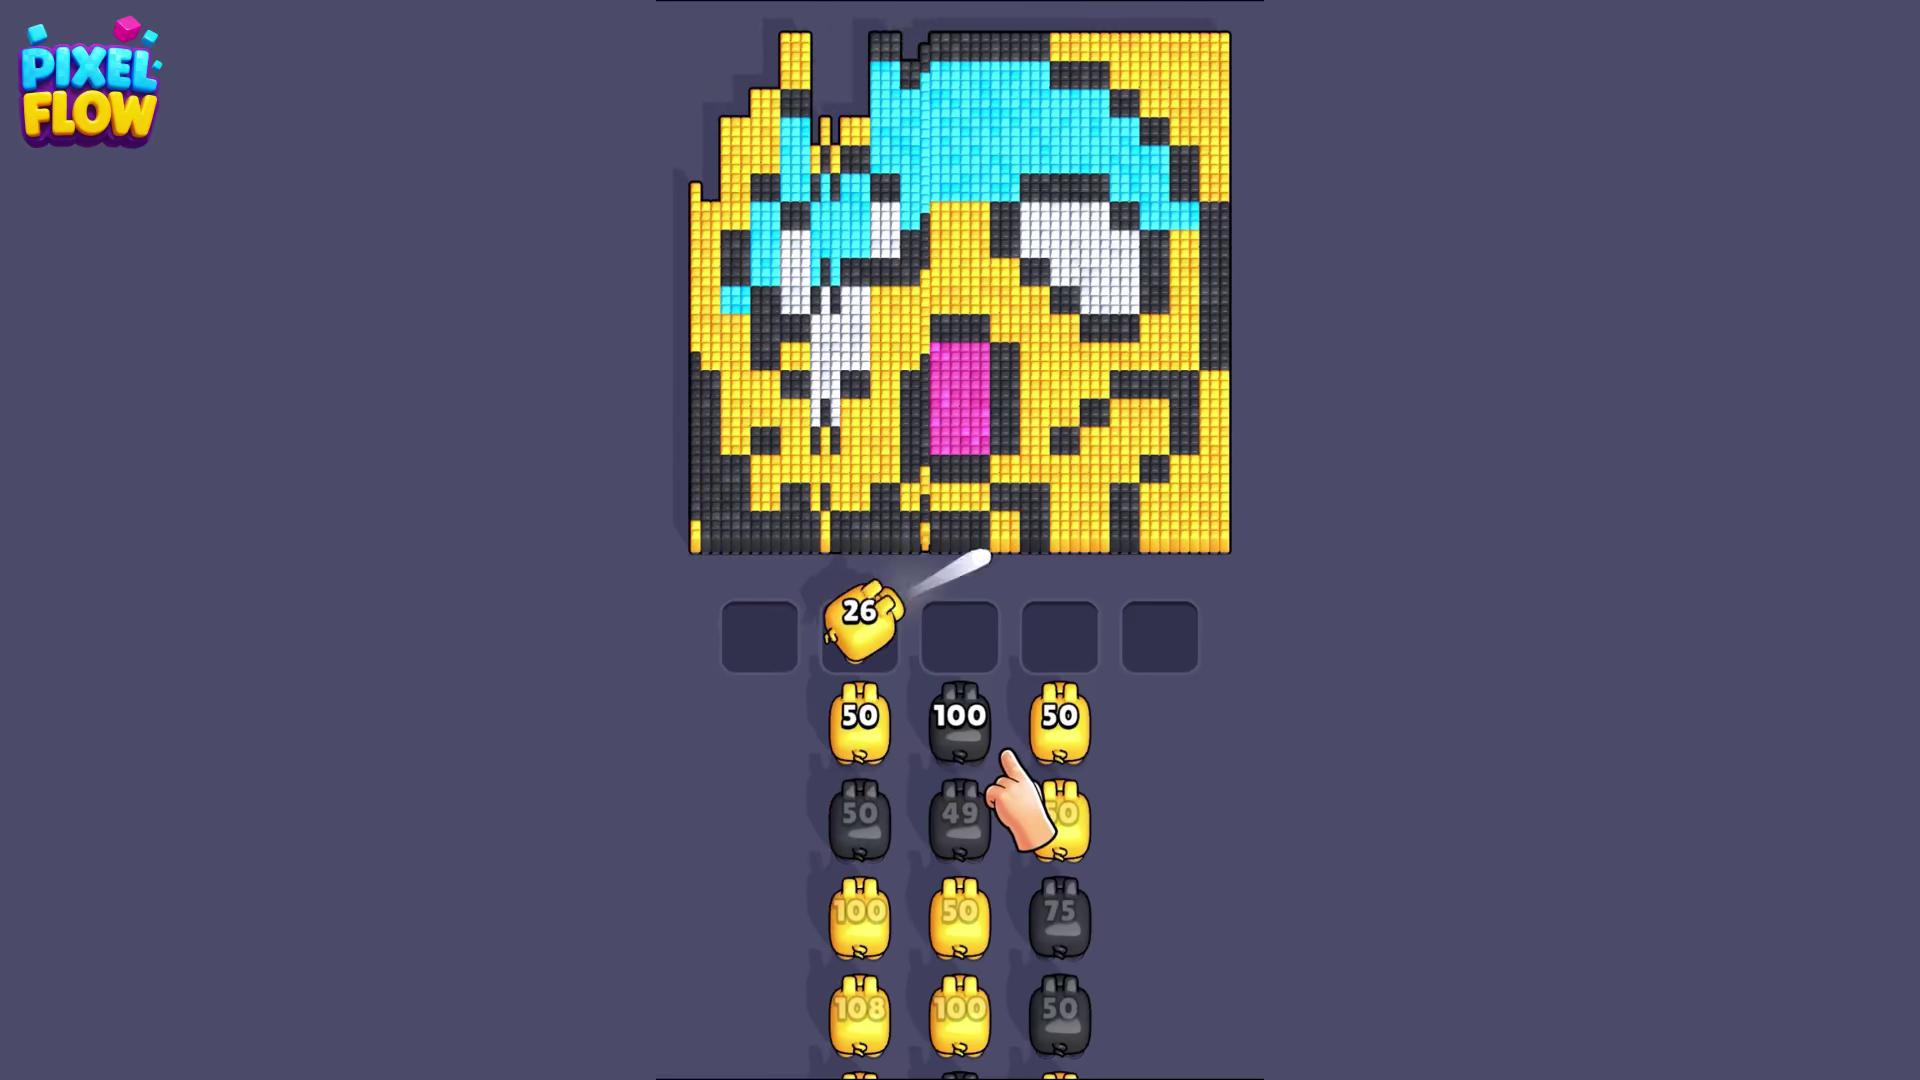 Creative #6 — 60 seconds, Android, first seen 2026-07-28 on the same date as creative #5 and still live 22 days later. 36,522,911 impressions across 110,366 placements at 330.9 per placement. Two creatives launched the same day; one was retired on 2026-08-04 and one was not.
Creative #1: 2.3 billion impressions on one playable
| Creative #1 | |
|---|---|
| Format | playable |
| Platform | Android (com.loomgames.pixelflow) |
| First seen | 2025-12-13 |
| Days since first seen | 249 |
| Window impressions | 2,298,804,130 |
| Placements | 2,113,657 |
| Impressions per placement | 1,087.6 |
| Days live in window | 30.6 (full window) |
| Impressions per window-day | 75,199,437 |
| Share of top-15 impressions | 78.1% |
| Share of top-15 placements | 63.2% |
At 2.3 billion impressions in thirty days this is the largest single creative measured across this entire teardown series — 24.0x larger than Mahjong Blast's leading asset and 38.0x larger than Solitaire Associations Journey's.
Its 78.1% impression share on 63.2% of placements means it is both the broadest asset and an above-average-density one: 1,087.6 impressions per placement against a fleet average of 879.9. It is large and efficient, which is a rarer combination than it sounds — in most fleets the densest assets are small and narrow.
It was live for the entire measurement window, so its 75,199,437 impressions per window-day is directly comparable to every other creative in the fleet, and it leads that ranking by 7.1x.
Two hundred and forty-nine days is also a long life for a single interactive unit. For context, the oldest creative in the entire 45-creative sample is another playable, first seen 2025-10-11, still live after 312 days, producing 0.3% of the fleet's daily output. Loom does not retire playables; it retires videos. Ten of the ten creatives killed on 2026-08-04 were videos, and all four pure playables in the sample were live on the pull date.
Playables carry three-quarters of the volume
Across the full 45-creative sample:
| Family | Creatives | Impressions | Share | Placements | Impr/placement | Live on pull date |
|---|---|---|---|---|---|---|
| Pure playable | 4 | 2,325,057,177 | 75.1% | 2,148,868 | 1,082.1 | 4 / 4 |
| Video | 41 | 770,251,218 | 24.9% | 1,459,037 | 574.8 | 28 / 41 |
| All | 45 | 3,095,308,395 | 100% | 3,607,905 | 858.1 | 32 / 45 |
Four creatives out of forty-five hold three-quarters of the impressions, deliver at nearly twice the video rate, and are the only creative type with a 100% survival rate.
Interactive attachment on the video side is 27 of 41, or 65.9%. Adding the four pure playables, 31 of 45 creatives (68.9%) carry a playable URL.
Against the fleets pulled the same day:
| Fleet | Sampled | With playable attached | Pure playable | Playable share of impressions |
|---|---|---|---|---|
| Solitaire Associations Journey | 45 | 40 (88.9%) | 12 | 59.9% |
| Pixel Flow! | 45 | 31 (68.9%) | 4 | 75.1% |
| 82-0.com | 150 | 0 (0.0%) | 0 | 0.0% |
Loom attaches playables to fewer creatives than Hitapps does but gets far more volume out of the ones it has: four pure playables carrying 75.1% of impressions against Hitapps' twelve carrying 59.9%.
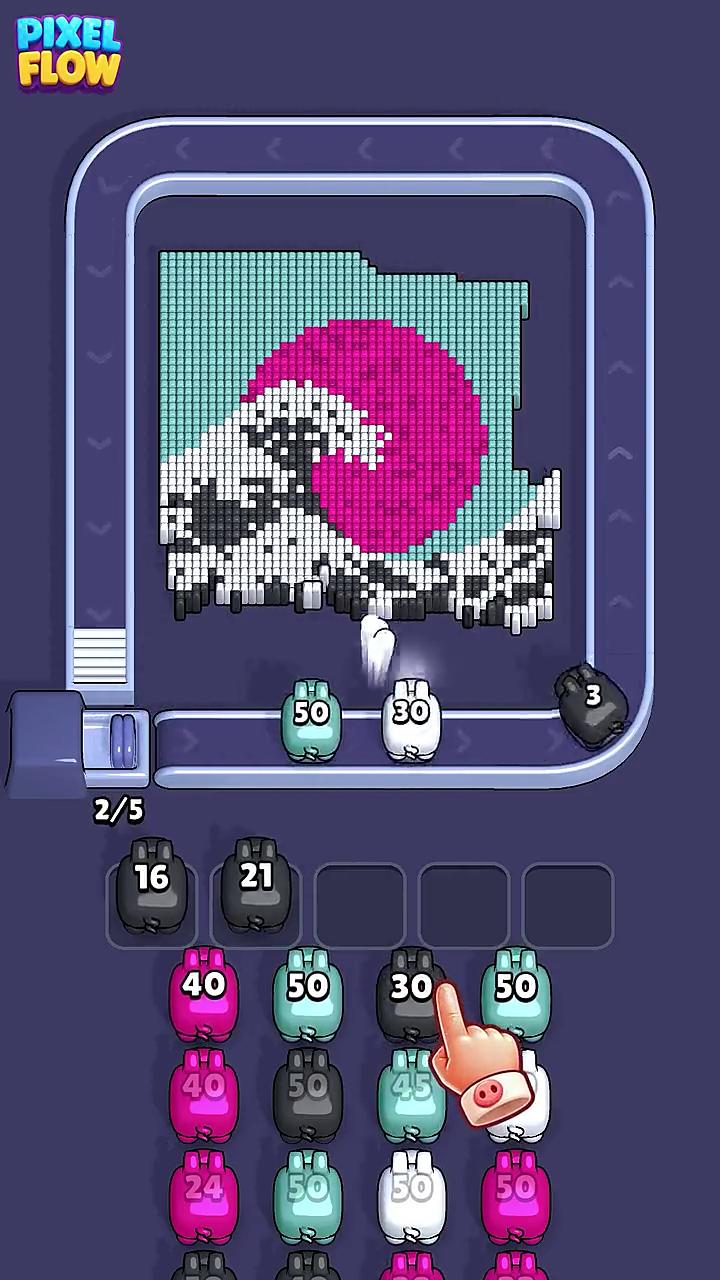 Creative #7 — 59 seconds, Android, first seen 2026-03-14 and still live after 158 days. 32,929,808 impressions across just 23,643 placements at 1,392.8 per placement, the second-densest asset in the top fifteen. It runs at 1,077,266 impressions per window-day, 1.0% of the fleet's output.
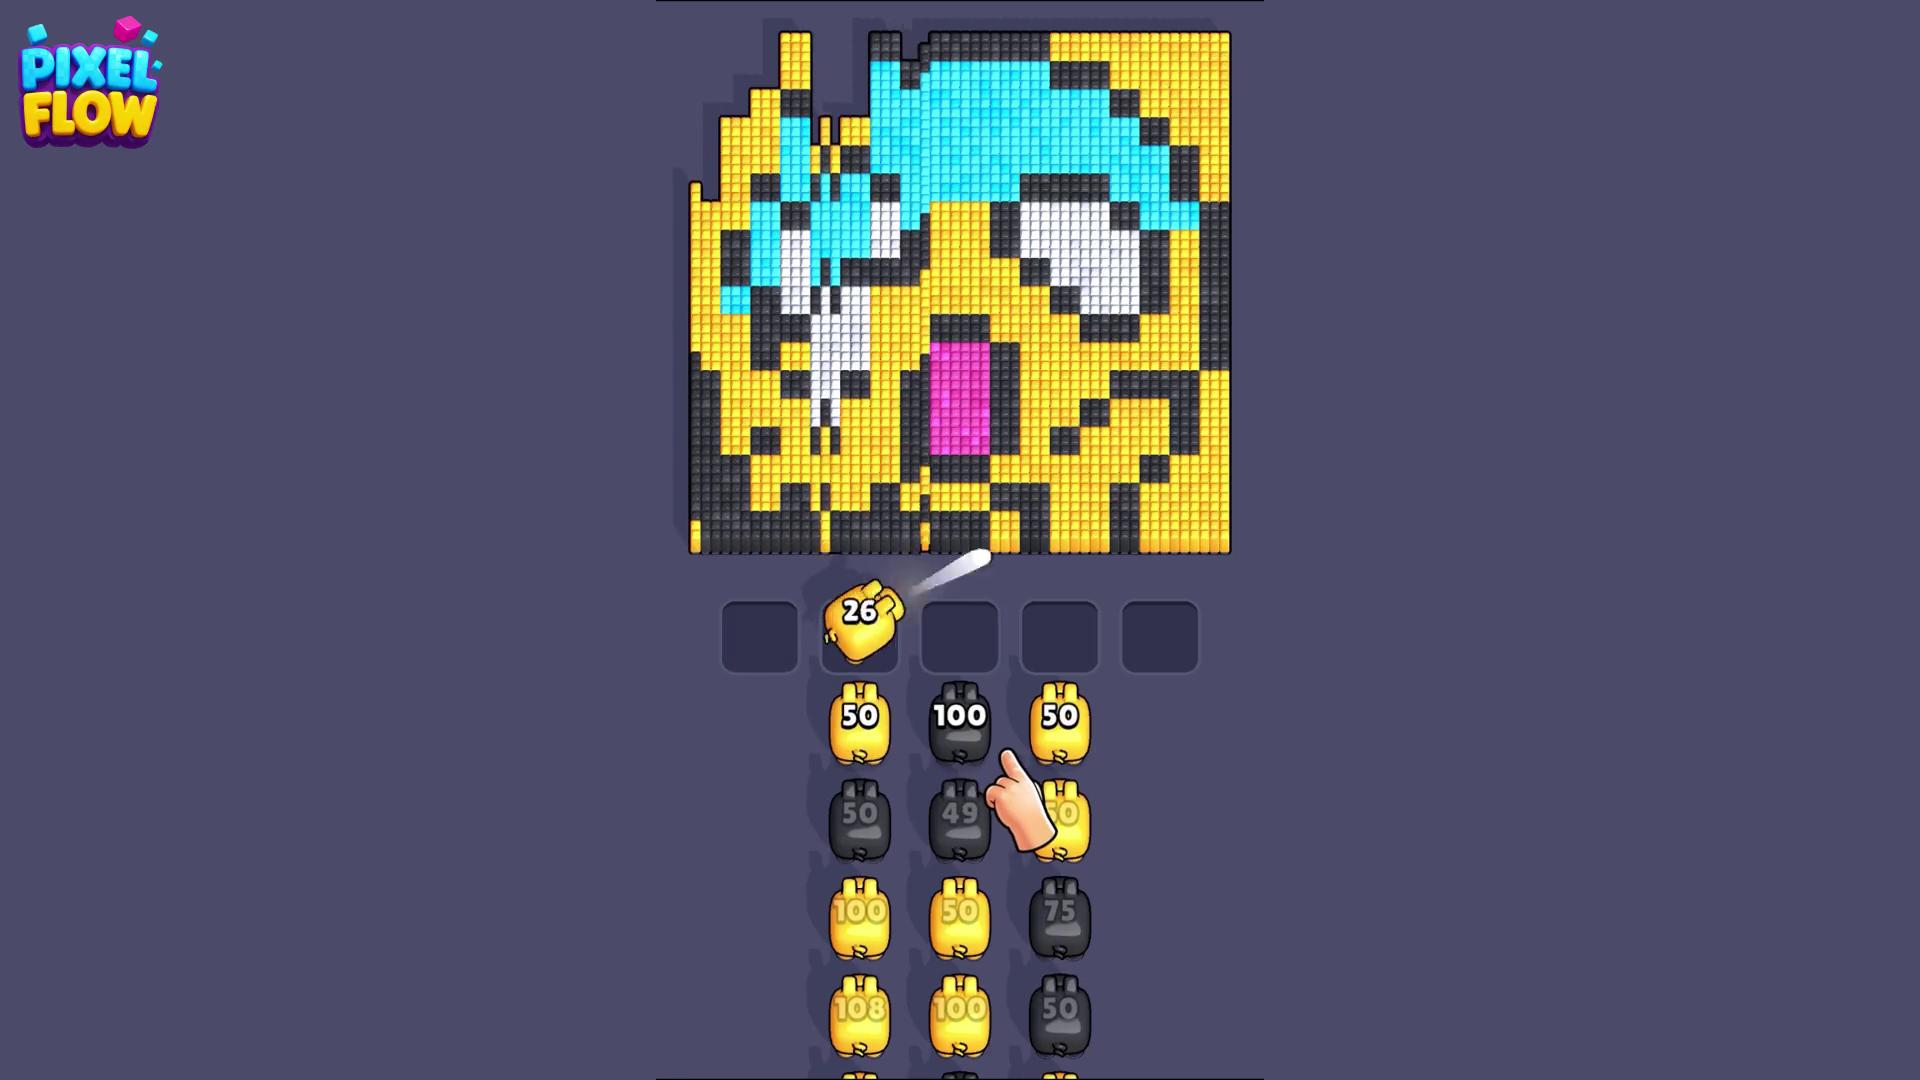 Creative #8 — 60 seconds, Android, first seen 2026-07-23 and last seen 2026-08-04, an observed span of twelve days. 22,333,289 window impressions across 22,791 placements at 979.9 per placement, 1,904,959 per window-day across its 11.7 days inside the window. One of two same-day launches that were both killed in the August batch.
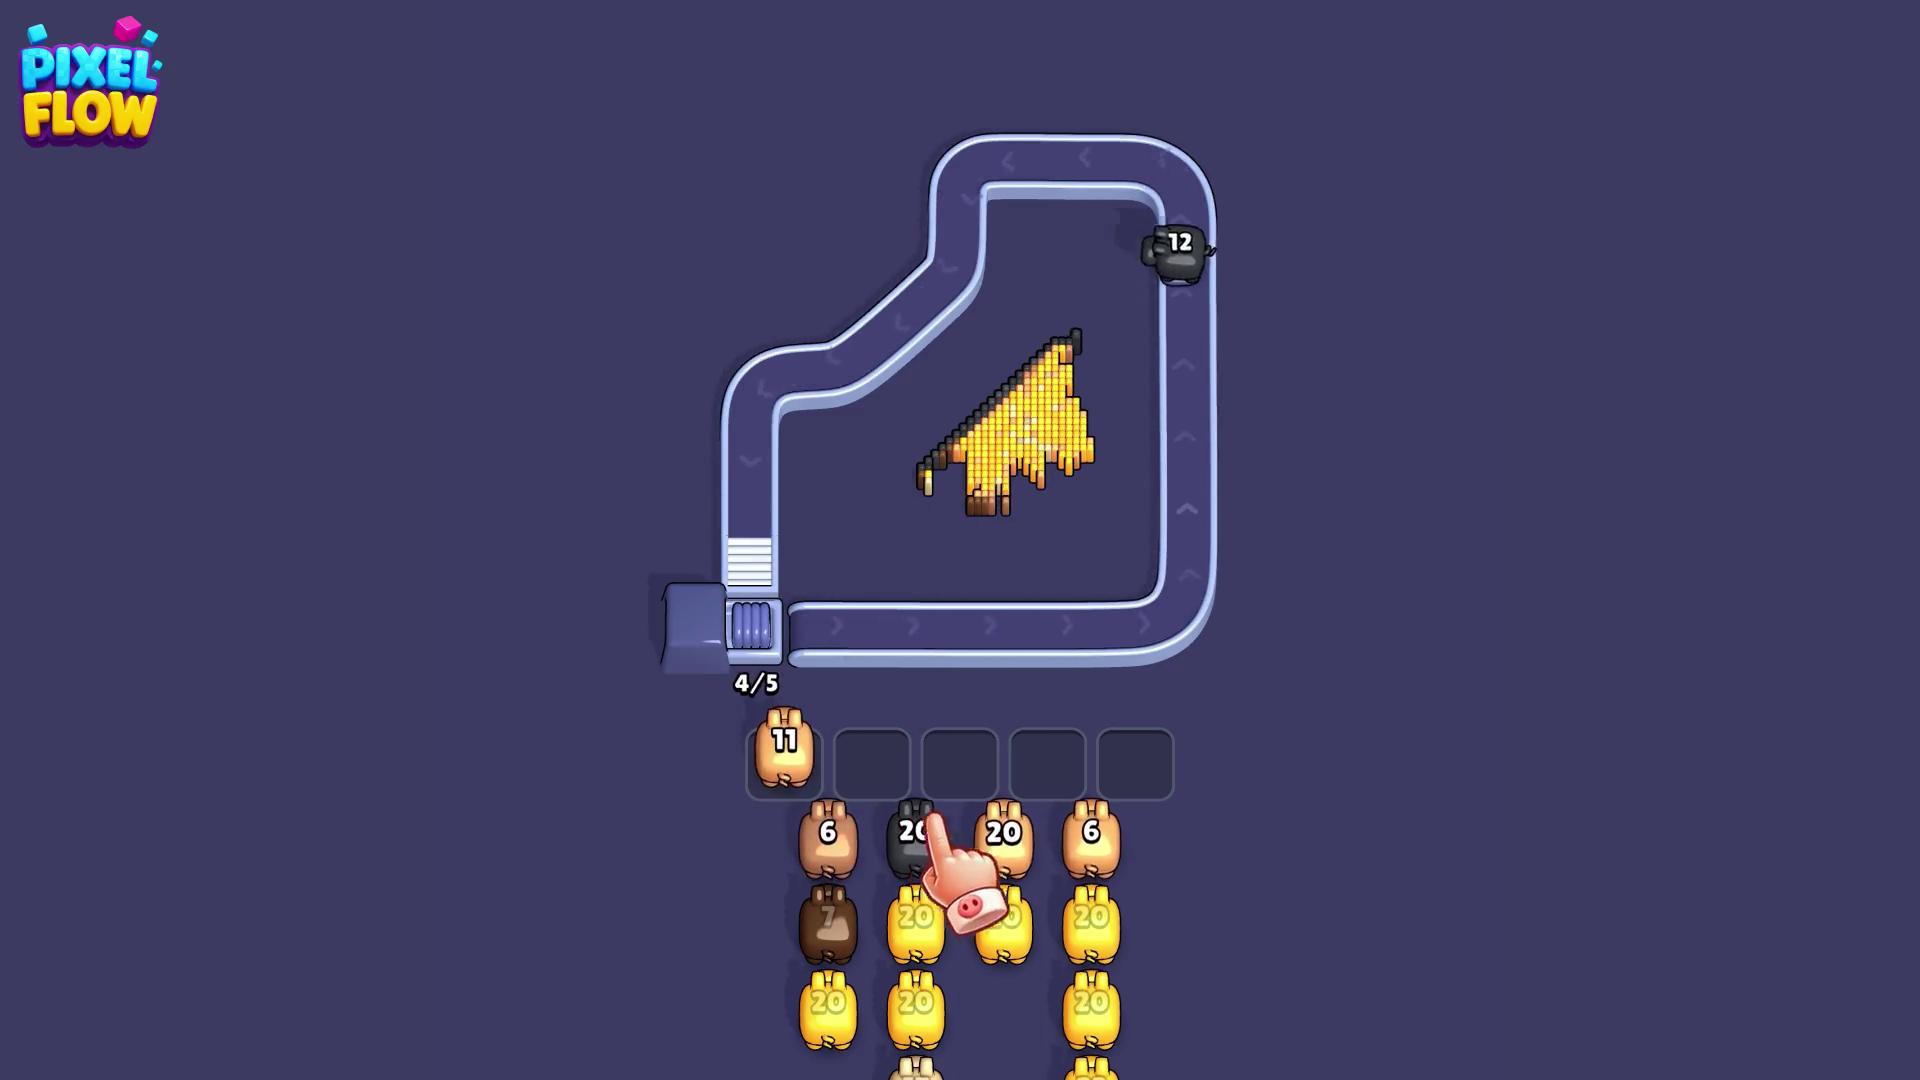 Creative #9 — the sibling of creative #8, also 60 seconds, also first seen 2026-07-23, also last seen 2026-08-04. 19,572,573 window impressions across 19,031 placements at 1,028.5 per placement. The two delivered within 5% of each other and were retired together twelve days after launch.
Android is the account, and it is not the company ID on the chart
| Platform | Creatives | Impressions | Share | Impr/placement | Live |
|---|---|---|---|---|---|
Android (com.loomgames.pixelflow, company 778463702) | 38 | 2,859,927,268 | 92.4% | 962.1 | 29 / 38 |
iOS (6751056652, company 1349571520) | 7 | 235,381,127 | 7.6% | 370.5 | 3 / 7 |
Thirty-eight of forty-five creatives, and 92.4% of impressions, run on the Android package under company ID 778463702 — which is not the unified company ID for this product. The unified record points at 1349571520, the iOS entity, because that is the entity the App Store listing belongs to.
The two platforms also behave differently. Android delivers at 962.1 impressions per placement against iOS's 370.5 — a 2.6x gap. And iOS is where the churn is concentrated: only three of seven iOS creatives were live on the pull date, against 29 of 38 on Android.
The one exception cuts the other way. Creative #2 — the second-fastest asset in the account at 10,591,503 impressions per window-day — is iOS. So is creative #5, the third-fastest, which was retired on 2026-08-04. Loom's iOS side is small, volatile and where the newest assets appear; its Android side is large, stable, and home to both the volume and the 7.1x-faster playable at the top of the fleet.
Runtime: two durations, one second apart, an 18% gap
Forty-one videos across four runtimes:
| Duration | Creatives | Impressions | Placements | Impr/placement |
|---|---|---|---|---|
| 47s | 6 | 41,142,928 | 41,965 | 980.4 |
| 53s | 3 | 91,879,933 | 51,632 | 1,779.5 |
| 59s | 16 | 468,174,177 | 1,046,504 | 447.4 |
| 60s | 16 | 169,054,180 | 319,010 | 529.9 |
Thirty-two of the forty-one videos are either 59 or 60 seconds. Loom has split its main video production almost exactly in half across two runtimes that differ by one second — and those two populations deliver at 447.4 and 529.9, an 18.4% gap.
A one-second difference in encoded runtime is not a creative difference. It is almost certainly two different production pipelines, or two different network specifications — a 59-second cut fits a "under 60 seconds" constraint, a 60-second cut fits an "exactly 60" slot. The 18.4% delivery gap between them therefore says something about where each one is allowed to run, not about the videos themselves.
The 53-second cuts are the outlier family. Three creatives, 1,779.5 impressions per placement — 4.0x the 59-second rate — on just 51,632 placements. They include creative #4, the densest asset in the fleet at 2,757.1. Low placement counts, extremely high density: a narrow, high-yield surface.
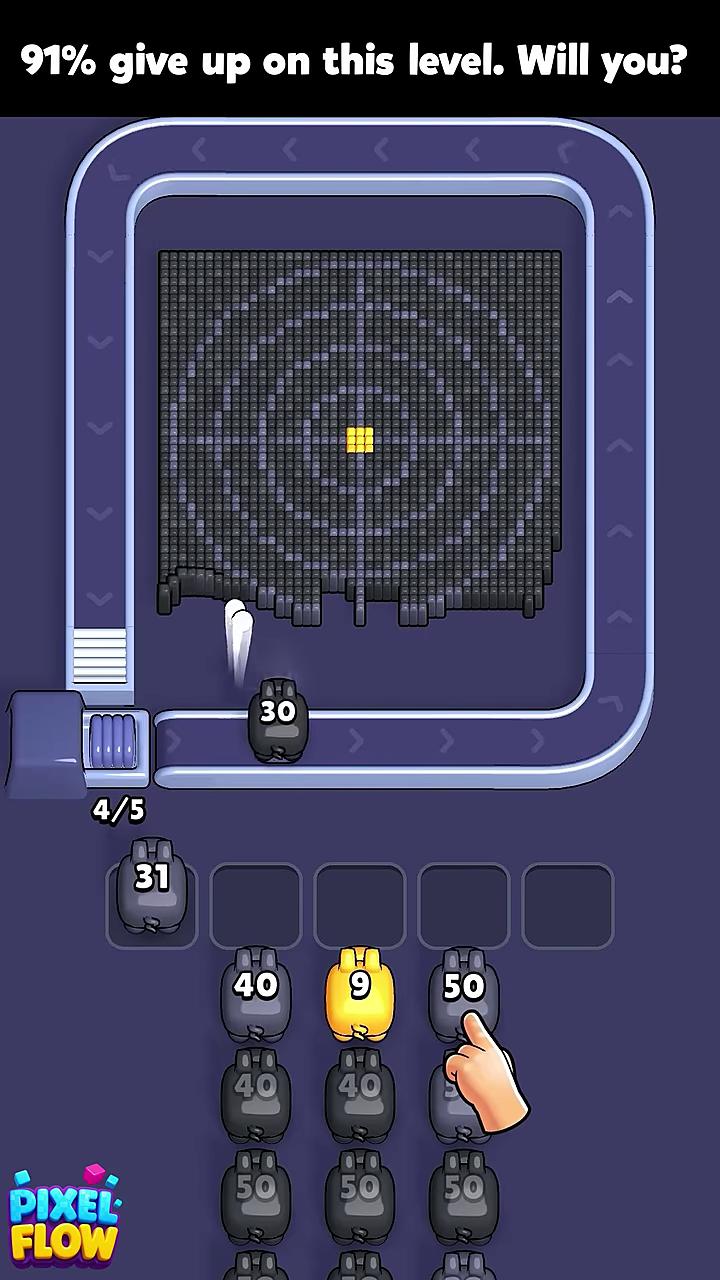 Creative #10 — 60 seconds, Android, first seen 2026-06-26 and still live after 54 days. 19,391,743 impressions across 29,013 placements at 668.4 per placement. It is the only creative in the entire top fifteen launched during June 2026.
 Creative #11 — 60 seconds, Android, first seen 2026-07-22 and still live after 28 days. 19,372,723 impressions across 29,257 placements at 662.2 per placement — within 1% of creative #10's rate despite launching 26 days later.
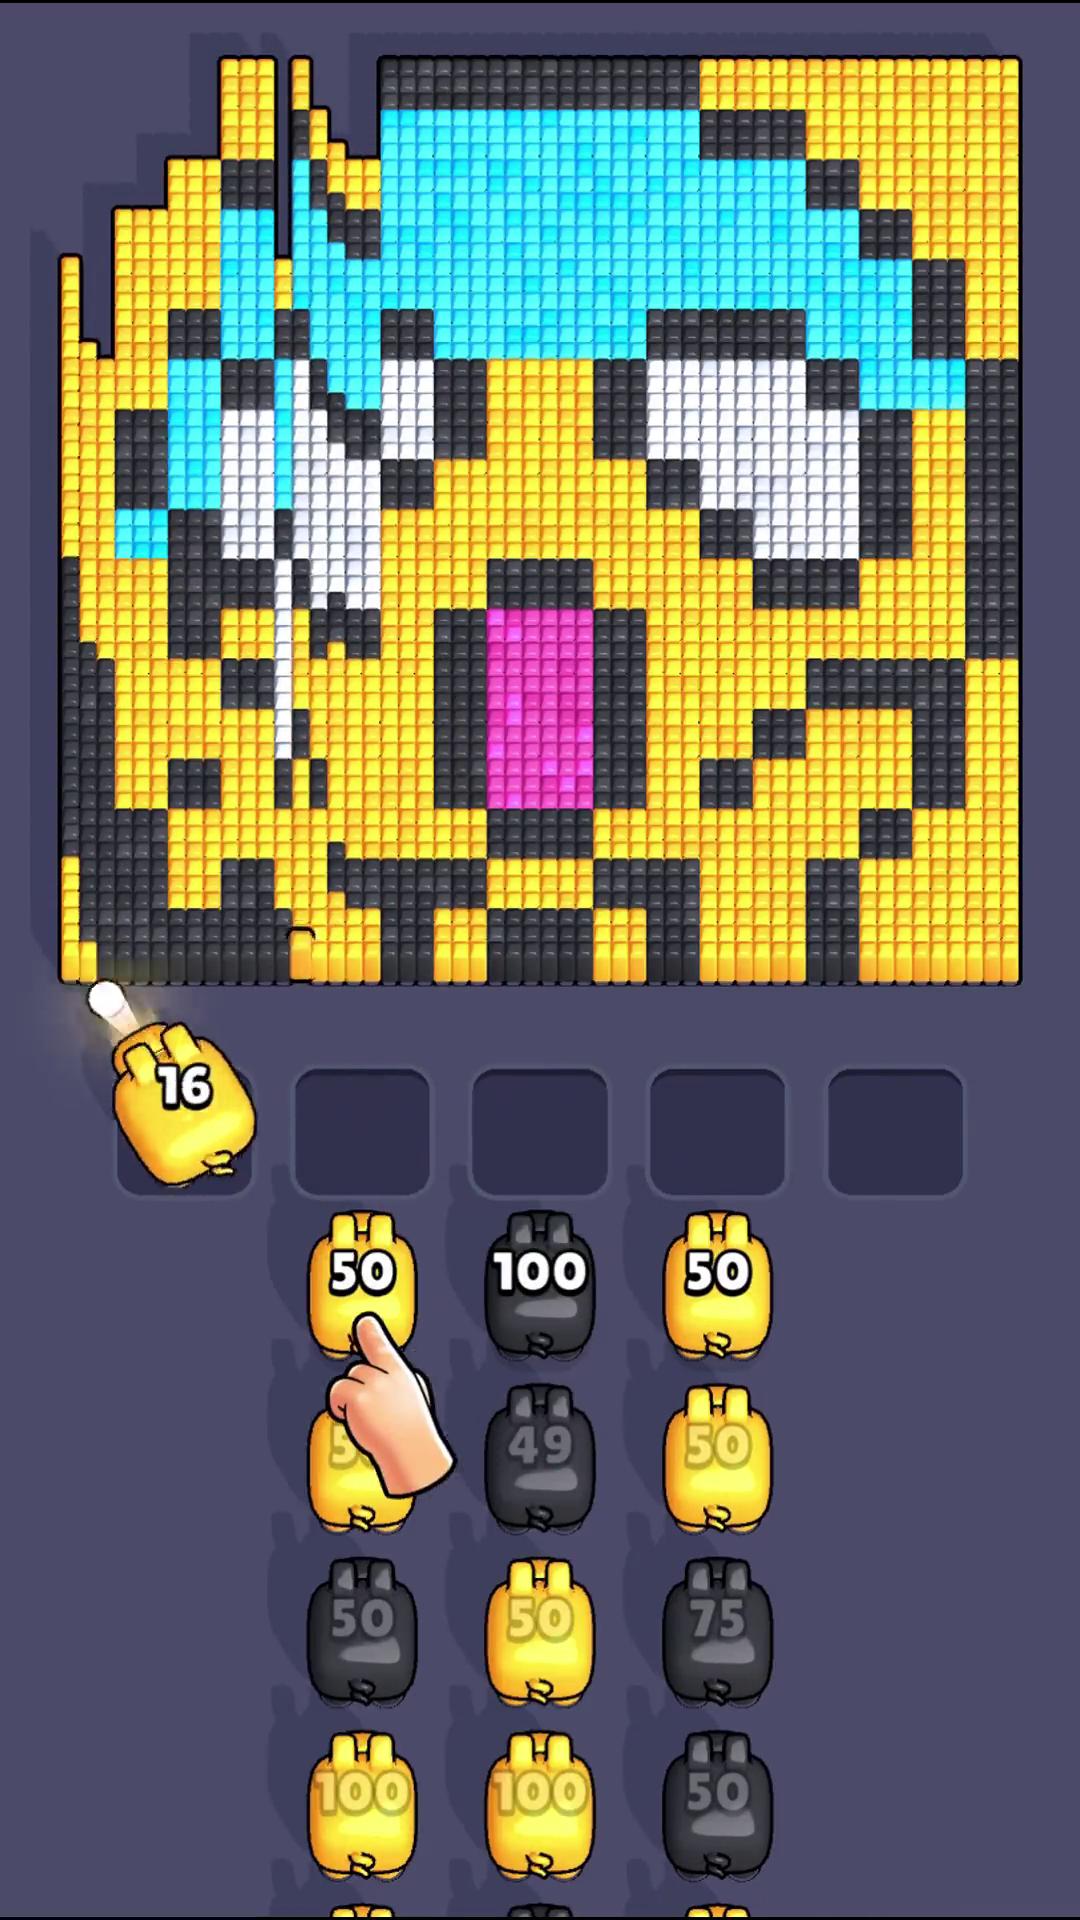 Creative #14 — 47 seconds, Android, first seen 2025-11-14 and last seen 2026-08-04 after 264 observed days. 13,008,349 impressions across 6,643 placements at 1,958.2 per placement, the third-densest asset in the top fifteen. It was the oldest creative removed in the August batch.
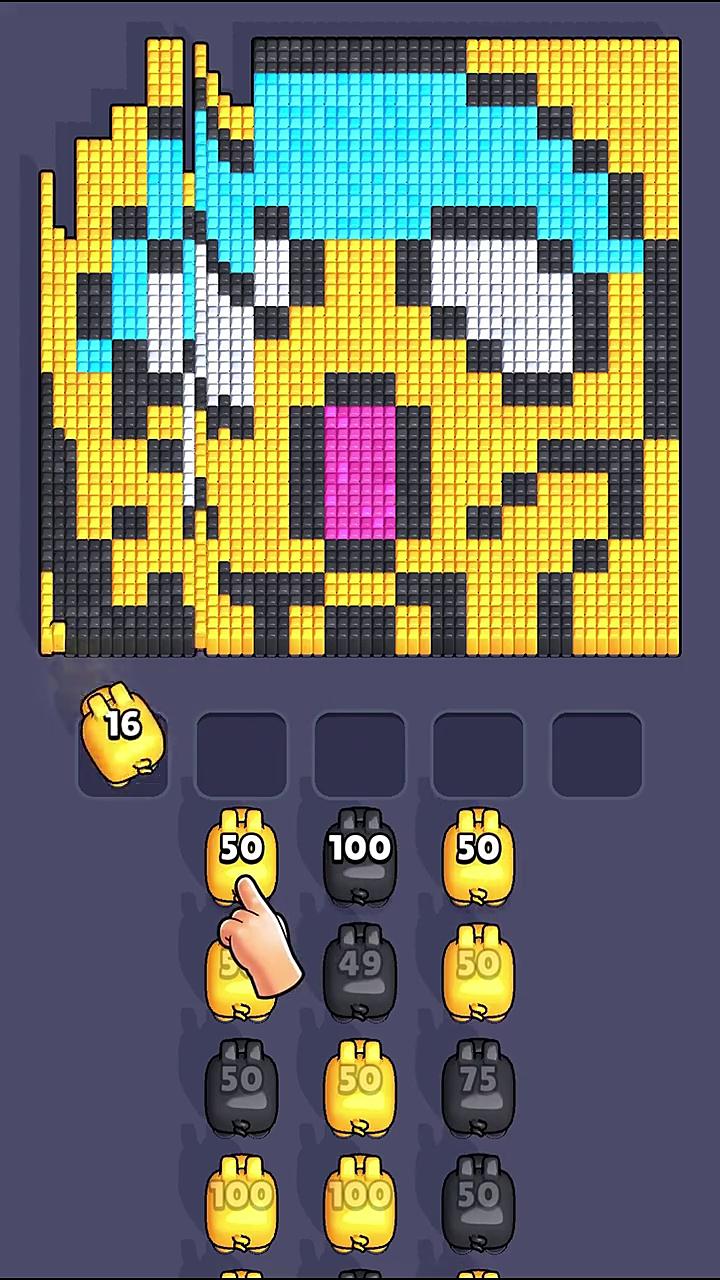 A 47-second video first seen 2025-11-09 and still live on the pull date after 283 days — one of the longest-running video assets in the account. 8,169,847 window impressions across 4,830 placements at 1,691.5 per placement, producing just 267,209 impressions per window-day — 0.2% of the fleet's output.
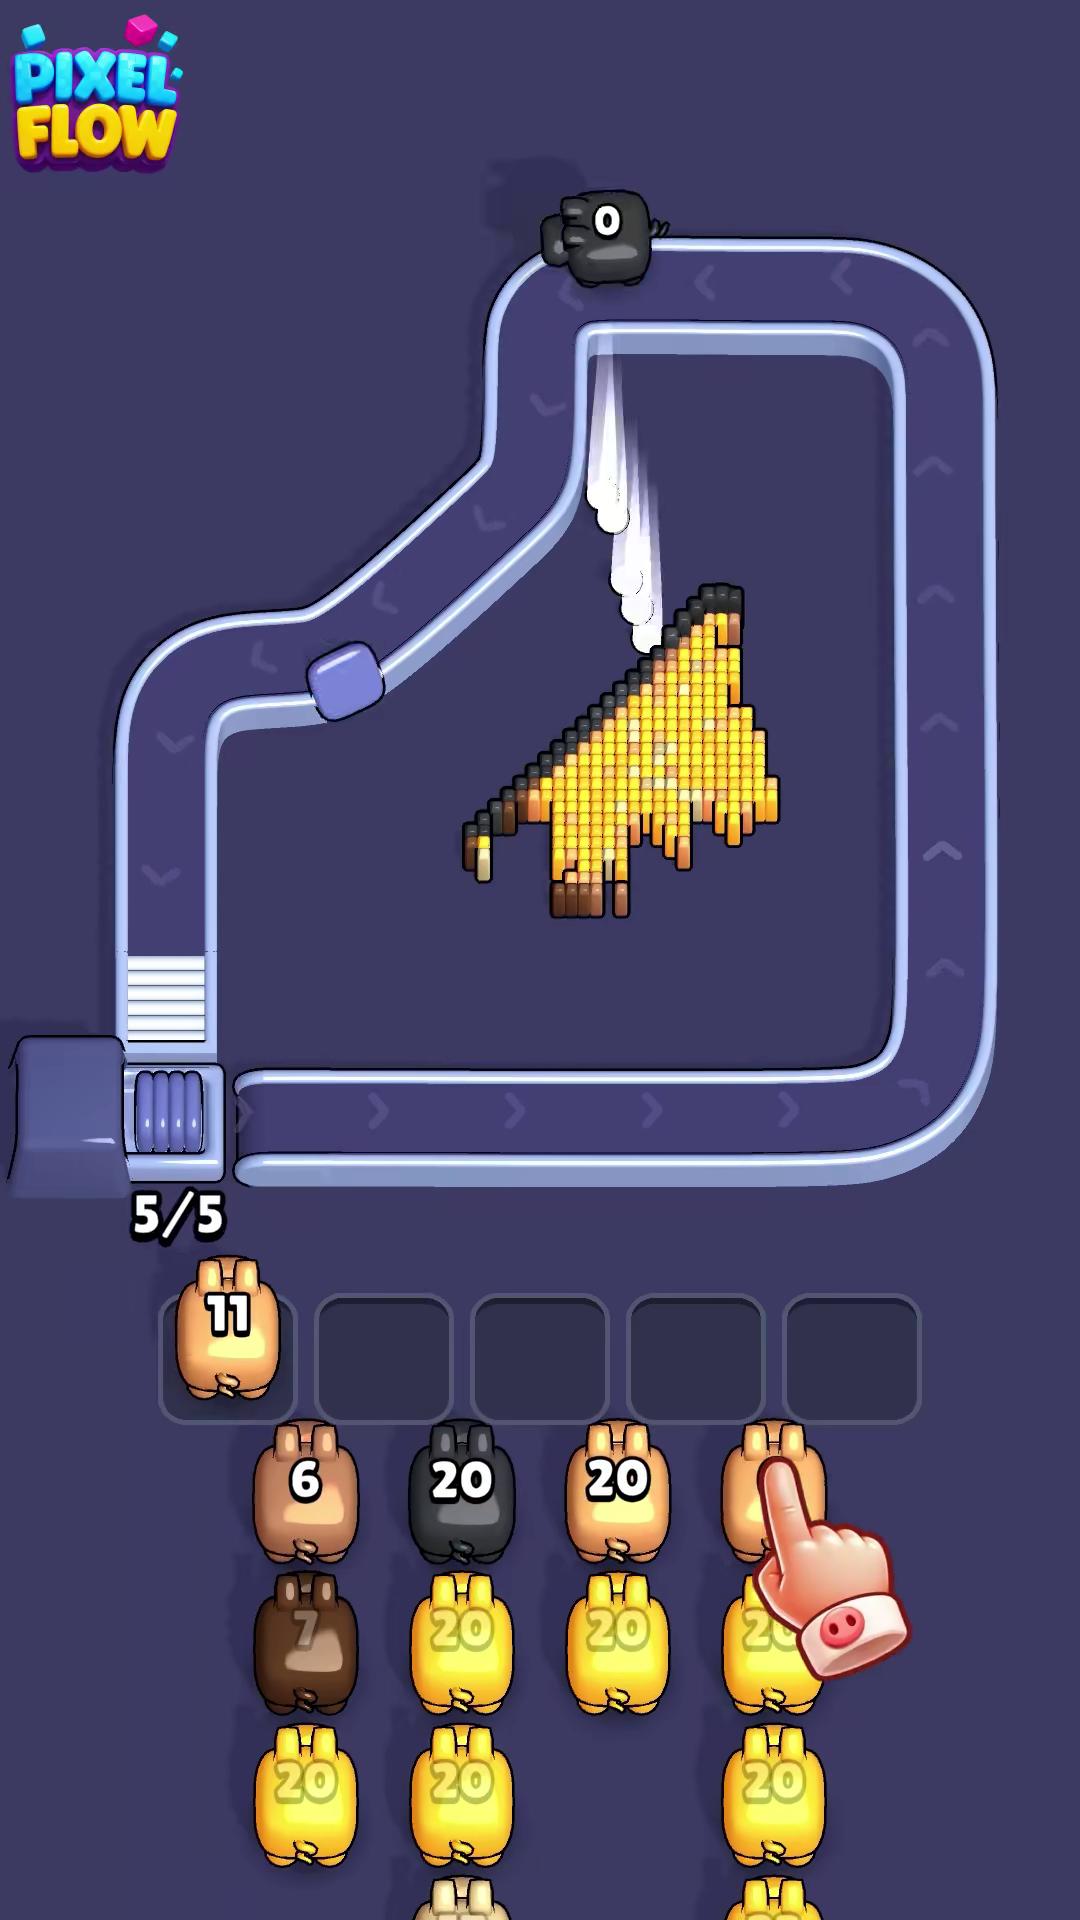 The third creative launched on 2026-08-04 — 60 seconds, iOS, live 15 days. 2,887,622 window impressions across 8,294 placements at 348.2 per placement, 197,987 per window-day. Together with creative #2 and one other, the August cohort holds 5.2% of the fleet's window volume and 9.3% of its per-window-day output.
Same-genre benchmark: five puzzle fleets
US fleets pulled the same day, top ten each:
| Fleet | Publisher | Impressions | Placements | Impr/placement | Top-1 share | Avg age | Live | Playable attach |
|---|---|---|---|---|---|---|---|---|
| Block Out! | Grand Games | 11,182,439,580 | 4,272,905 | 2,617.1 | 45.4% | 78d | 10/10 | 10/10 |
| Pixel Flow! | Loom Games | 2,862,164,099 | 3,221,013 | 888.6 | 80.3% | 93d | 7/10 | 5/10 |
| Magic Sort! | Grand Games | 1,073,785,227 | 717,608 | 1,496.3 | 29.9% | 171d | 9/10 | 9/10 |
| Arrows – Puzzle Escape | Lessmore | 263,623,029 | 2,211,546 | 119.2 | 55.6% | 155d | 10/10 | 9/10 |
| Block Blast! | Hungry Studio | 144,881,653 | 4,836,232 | 30.0 | 29.6% | 262d | 10/10 | 10/10 |
Pixel Flow! is second on volume and first on concentration by a wide margin. Its 80.3% top-1 share against Block Out!'s 45.4%, Arrows' 55.6%, Magic Sort!'s 29.9% and Block Blast!'s 29.6% means Loom is more exposed to a single creative than any competitor in the set.
It is also last on liveness — 7 of 10 against 9/10, 10/10, 10/10 and 10/10. Every other puzzle fleet in this comparison had essentially its entire top ten running on the pull date. Loom is the only one mid-rotation.
And it is lowest on playable attachment, at 5 of 10 against 9/10, 9/10, 10/10 and 10/10. That is the reverse of the impression picture, where Loom's four playables carry 75.1% of volume. Loom runs fewer playables and leans on them harder.
The combination — highest concentration, lowest liveness, lowest playable attachment, and a fleet swap in progress — describes a publisher rebuilding under pressure while three-quarters of its measured volume still rests on four interactive units.
Production intensity across the wider set
Lifetime, global, all-time figures from unified product records:
| Product | Publisher | Unique materials | Lifetime impressions | Impressions per material | Spend index |
|---|---|---|---|---|---|
| Magic Sort! | Grand Games | 4,866 | 172,778,367,616 | 35,507,268 | 333,090,853 |
| Water Sort Puzzle: Get Colour | Tripledot Studios | 7,303 | 23,976,852,442 | 3,283,014 | 676,527,063 |
| Water Sort Puzzle | IEC Global | 11,648 | 40,892,035,796 | 3,510,649 | 214,853,786 |
| Pixel Flow! | Loom Games | 16,562 | 213,359,297,665 | 12,882,460 | 228,925,990 |
| Block Blast! | Hungry Studio | 111,749 | 337,340,323,446 | 3,018,732 | 3,673,174,286 |
Pixel Flow! ranks second on impressions per material at 12,882,460, behind Magic Sort!'s 35,507,268 and well ahead of the three others, all of which sit near 3 million.
That is a strong production-efficiency position. Loom produces 16,562 materials against Block Blast!'s 111,749 — one-seventh the library — and extracts 4.3x more impressions from each one. Its spend index of 228,925,990 is 6.2% of Block Blast!'s 3,673,174,286.
Set against a -19.29% download line and a -23.07% revenue line, that efficiency is not currently translating. What the numbers describe is a well-run creative operation attached to a product whose chart position is declining — and a publisher that responded on 2026-08-04 by replacing a third of its measurable fleet in a day.
What transfers to your UA program
If you run creative production: the 59-versus-60-second split is the most quietly useful thing in this account. Sixteen creatives at each runtime, a one-second encoding difference, and an 18.4% gap in delivery rate. If your own fleet has assets straddling a duration boundary, split the report on it before you conclude anything about creative quality — you are probably measuring two different inventory pools, not two different videos.
If you run media buying: check what your impression column actually measures before you build a cohort story on it. This endpoint returns a rolling 30-day window, not lifetime totals, and dividing those impressions by a creative's age in days understates an eight-month-old asset's rate by a factor of eight. We made exactly that error in the first version of this teardown and it inverted the conclusion: corrected, the December playable is 7.1x faster than the August video, not slower. The denominator you want is the creative's overlap with the measurement window, and when creatives entered mid-window even that leaves you unable to separate acceleration from partial exposure.
If you run competitive intelligence: the unified company ID here points at the platform that carries 7.6% of the volume. 1349571520 is the iOS entity because the App Store listing belongs to it; 778463702 is the Android entity where 92.4% of the impressions actually are. Always enumerate the constituent product IDs and resolve each one's own company record.
If you compete in puzzle: Loom's four playables carrying 75.1% of impressions is the highest volume-per-playable ratio in the comparison set, and all four survived a swap that killed ten videos. Whatever the internal read is on those assets, Loom protects them and churns everything else. If you are deciding where to allocate an interactive-production budget, that is a revealed preference from a publisher with 16,562 lifetime materials to base it on.
If you are benchmarking against Pixel Flow!: the 2.3-billion figure is real and it is thirty days, not eight months — that single playable is genuinely producing at that scale right now. Benchmark against it with a matched window, and treat the four-playable core as the account's actual engine: 75.1% of volume, 100% survival through a purge that killed a quarter of the video layer.
A falsifiable prediction
Prediction: at a pull taken on or near 2026-11-01 with a matched 30-day window, creative #1 will still be the largest asset in the Pixel Flow! US fleet and still hold more than 55% of top-fifteen window impressions (currently 78.1%). All four pure playables in the current sample will still be live on that date. And the next batch of retirements Loom makes will again be all-video.
The basis: on creative #1, it leads the fleet by 7.1x on per-window-day output with every asset equally exposed to the same window, and it has held that position for 249 days; a fall below 55% requires either its own collapse or a new asset at roughly half its scale, and nothing shipped since December has come within a seventh of it. On playable survival, all four were live at ages 15 to 312 days across a period in which Loom retired thirteen videos. On the retirement composition, thirteen of thirteen stopped creatives in this sample are videos and zero are playables — a clean split with no counterexample.
The informative failure is the third clause. If Loom retires a playable, it breaks the one rule this account has followed without exception, and given that four playables carry 75.1% of measured volume, that would be the largest structural change this fleet could undergo.
The informative failure is the third clause. If a playable is retired before November, it means Loom has broken the one rule this account has followed consistently for ten months — and given that four playables carry 75.1% of measured impressions, that would be the largest structural change this fleet could undergo.
How to reproduce this teardown
- Enumerate every constituent product ID and resolve each one's own company record. Here the unified company ID belongs to the platform carrying 7.6% of impressions. Filtering on it drops 38 of 45 creatives.
- Establish what window your impression column covers before you compute a single derived metric. Reproduce the default response with explicit
start_date/end_dateand walk the start date until it matches exactly. Here that gives 2026-07-20 → 2026-08-19. Every rate, share and per-day figure downstream depends on getting this right, and getting it wrong inverted the headline of an earlier draft of this article. - Build a last-observed date histogram before you assume anything is live, and record the format of every stopped creative. Ten of forty-five creatives here share one stop date, and the fact that all ten were videos is the finding — the impression totals attached to them are not.
- Validate clustered stop dates against unrelated fleets pulled the same day. We checked seven and found 2026-08-04 in none of them.
- Split video runtimes to the second, not into buckets. Grouping 59s and 60s together as "about a minute" would have merged two populations delivering at 447.4 and 529.9 and destroyed the finding.
- Track playable survival separately from video survival. Four of four playables live; twenty-eight of forty-one videos. A single fleet-level liveness figure of 71% hides a 100%/68% split that reflects a deliberate policy.
Methodology and data notes
- Measurement window (read this first): creative-level
impressionandshowCntfrom this API are window metrics, not lifetime totals. With no explicit date parameters the endpoint returns a rolling 30-day window; for this pull that window is 2026-07-20 to 2026-08-19 (30.6 days), verified by reproducing the default response exactly withstart_date=2026-07-20&end_date=2026-08-19and by confirming that no adjacent start date reproduces it. Every creative-level impression and placement figure in this article is a within-window total. Requesting a different window returns different values, and those values are not consistent across windows — we observed cases where a 7-day window reports a higher figure than a 30-day window covering it — so these numbers should be compared only against other figures from the same window. By contrast,globalFirstTime/globalLastTimeare true lifetime dates, and the unified-productimpression,showCostandmaterialUvCntfields are window-invariant lifetime totals, verified against four different window settings. - Source: AdMapix creative search, unified product search and download/revenue ranking APIs, all queried 2026-08-19, country filter
US, creatives sorted by impressions descending. - Primary sample: the top 15 US creatives by impressions for unified product Pixel Flow!, ID
6751056652, publisher Loom Games Oyun Yazilim ve Pazarlama Anonim Sirketi, AdMapix company ID1349571520. - Extended sample: cohort analysis, format splits, platform splits, runtime distribution, playable attachment and stop-date analysis use the top 45 US creative records by impressions (three pages of fifteen). The API reports 7,000 total US creative records for this keyword.
- Identity resolution: 38 of 45 creatives resolve to Android package
com.loomgames.pixelflow(AdMapix company778463702, publisher string "Loom Games A.Ş.") and 7 to iOS product6751056652(AdMapix company1349571520, publisher string spelled out in full). Both product IDs are listed in the unified product record. Three same-name products exist in the US result set — Doodle Pixel Flow (ACTIONFIT,6758148662), Pixel Flow Shooter (Funlab Games) and Bus Jam: Pixel Flow (Zero Immersive) — and none of their data appears in this article. - "Days since first seen" is the span between first-observed and the pull date and is a lifetime quantity — it is not the denominator for the window impressions in the same table. "Observed span", cited where relevant, is first-observed to last-observed. "Live" means a last-observed timestamp of 2026-08-19; 11 of 15 top creatives and 32 of 45 in the extended sample qualify.
- The 2026-08-04 cluster was validated by checking last-observed date distributions across seven unrelated US fleets pulled the same day (Solitaire Grand Harvest, Solitaire Cash, Solitaire Clash, Water Sort, Block Blast!, NBA 2K Mobile, eFootball). The date appears in none of them, so it is treated as a real account-level event rather than a crawl boundary.
- "Impr/window-day" is window impressions divided by "days live in window" — the overlap between a creative's observed life and the 2026-07-20 → 2026-08-19 measurement window. It is not impressions divided by days since first seen; that calculation mixes a 30-day numerator with a lifetime denominator and understates an eight-month-old asset by roughly 8x. For creatives that entered or exited mid-window the rate is computed over a shorter denominator, which limits how much can be read into cohort-level rate comparisons.
- "Placements" (
showCnt) counts recorded creative appearances, not unique users and not unique publishers. Impressions per placement is a distribution-shape indicator, not a frequency metric, and is not comparable across formats without stating the format. - "Format" is derived from recorded video duration: creatives with no duration are classified as pure playable units. "Playable attached" counts creatives carrying a playable URL, including videos with an interactive end card. Several playable URLs are shared across multiple creative records.
- Comparison fleets — Block Out! (Grand Games,
6752672568), Magic Sort! (Grand Games,6499209744), Arrows – Puzzle Escape (Lessmore,6748397500) and Block Blast! (Hungry Studio,1617391485) — were pulled the same day on a top-ten basis. Each resolves to a single unified product. - Cross-format impression comparison carries measurement risk: a playable unit and a 59-second video are not the same object and may not be counted equivalently. The 75.1% playable share should be read as a statement about recorded impressions, not as an efficiency ratio between formats.
- "Unique materials" (
materialUvCnt) and lifetime impressions come from unified product records and are global, all-time figures — not US-only, not period-limited. - The spend index (
showCost) is a modelled figure with an undisclosed unit, used ordinally for relative comparison only. Revenue figures are likewise index values; only the rank and the growth rate should be relied upon. - Impressions are third-party modelled estimates, not publisher-reported figures and not spend.
- Download and revenue figures are US-region estimates for the current ranking period. Pixel Flow! appeared at download position 143 and revenue position 114.
- Store listings: App Store and Google Play.
- Coverage is limited to creatives observable through third-party ad monitoring.
Frequently Asked Questions
How many ads is Pixel Flow! running in the US? AdMapix records 7,000 US creatives for Pixel Flow!. The top fifteen by impressions carry 2,942,901,041 impressions across 3,344,703 placements in the 30 days to 2026-08-19, with eleven of the fifteen still live. Across a wider 45-creative sample, 32 were live — the lowest liveness rate in the puzzle comparison set, because ten creatives were retired on a single date, 2026-08-04.
What is Pixel Flow!'s best-performing ad creative? A playable unit first seen 2025-12-13 on the Android build, carrying 2,298,804,130 impressions across 2,113,657 placements in the 30 days to 2026-08-19 — 78.1% of the top-fifteen fleet. It is the largest single creative measured anywhere in this teardown series, and at 75,199,437 impressions per window-day it is also the fastest in its own fleet by a factor of 7.1.
What happened to Pixel Flow!'s ads on 2026-08-04? Loom Games retired ten of the forty-five sampled creatives and launched three new ones on the same date. The ten retirements carried 147,124,346 window impressions between them; the three additions took 161,445,075 across their 14.6 days inside the window. All ten retirements were videos — as were all thirteen retirements in the sample — and none of the fleet's four pure playables was touched.
Does Pixel Flow! use playable ads? Yes, and they carry the account. Four pure playable units hold 2,325,057,177 window impressions — 75.1% of the 45-creative sample — at 1,082.1 impressions per placement against videos' 527.9. All four were live on the pull date, including one first seen 2025-10-11 and running 312 days. A further 27 of 41 videos carry an attached playable, giving 68.9% overall interactive penetration.
Why does most of Pixel Flow!'s advertising run on Android?
Thirty-eight of forty-five creatives resolve to the Android package com.loomgames.pixelflow under AdMapix company 778463702, carrying 92.4% of measured impressions at 962.1 per placement. The seven iOS creatives under company 1349571520 carry 7.6% at 370.5. The unified product record points at the iOS company ID because the App Store listing belongs to it, so filtering by unified company alone would drop the platform where nearly all the volume actually sits.
How does Pixel Flow! compare to Block Out! and Block Blast!? On impressions it sits second of five puzzle fleets measured the same day: 2,862,164,099 top-ten impressions against Block Out!'s 11,182,439,580 and ahead of Magic Sort!'s 1,073,785,227, Arrows' 263,623,029 and Block Blast!'s 144,881,653. It is by far the most concentrated, with 80.3% of volume in one asset against 29.6% to 55.6% for the others, and the only fleet in the group that was mid-rotation on the pull date at 7 of 10 live.
Is Pixel Flow!'s advertising working? Its downloads are down 19.29% and its revenue index down 23.07% period-over-period, and the wider puzzle category is contracting alongside it — Magic Sort! at -17.85%, Block Blast! at -22.63%, Arrows at -34.65%. The August 2026 creative cohort is fifteen days old at the pull date and cannot yet have registered in either chart figure. Impression data cannot measure install quality or return on spend, so the honest reading is that a rebuild is underway and its outcome is not yet observable.
Want to see the moment a competitor swaps out its fleet? Per-creative impressions, placement counts, exact runtimes, first-seen and last-seen dates and playable attachment are all live in AdMapix, filterable by country, publisher and product ID — with unified product resolution across iOS and Android, so the platform carrying 92% of an advertiser's volume never hides behind the wrong company ID. Create a free account to run this teardown on any title in your category, or see plans for full historical access.
Data source: AdMapix third-party ad intelligence estimates, United States, retrieved 2026-08-19. Impression, download, revenue and spend-index figures are modelled estimates for comparative analysis and are not publisher-reported. Figures change as new creatives enter rotation.
Related Reading
- Ad strategy teardowns (series index) — every teardown in the series, in publication order
- Mobile game ads guide: formats, examples and research — the format matrix, research workflow and KPI guardrails every teardown in this series applies
- DramaBox — one serial hook taking 75.5% of the top 10
- Royal Match — the marathon play — a 305-day creative and zero resets
- Gossip Harbor — one 25-second video file carrying 70.5% of the account
Turn these observations into your next creative study
Open the creative library and select samples for your market, network and research question.
Related Articles
Vita Mahjong Ad Strategy in 2026: The Metronome — a 467-Day Creative and 14 Assets Delivering at Exactly the Same Rate
A creative-level teardown of Vita Studio's US user acquisition for Vita Mahjong. Fifteen creatives account for 10.5 billion impressions, all fifteen still running, and one first seen 2025-05-09 has been live 467 days — the oldest asset in this fleet, fifth-oldest across the series. Fourteen of the fifteen deliver between 967 and 1,117 impressions per placement, a consistency band no other advertiser we have measured comes close to.
Roblox Ad Strategy in 2026: Creatives Launched in Three Days Carry 61% of Current US Delivery
A creative-level teardown of Roblox Corporation's US user acquisition, measured across the 30-day window ending 2026-08-19. Creatives first observed between 2026-07-02 and 2026-07-04 carry 930,645,210 of the window's 1,514,986,345 impressions — 61.4% — six weeks after launch. Roblox's iOS and Android creatives deliver at rates that differ by a factor of 105.
Grand Games UA Playbook 2026: 13.7 Billion Impressions Built From Four Videos — Inside a Permutation Machine
A publisher-level teardown of Grand Games A.Ş. across Block Out! and Magic Sort! in the US. Sixty measured ad instances carry 13.7 billion impressions, but Block Out!'s entire 12.2-billion fleet resolves to just four distinct videos and eighteen playable end cards — one 59-second video appears in thirteen instances with thirteen different playables. The breakout that took it from 613 million to 8.1 billion was not a new video: it was a new playable attached to a video already 63 days old.