
Gossip Harbor Ad Strategy in 2026: One 25-Second Video File Carries 70.5% of Everything
A creative-level teardown of Microfun's US user acquisition for Gossip Harbor. Fifteen ad entries account for 6,381,902,914 impressions, all still live — but they resolve to only fourteen distinct video files, and one 25-second file appearing under two entries carries 70.5% of all delivery. The whole interactive layer is a single playable shared across five entries. Rewritten from scratch after the underlying data changed roughly 2x in one day; the correction is documented in full.
Microfun's Gossip Harbor®: Merge & Story is running the most concentrated creative strategy we have measured. Fifteen ad entries account for 6,381,902,914 impressions in the US over the 30 days to 2026-08-19, and all fifteen were still live on that date.
But counting entries overstates what is actually there. The fifteen entries resolve to only fourteen distinct video files, and one of those files — a 25-second video first observed 2025-07-16 — appears under two separate entries. Together those two entries carry 4,500,745,519 impressions: 70.5% of everything Microfun is measured to be running in the US in that window.
One video file. Seventy percent of the account. Still running after 398 days.
One caveat governs every impression figure below, and it is unusual enough to state up front: this API's impression field is a rolling 30-day window, not a lifetime total. The section after next explains how we established that and why it invalidates a metric most teardowns publish.
Why this teardown was rewritten
An earlier version of this article reported a total of 12,221,035,981 impressions for this fleet. That figure is no longer reproducible and should not be cited.
On 2026-08-19 we pulled the same keyword, same country, same page size twice. An early-afternoon pull returned fifteen entries totalling 12,221,035,981. Later the same day, three consecutive pulls returned fifteen entries totalling 6,381,902,914 — identical to the byte across all three, so this is not random variation.
The cause turned out to be neither a data revision nor a bug. It is a property of the metric.
Comparing the two snapshots:
| Early pull | Later pull (used here) | |
|---|---|---|
| Entries | 15 | 15 |
| Total impressions | 12,221,035,981 | 6,381,902,914 |
| Entries present in both | — | 12 |
| Entries that disappeared | — | 3 |
| New entries that appeared | — | 3 |
The three that dropped out were large: 3,524,128,950 (59s, first seen 2025-11-20), 2,384,477,203 (58s, first seen 2026-04-09), and 30,998,075.
They were not removed, reattributed, or switched off. Tracking them by record ID confirms all three are still attributed to Microfun Limited under app ID 1623318294, and all three were still recording placements on 2026-08-19. Queried against a 7-day window they rank first and second in the entire account.
What actually happened is that impression is a windowed metric, not a lifetime total. When no date parameters are supplied, this API returns a rolling 30-day window — verified precisely: the default response matches start_date=2026-07-20, end_date=2026-08-19 entry for entry, and no neighbouring start date reproduces it.
So both snapshots were 30-day readings taken hours apart, and the three large entries simply fell out of the top fifteen of that window's ranking. Nothing about the advertiser changed.
This article uses the later, reproducible 30-day reading throughout, and labels it as such.
Everything below was recomputed from the later pull. Nothing was carried over.
Executive summary (TL;DR)
- Fifteen entries, fourteen files. Entries #1 and #12 are the same 25-second video file (
videoFpeff9e07a…), launched seven days apart. Counting ad entries overstates Microfun's creative output. - One file carries 70.5%. Those two entries together deliver 4,500,745,519 of 6,381,902,914 impressions. The single largest entry alone is 70.1%.
- Nothing is ever switched off. 15 of 15 entries were live on the pull date. Average age 214 days; seven have run past 180 days. Three further entries that fall outside this window's top fifteen are also still live.
impressionis a 30-day window, not a lifetime total. Verified against an explicit2026-07-20 → 2026-08-19query. This invalidates the impressions-per-day metric most teardowns compute — it understates this fleet's 398-day leader by 13.3x.- The winner is the short one. The 4.47-billion-impression champion is 25 seconds, in a fleet whose house format is 52–59 seconds. The entire 52–59s band — eleven entries — delivers 27.6% between them.
- The interactive layer is a single file. Five entries carry a playable, and all five reference the same
playHtmlFp. There are zero pure-playable units; every entry is a video. - The lead asset is spread wide and thin. It runs at 1,612 impressions per placement, the lowest in the fleet, against a fleet range topping out at 3,569.
- Genre dominance is real but smaller than previously stated. Against three merge rivals pulled the same day, Gossip Harbor delivers 7.7x their combined total — not the 15.9x an earlier version claimed.
All figures are AdMapix third-party estimates for the United States, pulled 2026-08-19. Impression and placement figures are rolling 30-day window values ending on that date, not lifetime totals; first-seen dates, last-seen dates, durations and fingerprints are window-independent. Methodology and the full window statement are at the end.
Where Gossip Harbor sits on the US charts
On the US download rankings, Gossip Harbor appears at position 108 with 758,507 downloads at -19.06% period-over-period, published by Microfun Limited.
The creatives resolve to two identifiers for the same product: iOS app ID 1623318294 (developer ID 1417856988) and Android bundle com.mergegames.gossipharbor (developer ID 231606101). Both are Microfun Limited; both are counted as one fleet here.
That declining download curve is the context. Most advertisers respond to softening installs by flooding the auction with new creative. Microfun did the opposite: it kept a 398-day-old video running and let it carry seventy percent of the account.
 Gossip Harbor's dominant creative: 4,472,111,564 impressions across 2,774,875 placements, 25 seconds, first observed 2025-07-16 and still running after 398 days.
The fleet at a glance: 15 entries, 6.38 billion impressions
| # | Impressions | Placements | First seen | Days live | Duration | Impr/placement | Playable |
|---|---|---|---|---|---|---|---|
| 1 | 4,472,111,564 | 2,774,875 | 2025-07-16 | 398 | 25s | 1,612 | — |
| 2 | 647,432,053 | 181,392 | 2026-04-02 | 139 | 54s | 3,569 | Yes |
| 3 | 438,024,545 | 161,038 | 2026-02-07 | 193 | 59s | 2,720 | — |
| 4 | 297,261,428 | 95,426 | 2026-03-19 | 153 | 59s | 3,115 | Yes |
| 5 | 111,437,994 | 45,465 | 2025-09-09 | 344 | 55s | 2,451 | — |
| 6 | 72,509,048 | 29,450 | 2025-09-09 | 344 | 14s | 2,462 | — |
| 7 | 65,892,498 | 22,463 | 2026-04-09 | 132 | 59s | 2,933 | Yes |
| 8 | 58,847,686 | 21,339 | 2026-03-12 | 160 | 59s | 2,758 | — |
| 9 | 44,070,313 | 22,763 | 2025-11-03 | 289 | 42s | 1,936 | — |
| 10 | 42,230,439 | 25,539 | 2025-11-03 | 289 | 52s | 1,654 | — |
| 11 | 34,534,664 | 9,998 | 2026-07-30 | 20 | 59s | 3,454 | — |
| 12 | 28,633,955 | 8,456 | 2025-07-23 | 392 | 25s | 3,386 | — |
| 13 | 24,030,728 | 7,972 | 2026-06-06 | 74 | 53s | 3,014 | — |
| 14 | 22,869,802 | 10,098 | 2026-03-19 | 153 | 57s | 2,265 | Yes |
| 15 | 22,016,197 | 9,403 | 2026-04-16 | 125 | 57s | 2,341 | Yes |
| Total (30-day window) | 6,381,902,914 | 3,425,677 | — | 214 avg | — | 1,863 | 5/15 |
The mean entry delivers 425.5 million impressions. The median entry delivers 44.1 million. The mean is 9.6x the median — a distribution so skewed that describing this fleet by its average would be actively misleading.
The practical read: Gossip Harbor does not have fifteen working creatives. It has one working creative, two useful supporting assets, and twelve entries that stay in rotation because there is no reason to turn them off.
Entries #1 and #12 are the same video file
This is the finding that changes how you should count this account.
Entries #1 and #12 both carry videoFp eff9e07aaab1f6beb92be8805e3d0ff9. They are the same 25-second video, both running under the Android bundle com.mergegames.gossipharbor, launched seven days apart.
| Entry | First seen | Days live | Impressions | Placements | Impr/placement |
|---|---|---|---|---|---|
| #1 | 2025-07-16 | 398 | 4,472,111,564 | 2,774,875 | 1,612 |
| #12 | 2025-07-23 | 392 | 28,633,955 | 8,456 | 3,386 |
| Combined | — | — | 4,500,745,519 | 2,783,331 | — |
Same file. 156x difference in delivery. One became the largest asset in the account; the other has been running almost as long and delivered 0.4% of the fleet.
Two things follow.
The file is not the unit of success — the entry is. Whatever distinguishes #1 from #12 is not the creative, because the creative is byte-identical. It is campaign structure, targeting, bid, or placement mix. Anyone concluding "this video is a winner" from #1 alone would have to explain #12.
Fifteen entries is not fifteen creatives. Deduplicated by file, Microfun is running fourteen distinct videos, one of which is doing 70.5% of the work. Any competitor benchmarking Microfun on "creatives shipped" is over-counting.
Concentration: one asset, seventy percent
| Rank | Impressions | Share | Cumulative |
|---|---|---|---|
| #1 | 4,472,111,564 | 70.1% | 70.1% |
| #2 | 647,432,053 | 10.1% | 80.2% |
| #3 | 438,024,545 | 6.9% | 87.1% |
| #4–#15 | 824,334,752 | 12.9% | 100% |
One entry takes 70.1%. Twelve entries share 12.9% between them. This is the most top-heavy fleet measured in this series — Vita Mahjong's leader takes 42.9%, Block Out!'s takes 43.4%.
Group by launch year and the story is a single 2025 asset holding up an entire 2026 fleet:
| Cohort | Entries | Impressions | Share |
|---|---|---|---|
| 2025 | 6 | 4,771,003,313 | 74.8% |
| 2026 | 9 | 1,610,899,601 | 25.2% |
Nine creatives launched in 2026 deliver a quarter of the account. Six launched in 2025 deliver three-quarters — and 94% of that comes from one file.
 Entry #2 — 54 seconds, 647,432,053 impressions across 181,392 placements in the 30-day window, first seen 2026-04-02. At 3,569 impressions per placement it is the densest asset in the fleet.
The 25-second anomaly
The lead asset violates the fleet's own format convention.
| Duration | Entries | Impressions | Share |
|---|---|---|---|
| 25s | 2 | 4,500,745,519 | 70.5% |
| 52–59s (house format) | 11 | 1,764,578,034 | 27.6% |
| 14s | 1 | 72,509,048 | 1.1% |
| 42s | 1 | 44,070,313 | 0.7% |
Eleven of fifteen entries run 52–59 seconds. That is unmistakably the house format — it is what the team briefs, produces and ships. It delivers 27.6% of the account.
The two 25-second entries deliver 70.5%.
Within the 52–59 second band the best performer is entry #2 at 647 million. The 25-second file beats it by 6.9x. Microfun has spent thirteen months producing long-form creative in a fleet where its single best asset is less than half that length and was made before any of it.
The uncomfortable read: this is not a team that discovered short-form works and pivoted. Eleven of its fifteen entries, including the newest (entry #11, 59 seconds, first seen 2026-07-30), are long-form. The house format has continued unchanged around an asset that outperforms all of it combined by 2.6x.
Lifespan: seven entries past 180 days, and nothing retired
All fifteen entries were live on 2026-08-19. Average age is 214 days.
| Age band | Entries | Impressions | Share |
|---|---|---|---|
| 366–400 days | 2 | 4,500,745,519 | 70.5% |
| 271–365 days | 4 | 270,247,794 | 4.2% |
| 181–270 days | 1 | 438,024,545 | 6.9% |
| 91–180 days | 6 | 1,114,319,664 | 17.5% |
| 0–90 days | 2 | 58,565,392 | 0.9% |
Seven entries have run past 180 days; six past 270. But the age distribution is doing something specific here: the oldest band is also the highest-delivering band, which is the reverse of every other fleet measured in this series. Elsewhere old assets are sediment. Here the oldest asset is the engine.
That distinction matters for how you read "nothing gets retired." At Vita Studio and Century Games, keeping everything running is an absence of housekeeping — the veterans contribute 8–16%. At Microfun, keeping the 398-day asset running is the strategy.
 Entry #3 — 59 seconds, 438,024,545 impressions, 193 days live. The best-performing example of the house format, and still 10.2x smaller than the 25-second file.
Reach versus frequency: the lead asset is the thinnest
Impressions per placement across the fleet ranges from 1,612 to 3,569 — a 2.21x spread. The notable part is where the leader sits.
| Entry | Impressions | Impr/placement | Reading |
|---|---|---|---|
| #1 | 4,472,111,564 | 1,612 (lowest) | Spread wide and thin |
| #10 | 42,230,439 | 1,654 | — |
| #9 | 44,070,313 | 1,936 | — |
| #2 | 647,432,053 | 3,569 (highest) | Pushed dense and narrow |
| #11 | 34,534,664 | 3,454 | Newest, tested dense |
The highest-volume asset has the lowest density in the account. Entry #1 recorded 2,774,875 placements — 81% of the entire fleet's placement count of 3,425,677 — while converting each one at the lowest rate.
That is the profile of an asset the buying system trusts as default inventory filler: surfaced across an enormous number of distinct placements rather than hammered repeatedly into a narrow set. Newer assets like #2 and #11 show the opposite signature — few placements, high density — which is what controlled testing looks like.
For competitive analysis: if you ranked this fleet by placement count, #1 would still lead, but you would badly misread #2. It has 15x fewer placements than #1 yet is the second-largest asset, because it is being pushed 2.2x harder into each one.
Playables: five entries, one file, zero pure units
Microfun barely uses interactive creative, and the way it uses what it has is unusual.
Five of fifteen entries carry a playable. All five reference the same playHtmlFp (8da2f850…). There is exactly one interactive asset in this account.
| Entry | Duration | First seen | Impressions |
|---|---|---|---|
| #2 | 54s | 2026-04-02 | 647,432,053 |
| #4 | 59s | 2026-03-19 | 297,261,428 |
| #7 | 59s | 2026-04-09 | 65,892,498 |
| #14 | 57s | 2026-03-19 | 22,869,802 |
| #15 | 57s | 2026-04-16 | 22,016,197 |
| Combined | — | — | 1,055,471,978 (16.5%) |
There are zero pure-playable units. Every one of the fifteen entries has a recorded video duration; the playable is always an end card attached to a video, never the creative itself.
Note also the dates: all five playable-carrying entries were launched between 2026-03-19 and 2026-04-16 — a single 28-day window. Microfun built one interactive asset, attached it to five videos in one production cycle, and has not shipped another since.
Set against the other publishers measured the same day, this is the low end of interactive commitment:
| Publisher | Playable attachment | Distinct playable files | Pure-playable share of impressions |
|---|---|---|---|
| Whiteout Survival (Century Games) | 15 / 15 | 12 | 96.0% |
| Block Out! (Grand Games) | 15 / 15 | — | 31.7% |
| Vita Mahjong (Vita Studio) | 12 / 15 | — | 13.1% |
| Gossip Harbor (Microfun) | 5 / 15 | 1 | 0.0% |
| MONOPOLY GO! (Scopely) | 3 / 15 | — | 0.0% |
For a merge-and-story title this is defensible. The pitch is narrative — who Quinn is and what happened to her — not a mechanic that rewards touching. A 25-second story clip does that job, and the data agrees: it does it 6.9x better than the best long-form alternative.
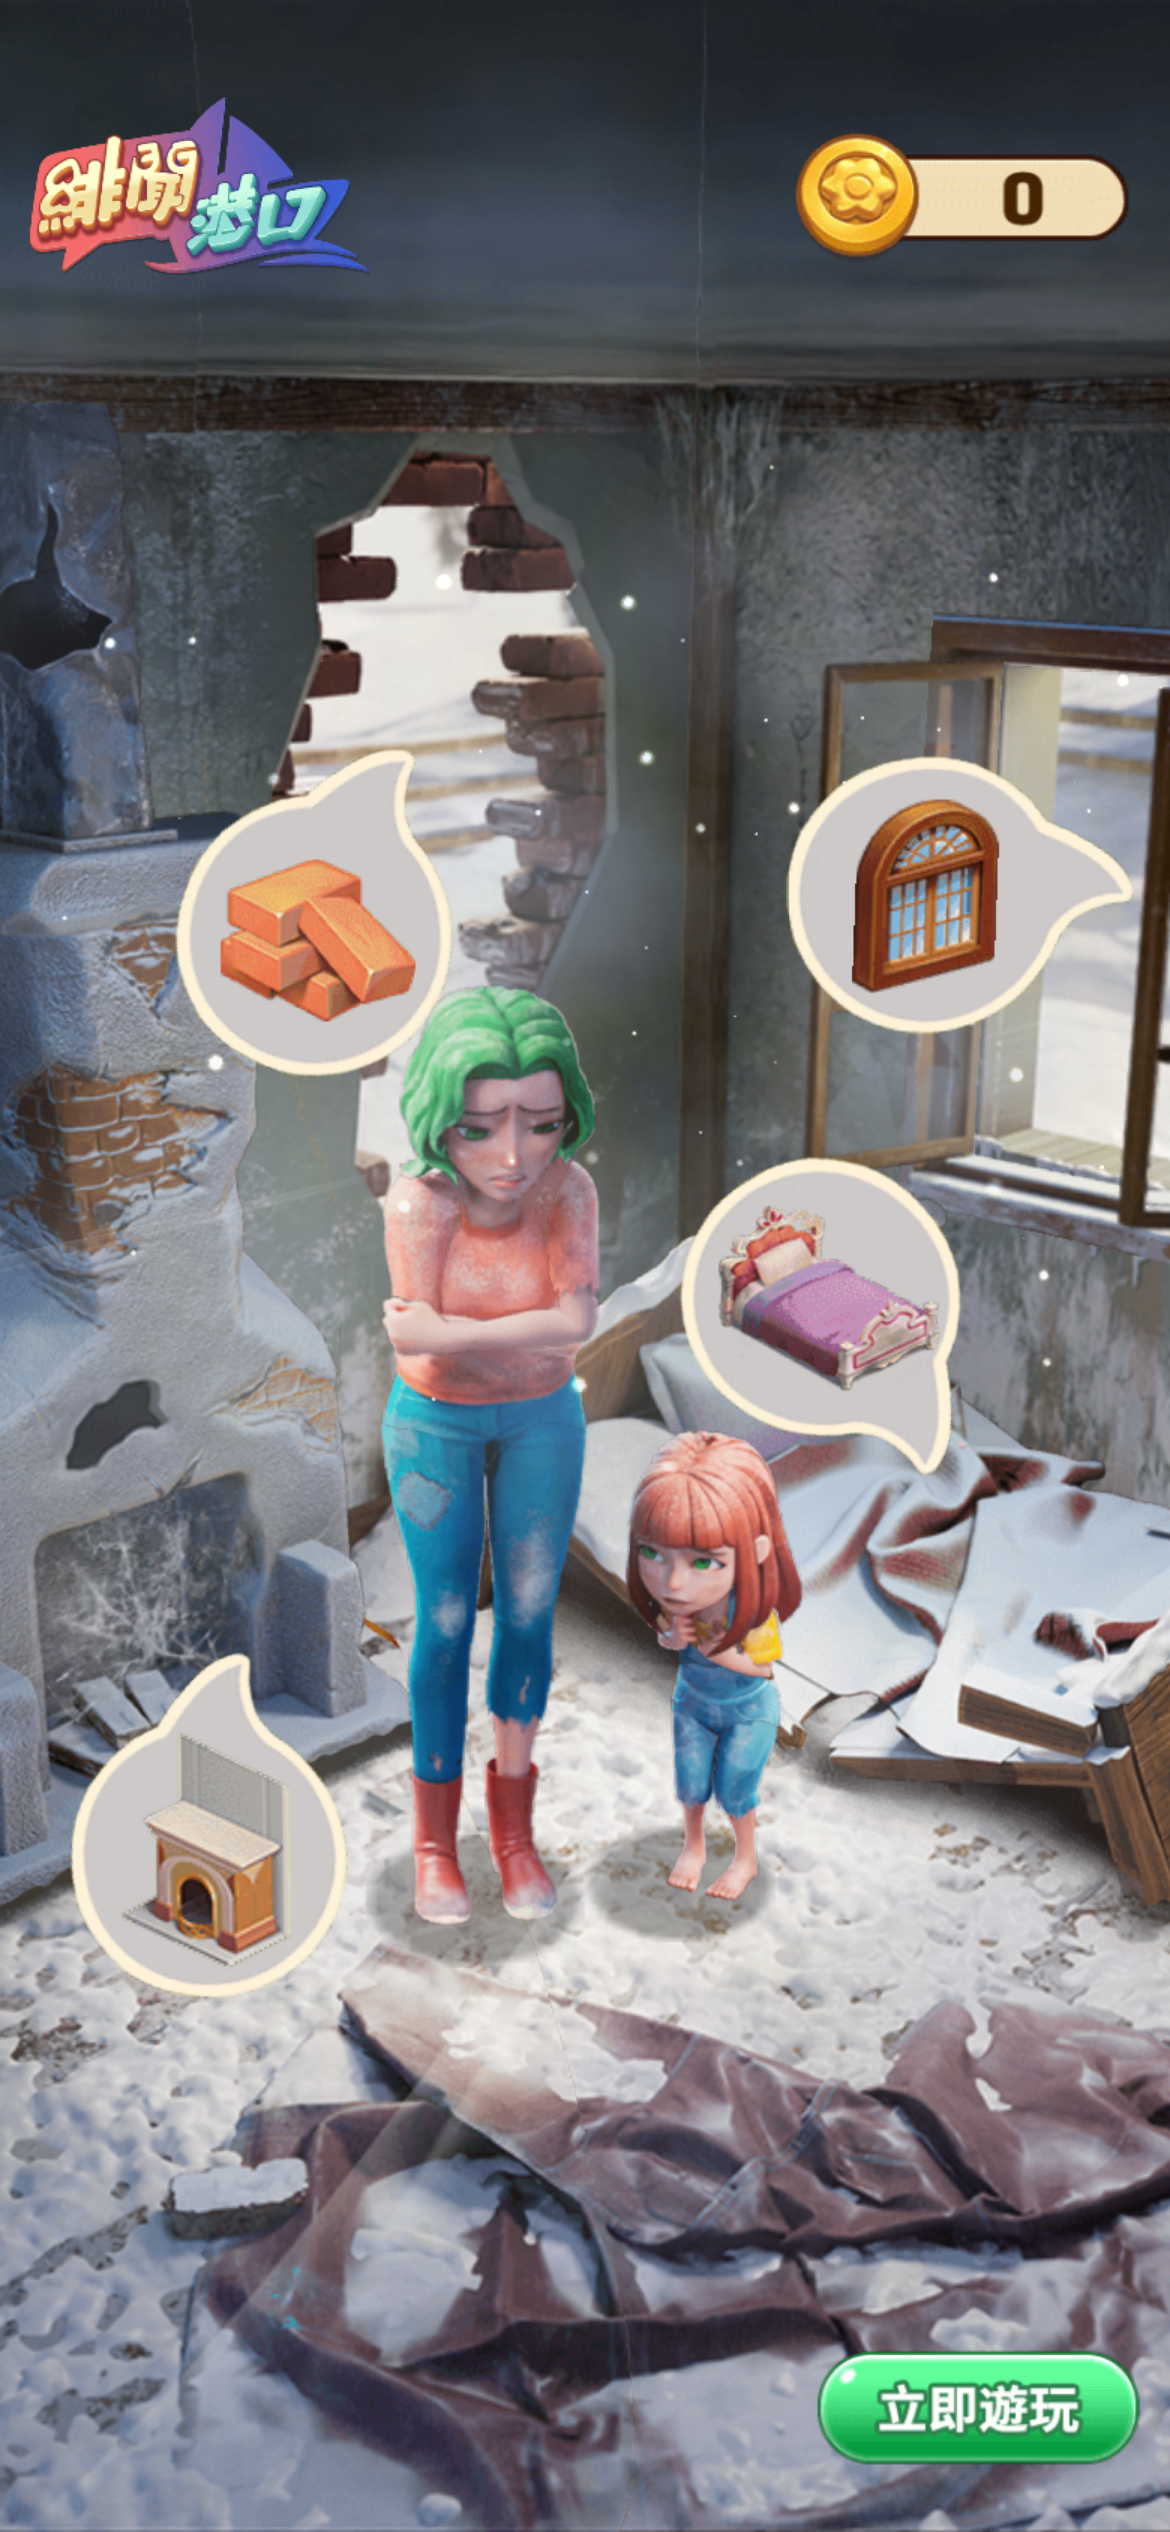 The entire interactive layer of this account: one playable file, referenced by entries #2, #4, #7, #14 and #15, all launched between 2026-03-19 and 2026-04-16.
The build order: a 96-day silence, then a burst
Sorted by first-seen date, the cadence is visibly uneven.
| First seen | Duration | Impressions | Gap |
|---|---|---|---|
| 2025-07-16 | 25s | 4,472,111,564 | — |
| 2025-07-23 | 25s | 28,633,955 | +7d |
| 2025-09-09 | 55s | 111,437,994 | +48d |
| 2025-09-09 | 14s | 72,509,048 | same day |
| 2025-11-03 | 42s | 44,070,313 | +55d |
| 2025-11-03 | 52s | 42,230,439 | same day |
| 2026-02-07 | 59s | 438,024,545 | +96d |
| 2026-03-12 | 59s | 58,847,686 | +33d |
| 2026-03-19 | 59s | 297,261,428 | +7d |
| 2026-03-19 | 57s | 22,869,802 | same day |
| 2026-04-02 | 54s | 647,432,053 | +14d |
| 2026-04-09 | 59s | 65,892,498 | +7d |
| 2026-04-16 | 57s | 22,016,197 | +7d |
| 2026-06-06 | 53s | 24,030,728 | +51d |
| 2026-07-30 | 59s | 34,534,664 | +54d |
Three observations.
Creative arrives in pairs. Three separate dates — 2025-09-09, 2025-11-03 and 2026-03-19 — each carry two launches. Microfun ships and tests in twos, not singles.
There is a 96-day silence. Between 2025-11-03 and 2026-02-07 nothing new entered the fleet. That is over three months with no new US creative while the 25-second asset carried the account alone.
Then a dense burst, then a slowdown. From 2026-02-07 to 2026-04-16 — 68 days — seven entries launched, including all five playable-carrying ones. Since then, only two: 2026-06-06 and 2026-07-30, at 51 and 54-day intervals.
An earlier version of this article described a "127-day rhythm" built on three billion-impression assets. Two of those three are the entries that dropped out of the 30-day window ranking — they still exist, but they were never the basis for a cadence claim, because first-seen dates, not impression rank, are what cadence is built from. Read from the dates, the actual cadence is irregular: pairs, a 96-day gap, a 68-day burst, then a slow tail.
 Entry #5 — 55 seconds, 111,437,994 impressions, 344 days live. Launched the same day as a 14-second sibling, illustrating Microfun's habit of shipping in pairs.
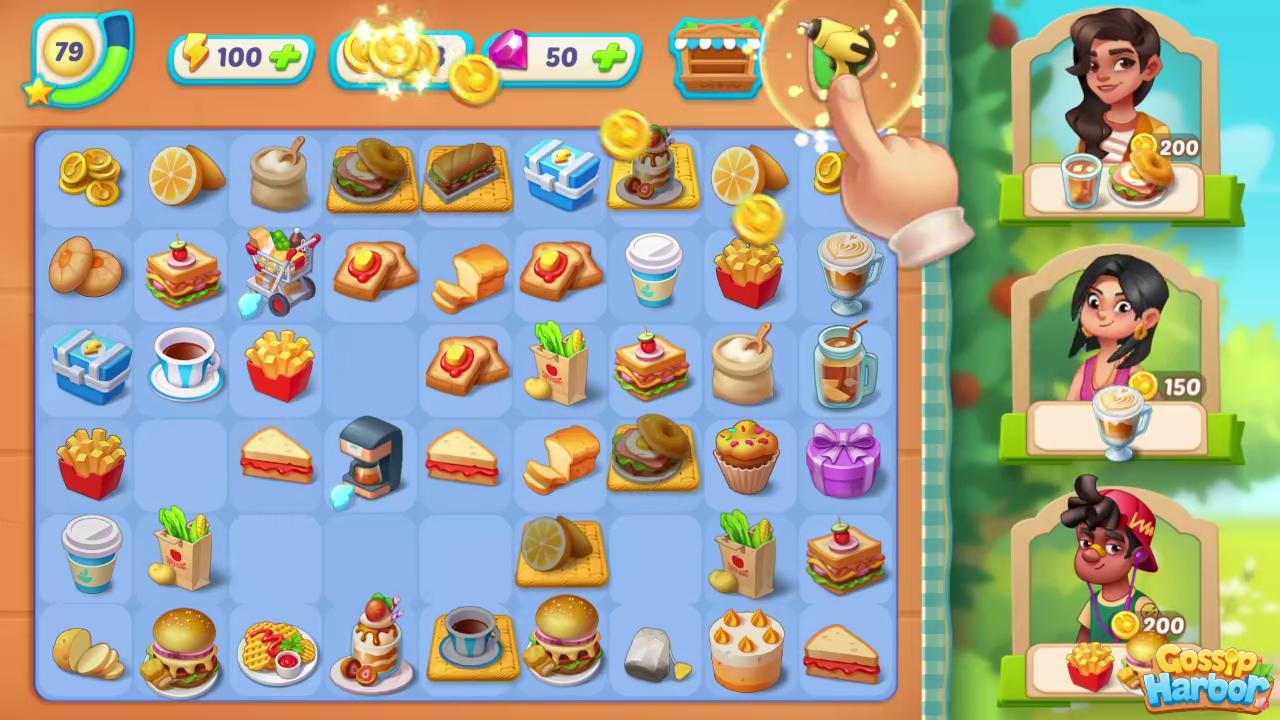 Entry #6 — 14 seconds, the shortest asset in the fleet, 72,509,048 impressions across 344 days. Its 55-second same-day sibling delivered only 1.5x more.
The intensity metric everyone computes here is wrong
A standard move in competitive teardowns is to divide an asset's impressions by its days live, producing "impressions per day," then re-rank. Applied to this data it produces a specific, large error, and it is worth showing exactly why.
The impression figure is a 30-day window. The days-live figure spans first-seen to last-seen — 398 days for the lead asset. Dividing one by the other divides a 30-day numerator by a 398-day denominator.
| Entry | Days live | Correct daily rate (÷30) | Naive rate (÷days live) | Understated by |
|---|---|---|---|---|
| #1 | 398 | 149,070,385 | 11,236,461 | 13.3x |
| #2 | 139 | 21,581,068 | 4,657,785 | 4.6x |
| #3 | 193 | 14,600,818 | 2,269,557 | 6.4x |
| #11 | 20 | 1,151,155 | 1,726,733 | 0.7x |
The distortion scales with asset age. The 398-day leader is understated 13.3x; the 20-day newcomer is actually overstated. Any ranking built this way systematically punishes long-lived assets and flatters new ones — which is precisely backwards for a fleet whose defining feature is a 398-day asset.
And once corrected, the metric collapses into the impression column. Because every asset shares the same 30-day window, dividing by 30 is a constant transform: the daily-rate ranking is identical to the impression ranking. There is no separate "intensity" insight to extract here.
That is the honest finding. In a teardown built on lifetime totals you can meaningfully ask "which asset is accumulating fastest right now." With a fixed-window metric that question is already answered by the window itself. We are not reporting an intensity ranking for this fleet because the data cannot support one — and any competitor analysis that does report one is publishing an artifact.
Head-to-head: Gossip Harbor versus the merge genre
All rivals pulled the same day, same method, same page size, verified by app ID.
| Title | Publisher | App ID | Total impressions | Top-1 share | Live | Avg age | Oldest |
|---|---|---|---|---|---|---|---|
| Gossip Harbor | Microfun Limited | 1623318294 | 6,381,902,914 | 70.1% | 15/15 | 214 | 398 |
| Seaside Escape | Microfun Limited | 6443755785 | 951,194,709 | 29.4% | 15/15 | 224 | 698 |
| Tasty Travels | Century Games | 6471045672 | 358,362,991 | 56.3% | 15/15 | 152 | 236 |
| Merge Mansion | Metacore Games Oy | 1484442152 | 300,182,530 | 20.4% | 12/15 | 110 | 147 |
| Travel Town | Moon Active | 1521236603 | 168,542,466 | 22.0% | 11/14 | 136 | 259 |
| Manor Matters | Playrix | 1455953893 | 17,754,919 | 26.8% | 12/15 | 85 | 465 |
Gossip Harbor out-delivers Tasty Travels, Merge Mansion and Travel Town combined by 7.7x (6.38B against 827.1M). Including Microfun's own Seaside Escape, the multiple against all four is 3.6x. Every fleet here was pulled with the same default 30-day window, so the ratios are like-for-like — but they compare 30-day delivery, not lifetime output.
An earlier version of this article claimed 15.9x. That figure was computed against the pre-correction 12.2 billion total and is wrong. 7.7x is the reproducible number.
Two corrections worth flagging in the rival data itself:
The "Travel Town" keyword pull returned fifteen entries, but one belonged to Pines Peak - Merge Travel Game (VIZOR APPS LTD, app 6743472188) — a different game from a different publisher. It is excluded above, which is why Travel Town shows 14 entries rather than 15. Including it would have inflated Travel Town by 5.1 million impressions.
Seaside Escape is also Microfun. It shares developer IDs with Gossip Harbor (231606101 / 1417856988), making it the cleanest comparison available — same publisher, same genre, same market, same day. And the two run different strategies:
| Gossip Harbor | Seaside Escape | |
|---|---|---|
| Total impressions | 6,381,902,914 | 951,194,709 |
| Top-1 concentration | 70.1% | 29.4% |
| Pure playables | 0 / 15 | 3 / 15 |
| Oldest asset | 398 days | 698 days |
| Average age | 214 | 224 |
Microfun runs a one-asset strategy on Gossip Harbor and a distributed, partly-interactive strategy on Seaside Escape. Same company, same genre, opposite creative doctrine — which is direct evidence that concentration here is a per-title decision, not a house style.
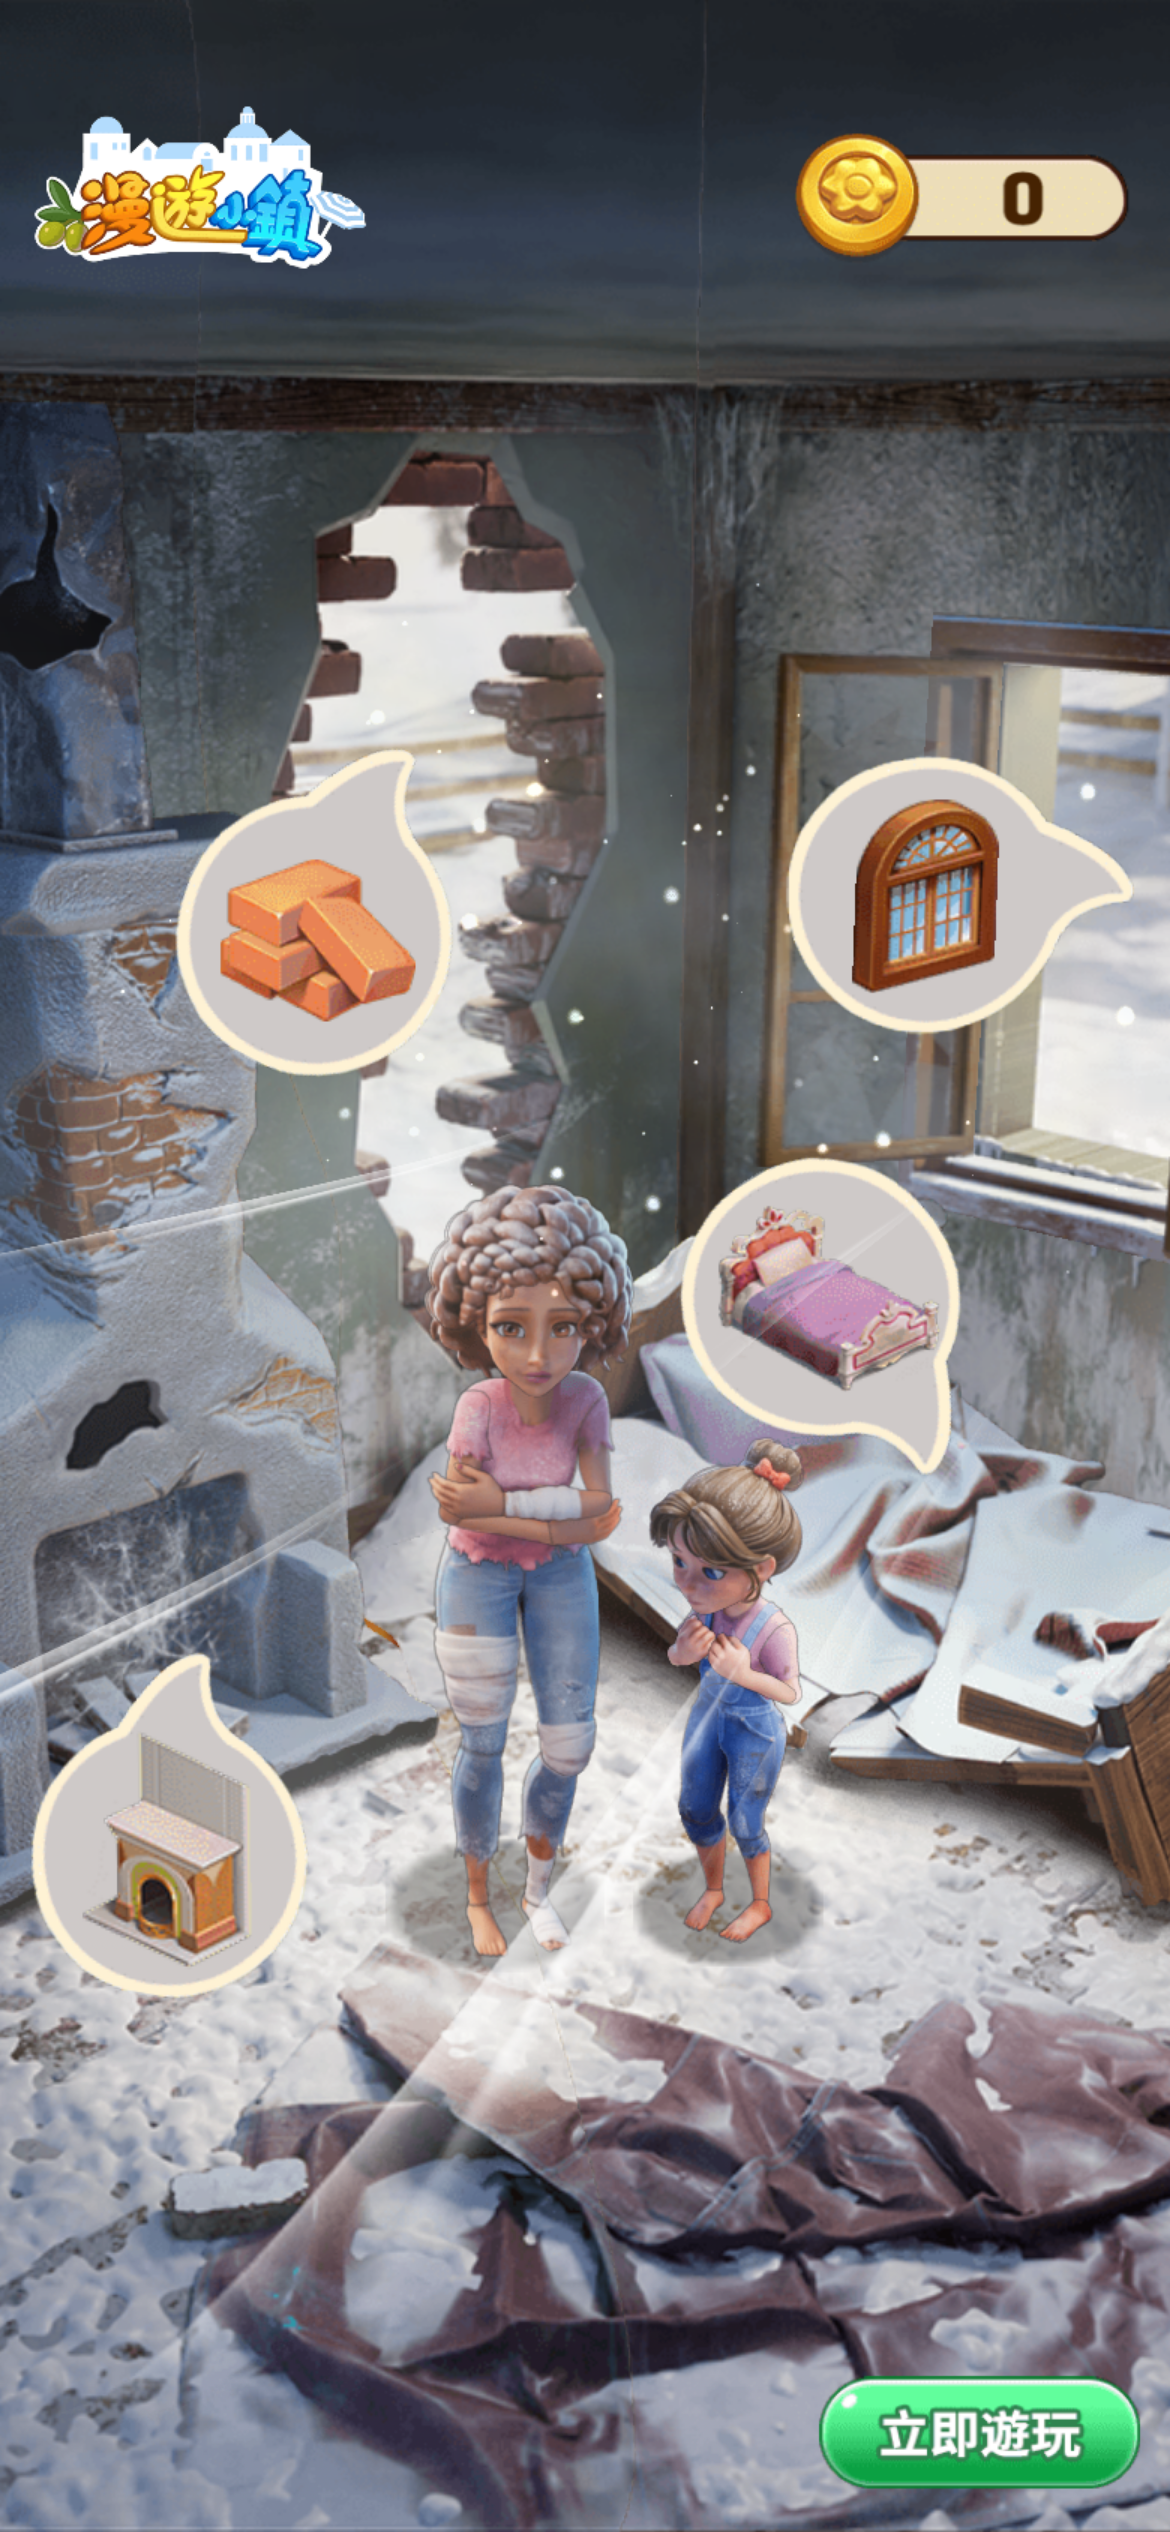 Seaside Escape (Microfun Limited, app
 6443755785) — the same publisher's other merge title leads with a pure playable at 279,829,880 impressions, a format Gossip Harbor does not use at all.
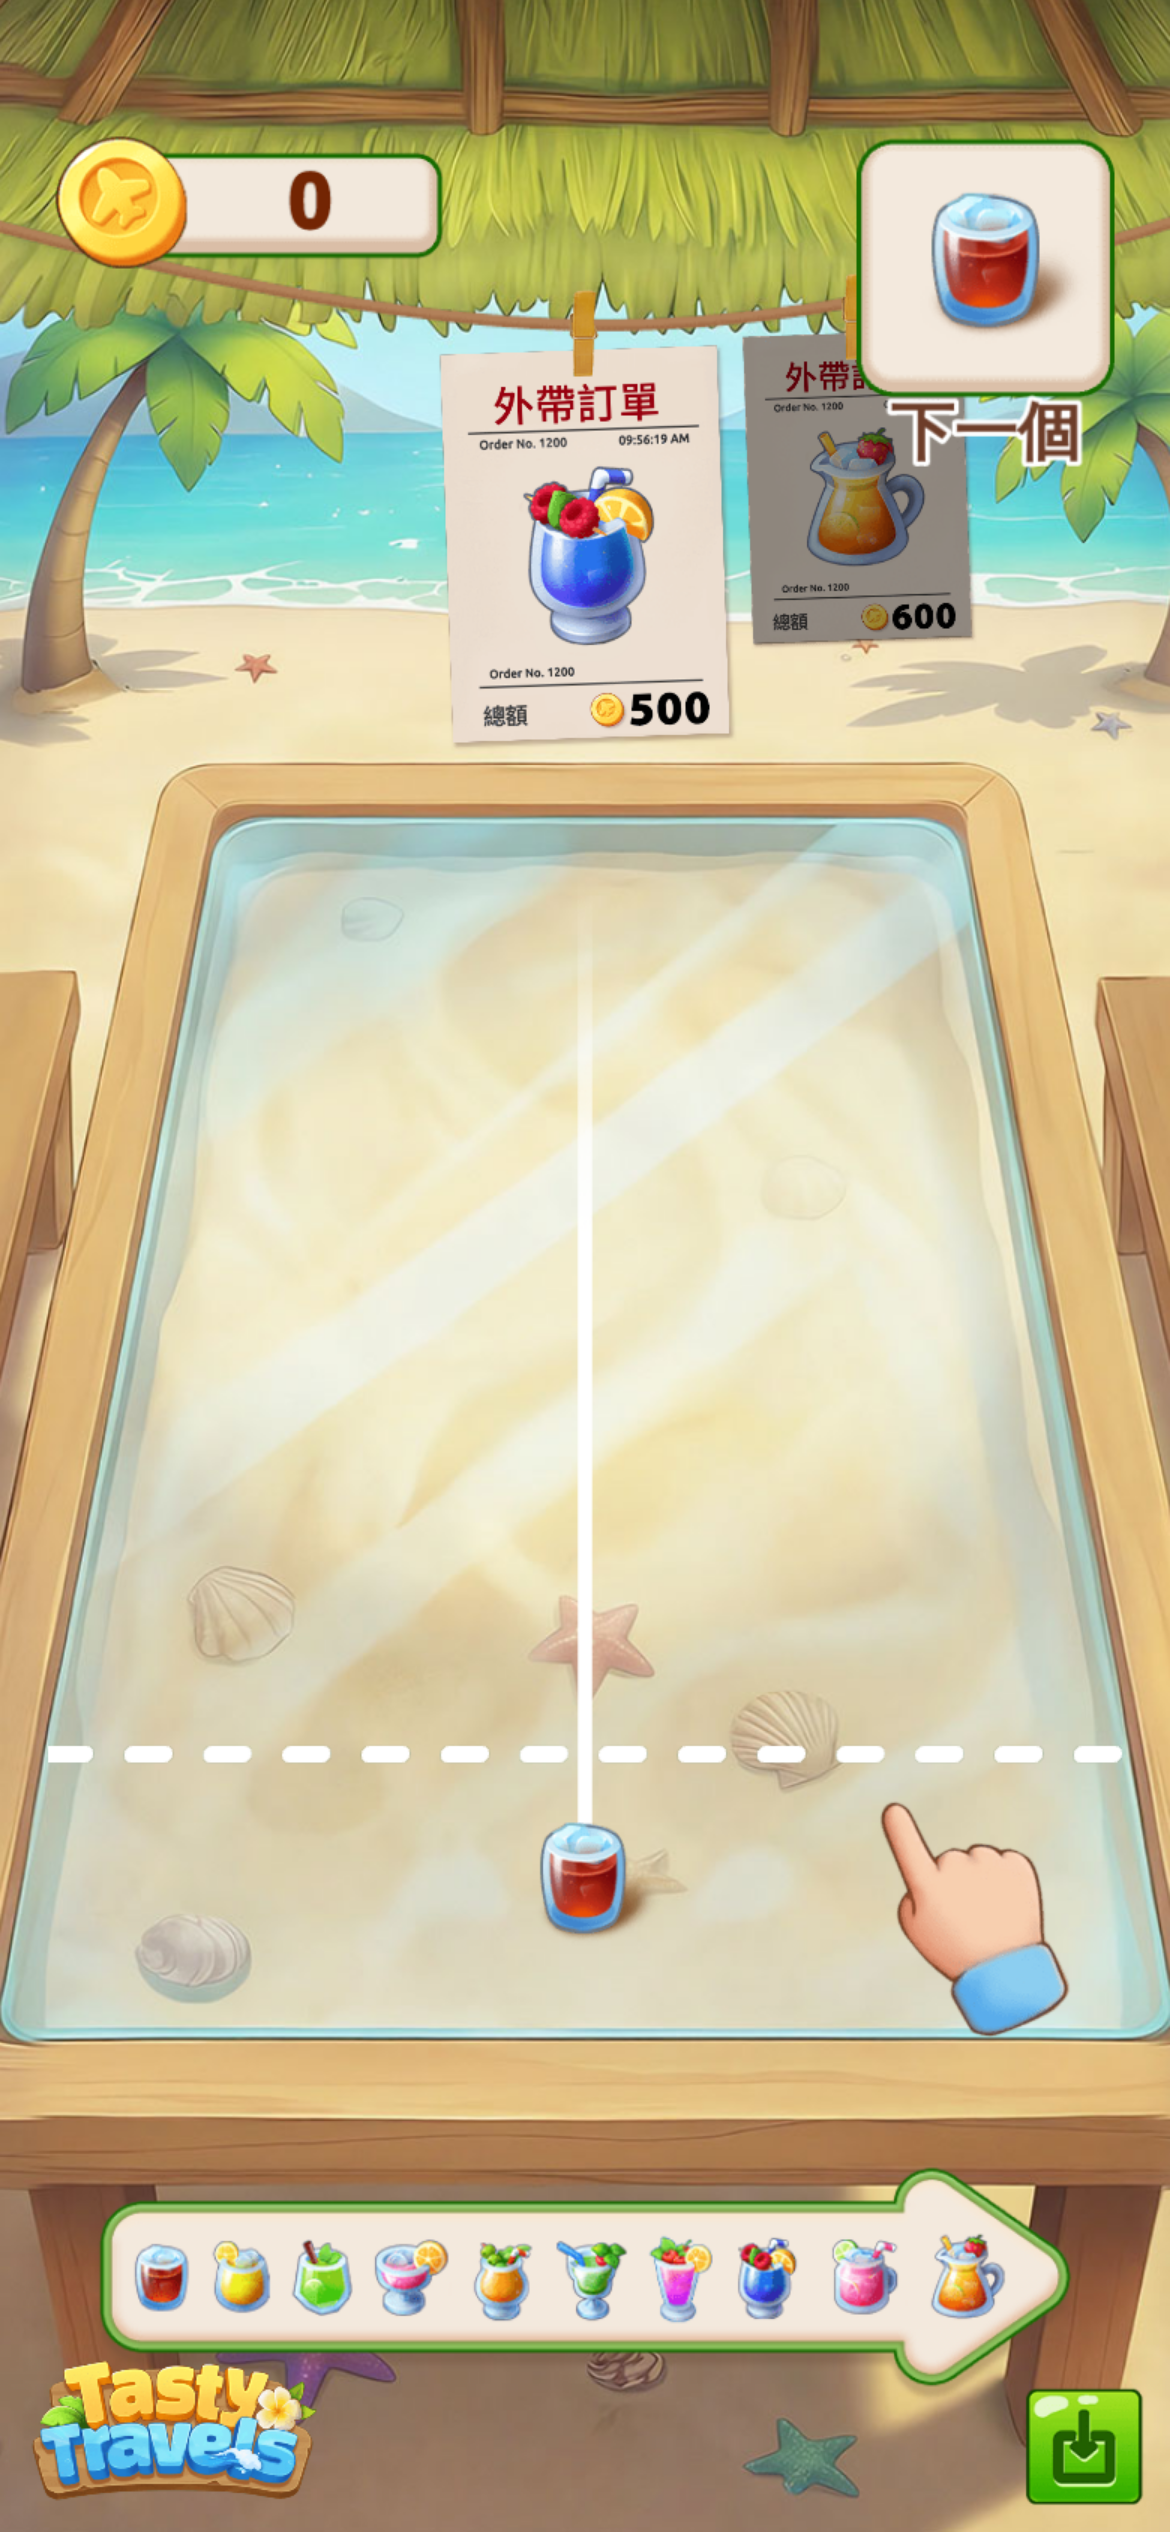 Tasty Travels (Century Games, app
 6471045672) — 7 of its 15 creatives are pure playables, and its leader is one of them at 201,867,243 impressions. The merge genre is not uniformly video-led; Gossip Harbor is the outlier.
What transfers to your UA program
If you run creative production: the 25-versus-55-second finding is the expensive one. Microfun's house format is 52–59 seconds and eleven entries deep, and it is beaten 2.6x by two entries of a 25-second file made before any of it. Before your next long-form brief, check whether your own best-performing asset is representative of what you keep producing. Here it demonstrably is not.
If you run competitive intelligence: deduplicate by file fingerprint before counting anything. Fifteen entries here are fourteen files, and the two entries sharing one file differ 156x in delivery. Both "Microfun ships 15 creatives" and "this 25-second video reliably wins" are wrong conclusions available from undeduplicated data.
If you run media buying: entries #1 and #12 are the cleanest natural experiment in the dataset — identical creative, seven days apart, 156x apart in outcome. Whatever separates them is structural, not creative. If your own reporting attributes performance to creatives rather than to creative-times-placement, this pair is what that blind spot looks like.
If you are competing with Microfun: the concentration is the exposure. 70.1% of this account rests on one file that has been in market 398 days. There is no second engine — the entire 52–59 second house format, eleven entries and thirteen months of production, delivers 27.6%. Pressure applied against that single asset is pressure applied against most of the account.
If you are considering playables in merge: Gossip Harbor runs one playable file, zero pure units, and 0.0% pure-playable delivery — while its own stablemate Seaside Escape runs three pure playables and leads with one, and Tasty Travels runs seven. Microfun is not avoiding interactive out of genre necessity. It is a title-level choice.
Two falsifiable predictions
Prediction 1: entry #1 (25s, first seen 2025-07-16) will still be live on 2026-12-01, and will still hold above 60% of fleet impressions.
The basis: it has run 398 days, it holds 70.1% of the current 30-day window, and Microfun has not been observed retiring anything — 15 of 15 entries were live on the pull date, and even the three entries that dropped out of the window ranking are still live.
Prediction 2: the next new Gossip Harbor creative to enter the top 15 will be 52–59 seconds, not 25.
The basis: eleven of fifteen entries sit in that band, including the two most recent (2026-06-06 at 53s and 2026-07-30 at 59s). Despite the 25-second file's dominance, there is no evidence in fifteen months of output that Microfun has shifted its production format.
Prediction 2 is the more interesting one to be wrong about: a new 25-second entry would be the first sign that Microfun has read its own data.
How to reproduce this teardown
- Deduplicate by
videoFpandplayHtmlFpbefore counting. Fifteen entries here are fourteen video files and one playable file. Entry counts overstate production. - Pull every comparison fleet on the same day. Lifespan and "still live" are measured against the pull date; mixing dates invalidates both.
- Verify every fleet by app ID, never by name. The Travel Town pull contained a Pines Peak entry from a different publisher.
- Merge platform variants deliberately. This product appears under both an iOS app ID and an Android bundle with different developer IDs. Both are Microfun; treating them as separate fleets would split the account.
- Report median alongside mean. The mean entry here is 9.6x the median. The mean describes nothing real.
- Compute impressions per placement per entry. The highest-volume asset has the lowest density, which inverts the naive read.
- Pull twice, hours apart, before publishing. This is the step that caught the 2x discrepancy documented below. It costs one extra query.
Methodology and data notes
- Source: AdMapix creative search and ranking APIs, queried 2026-08-19, country filter
US,page_size=15, sorted by impressions descending. - Sample: the top 15 ad entries by impressions for
Gossip Harbor. Entries resolve to iOS app ID1623318294(developer ID1417856988) and Android bundlecom.mergegames.gossipharbor(developer ID231606101), both Microfun Limited, counted as one fleet. - Entries versus files: the 15 entries carry 14 distinct
videoFpvalues; entries #1 and #12 shareeff9e07aaab1f6beb92be8805e3d0ff9. Five entries carry a playable and all five share oneplayHtmlFp. Where this article says "file" it means fingerprint; where it says "entry" it means ad record. - "Days live" is the span between first-observed and last-observed timestamps. All fifteen entries showed a last-observed date equal to the pull date and are treated as live.
- "Placements" (
showCnt) counts recorded creative appearances, not unique users or publishers. Impressions-per-placement is a distribution-shape indicator, not a frequency metric. - Impressions are third-party estimates, not publisher-reported figures and not spend. They support relative comparison and should not be converted to dollar figures.
- Download figures are US-region estimates for the current ranking period; Gossip Harbor appeared at position 108 with 758,507 downloads at -19.06%.
- Rival fleets (Seaside Escape
6443755785, Tasty Travels6471045672, Merge Mansion1484442152, Travel Town1521236603, Manor Matters1455953893) were pulled on the same date with the same method. One entry was excluded from Travel Town: an entry for Pines Peak - Merge Travel Game (VIZOR APPS LTD, app6743472188), which the keyword pull returned but which belongs to a different publisher. Travel Town is therefore reported on 14 entries.
Data recency: this fleet changed by roughly 2x within one day
This is not a boilerplate disclaimer. It describes a specific, measured event.
On 2026-08-19, two pulls of the same keyword, country and page size returned materially different fleets. An early-afternoon pull returned 15 entries totalling 12,221,035,981 impressions. Later the same day, three consecutive pulls returned 15 entries totalling 6,381,902,914 — byte-identical across all three requests, ruling out random sampling variation.
The explanation is not a data revision. impression is a windowed metric. With no start_date / end_date supplied, this API returns a rolling 30-day window, verified two ways:
- The default response matches an explicit
start_date=2026-07-20, end_date=2026-08-19query entry for entry, and start dates of 07-18, 07-19, 07-21 and 07-22 all fail to reproduce it. - Querying one fixed record ID across widening windows returns 86,897,499 (19 days), 112,248,696 (default), 158,717,137 (50 days) and 678,617,005 (415 days) — the same creative, the same day, a 7.8x spread.
The three entries that "disappeared" were never removed. Tracked by record ID they remain attributed to Microfun Limited under app 1623318294, were still recording placements on 2026-08-19, and rank first and second in the account under a 7-day window. They simply fell outside the top fifteen of the 30-day ranking.
Two consequences follow, and they are the reason this section exists:
Impression totals are not lifetime figures and must never be described as such. Values across different windows are not comparable, and are not even monotone — a creative can rank higher in a 7-day window than in a 30-day one.
Any metric that divides impressions by days-live is invalid. It divides a 30-day numerator by a lifetime denominator, understating this fleet's 398-day leader by 13.3x. That error grows with asset age, so it systematically misrepresents exactly the long-lived assets a lifespan analysis is about.
What this means for you as a reader: every impression figure here is a 30-day reading ending 2026-08-19. If you reproduce this teardown without pinning the same window you will get different numbers, and neither of us will be wrong. The stable reference points are the app IDs, the pull date and the window; first-seen dates, last-seen dates and asset fingerprints are window-independent and are the parts you can compare directly.
The operational rule: always pass start_date and end_date explicitly, and state the window in anything you publish. Otherwise the same article re-run a month later will not reconcile with itself.
We publish this because a benchmark you cannot audit is worth nothing. The earlier 12.2 billion figure was reported in good faith, and the reason it did not reproduce is now documented above.
Frequently Asked Questions
How many ads is Gossip Harbor running in the US? Fifteen measurable ad entries as of 2026-08-19, totalling 6,381,902,914 impressions, with all fifteen still live on that date. Deduplicated by video fingerprint, those fifteen entries resolve to fourteen distinct video files.
What is Gossip Harbor's best-performing ad? A 25-second video first observed 2025-07-16, carrying 4,472,111,564 impressions across 2,774,875 placements — 70.1% of the entire fleet — and still running after 398 days. The same video file also appears under a second entry launched seven days later, which has delivered only 28,633,955. Together the file accounts for 70.5% of delivery.
Why do two Gossip Harbor ads have identical creative but 156x different results?
Entries #1 and #12 share the same videoFp — they are byte-identical 25-second videos launched seven days apart. One delivered 4.47 billion impressions, the other 28.6 million. Because the creative is identical, the difference must come from campaign structure, targeting, bid or placement mix rather than from the creative itself.
Does Gossip Harbor use playable ads? Barely. Five of fifteen entries carry a playable end card, and all five reference the same single playable file, launched within one 28-day window in spring 2026. There are zero pure-playable units — every entry is a video. By comparison, Microfun's own Seaside Escape runs three pure playables and Century Games' Tasty Travels runs seven.
How does Gossip Harbor compare with other merge games? It delivers 7.7x the combined US impressions of Tasty Travels, Merge Mansion and Travel Town (6.38 billion against 827.1 million), all measured on 2026-08-19. Including Microfun's own Seaside Escape, the multiple against all four rivals is 3.6x. It is also far more concentrated — 70.1% of delivery in one asset, against 20–56% for the others.
Is a 25-second or a 59-second ad better for merge games? In this account the 25-second file outperforms the entire 52–59 second house format — eleven entries — by 2.6x combined, and beats the single best long-form asset by 6.9x. But note the counter-evidence: Microfun has continued shipping long-form, including its two most recent creatives at 53 and 59 seconds. One account's outcome is not a genre rule.
Why was this article's impression total revised down from 12.2 billion?
Because impression is a rolling 30-day window value, not a lifetime total, and the two pulls landed on different rankings of that window. Three large entries present in the first pull and absent from the second were never removed — tracked by record ID they are still attributed to Microfun under app 1623318294, still live on 2026-08-19, and rank first and second in the account under a 7-day window. Every impression figure in this article is a 30-day reading ending 2026-08-19.
Want to check whether your own fleet is really as big as your entry count suggests? Per-creative impressions, placement counts, first-seen and last-seen dates, duration and video/playable fingerprints are all live in AdMapix, filterable by country, publisher and app ID — fingerprints being what turns fifteen ad entries into fourteen real files. Create a free account to run this teardown on any title in your category, or see plans for full historical access.
Data source: AdMapix third-party ad intelligence estimates, United States, retrieved 2026-08-19. All impression and placement figures are rolling 30-day window values ending 2026-08-19, not lifetime totals, and are not comparable to figures taken over a different window. First-seen dates, last-seen dates, durations and asset fingerprints are window-independent. Download figures come from a separate ranking endpoint. Impression and download figures are modelled estimates for comparative analysis and are not publisher-reported.
Related Reading
- Ad strategy teardowns (series index) — every teardown in the series, in publication order
- Mobile game ads guide: formats, examples and research — the format matrix, research workflow and KPI guardrails every teardown in this series applies
- Rips by Triumph — the standing jump — 5.98B impressions, no creative older than the launch
- Magic Tiles 3 — two store listings running two completely different machines
- Meowdoku — the quiet machine — dual SKU, zero batching, zero sweeps
Turn these observations into your next creative study
Open the creative library and select samples for your market, network and research question.
Related Articles
Meowdoku Ad Strategy in 2026: The Quiet Machine — Two SKUs, No Batches, No Sweeps, 637 Million Impressions
Meowdoku sits at #8 on the US download chart with the least dramatic ad operation in this series: no launch batches, no synchronized resets, no format experiments. Just a steady one-or-two-a-week drip of 27–60-second cat-sudoku videos across two separate store SKUs — 637 million model-estimated impressions, 13 of 15 top creatives still live, and a placement fingerprint that splits cleanly along SKU lines. Sometimes the playbook is that there is no playbook drama.
PineDrama Ad Strategy in 2026: The Flood — 4.5-Minute Ads, Seven Copies per Video, and a Fleet That Dies Before It Peaks
PineDrama is the second-fastest riser on the US download chart, yet its biggest ad creative holds just 719K model-estimated impressions — and its entire top 15 went dark by August 5. We reconstruct TikTok Pte. Ltd.'s short-drama flood playbook from the AdMapix index: one 273-second video multiplexed under seven different copy lines, creator-style #ad distribution, by-asset synchronized retirements, and the methodological lesson an owned-inventory giant teaches every ad-intelligence reader.
Royal Match Ad Strategy in 2026: The Marathon Playbook — a 305-Day Creative, a Two-Year-Old Image, Zero Resets
Royal Match's top 15 US ad creatives are all still live — not one has ever been retired. We reconstruct Dream Games' marathon playbook from the AdMapix index: a 119-second video running 305 days, a static image whose asset dates to May 2024, the same proven video multiplexed across entries launched seven months apart, and per-creative intensity 175x below MONOPOLY GO!'s — sustained indefinitely.