
Magic Tiles 3 Ad Strategy in 2026: Two Store Listings, Two Completely Different Advertising Machines — and an August Fleet Swap That Is Half the Size It Looks
A fingerprint-deduplicated teardown of Amanotes' US user acquisition for Magic Tiles 3. Thirty ad instances carry 197,841,786 impressions in a 30-day window, but resolve to just seventeen videos and four playables — split across two systems sharing nothing: an iOS buy of six videos running up to 443 days at 131 impressions per placement, and an Android lab of eleven videos and four playables at 2,685. The early-August swap retired four assets and launched three, not eight and five.
Amanotes' Magic Tiles 3 does not run one ad fleet in the US. It runs two, and they have almost nothing in common.
The iOS listing shows eight ad instances that resolve to six distinct video files. They take 89.8% of every placement the game touches, deliver 131 impressions per placement, carry no playable at all, and one of them has been running since 2025-06-02 — 443 days. Their delivery rates span a range of just 1.21x.
The Android listing shows twenty-two instances that resolve to eleven videos and four playables. They take 10.2% of placements, deliver 2,685 impressions per placement, average 72 days old, and eleven of the twenty-two rows are already dead. Their delivery rates span 8.86x.
Same game. Same publisher. Two systems that share no asset, no cadence, no format convention and no retirement policy.
Then, between 2026-08-05 and 2026-08-08, Amanotes retired eight rows and launched five. Counted as files rather than rows, that swap is four assets out and three in — and the single most productive thing this account has ever run, the "five creatives" launched on 2026-06-09, turns out to be two video files.
What one row means here, and what "impressions" means
Two definitions have to be nailed down before any count below, because getting either wrong produces confidently false conclusions. Both bit this article in an earlier version.
A row is an ad instance, not a production. Each row returned by creative search is a distinct delivery record with its own impression count, placement count and date range. Multiple instances routinely share the same underlying video file, differing only in which playable is attached or which store listing they resolve to. Checking asset fingerprints (videoFp and playHtmlFp) on the thirty rows returns:
| Count | |
|---|---|
| Ad instances (rows) | 30 |
| Distinct videos | 17 |
| Distinct playables | 4 |
| Rows carrying a playable | 9 |
| Rows that are pure playable (no video) | 3 |
| Instances per video | 1.8 |
Impressions are a rolling 30-day figure, not a lifetime total. Every impression number in this article covers the window 2026-07-20 → 2026-08-19. This is verified, not assumed: an explicit query for those exact dates returns values identical to the default query, row for row, while a 90-day window returns substantially larger numbers for the same rows. Nothing here is a cumulative lifetime figure, and phrases like "carries" and "delivers" mean "delivered inside that 30-day window."
That second point has a consequence worth stating up front: this article contains no daily-rate figures. Sixteen of the thirty rows were only partially exposed to the measurement window — five entered it after 2026-07-20 and thirteen stopped inside it — and those sixteen account for 59.6% of window impressions. Dividing window impressions by any denominator would produce a number that mixes delivery intensity with window exposure, and in this fleet the two cannot be separated. Impression totals and placement ratios are reported instead.
All figures are AdMapix third-party estimates for the United States, pulled 2026-08-19. Methodology at the end.
Executive summary (TL;DR)
- Thirty rows, twenty-one files. The measured fleet is 17 distinct videos and 4 distinct playables. At 1.8 instances per video this is a conventional production pipeline, not a recombination machine.
- The two listings are two media plans. iOS (
1443446174) runs 6 videos at a median 131 impressions per placement, spread 1.21x, zero playables. Android (com.youmusic.magictiles) runs 11 videos and 4 playables at a median 3,626, spread 8.86x. No overlap between the groups. - The iOS side never changes. Average row age 283 days. Three assets have been live over 340 days, the oldest since 2025-06-02. No new iOS asset has appeared since 2026-04-15.
- The Android side is a churn lab. Average row age 72 days; eleven of twenty-two rows retired. Two rows launched on 2026-08-07 were dead by 2026-08-17 and 2026-08-18 — ten and eleven days.
- The August swap is half the size it looks. Eight rows retired 2026-08-05 to 2026-08-07 — but those eight are four assets: three videos and one playable. Five rows launched 2026-08-06 to 2026-08-08 — three videos.
- The 2026-06-09 "cohort of five" is two video files. Five rows, 68,812,620 impressions (34.8% of the fleet), all retired by 2026-08-07 — resolving to one 54-second video in three rows and one 30-second video in two.
- The messages survived the swap; the assets did not. The retired June rows ran two copy lines. The replacements run the same two lines on new footage.
Where Magic Tiles 3 sits on the US charts
| Metric | Value |
|---|---|
| US download rank | 137 |
| Downloads, current period | 640,575 |
| Downloads, prior period | 984,669 |
| Absolute change | -344,094 |
| Period-over-period change | -34.95% |
| Publisher | Amanotes Pte. Ltd. |
iOS app ID (chart productId) | 1443446174 — "Magic Tiles 3™: Piano Game" (developer ID 804106424) |
| Android package | com.youmusic.magictiles — "Magic Tiles 3" (developer ID 1639401842) |
That -34.95% places it among the sharpest declines in the category. Of the 46 games in the US top 250, it has the fifth-largest percentage decline and the eighth-largest absolute decline:
| Title | Downloads | Prior period | Absolute change | Change |
|---|---|---|---|---|
| EA SPORTS FC™ Football Mobile | 574,606 | 966,193 | -391,587 | -40.53% |
| Color by Number:Coloring Games | 469,514 | 786,779 | -317,265 | -40.32% |
| Amaze GO! | 668,165 | 1,069,714 | -401,549 | -37.54% |
| Tile Explorer - Triple Match | 430,959 | 686,029 | -255,070 | -37.18% |
| Magic Tiles 3™: Piano Game | 640,575 | 984,669 | -344,094 | -34.95% |
| Arrows – Puzzle Escape | 946,669 | 1,448,504 | -501,835 | -34.65% |
A note on the two names: the download chart lists the title as Magic Tiles 3™: Piano Game under productId 1443446174, which matches the iOS appList[].id on eight of the thirty rows. The remaining twenty-two carry com.youmusic.magictiles under the publisher string AMANOTES PTE. LTD. (uppercase) against the chart's Amanotes Pte. Ltd.. The publisher name differs only in case; the app IDs and developer IDs are distinct because they are two store listings. All joins in this article are on store ID, not on name. The creatives themselves carry a single title string, Magic Tiles 3™ - Piano Game, on both sides.
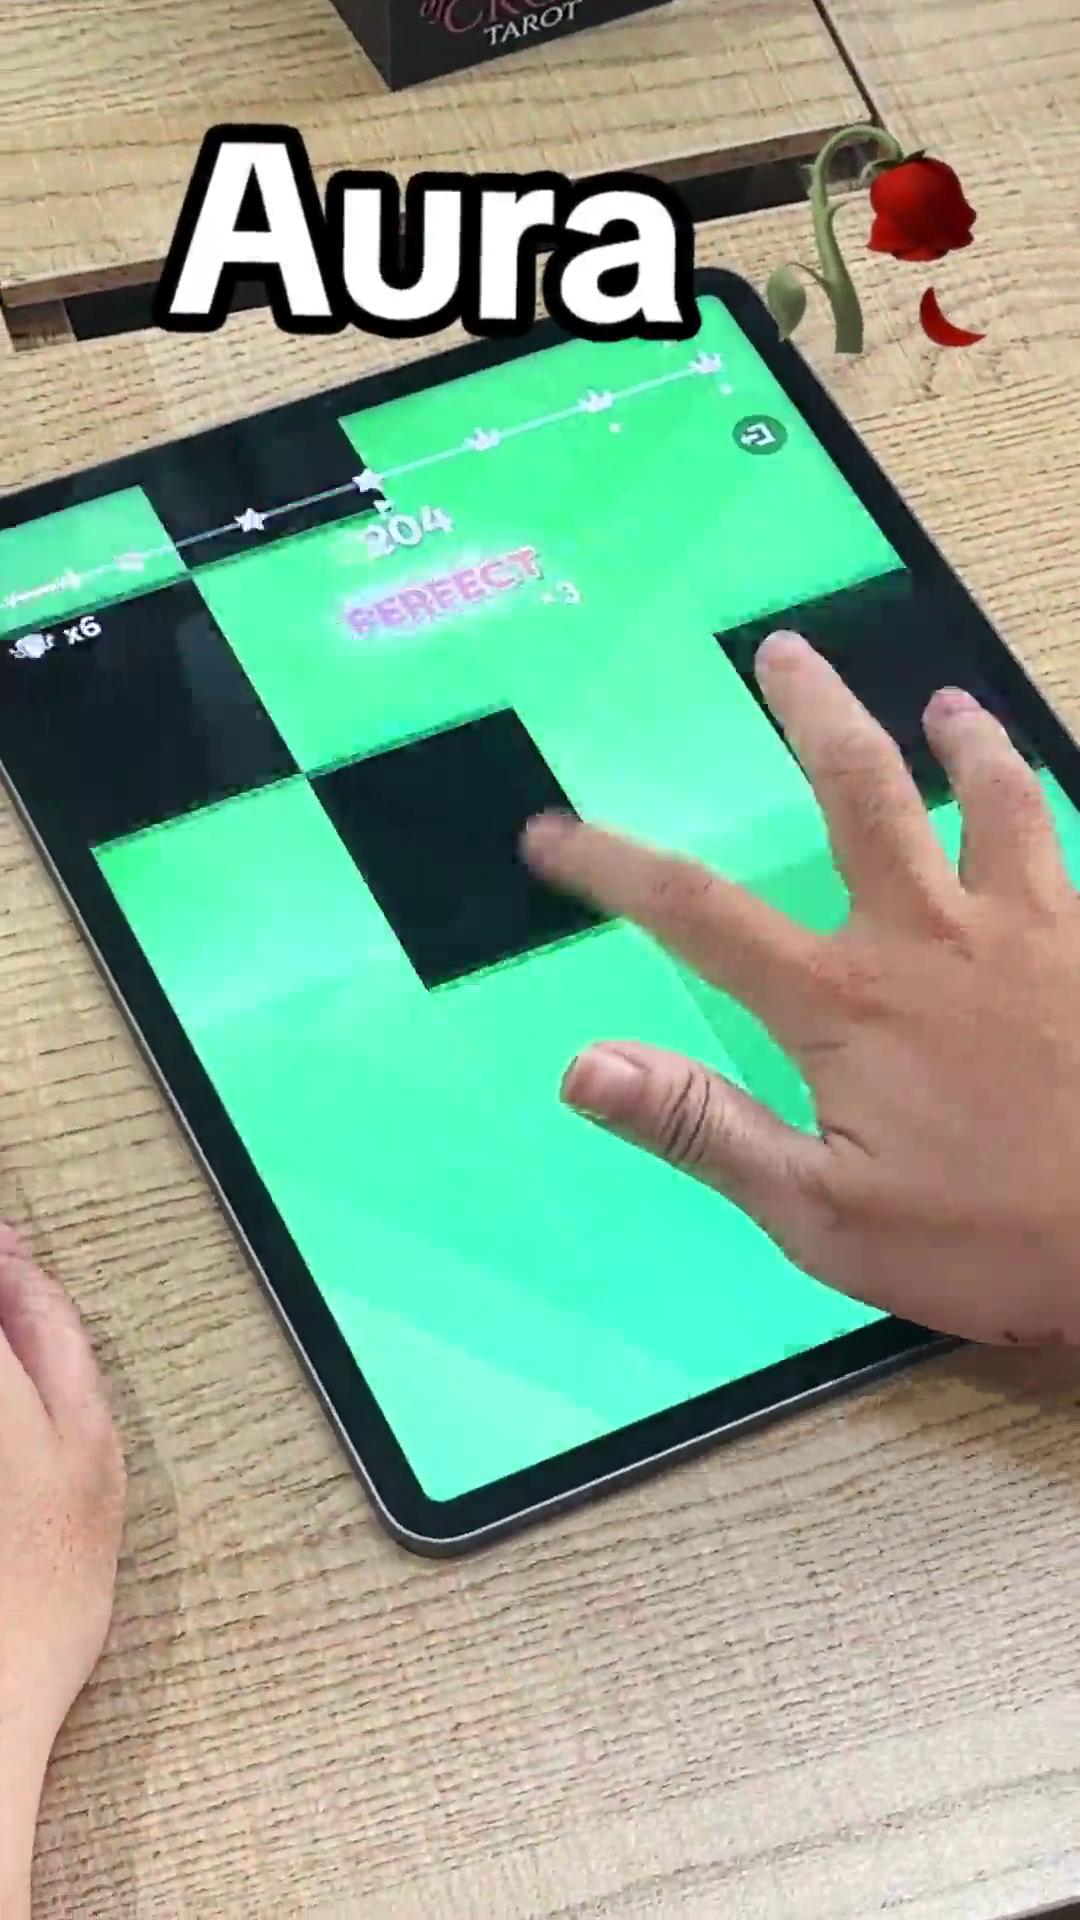 The fleet's largest row: video V2, 36,658,420 window impressions across 282,756 placements — 56.1% of every placement the game records — at just 130 impressions per placement. 35 seconds, iOS listing, first seen 2026-04-15. It is the newest asset on the iOS side and appears in exactly one instance.
Two listings, two machines
iOS 1443446174 | Android com.youmusic.magictiles | |
|---|---|---|
| Ad instances | 8 | 22 |
| Distinct videos | 6 | 11 |
| Distinct playables | 0 | 4 |
| Window impressions | 59,268,498 (30.0%) | 138,573,288 (70.0%) |
| Placements | 452,400 (89.8%) | 51,611 (10.2%) |
| Impr/placement (aggregate) | 131 | 2,685 |
| Impr/placement (median) | 131 | 3,626 |
| Impr/placement range | 129 – 156 (1.21x) | 790 – 7,005 (8.86x) |
| Average row age | 283 days | 72 days |
| Oldest asset | 443 days (2025-06-02) | 178 days (2026-02-22) |
| Newest asset first seen | 2026-04-15 | 2026-08-08 |
| Still live | 6 / 8 | 11 / 22 |
| Asset durations used | 23s, 27s, 30s, 30s, 35s, 35s | 24s to 54s plus 3 pure playables |
| Rows carrying ad copy | 0 / 8 | 21 / 22 |
Read that table twice. Almost every row is a contrast, and several are total.
Zero of the six iOS videos carry a playable. All four playables in the account are on Android. Zero iOS rows have any ad copy recorded; twenty-one of twenty-two Android rows do. The iOS side's newest asset first appeared 2026-04-15 — four months before this pull — while Android shipped one on 2026-08-08.
These are not variations on a strategy. They are different strategies, executed by what may well be different teams, against the same game.
The single most important consequence for anyone analysing this title: the fleet-wide impressions-per-placement figure is 393. That number describes neither side. It is the arithmetic of dividing one group's numerator by another group's denominator, and it is what you get if you profile Magic Tiles 3 without splitting by store listing first.
The full fleet, with fingerprints
V1–V17 label the seventeen distinct videos; P1–P4 label the four distinct playables. Both are ordered by the total window impressions of the rows they appear in.
| # | Impressions | Placements | Impr/plc | First seen | Last seen | Dur | Video | Playable | Listing |
|---|---|---|---|---|---|---|---|---|---|
| 1 | 36,658,420 | 282,756 | 130 | 2026-04-15 | live | 35s | V2 | — | iOS |
| 2 | 19,538,193 | 4,585 | 4,261 | 2026-06-09 | 2026-08-07 | 30s | V3 | — | Android |
| 3 | 14,546,030 | 11,242 | 1,294 | 2026-08-07 | live | 54s | V4 | — | Android |
| 4 | 14,357,644 | 2,756 | 5,210 | 2026-06-09 | 2026-08-07 | 54s | V1 | — | Android |
| 5 | 13,001,835 | 3,265 | 3,982 | 2026-06-09 | 2026-08-07 | 54s | V1 | — | Android |
| 6 | 12,578,062 | 2,689 | 4,678 | 2026-06-09 | 2026-08-07 | 54s | V1 | — | Android |
| 7 | 10,013,534 | 3,993 | 2,508 | 2026-05-10 | live | 35s | V5 | — | Android |
| 8 | 9,336,886 | 2,082 | 4,485 | 2026-06-09 | 2026-08-06 | 30s | V3 | — | Android |
| 9 | 7,569,256 | 58,620 | 129 | 2025-10-05 | 2026-08-17 | 27s | V6 | — | iOS |
| 10 | 5,605,149 | 1,208 | 4,640 | 2026-05-23 | 2026-08-05 | — | none | P1 | Android |
| 11 | 4,449,393 | 862 | 5,162 | 2026-02-22 | live | 30s | V11 | — | Android |
| 12 | 4,361,996 | 856 | 5,096 | 2026-05-09 | live | 24s | V7 | P1 | Android |
| 13 | 3,967,316 | 29,600 | 134 | 2025-06-25 | live | 23s | V9 | — | iOS |
| 14 | 3,614,568 | 631 | 5,728 | 2026-05-24 | 2026-08-05 | 45s | V8 | P3 | Android |
| 15 | 3,553,227 | 3,937 | 903 | 2026-08-06 | live | 45s | V12 | P2 | Android |
| 16 | 3,488,222 | 1,448 | 2,409 | 2026-05-10 | live | 24s | V7 | P2 | Android |
| 17 | 2,913,951 | 416 | 7,005 | 2026-04-10 | 2026-08-17 | 28s | V13 | — | Android |
| 18 | 2,842,857 | 2,190 | 1,298 | 2026-08-08 | live | 30s | V10 | — | Android |
| 19 | 2,596,278 | 19,230 | 135 | 2026-03-24 | live | 35s | V14 | — | iOS |
| 20 | 2,580,662 | 19,717 | 131 | 2025-09-05 | live | 30s | V15 | — | iOS |
| 21 | 2,482,402 | 563 | 4,409 | 2026-05-12 | 2026-08-05 | 45s | V8 | — | Android |
| 22 | 2,334,925 | 714 | 3,270 | 2026-05-15 | live | — | none | P3 | Android |
| 23 | 2,261,117 | 1,680 | 1,346 | 2026-08-07 | 2026-08-17 | 30s | V10 | — | Android |
| 24 | 2,242,266 | 14,395 | 156 | 2026-03-26 | live | 30s | V16 | — | iOS |
| 25 | 2,141,101 | 1,443 | 1,484 | 2026-05-10 | live | 35s | V5 | P4 | Android |
| 26 | 1,892,114 | 2,394 | 790 | 2026-08-07 | 2026-08-18 | 54s | V4 | — | Android |
| 27 | 1,829,284 | 1,373 | 1,332 | 2026-05-22 | live | 45s | V17 | P3 | Android |
| 28 | 1,828,806 | 13,898 | 132 | 2025-06-02 | live | 23s | V9 | — | iOS |
| 29 | 1,825,494 | 14,184 | 129 | 2025-10-02 | 2026-08-17 | 27s | V6 | — | iOS |
| 30 | 1,430,798 | 1,284 | 1,114 | 2026-05-08 | live | — | none | P2 | Android |
| Total | 197,841,786 | 504,011 | 393 | — | — | — | 17 videos | 4 playables | — |
Read the Video column rather than the row numbers. V1 occupies three rows, V3 two, V4 two, V5 two, V6 two, V7 two, V8 two, V9 two, V10 two — nine of the seventeen videos appear more than once. Eight appear exactly once.
The reuse is real but shallow: 1.8 instances per video. For contrast, the Grand Games teardown pulled on the same date found Block Out! running 7.5 instances per video off four video files. Amanotes is not running a permutation machine. It is running a conventional pipeline that occasionally ships the same file twice.
 Video V9 — 23 seconds, first seen 2025-06-25 and still running after 420 days, at 134 impressions per placement. It appears in two rows. Three iOS assets have now passed 340 days.
The iOS machine: six videos, 443 days, and a 1.21x band
| Video | Duration | Rows | Impressions | Impr/plc | First seen | Last seen | Days |
|---|---|---|---|---|---|---|---|
| V2 | 35s | 1 | 36,658,420 | 130 | 2026-04-15 | live | 126 |
| V6 | 27s | 2 | 9,394,750 | 129 | 2025-10-02 | 2026-08-17 | 319 |
| V9 | 23s | 2 | 5,796,122 | 133 | 2025-06-02 | live | 443 |
| V14 | 35s | 1 | 2,596,278 | 135 | 2026-03-24 | live | 148 |
| V15 | 30s | 1 | 2,580,662 | 131 | 2025-09-05 | live | 348 |
| V16 | 30s | 1 | 2,242,266 | 156 | 2026-03-26 | live | 146 |
| Total | — | 8 | 59,268,498 | 131 | — | — | 283 avg |
Every impressions-per-placement value falls between 129 and 156 — a 1.21x spread across six videos that differ by 20x in volume and by 317 days in age. For reference, the tightest fleet previously measured in this series ran at 1.07x. This is in the same territory.
A band that tight means the buy is completely undifferentiated at the placement level. Every iOS asset is being fed into the same inventory at the same density. What varies is only how many placements each one wins: 282,756 for V2, 13,898 for the 443-day veteran.
A finding from an earlier version of this article does not survive fingerprinting. That version reported the iOS side using "exactly four durations in perfectly matched pairs — two assets at each of 23s, 27s, 30s and 35s" and read the symmetry as evidence of a fixed production spec. That symmetry was an artefact of counting rows. At asset level the six videos run 23s, 27s, 30s, 30s, 35s, 35s — the 23-second and 27-second files each simply appear twice. There are two 30s and two 35s videos, but only one file at 23s and one at 27s. The pattern is ordinary, and the inference built on it was wrong.
Two of the eight iOS rows died on 2026-08-17. They are both instances of video V6, which had run 319 days. On a listing where nothing had been retired in over a year, one video disappearing two days before the pull date is the first sign of movement on the iOS side.
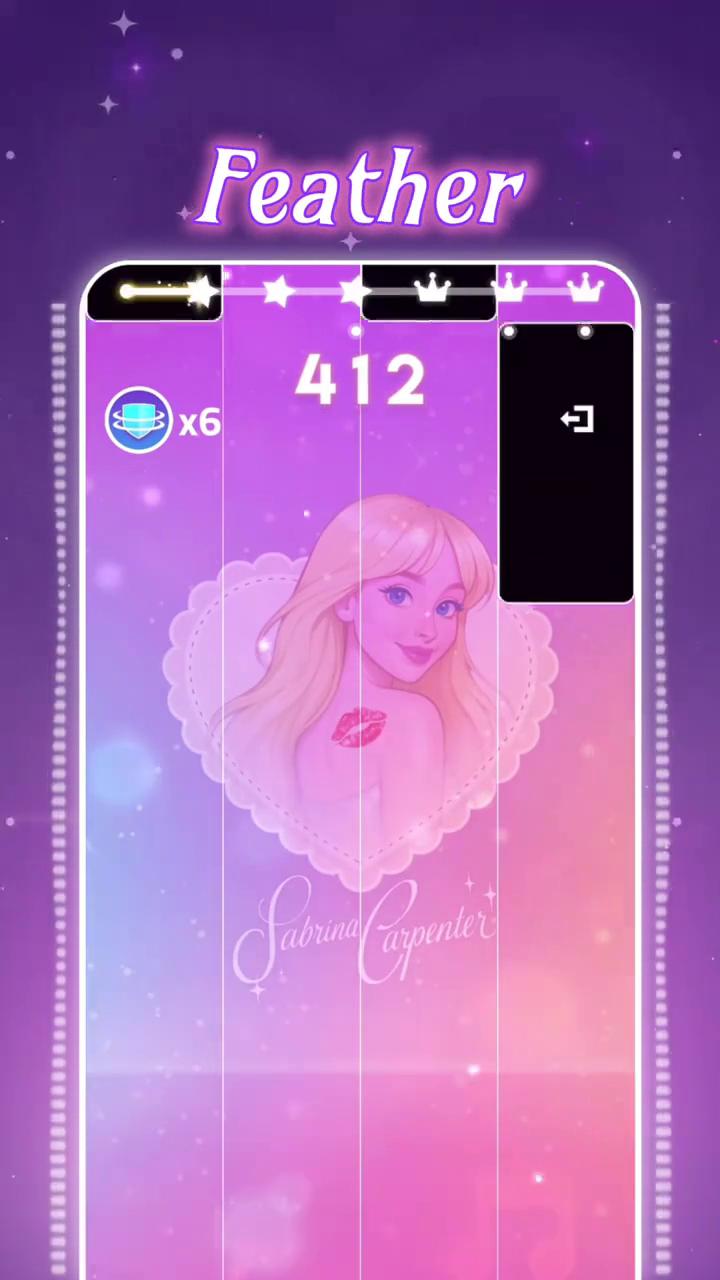 Video V6 — 27 seconds, the second-largest iOS asset at 9,394,750 window impressions across two rows, first seen 2025-10-02 and retired 2026-08-17 after 319 days. The only iOS retirement in the dataset.
The Android machine: eleven videos, four playables, and a churn cycle
Twenty-two rows, eleven videos, four playables, eleven rows retired, average row age 72 days, delivery rates from 790 to 7,005. Nothing about this side resembles the other.
The clearest way to see it is by cohort, counted in files rather than rows:
| Cohort | Rows | Distinct assets | Window impressions | Share | Still live (rows) |
|---|---|---|---|---|---|
| 2025 (all iOS) | 5 | 4 videos | 17,771,474 | 9.0% | 3 |
| 2026-02-22 (Android) | 1 | 1 video | 4,449,393 | 2.2% | 1 |
| 2026-03 (iOS) | 2 | 2 videos | 4,838,544 | 2.4% | 2 |
| 2026-04 (1 iOS, 1 Android) | 2 | 2 videos | 39,572,371 | 20.0% | 1 |
| 2026-05 (Android) | 10 | 5 videos + 4 playables | 37,342,215 | 18.9% | 7 |
| 2026-06-09 (Android) | 5 | 2 videos | 68,812,620 | 34.8% | 0 |
| 2026-08-06 to 08-08 (Android) | 5 | 3 videos | 25,095,345 | 12.7% | 3 |
The 2026-06-09 cohort is the single most productive thing this account has run — 34.8% of window impressions from five rows. Counted as files it is two videos: a 54-second file in three rows and a 30-second file in two. Every row is now dead.
The 2026-05 cohort is the volume backbone of the live Android side: ten rows resolving to five videos and all four of the account's playables, seven rows still running.
Note also that the Android side did not exist in a meaningful way before 2026-02-22. Every 2025-era row in this dataset is on iOS. Amanotes appears to have opened a distinct Android advertising operation in February 2026 and scaled it from May onward — while leaving the iOS buy untouched.
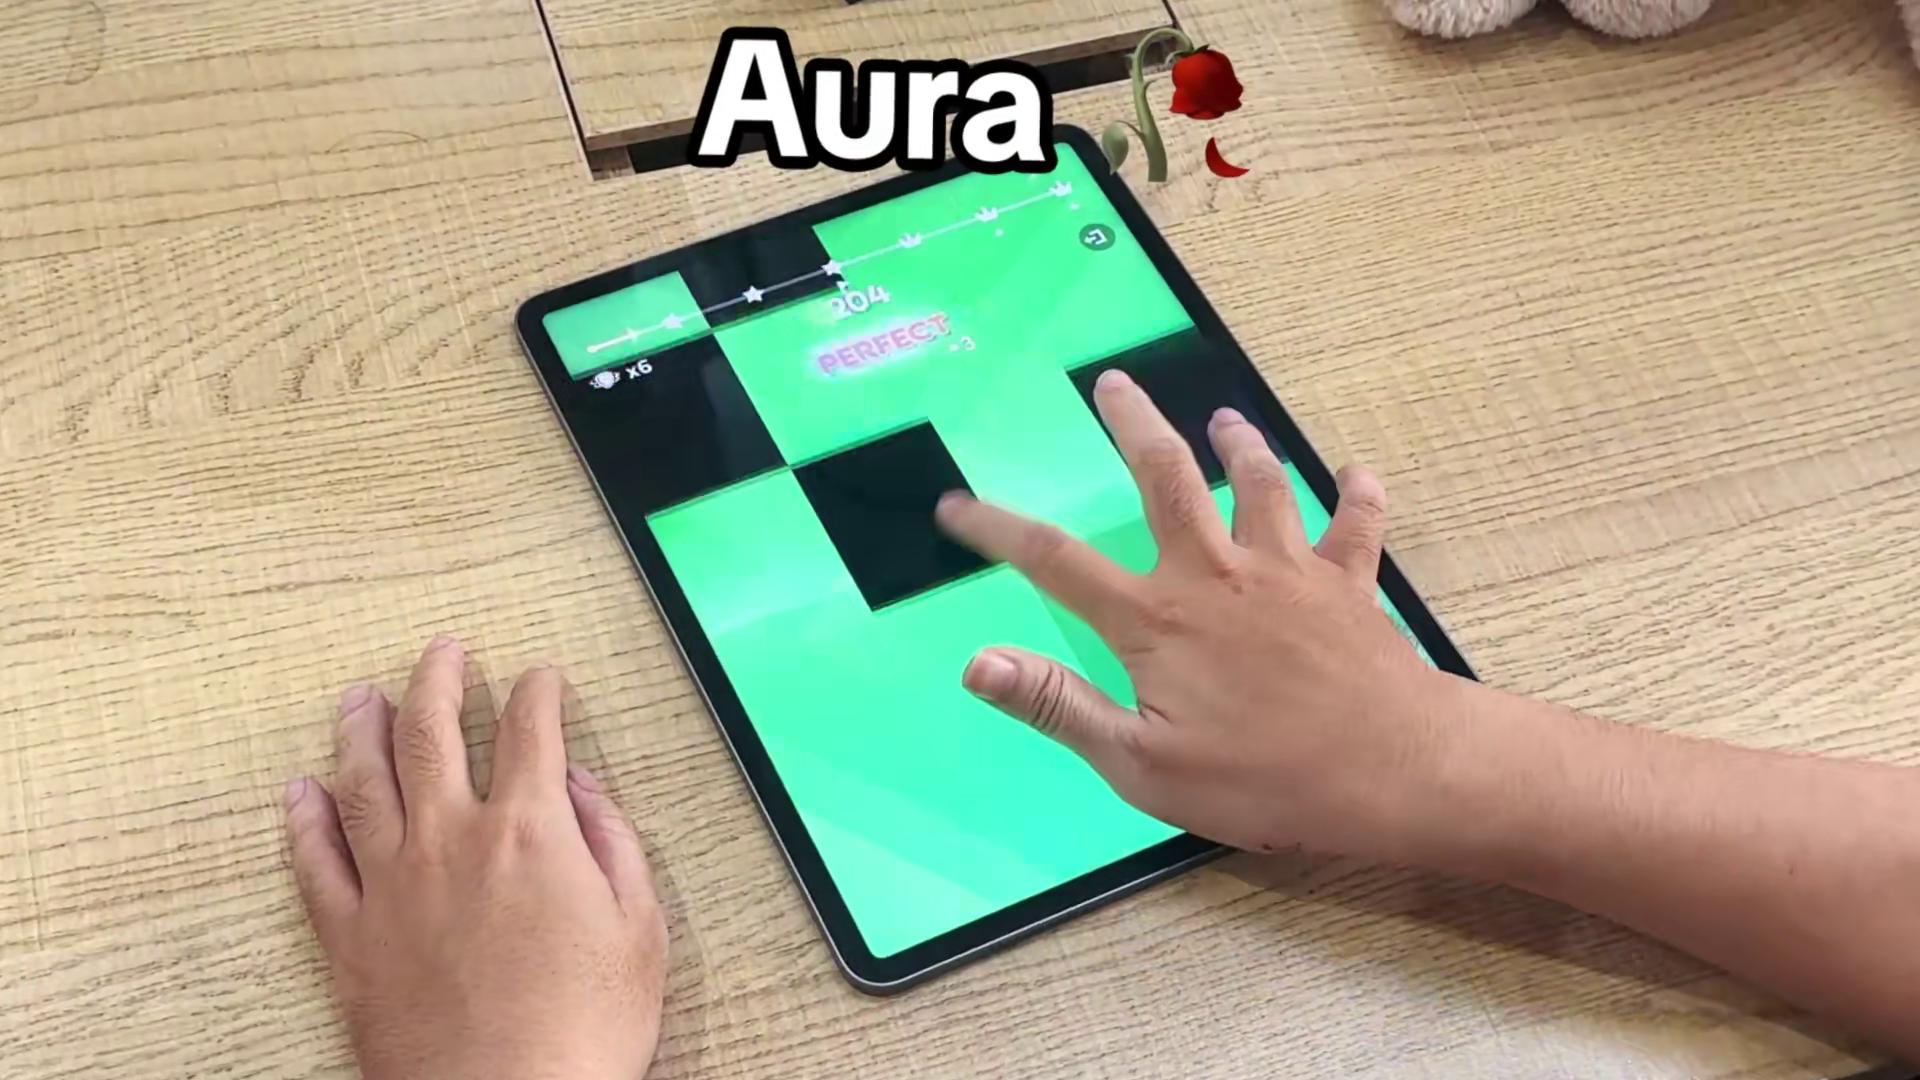 Video V5 — 35 seconds, first seen 2026-05-10, appearing in two rows totalling 12,154,635 window impressions, one of them paired with playable P4. The largest surviving asset from the May Android cohort.
The August swap: four assets out, three in
This is the event that defines the account's current state, and it is considerably smaller than a row count suggests.
Retired 2026-08-05 to 2026-08-07 — eight rows, but four assets:
| Asset | Type | Rows | Window impressions | Stop dates | Copy line |
|---|---|---|---|---|---|
| V1 | 54s video | 3 | 39,937,541 | 2026-08-07 | "Top 1 mobile music game" ×2, "Many viral hits…" ×1 |
| V3 | 30s video | 2 | 28,875,079 | 2026-08-06, 2026-08-07 | "Many viral hits…", "Top 1 mobile music game" |
| V8 | 45s video | 2 | 6,096,970 | 2026-08-05 | "Magic Tiles 3 – The Ultimate Piano Gam…" |
| P1 | playable | 1 | 5,605,149 | 2026-08-05 | "Magic Tiles 3 – The Ultimate Piano Gam…" |
| Total | — | 8 | 80,514,739 (40.7%) | — | — |
Launched 2026-08-06 to 2026-08-08 — five rows, three videos:
| Asset | Type | Rows | Window impressions | Status | Copy line |
|---|---|---|---|---|---|
| V4 | 54s video | 2 | 16,438,144 | 1 live, 1 dead 2026-08-18 | "Top 1 mobile music game" |
| V10 | 30s video | 2 | 5,103,974 | 1 live, 1 dead 2026-08-17 | "Top 1 mobile music game", "Many viral hits…" |
| V12 | 45s video | 1 | 3,553,227 | live | "Magic Tiles 3 – The Ultimate Piano Gam…" |
| Total | — | 5 | 25,095,345 (12.7%) | 3 rows live | — |
So the honest description of the event is: Amanotes retired three videos and one playable, and replaced them with three videos. The playable was not replaced. Forty percent of window impressions went out; twelve percent came back in — though the replacements had only 12–14 days inside the window, so that gap is not a like-for-like comparison and will not be until the next full window.
And then two of the three new videos immediately lost a row each — V10's second instance died 2026-08-17 after ten days, V4's second died 2026-08-18 after eleven. On the Android listing, Amanotes appears to give an instance roughly ten days to prove itself. On the iOS listing, assets run for over a year without review. Same game, same publisher, same month.
 Video V4 — 54 seconds, first seen 2026-08-07, the largest asset in the replacement cohort at 16,438,144 window impressions across two rows. It runs the "Top 1 mobile music game" copy line, the same message as two of the rows retired the day before. Its second row was already dead by 2026-08-18.
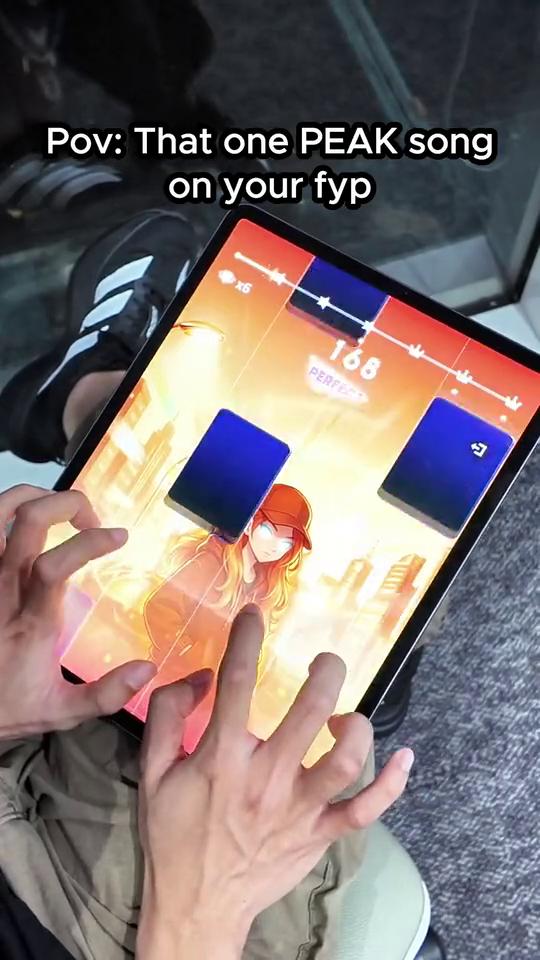 Video V1 — 54 seconds, the largest single asset in the account at 39,937,541 window impressions. It ran in three rows from 2026-06-09 and all three stopped on 2026-08-07. What looked like "three creatives retired together" is one file being switched off.
The copy lab: five messages, and the one that never got a sequel
Magic Tiles 3 is the only fleet in this teardown series where ad copy text is recorded on most rows, which makes a genuine message-level analysis possible.
Twenty-one of the thirty rows carry copy — all twenty-one on the Android listing. Five distinct lines appear.
| Ad copy line | Rows | Distinct assets | Window impressions | Share | Impr/plc | First used |
|---|---|---|---|---|---|---|
| (none recorded) | 9 | 7 | 62,182,449 | 31.4% | 138 | 2025-06-02 |
| "Top 1 mobile music game" | 6 | 4 | 55,977,366 | 28.3% | 2,361 | 2026-06-09 |
| "Magic Tiles 3 – The Ultimate Piano Gam…" | 11 | 8 | 40,855,206 | 20.7% | 2,371 | 2026-05-08 |
| "Many viral hits: No Batidão, Trillium Hardtekk, 67, Montagem Miau,…" | 3 | 3 | 34,377,372 | 17.4% | 3,839 | 2026-06-09 |
| "Your turn! #MagicTiles3 #RushE #challenge #musicgame #rhythmgame #gaming" | 1 | 1 | 4,449,393 | 2.2% | 5,162 | 2026-02-22 |
Two of these strings arrive truncated in the source data — "Magic Tiles 3 – The Ultimate Piano Gam…" cuts off mid-word, and the "Many viral hits" line ends in an ellipsis present in the record. They are reproduced as captured, not reconstructed. Copy lines are advertiser claims: "Top 1 mobile music game" is reported here as ad text, not as a ranking fact.
The four written messages are strategically distinct in a way worth naming:
"Magic Tiles 3 – The Ultimate Piano Game" is a category claim. It names the product and the genre. Eleven rows across eight assets, and eight rows still running. It is the workhorse: broad, safe, and evidently good enough to keep.
"Top 1 mobile music game" is a rank claim. Six rows but only four assets, carrying 28.3% of window impressions. It arrived with the June cohort and was carried straight into the August cohort. It is the message Amanotes reaches for when it wants scale.
"Many viral hits: No Batidão, Trillium Hardtekk, 67, Montagem Miau,…" is a content claim — and it is the most interesting line in the account. Rather than describing the game, it lists the songs in it. Three rows, three separate assets, delivering at 3,839 impressions per placement, the highest of any multi-asset message group and 63% above the "Top 1" line. All three rows are now dead.
"Your turn! #MagicTiles3 #RushE #challenge #musicgame #rhythmgame #gaming" is a UGC-format line. One row, one asset, first seen 2026-02-22 — the oldest asset on the Android listing — delivering at 5,162 impressions per placement, the highest rate of any row in the fleet carrying copy. It is still live after 178 days and has never been repeated.
That last one is the most actionable observation in the dataset. A single hashtag-styled asset, the very first Android video Amanotes launched, has the best delivery density in the fleet and has survived six months without a single follow-up. Either it reaches a placement type Amanotes cannot scale, or the format was tested once and forgotten.
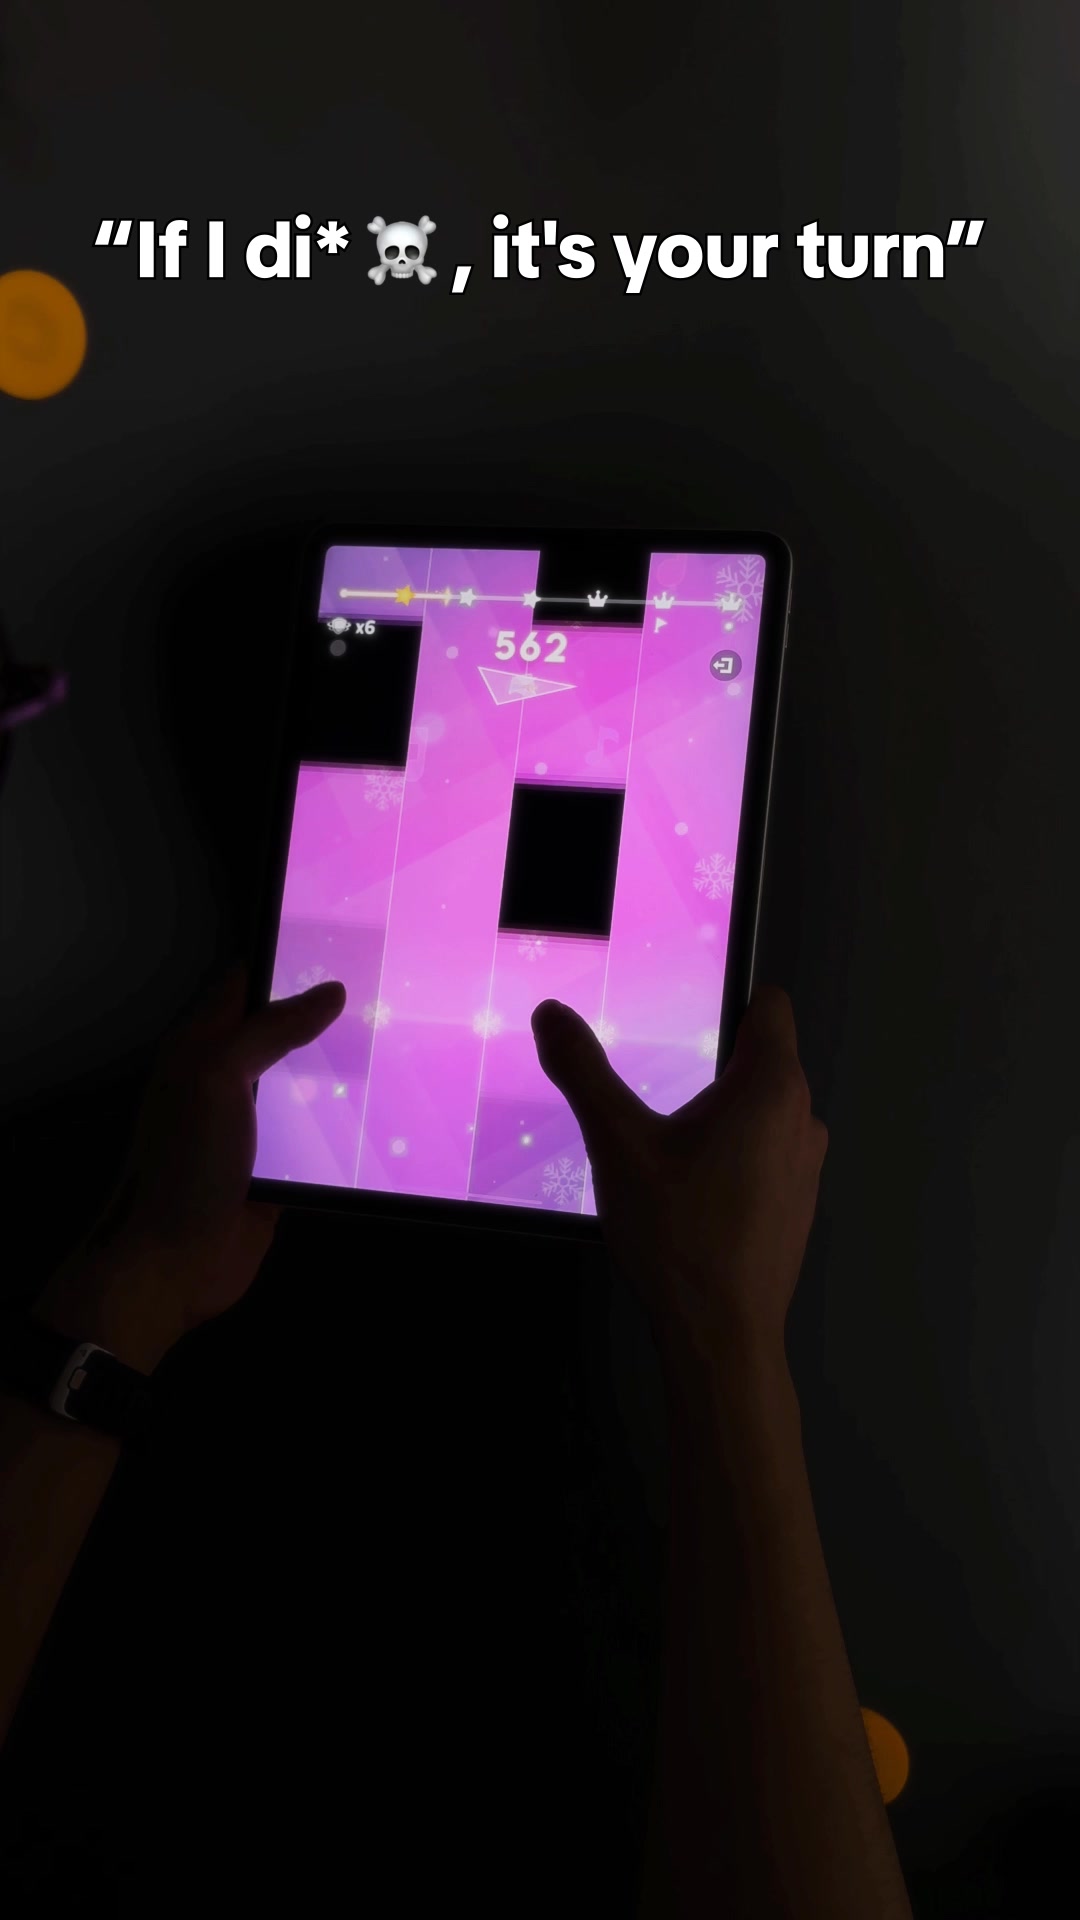 Video V11 — the account's highest-density row: 4,449,393 window impressions from just 862 placements, 5,162 per placement. First seen 2026-02-22 running the copy "Your turn! #MagicTiles3 #RushE #challenge #musicgame #rhythmgame #gaming", still live after 178 days, and never repeated in any other instance.
The message survives, the asset does not
Line up the June cohort against the August cohort by copy line and the swap becomes legible as a deliberate refresh rather than a strategy change.
| Copy line | 2026-06-09 cohort (all retired) | 2026-08 cohort (replacements) |
|---|---|---|
| "Top 1 mobile music game" | 3 rows / 2 assets | 3 rows / 2 assets |
| "Many viral hits: No Batidão…" | 2 rows / 2 assets | 1 row / 1 asset |
| "Magic Tiles 3 – The Ultimate Piano Gam…" | 0 | 1 row / 1 asset |
Amanotes retired two video files and replaced them with three, carrying essentially the same messages in near-identical proportions. The rank-claim to content-claim ratio went from 3:2 to 3:1, with a category-claim asset added.
This is creative fatigue management, not repositioning. The team's read appears to be that the June footage stopped performing, not that the messages stopped working. New video, same script.
It also tells you how Amanotes runs the Android side: the unit of iteration is the asset, and the unit of strategy is the copy line. Copy lines persist across cohorts for months; individual instances get as little as ten days.
 Video V10 — 30 seconds, appearing in two rows first seen 2026-08-07 and 2026-08-08. It carries the "Top 1 mobile music game" line, now on its fourth distinct asset. One of its two rows was dead by 2026-08-17, after ten days.
Duration: two different rulebooks, measured at asset level
| Listing | Asset durations observed | Distinct videos |
|---|---|---|
iOS 1443446174 | 23s, 27s, 30s, 30s, 35s, 35s | 6 |
Android com.youmusic.magictiles | 24s, 28s, 30s, 30s, 35s, 45s, 45s, 54s, 54s + 3 pure playables | 11 |
The iOS side uses nothing longer than 35 seconds, across six files, and has not added one since 2026-04-15. The Android side spans 24 to 54 seconds across eleven files plus three pure-playable rows, and shipped its newest on 2026-08-08.
The 54-second format is worth isolating: both 54-second videos in the account are Android, and both are cohort-scale assets — V1 (the June cohort, three rows, now retired) and V4 (the August cohort, two rows). It is the format Amanotes reaches for when it pushes volume, and the only length that has never appeared on iOS.
Playables: four files, all on one listing
Nine rows carry a playable, and those nine resolve to four distinct playable files. All four are on the Android listing. Zero are on iOS. Three rows are pure playable with no video at all.
| Playable | Rows | Window impressions | Share | Pure-playable rows | First seen |
|---|---|---|---|---|---|
| P1 | 2 | 9,967,145 | 5.0% | 1 | 2026-05-09 |
| P2 | 3 | 8,472,247 | 4.3% | 1 | 2026-05-08 |
| P3 | 3 | 7,778,777 | 3.9% | 1 | 2026-05-15 |
| P4 | 1 | 2,141,101 | 1.1% | 0 | 2026-05-10 |
Every one of the four was first seen between 2026-05-08 and 2026-05-15 — a single eight-day burst of playable production, never repeated. Nothing since. And when P1's pure-playable row was retired on 2026-08-05 in the August sweep, no replacement playable appeared.
Set against the other US fleets measured on the same date, counted as files:
| Publisher | Distinct playables | Notes |
|---|---|---|
| Block Out! (Grand Games) | 18 | Playable treated as the unit of production |
| Vita Mahjong (Vita Studio) | 8 | Attached broadly across the video fleet |
| Magic Tiles 3 (Amanotes) | 4 | All four on Android; none on iOS; all built in one week in May |
| Gossip Harbor (Microfun) | 1 | One shared playable across the fleet |
For a rhythm game the absence of playables on iOS is a real strategic choice, not an oversight. Magic Tiles 3's core loop — tapping falling tiles in time with a song — is close to ideal playable material. Amanotes clearly knows this, because it built four of them for Android. It simply does not run them against the iOS listing at all.
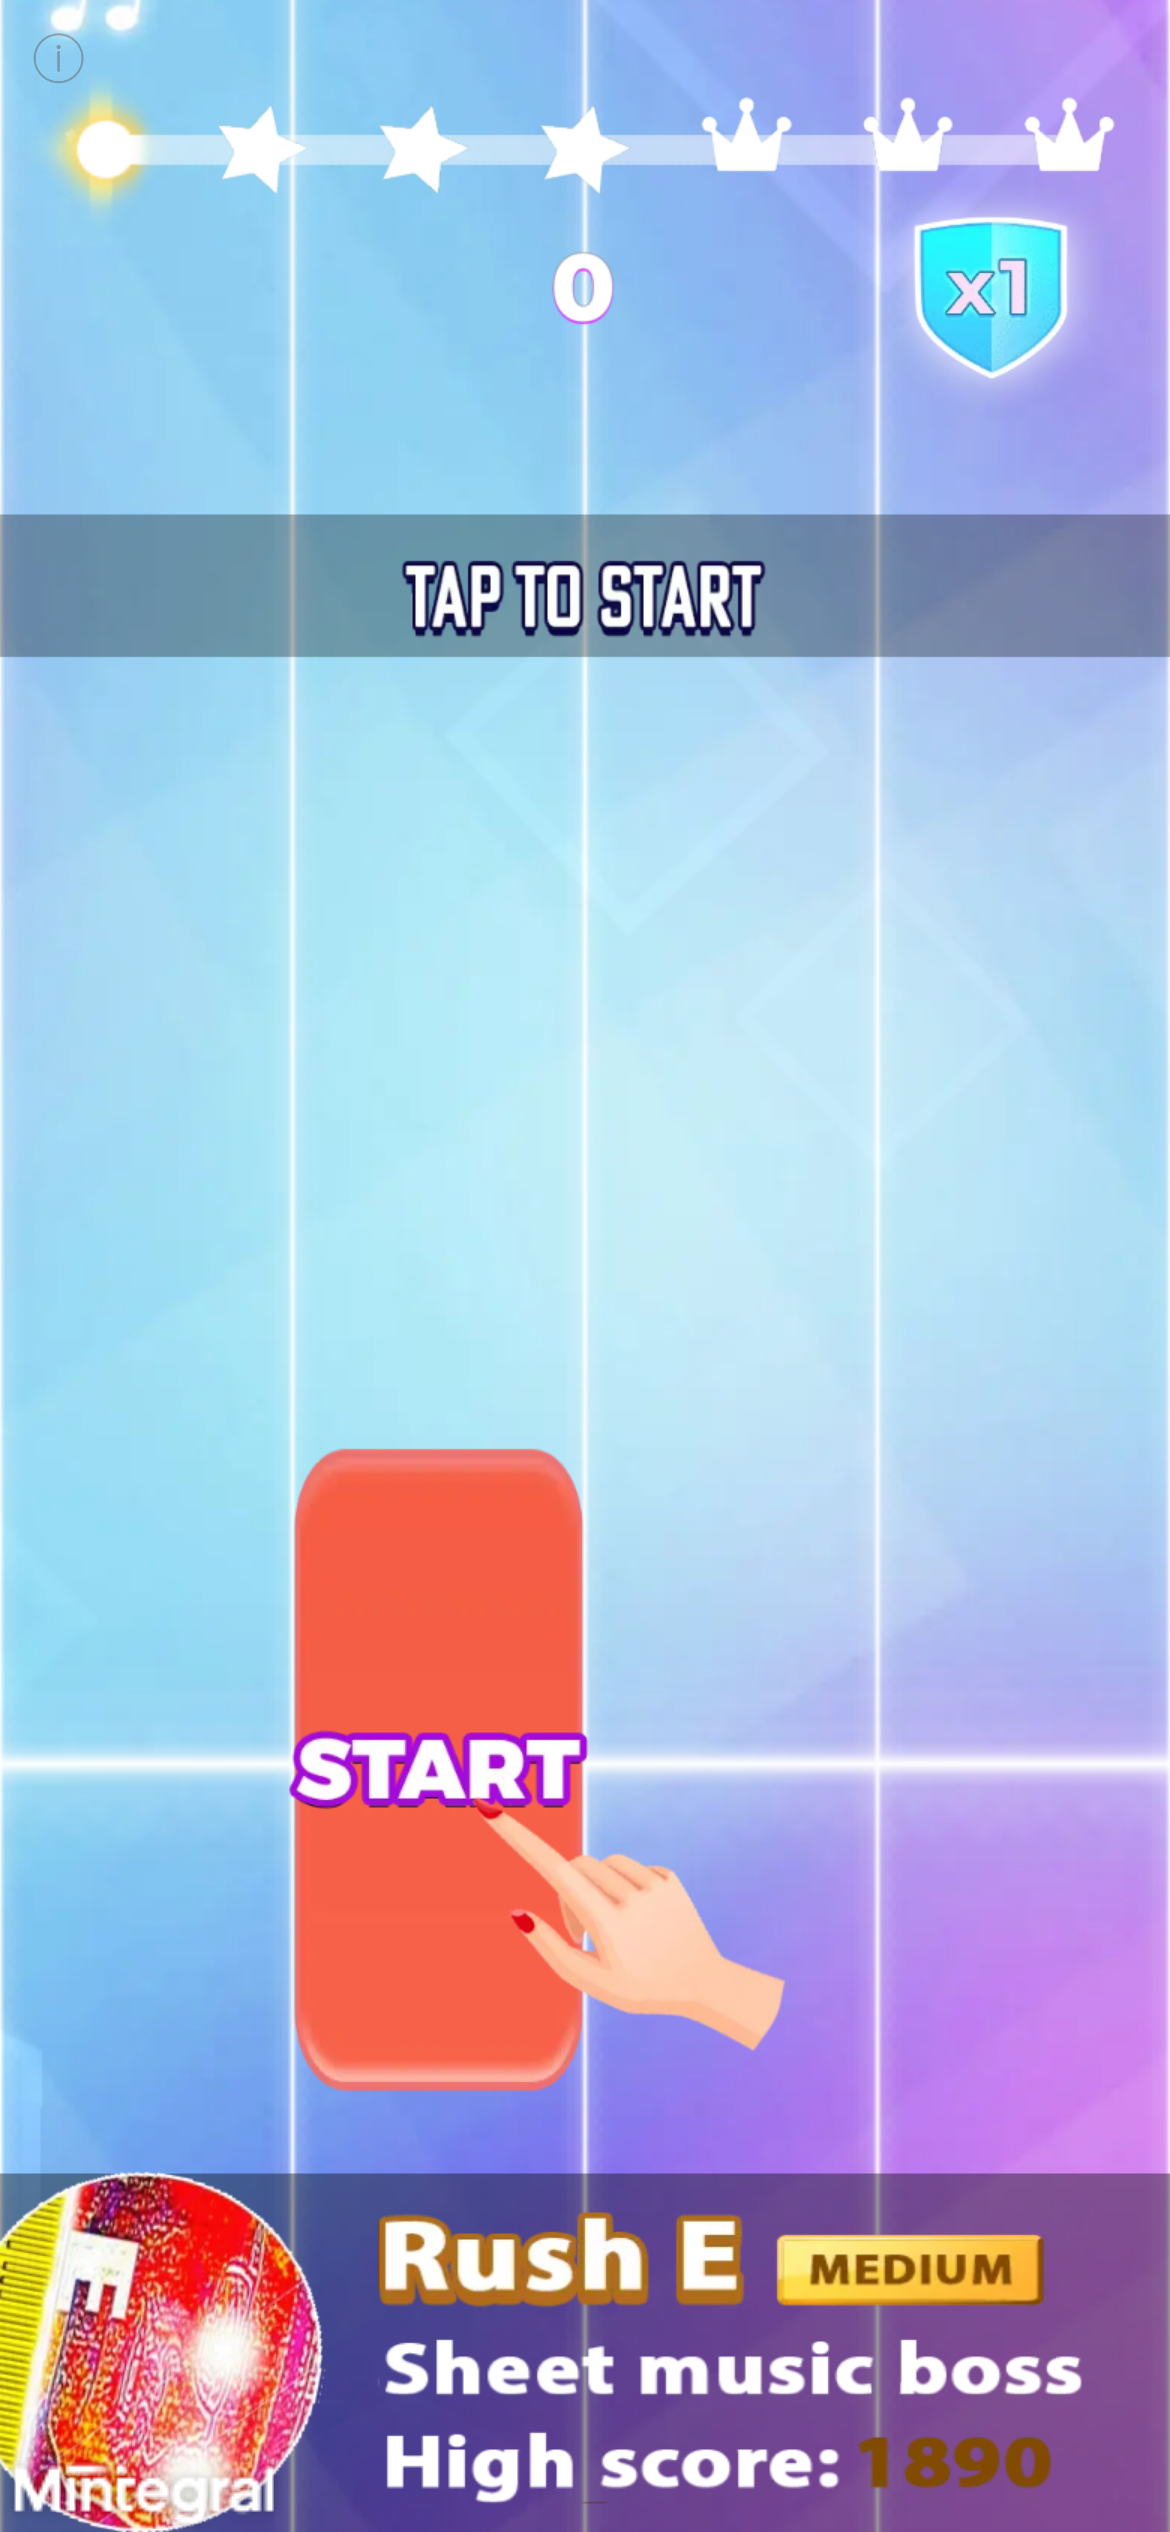 Playable P1 — one of only four playable files in the account, all four built between 2026-05-08 and 2026-05-15. Its standalone row carried 5,605,149 window impressions at 4,640 per placement and was retired 2026-08-05 with no replacement.
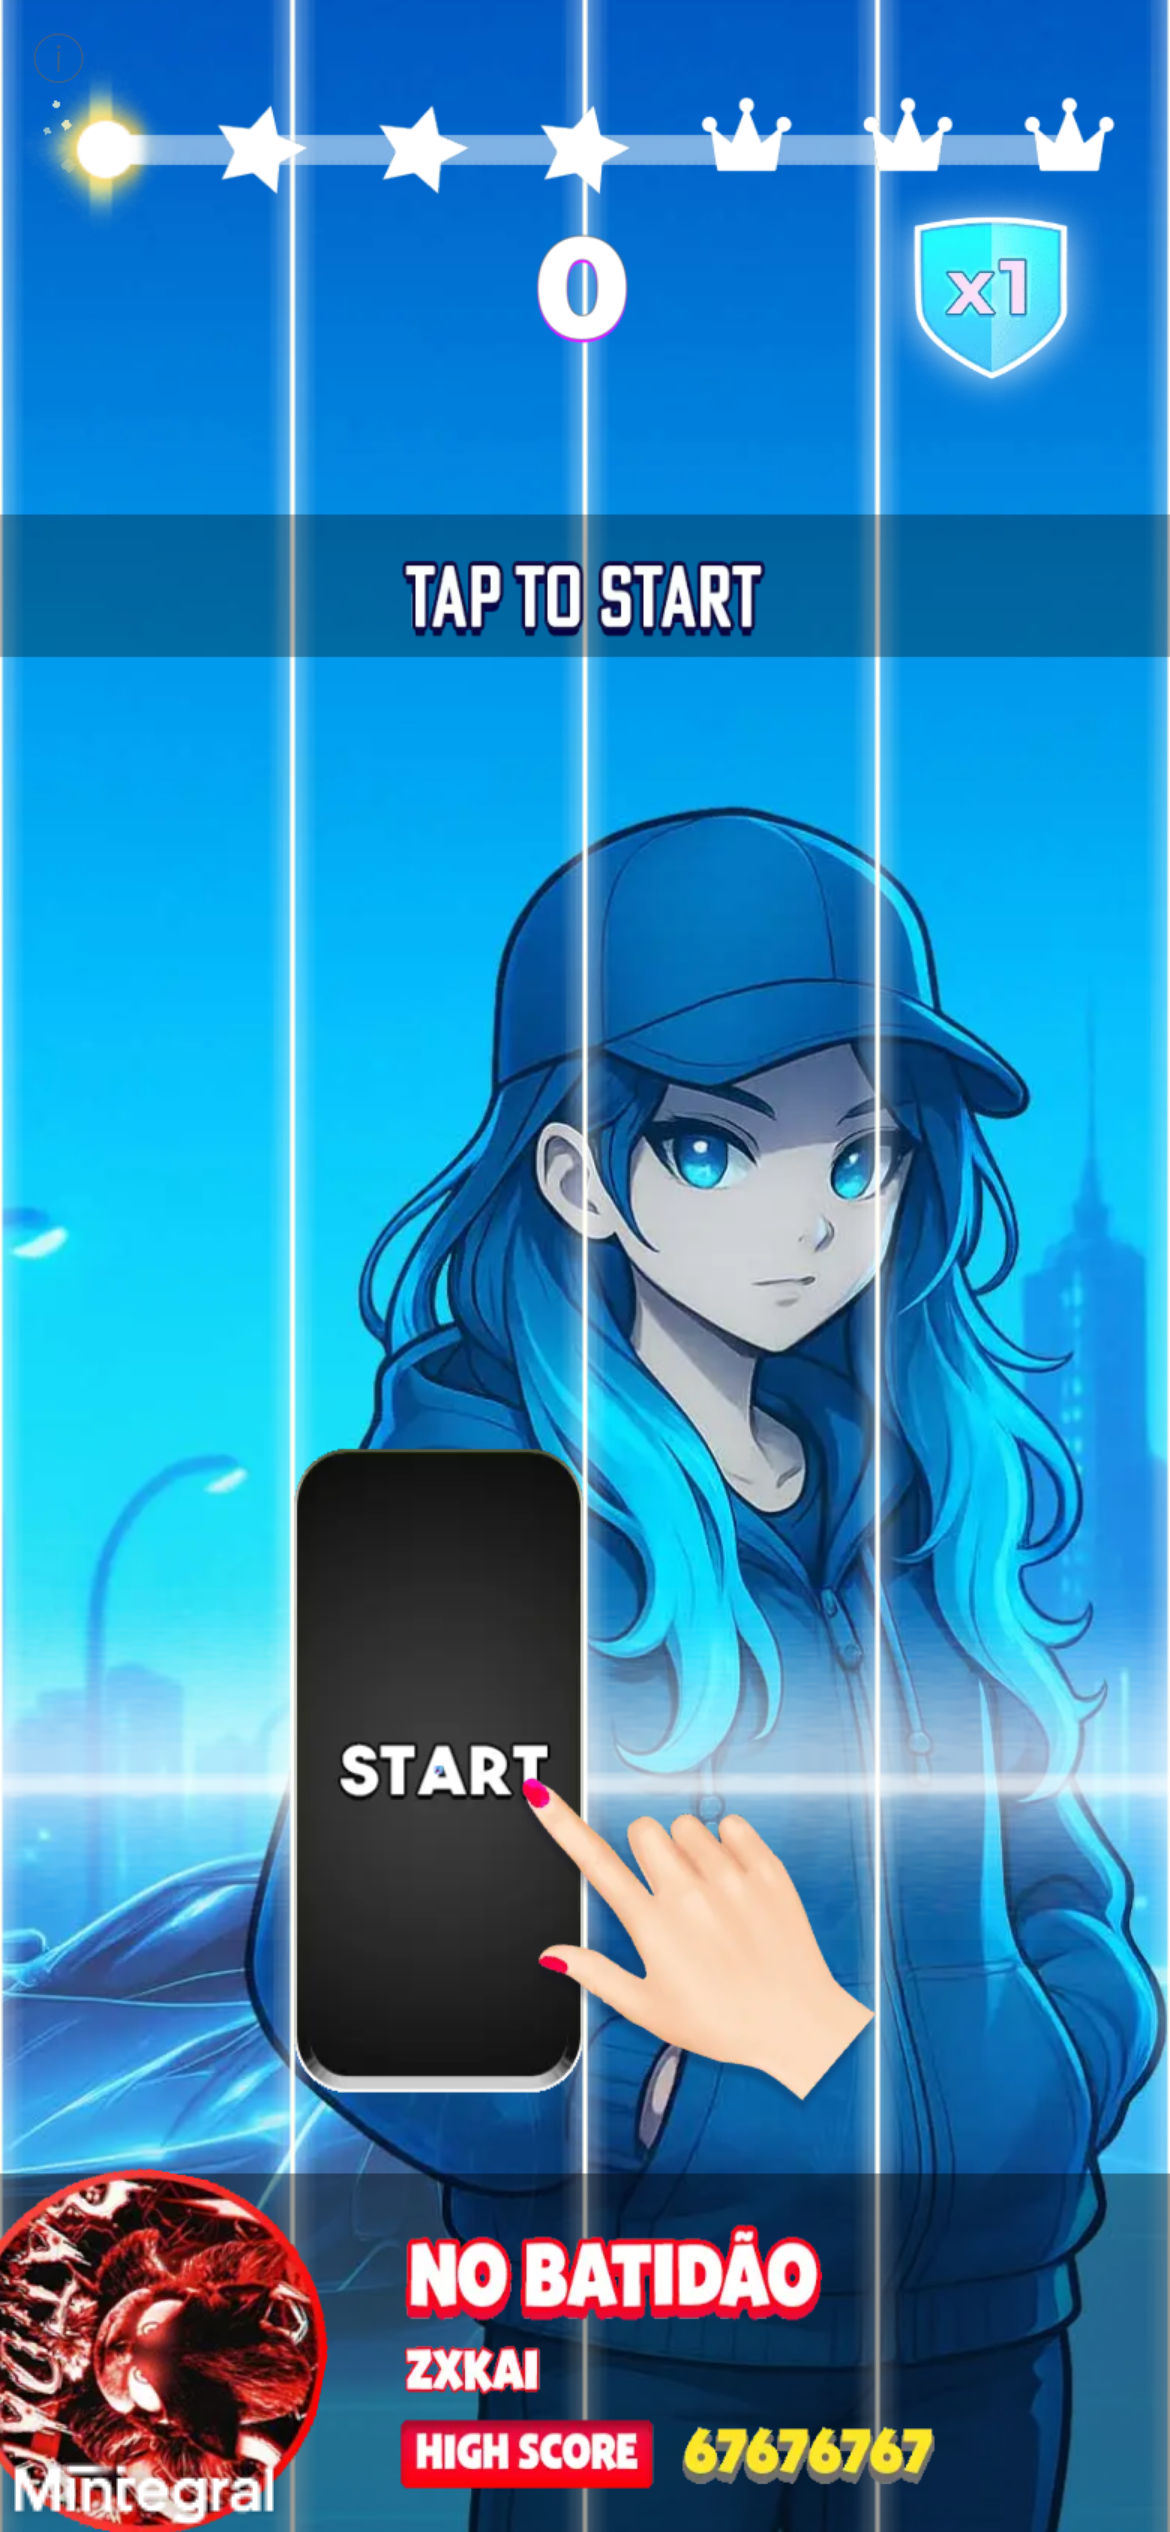 Playable P2 — appears in three rows including one pure-playable instance, 8,472,247 window impressions. It is attached to the newest August video V12, making it the only playable to survive into the replacement cohort.
What a -34.95% decline looks like from inside the ad account
The download figure fell from 984,669 to 640,575 — a loss of 344,094. Here is what the creative data does and does not say about it.
What it supports: the account is not idle. Amanotes retired four assets and launched three inside four days in early August. A team watching a title decline and doing nothing does not move 40.7% of its window impression base in that time.
What it does not support: any causal claim in either direction. The retirement wave began 2026-08-05, which is late in or after the ranking period the -34.95% describes. The swap is at least as likely to be a response to declining performance as a cause of it, and creative data cannot distinguish those.
What the two-machine structure adds is a genuine hypothesis. The iOS listing takes 89.8% of the fleet's placements and has not been meaningfully changed in over a year: six videos, no playables, no copy, uniform delivery, and no new asset since 2026-04-15. The chart row that fell 34.95% is the iOS listing (productId 1443446174). Meanwhile all the experimentation, all the copy testing, all four playables and all the churn are happening on Android.
If the declining side of the business is the side nobody is iterating on, that is worth saying plainly. The retirement of video V6 from the iOS listing on 2026-08-17 — the first movement on that side in the dataset — may be the beginning of a response.
The number to watch is whether any new asset appears on the iOS listing. Every 2025-era row in this account is iOS; every asset launched since 2026-04-15 is Android. If Amanotes ships a new iOS video in September, the iOS buy has been re-opened. If it does not, the six-video iOS machine is being run to exhaustion.
What transfers to your UA program
If you benchmark competitors by creative count: stop counting rows. Thirty rows here is twenty-one files, and the two most consequential events in the account — a "five-creative cohort" and an "eight-creative retirement" — are two videos and four assets respectively. Fingerprint before you count, and report instances, videos and playables as three separate numbers.
If you run media buying: the copy-line-versus-asset distinction is the transferable idea. Amanotes treats messages as durable and footage as disposable — "Top 1 mobile music game" has now carried four distinct assets across two cohorts and three months, while individual instances get as little as ten days. That separation lets you refresh creative without re-litigating positioning every cycle, and it makes fatigue diagnosable: if a message stops working across three consecutive assets, the message is the problem.
If you run competitive intelligence: the fleet-level average is actively misleading here. Magic Tiles 3's aggregate 393 impressions per placement describes neither the iOS group (131) nor the Android group (2,685). Split by store ID before computing anything, and check whether playable presence, copy presence and duration policy differ across listings. In this account all three do, completely.
If you run creative production: the highest-density asset in this fleet is a single hashtag-styled video from February that has never been repeated, running at 5,162 impressions per placement. Audit your own account for assets like that — high-efficiency one-offs that were tested once and never followed up. They are the cheapest experiments available because someone already ran them.
If you are competing with Amanotes: the exploitable structure is the iOS listing's inertia. Six videos, average row age 283 days, nothing longer than 35 seconds, no playables, no copy, a 1.21x delivery band that has not moved, and no new asset in four months.
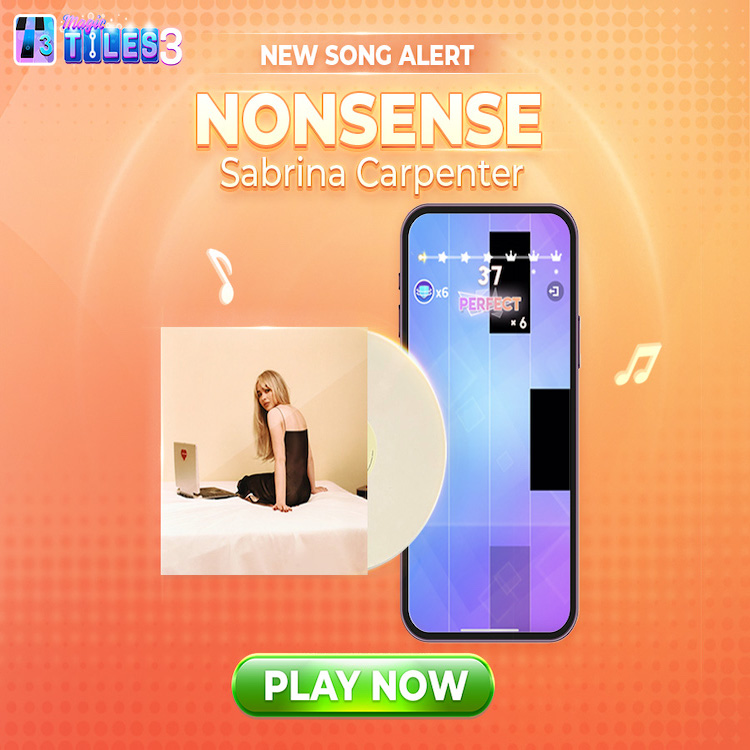 Video V9's older row — first seen 2025-06-02, still live after 443 days, 1,828,806 window impressions at 132 per placement. The oldest asset in the account, on a listing that has added nothing new since April.
A falsifiable prediction
Prediction: by 2026-11-30, at least one more of the three August Android videos will have lost all its rows, and no new video will have appeared on the iOS listing (1443446174).
The basis for the first half: two of the three already lost a row each within eleven days of launch, and the Android listing has retired eleven of twenty-two rows to date. A third of the August cohort disappearing over three months is the conservative call.
The basis for the second half: the most recent iOS asset in the entire dataset was first seen 2026-04-15. All twenty rows launched since that date are Android. Four months of zero iOS production is a settled pattern, not a gap.
The interesting failure mode is a new iOS video appearing. That would mean Amanotes has re-opened the buy that carries 89.8% of the game's placements and 100% of its charted downloads — a much bigger signal than anything happening on the Android side.
How to reproduce this teardown
- Fingerprint before you count anything. Group rows by
videoFpandplayHtmlFpbefore reporting a creative count, a duration distribution or a launch cadence. On this account, row-level counting turned two videos into "five creatives" and four assets into "eight retirements", and produced a duration symmetry that does not exist. - Establish the impression window before computing any rate. Query the same rows with an explicit
start_date/end_dateand compare against the default. Here the default is identical to2026-07-20 → 2026-08-19, which means the figures are a rolling 30-day sum and not a lifetime total. - Check window exposure per row before reporting any daily rate. Sixteen of these thirty rows were only partially inside the window — five started late, thirteen stopped early — and those sixteen carry 59.6% of impressions. When that share is high, a daily rate measures exposure rather than intensity, and the right move is to drop the metric rather than caveat it.
- Split by store ID before computing any aggregate. This account's fleet-wide 393 impressions per placement is not a property of anything real.
- Compare listings on structural attributes, not just volume. Playable presence, copy presence, duration ceiling, average age and retirement rate all diverge here. When four or five structural attributes differ across listings, you are looking at two operations.
- Extract and group the
describefield, then count assets per line. Grouping by copy revealed that the August cohort reproduced the June cohort's messages in near-identical proportions — which reframes the swap from a strategy change to a fatigue refresh. - Cross-tabulate retirement dates against launch dates, at asset level. Eight row-retirements and five row-launches inside four days is one coordinated event involving seven files, not thirteen.
Methodology and data notes
- Source: AdMapix creative search and ranking APIs, queried 2026-08-19, country filter
US, sorted by impressions descending, sample size 30 rows. - Measurement window (important): the
impressionfield returned by this API is a rolling 30-day figure, not a lifetime total. All impression figures in this article cover 2026-07-20 → 2026-08-19. This was verified rather than assumed: an explicit query for those dates returns values identical to the default query row for row, while a 90-day window returns substantially larger values for the same rows. Wording such as "carries", "delivers" and "runs at" refers to this window throughout. - No daily rates are reported. Sixteen of the thirty rows were only partially exposed to the window — five first seen after 2026-07-20, thirteen last seen before 2026-08-19 — and those sixteen account for 59.6% of window impressions. Any impressions-per-day figure would conflate delivery intensity with window exposure, so the metric is omitted rather than caveated. An earlier version of this article reported daily rates computed against full asset age; those figures were wrong and have been removed.
- "Ad instance" means one row of delivery data with its own impression count, placement count and date range. It is not a distinct production. "Distinct video" and "distinct playable" are counts of unique
videoFpandplayHtmlFpvalues. Impressions are reported per row and are not double-counted, so impression sums are unaffected by collapsing rows onto assets; counts of assets, duration distributions and production cadences are affected and are reported at asset level throughout. - Entity resolution: the download-chart row reports
productId1443446174, publisherAmanotes Pte. Ltd.,developerId804106424— matching the iOSappList[].idon 8 of the 30 rows. The remaining 22 carrycom.youmusic.magictiles, publisher stringAMANOTES PTE. LTD.,developerId1639401842. The publisher strings differ only in letter case. Both are treated as the same product and reported separately throughout. No figure in this article was joined on app name. - "Days" is the span between the first-observed timestamp and either the pull date (for live rows) or the last-observed date (for retired rows). Seventeen rows showed a last-observed date equal to the pull date and are treated as live.
- Ad copy is taken verbatim from the
describefield. Two strings arrive truncated in the source and are reproduced as captured. Copy lines are advertiser claims, not verified statements. - "Placements" (
showCnt) counts recorded creative appearances, not unique users or unique publishers. Impressions-per-placement is a distribution-shape indicator, not a frequency metric. - Impressions are third-party estimates, not publisher-reported figures and not spend. They support relative comparison and should not be converted to dollar figures.
- Download figures are US-region estimates for the current ranking period. The -34.95% is a period-over-period change against a prior-period figure of 984,669. It is not a user-loss, revenue, or engagement measure, and its period does not align with the 30-day impression window.
- Comparison figures for Block Out!, Vita Mahjong and Gossip Harbor come from teardowns pulled on the same date with the same fingerprint method.
- Store information is available on the App Store listing. Publisher information is available at amanotes.com.
- Coverage is limited to creatives observable through third-party ad monitoring.
Frequently Asked Questions
How many ads is Magic Tiles 3 running in the US?
Thirty measurable ad instances as of 2026-08-19, carrying 197,841,786 impressions in the 30-day window across 504,011 placements, of which seventeen rows were still live. Those thirty rows resolve to only seventeen distinct video files and four distinct playables — eight rows and six videos on the iOS listing (1443446174), twenty-two rows and fifteen files on the Android package (com.youmusic.magictiles).
Why do Magic Tiles 3's iOS and Android ads behave so differently? The iOS listing runs 6 videos at 131 impressions per placement in a 1.21x band, averaging 283 days old, with no playables and no ad copy, and has added nothing since 2026-04-15. The Android listing runs 11 videos and 4 playables at 2,685 impressions per placement in an 8.86x band, averaging 72 days old, with copy on 21 of 22 rows. They share no format convention, cadence or retirement policy — they are effectively two media plans against one game.
What is Magic Tiles 3's best-performing ad creative? By volume, a 35-second iOS video first seen 2026-04-15, carrying 36,658,420 window impressions across 282,756 placements — 18.5% of window impressions and 56.1% of all placements. By delivery density, a single Android video first seen 2026-02-22 running hashtag-styled UGC copy delivers 5,162 impressions per placement, the highest rate in the fleet, and has never been repeated in any other instance.
What happened to Magic Tiles 3's ads in August 2026? Between 2026-08-05 and 2026-08-07 Amanotes retired eight rows carrying 80,514,739 window impressions — 40.7% of the fleet — but those eight rows are only four assets: three videos and one playable. Five rows launched 2026-08-06 to 2026-08-08, resolving to three videos. Two of the three replacements lost a row each within eleven days.
What ad copy does Magic Tiles 3 use? Four written lines appear, all on the Android listing: "Magic Tiles 3 – The Ultimate Piano Gam…" (11 rows across 8 assets, 20.7% of window impressions), "Top 1 mobile music game" (6 rows across 4 assets, 28.3%), "Many viral hits: No Batidão, Trillium Hardtekk, 67, Montagem Miau,…" (3 rows across 3 assets, 17.4%, and the highest-delivering multi-asset message at 3,839 impressions per placement), and one hashtag-styled UGC line on a single asset. The August replacement cohort reproduced the June cohort's messages in near-identical proportions.
Why did Magic Tiles 3's downloads fall 34.95%? US downloads fell from 984,669 to 640,575, a loss of 344,094 — the fifth-largest percentage decline among the 46 ranked games in the US top 250. The creative data does not establish a cause. It does show that the chart row describes the iOS listing, which takes 89.8% of the fleet's placements and has received no new asset since 2026-04-15, while all experimentation is happening on Android.
How long are Magic Tiles 3's ads? The two listings follow different rules. Measured as files rather than rows, iOS runs six videos at 23s, 27s, 30s, 30s, 35s and 35s — nothing longer than 35 seconds. Android runs eleven videos spanning 24 to 54 seconds plus three pure-playable rows. Both 54-second videos in the account are Android, and both were cohort-scale pushes.
Want to check whether a competitor's thirty creatives are actually thirty creatives? Asset fingerprints, per-row impressions, placement counts, store-listing IDs, ad copy text, playable attachment and first-seen/last-seen dates are all live in AdMapix, filterable by country, publisher and store ID. Create a free account to split any title in your category by listing and by asset, or see plans for full historical access.
Data source: AdMapix third-party ad intelligence estimates, United States, retrieved 2026-08-19. Impression figures are a rolling 30-day sum for the window 2026-07-20 → 2026-08-19 and are modelled estimates for comparative analysis, not publisher-reported. Ad copy is reproduced verbatim from creative records and represents advertiser claims. Figures change as new instances enter rotation. </content>
Related Reading
- Ad strategy teardowns (series index) — every teardown in the series, in publication order
- Mobile game ads guide: formats, examples and research — the format matrix, research workflow and KPI guardrails every teardown in this series applies
- Royal Smash! — 10.4B impressions built from zero in 47 days
- Meowdoku — the quiet machine — dual SKU, zero batching, zero sweeps
- Vita Mahjong — the metronome — one creative running 467 days
Use this article in your next research task
- Set the scope. Choose one app or brand, one country and one date window. Case-study figures refer to the historical sample dates in the article; this editorial update did not collect a new underlying campaign dataset.
- Inspect attributable records. Continue the research in AdMapix. For a case study, verify the developer, store and app ID before opening its creatives. For a workflow guide, start in the creative library and set the relevant network and market manually. A missing result means no match in that query, not no advertising.
- Write one testable hypothesis. Open matching examples and record the source, observation date, opening hook, mechanic or offer, and CTA. Change one variable in your own creative brief, then evaluate it with your own results.
Check the research methodology and compare context with the ad lifespan benchmarks. Repetition, estimated impressions and download trends do not establish ROAS, profit or causation. Current index coverage and access depend on the query and plan.
Continue researching Magic Tiles 3
Find matching apps, verify the developer and store, then inspect recent creatives.
Related Articles
Voodoo UA Playbook 2026: Paper.io 2 and Hole.io Are Not Being Advertised — They Are Being Harvested
A publisher-level teardown of Voodoo's four US chart titles. Paper.io 2, Hole.io, Castle Busters and Mob Control together carry 129 million impressions from 263 video assets — and produce 1.9 million monthly downloads on 7.2% of the window impressions a single competing puzzle title carries. Only 9.8% of Paper.io 2's impressions come from creative made in the last 90 days.
Bus Traffic Fever! Ad Strategy in 2026: One Asset Carrying 66% of a 3.0-Billion-Impression Fleet — and the Second Name Nobody Notices
A creative-level teardown of GOODROID's US user acquisition for Bus Traffic Fever!. Twenty-two ad instances carry 3,004,140,963 impressions, all still live after 139 days, and one asset alone carries 66.0%. The twenty-two instances resolve to just nine videos and eight playables. The title also runs under a second name — Bus Rush Fever! — on its Android listing, which is where most competitive analyses of this product go wrong.
Oakever Games UA Playbook 2026: 4.8 Billion Impressions, 1,320 Videos, and the Title That Spends Like a Winner but Doesn't Convert Like One
A publisher-level teardown of Oakever Games across Meowdoku!, Amaze GO! and Tile Explorer in the US. Nearly 2,500 measured ad instances carry 4.83 billion impressions off 1,320 distinct video assets. Amaze GO! carries the most impressions of the three and converts at a fifth of its siblings' rate — and the ad data also captures a live app rename, from Arrows GO! to Amaze GO!, in progress.