
Royal Smash! Ad Strategy in 2026: How Cypher Games Built a 1.06-Billion-Impression Fleet From Zero in 47 Days
A creative-level teardown of Cypher Games' US user acquisition for Royal Smash! - Physics Puzzle. Thirty ad instances carry 1,063,337,540 impressions, none existed before 2026-07-03, and thirteen launched on one day. But those thirty instances resolve to only twelve videos and nine playables — one 30-second video appears in five of them. Downloads rose 260.93%, and the Android listing takes 53.8% of placements for 11.7% of impressions.
Cypher Games' Royal Smash! - Physics Puzzle did not have an ad fleet seven weeks ago. On 2026-08-19 it has thirty measurable ad instances carrying 1,063,337,540 impressions in the US, and the oldest of them was first observed on 2026-07-03 — 47 days earlier. Twenty-nine of the thirty were still running on the pull date.
A Royal Smash! video observed under the AppLovin label is included in our AppLovin game ad examples.
Those thirty instances are not thirty pieces of production. Checking asset fingerprints, they resolve to twelve distinct video files and nine distinct playable end cards — and a single 30-second video appears in five separate instances.
US downloads for the title sit at 591,117 against 163,774 in the prior comparison period — a +260.93% change, the largest positive move on any game we found in the top 250 of the US download chart outside of two outliers.
Most teardowns in this series examine mature fleets: assets that have been running for a year, publishers protecting a champion creative, accounts nobody has cleaned out. This one is the opposite. This is what an ad account looks like in the seven weeks while it is taking off, and the build order is legible in a way a mature account's never is.
The single strangest thing in it: thirteen of the thirty instances were first observed on 2026-07-27. One day, 43% of the fleet — built from five new videos and one new playable.
What one row means here
Before any of the counts below, one definition has to be nailed down, because getting it wrong produces confidently false conclusions.
Each row returned by creative search is an ad instance: a distinct delivery record with its own impression count, placement count and date range. It is not automatically a distinct piece of production. Multiple instances routinely share the same underlying video, differing only in which playable end card is attached — or in nothing observable at all.
Checking asset fingerprints (videoFp and playHtmlFp) across the thirty instances returns:
| Count | |
|---|---|
| Ad instances | 30 |
| Distinct videos | 12 |
| Distinct playable end cards | 9 |
| Instances carrying a video | 21 |
| Instances with no video (playable or static) | 9 |
| Instances carrying a playable | 16 |
Impressions are reported per instance and are not double-counted, so every impression total in this article is unaffected by the distinction. What it changes is any claim about how many things Cypher Games made — and here that difference is nearly a third.
Executive summary (TL;DR)
- The entire fleet is 47 days old or younger. Earliest first-seen date across all thirty instances is 2026-07-03. Average age is 28.6 days. There is no legacy inventory here at all.
- Thirty instances, twenty-one assets. Twelve distinct videos and nine distinct playables. One 30-second video (
5bd973e2…) appears in five instances; another (76ae4ddb…) in four; a third in three. - Thirteen instances launched on 2026-07-27. That single cohort carries 365,969,662 impressions — 34.4% of everything. It is five new videos, one new playable, two recycled playables and one static image — not thirteen new files.
- Almost nothing has been switched off. 29 of 30 instances were live on 2026-08-19. The single exception ran twelve days and died on the exact day the 2026-07-27 salvo launched.
- The two store listings behave like two different media plans. Six instances resolve to the Android package and take 53.8% of all placements while delivering 11.7% of impressions. Median impressions-per-placement: 1,353 on the iOS listing versus 122 on Android — an 11.1x gap with zero overlap between the two groups.
- Thirty seconds is the house length — but it is seven files, not sixteen. Sixteen instances run exactly 30 seconds; they resolve to seven distinct videos. Only one instance is 15s, one is 45s, three are 60s.
- One playable is doing more work than any video. Playable
97800cb8…appears in four instances totalling 238,646,379 impressions — 22.4% of the fleet, more than any single video file. - Six early instances out-carry the thirteen-instance salvo. The 2026-07-03 to 2026-07-06 cohort delivers 421,134,848 window impressions against the 2026-07-27 salvo's 365,969,662, from less than half the rows. This article publishes no per-day rates: only 46.5% of window delivery comes from rows exposed to the full window, which is below the threshold at which a daily figure means anything.
All figures are AdMapix third-party estimates for the United States, pulled 2026-08-19. Methodology at the end.
Where Royal Smash! sits on the US charts
On the US download rankings, Royal Smash! - Physics Puzzle appears at position 156 with 591,117 downloads, published by Cypher Games (iOS app ID 6780891673, developer ID 2142247179).
| Metric | Value |
|---|---|
| US download rank | 156 |
| Downloads, current period | 591,117 |
| Downloads, prior period | 163,774 |
| Absolute change | +427,343 |
| Period-over-period change | +260.93% |
| Publisher | Cypher Games |
| iOS app ID | 6780891673 (developer ID 2142247179) |
| Android package | com.cyphergames.royalsmash (developer ID 175569991) |
That +260.93% is a period-over-period change in the ranking provider's download estimate, not a user-growth or revenue figure. It says the estimated download volume in the current window is 3.6x what it was in the previous window. It does not say anything about retention, spend efficiency, or whether any of those installs stuck.
What makes it worth a teardown is the coincidence of timing. The oldest creative in the entire account was first seen 2026-07-03. The download figure roughly quadrupled. Those two facts are almost certainly the same event described twice — and because the fleet is young enough to read end to end, we can see the shape of the buy that produced it.
For context on where that places the title, here is the surrounding neighbourhood of the US games chart at the pull date:
| Rank | Title | Downloads | Change | Publisher |
|---|---|---|---|---|
| 143 | Pixel Flow! | 622,046 | -19.29% | Loom Games |
| 148 | Mahjong Blast | 616,774 | +13.77% | Nebula Studio |
| 151 | Solitaire Associations Journey | 611,610 | -17.41% | Hitapps Games LTD |
| 155 | Among Us! | 595,911 | -34.49% | InnerSloth LLC |
| 156 | Royal Smash! - Physics Puzzle | 591,117 | +260.93% | Cypher Games |
| 159 | Tasty Travels: Merge Game | 585,825 | -3.31% | Century Games Pte. Ltd. |
| 160 | Royal Match | 585,174 | +18.44% | Dream Games |
Six of the seven titles around it are either shrinking or growing in the low double digits. Royal Smash! is the only one moving in triple digits.
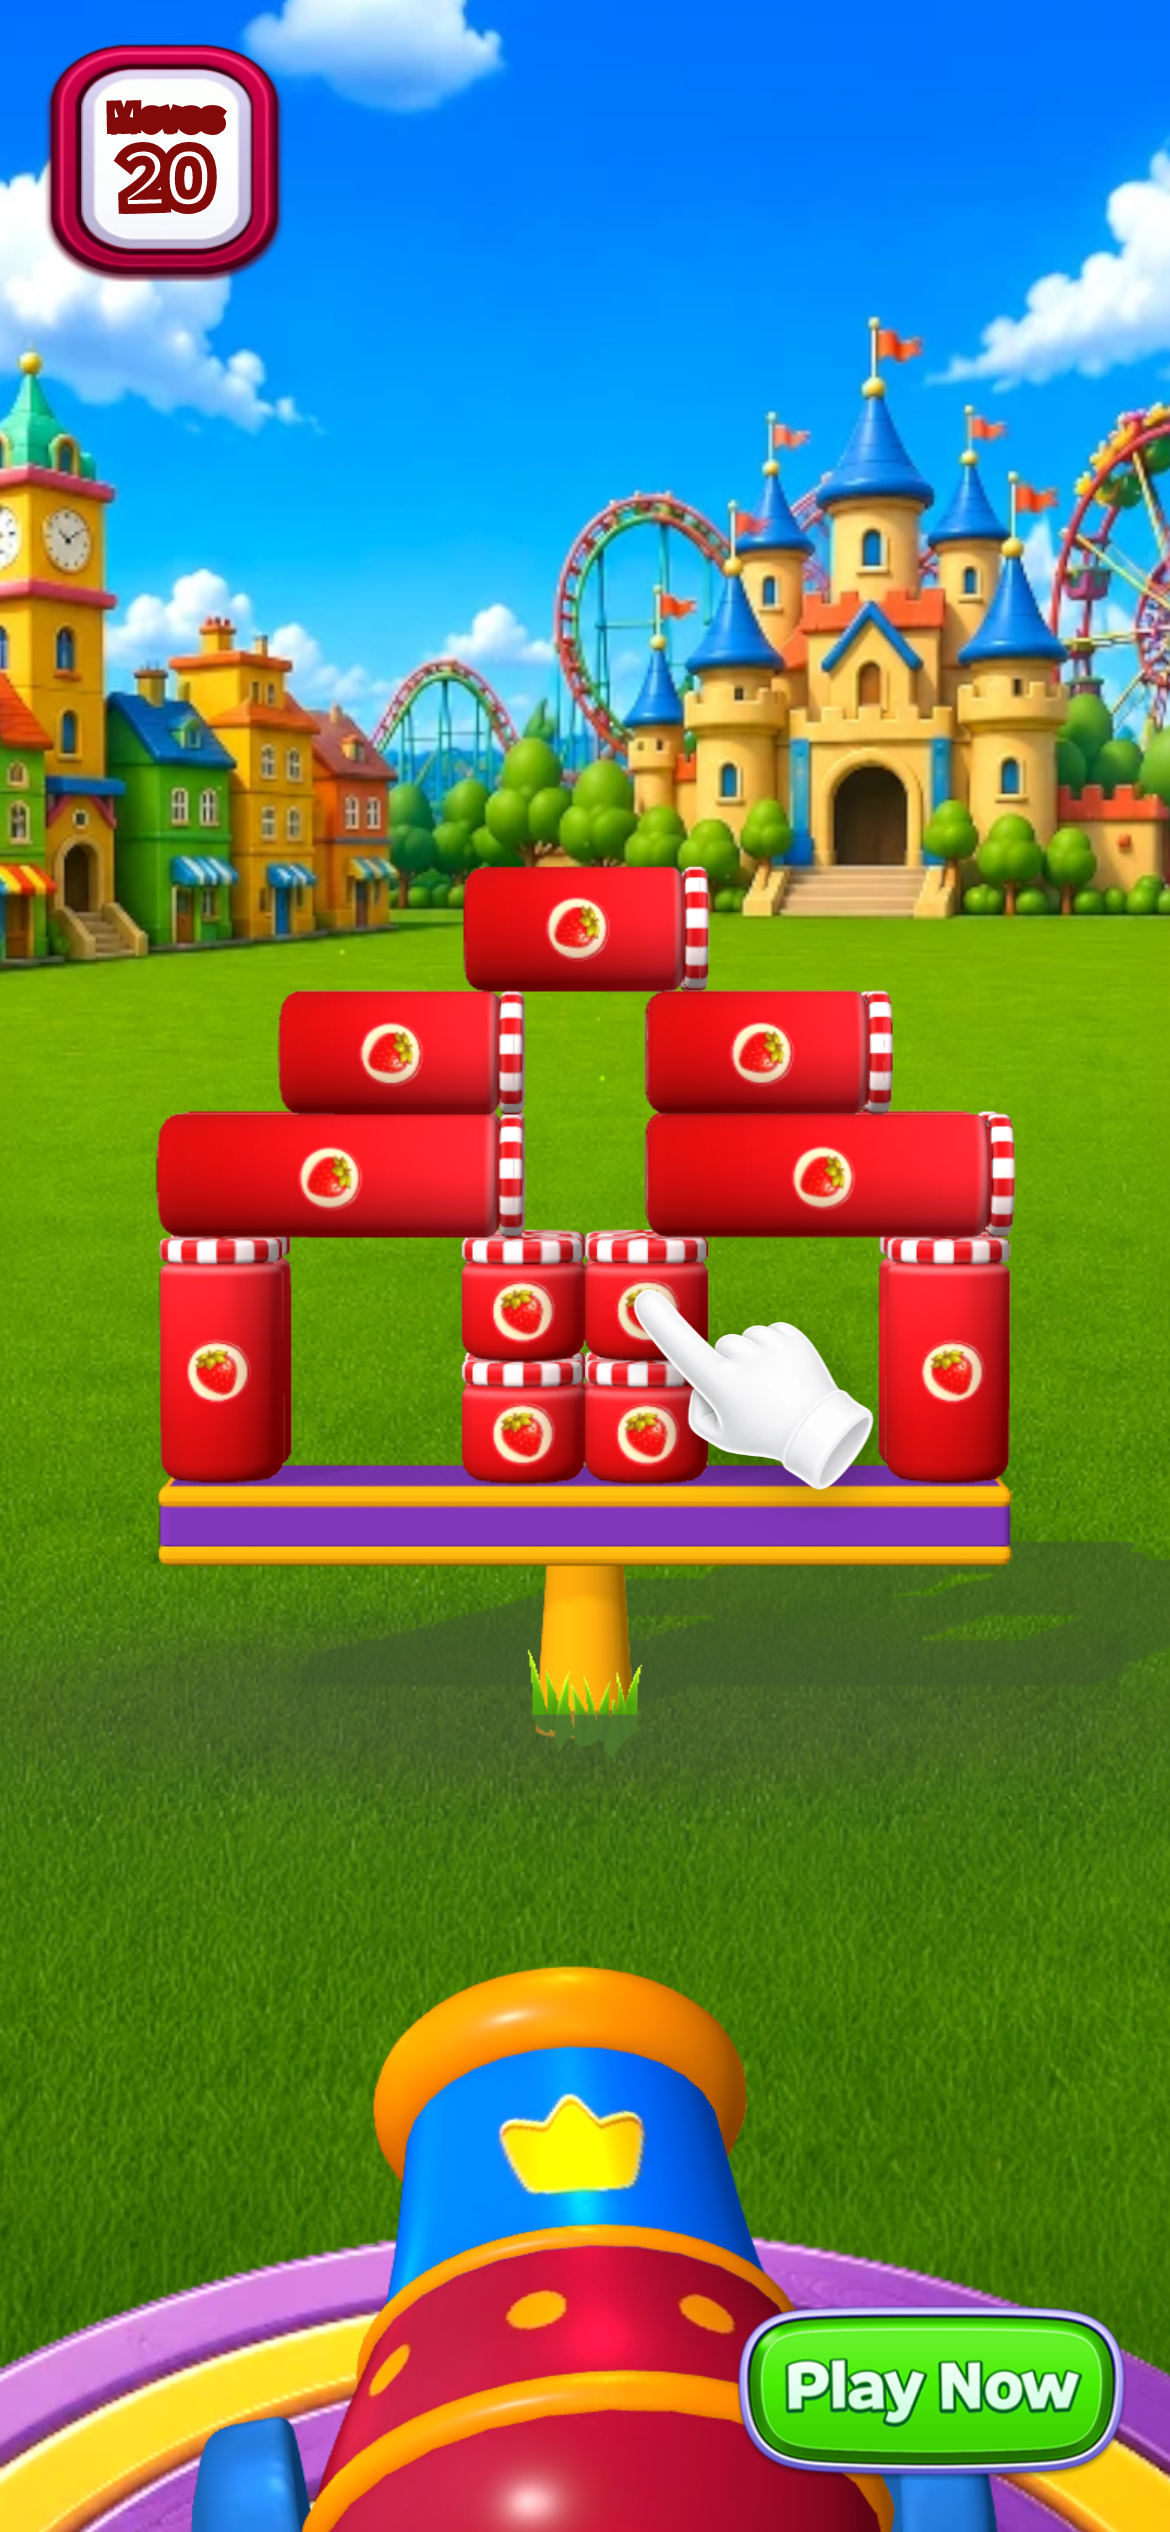 Royal Smash!'s top instance and the oldest asset in the account: 219,803,951 impressions in the 30-day window across 214,755 placements, first seen 2026-07-03 and still running 47 days later. It is a single playable end card,
 97800cb8…, which also appears attached to three video instances.
The fleet at a glance: 30 instances, 21 files, none older than seven weeks
| # | Impressions | Placements | First seen | Days live | Duration | Impr/placement | Video | Playable | Listing |
|---|---|---|---|---|---|---|---|---|---|
| 1 | 219,803,951 | 214,755 | 2026-07-03 | 47 | playable | 1,024 | — | P1 | iOS |
| 2 | 178,057,345 | 145,317 | 2026-07-04 | 46 | playable | 1,225 | — | P2 | iOS |
| 3 | 109,508,755 | 82,121 | 2026-07-27 | 23 | 30s | 1,334 | V1 | — | iOS |
| 4 | 93,692,962 | 727,543 | 2026-07-27 | 23 | static | 129 | — | — | Android |
| 5 | 73,204,592 | 54,498 | 2026-07-30 | 20 | playable | 1,343 | — | P3 | iOS |
| 6 | 69,772,747 | 48,811 | 2026-07-27 | 23 | 30s | 1,429 | V2 | — | iOS |
| 7 | 54,909,208 | 38,848 | 2026-07-23 | 27 | playable | 1,413 | — | P4 | iOS |
| 8 | 47,246,076 | 34,228 | 2026-07-23 | 27 | playable | 1,380 | — | P5 | iOS |
| 9 | 33,553,880 | 39,674 | 2026-07-18 | 32 | 30s | 846 | V3 | — | iOS |
| 10 | 23,472,600 | 44,808 | 2026-07-18 | 32 | 30s | 524 | V3 | — | iOS |
| 11 | 21,345,719 | 15,141 | 2026-07-27 | 23 | 30s | 1,410 | V4 | P5 | iOS |
| 12 | 18,969,739 | 13,545 | 2026-07-27 | 23 | 30s | 1,401 | V4 | — | iOS |
| 13 | 13,421,148 | 8,400 | 2026-07-27 | 23 | 30s | 1,598 | V2 | P6 | iOS |
| 14 | 12,894,770 | 96,991 | 2026-07-15 | 12 (ended 2026-07-27) | static | 133 | — | P7 | Android |
| 15 | 9,649,689 | 7,082 | 2026-07-29 | 21 | playable | 1,363 | — | P8 | iOS |
| 16 | 9,335,642 | 6,543 | 2026-07-05 | 45 | 60s | 1,427 | V5 | P1 | iOS |
| 17 | 8,736,358 | 9,814 | 2026-07-27 | 23 | 30s | 890 | V6 | — | iOS |
| 18 | 6,807,821 | 4,297 | 2026-07-27 | 23 | 30s | 1,584 | V2 | P4 | iOS |
| 19 | 6,765,148 | 23,950 | 2026-07-18 | 32 | 30s | 283 | V7 | — | iOS |
| 20 | 6,734,775 | 3,887 | 2026-07-27 | 23 | 30s | 1,733 | V4 | P4 | iOS |
| 21 | 6,467,483 | 56,221 | 2026-07-27 | 23 | 30s | 115 | V4 | — | Android |
| 22 | 5,162,073 | 3,964 | 2026-07-06 | 44 | 15s | 1,302 | V8 | P1 | iOS |
| 23 | 5,043,230 | 29,480 | 2026-08-04 | 15 | 60s | 171 | V9 | — | Android |
| 24 | 4,785,926 | 3,770 | 2026-07-15 | 35 | 30s | 1,270 | V10 | — | iOS |
| 25 | 4,707,911 | 15,708 | 2026-07-18 | 32 | 30s | 300 | V3 | — | iOS |
| 26 | 4,556,239 | 42,032 | 2026-07-27 | 23 | 30s | 108 | V2 | — | Android |
| 27 | 4,431,124 | 13,161 | 2026-07-04 | 46 | playable | 337 | — | P9 | iOS |
| 28 | 4,344,713 | 3,056 | 2026-07-05 | 45 | 60s | 1,422 | V11 | P1 | iOS |
| 29 | 3,906,015 | 2,699 | 2026-07-27 | 23 | 30s | 1,447 | V4 | P6 | iOS |
| 30 | 2,049,901 | 22,713 | 2026-07-27 | 23 | 45s | 90 | V12 | — | Android |
| Total | 1,063,337,540 | 1,813,057 | — | 28.6 avg | — | 587 fleet avg | 12 files | 9 files | — |
Two things stand out immediately.
First, concentration is unusually mild for a fleet this size. The top creative takes 20.7%, the top two take 37.4%, the top three take 47.7%. Compare that with the mature fleets measured on the same date, where the top two assets routinely carry 65–75%. Royal Smash! has no single dominant winner yet; it has a broad front.
Second, the impressions-per-placement column is not a distribution, it is two distributions. Read it against the Listing column and the pattern is exact.
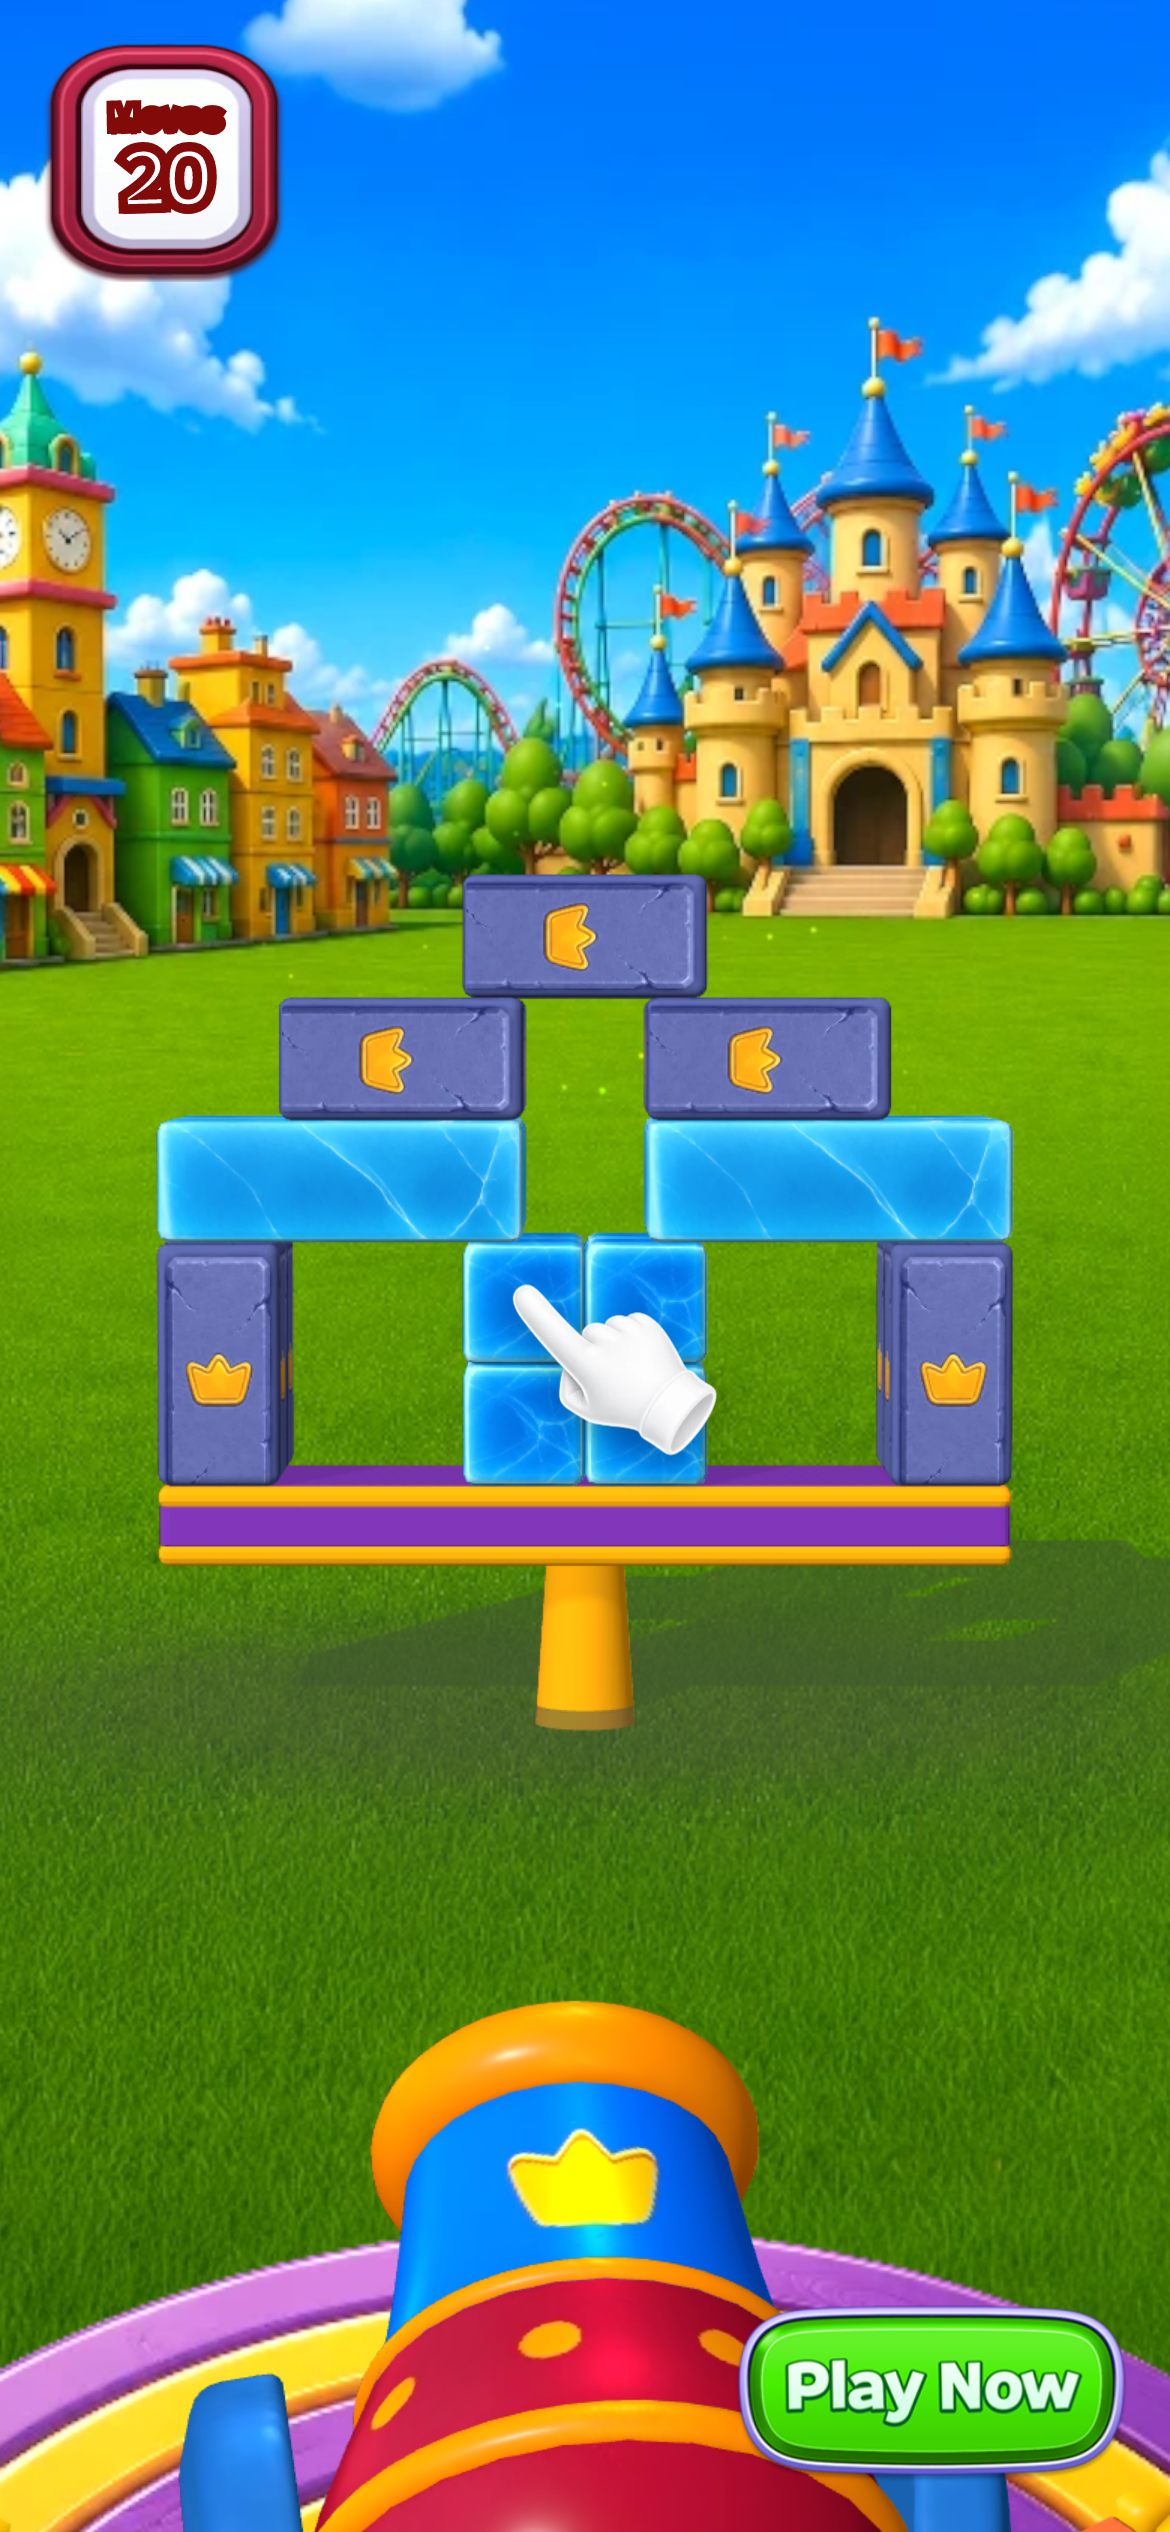 Instance #2 — 178,057,345 impressions across 145,317 placements, first seen 2026-07-04, one day after the account's first asset. Together the first two instances carry 37.4% of the fleet, and neither carries a video: both are pure playable units.
The two-listing split: 54% of the placements, 12% of the impressions
Six of the thirty instances resolve to the Android package com.cyphergames.royalsmash (developer ID 175569991). The other twenty-four resolve to the iOS app ID 6780891673 (developer ID 2142247179). Both are published by Cypher Games and both are the same game. The split in behaviour between them is the cleanest signal in this dataset.
| Store listing | Creatives | Impressions | Share of impressions | Placements | Share of placements | Impr/placement (aggregate) | Impr/placement (median) | Range |
|---|---|---|---|---|---|---|---|---|
iOS 6780891673 | 24 | 938,632,955 | 88.3% | 838,077 | 46.2% | 1,120 | 1,353 | 283 – 1,733 |
Android com.cyphergames.royalsmash | 6 | 124,704,585 | 11.7% | 974,980 | 53.8% | 128 | 122 | 90 – 171 |
Every Android-listing creative falls between 90 and 171 impressions per placement. Every iOS-listing creative falls between 283 and 1,733. There is not a single overlap between the two groups across thirty assets. The median gap is 11.1x.
Put plainly: the Android side of this account buys more than half of all the placements the fleet touches and returns roughly one-eighth of the impressions. Creative #4 alone recorded 727,543 placements — 40.1% of every placement in the account — for 93,692,962 impressions, which ranks it fourth by volume.
There are two honest readings and the data does not fully separate them.
Reading one: different inventory, working as intended. Android inventory in casual gaming skews toward high-frequency, low-yield surfaces — banner and small-format placements where an asset is recorded as present but generates very few impressions per appearance. On this reading, 122 impressions per placement is simply what that inventory looks like, the buy is deliberate, and comparing it to iOS is comparing two different products.
Reading two: the Android buy is inefficient and nobody has looked at it. Half the fleet's placement footprint is going into surfaces that produce an eighth of the yield, and five of the six Android instances were launched in the last month by a team clearly moving fast.
The tiebreaker is a detail in the next section, and it points toward reading one being at least partly deliberate.
Why this matters beyond Royal Smash!: if you rank this fleet by placement count — which is the default sort in several competitive tools — creative #4 is the account's biggest asset by a wide margin and creative #14, a dead creative, is the fifth biggest. Neither is true. Placement count on its own tells you where a fleet is present, not where it is working. Impressions per placement is the number that separates the two, and this account is a textbook case.
 Instance #4 — the Android listing's workhorse. 727,543 placements (40.1% of the account's total) producing 93,692,962 impressions, or 129 per placement. It carries neither a video nor a playable fingerprint: it is a static image. First seen 2026-07-27, the same day as twelve other instances, which between them are five new videos and one new playable.
The build order: from one creative to thirty in 32 days
Sorting the fleet by first-seen date rather than impressions is where the account becomes legible. Nobody plans a fleet in impression order; they plan it in time order.
| First seen | Creatives added | Cohort impressions | Cohort placements | Cohort impr/placement | iOS / Android |
|---|---|---|---|---|---|
| 2026-07-03 | 1 | 219,803,951 | 214,755 | 1,024 | 1 / 0 |
| 2026-07-04 | 2 | 182,488,469 | 158,478 | 1,151 | 2 / 0 |
| 2026-07-05 | 2 | 13,680,355 | 9,599 | 1,425 | 2 / 0 |
| 2026-07-06 | 1 | 5,162,073 | 3,964 | 1,302 | 1 / 0 |
| 2026-07-15 | 2 | 17,680,696 | 100,761 | 176 | 1 / 1 |
| 2026-07-18 | 4 | 68,499,539 | 124,140 | 552 | 4 / 0 |
| 2026-07-23 | 2 | 102,155,284 | 73,076 | 1,398 | 2 / 0 |
| 2026-07-27 | 13 | 365,969,662 | 1,037,224 | 353 | 9 / 4 |
| 2026-07-29 | 1 | 9,649,689 | 7,082 | 1,363 | 1 / 0 |
| 2026-07-30 | 1 | 73,204,592 | 54,498 | 1,343 | 1 / 0 |
| 2026-08-04 | 1 | 5,043,230 | 29,480 | 171 | 0 / 1 |
The shape is a ramp, not a launch. Four instances in the first four days. A nine-day gap. Then two, then four, then two, then thirteen in a single day, then a trickle.
Three observations that only come from this ordering:
The account opened with its winner. Creative #1 arrived on day one and is still the highest-volume asset in the fleet forty-seven days later. That is not the usual pattern. In the mature accounts measured on the same date, the leading creative typically arrived months into the account's life after a long tail of failures. Cypher Games shipped its best asset first — or, more likely, arrived with an already-validated creative and spent the following seven weeks scaling around it.
There was a nine-day pause between 2026-07-06 and 2026-07-15. Four instances shipped in four days, then nothing for over a week. That gap is consistent with a read-and-decide window: launch a small set, wait for signal, then commit. Everything after 2026-07-15 is a different tempo.
The 2026-07-27 salvo is the commitment. Thirteen instances on one day is not iteration. It is a team that has decided the thing works and is now filling out every variant and every placement type it can produce — from six new files.
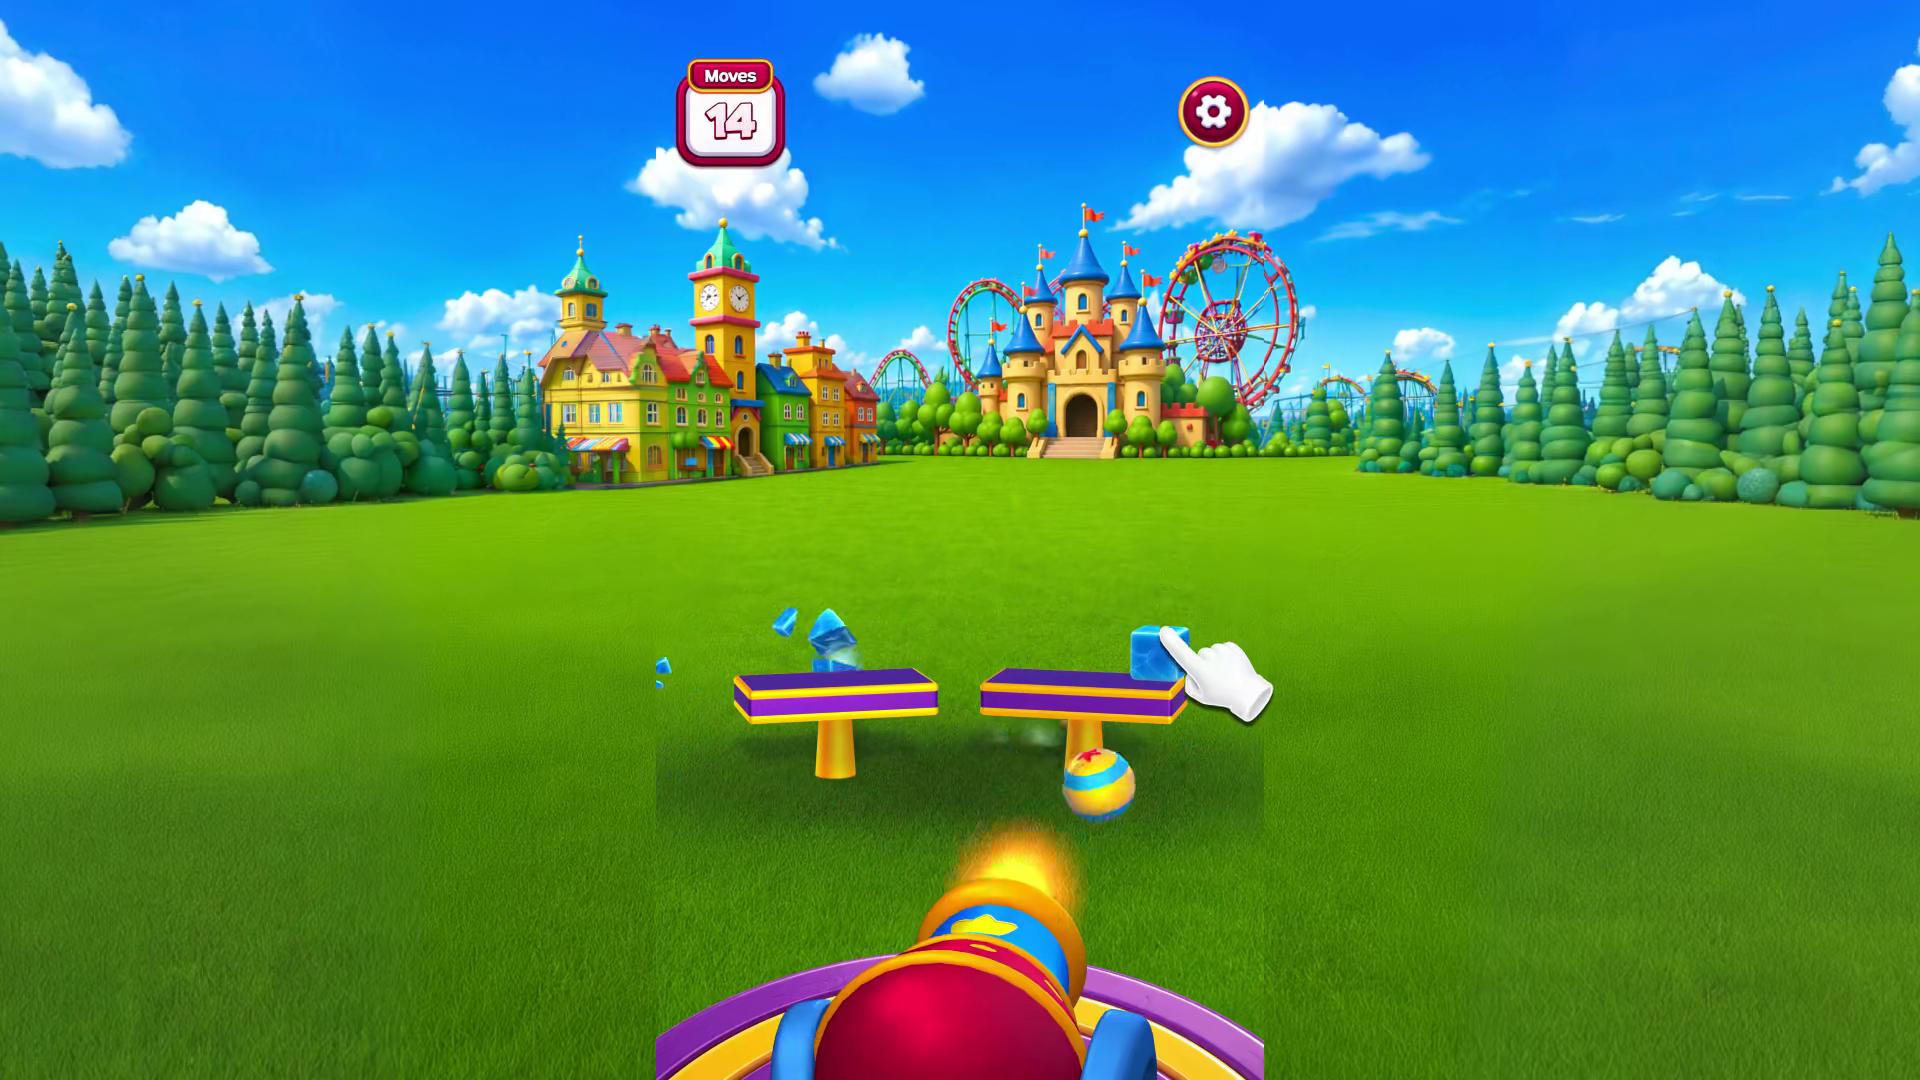 Instance #3 — 30 seconds, 109,508,755 impressions across its 23 days inside the measurement window. The highest-volume row from the 2026-07-27 cohort, and the only one of that day's five videos that was never recombined with a second end card.
2026-07-27: thirteen instances, six new files
The single-day cohort deserves its own examination because it is 43% of the account and 34.4% of its impressions — and because it is the clearest example in this teardown of why instances and assets are not the same thing.
| Impressions | Placements | Impr/placement | Duration | Video | Playable | Listing |
|---|---|---|---|---|---|---|
| 109,508,755 | 82,121 | 1,334 | 30s | V1 | — | iOS |
| 93,692,962 | 727,543 | 129 | static | — | — | Android |
| 69,772,747 | 48,811 | 1,429 | 30s | V2 | — | iOS |
| 21,345,719 | 15,141 | 1,410 | 30s | V4 | P5 | iOS |
| 18,969,739 | 13,545 | 1,401 | 30s | V4 | — | iOS |
| 13,421,148 | 8,400 | 1,598 | 30s | V2 | P6 | iOS |
| 8,736,358 | 9,814 | 890 | 30s | V6 | — | iOS |
| 6,807,821 | 4,297 | 1,584 | 30s | V2 | P4 | iOS |
| 6,734,775 | 3,887 | 1,733 | 30s | V4 | P4 | iOS |
| 6,467,483 | 56,221 | 115 | 30s | V4 | — | Android |
| 4,556,239 | 42,032 | 108 | 30s | V2 | — | Android |
| 3,906,015 | 2,699 | 1,447 | 30s | V4 | P6 | iOS |
| 2,049,901 | 22,713 | 90 | 45s | V12 | — | Android |
| 365,969,662 | 1,037,224 | 353 | — | 5 files | 3 files | 9 / 4 |
Eleven of the thirteen instances are exactly 30 seconds. One is static, one is 45 seconds. Nine went to the iOS listing, four to Android.
But thirteen instances is five videos. Video 5bd973e2… (V4) accounts for five of the thirteen rows on its own; 76ae4ddb… (V2) accounts for four. Of the three playables in the cohort, only 07f61b28… (P6) was new that day — 514af838… (P4) and 89a96f64… (P5) had both been running since 2026-07-23. And the largest row in the cohort, the 727,543-placement Android static, carries no video or playable fingerprint at all.
| What launched on 2026-07-27 | Count |
|---|---|
| Ad instances | 13 |
| New video files | 5 |
| New playable files | 1 |
| Playables recycled from 2026-07-23 | 2 |
| Static image with no video/playable fingerprint | 1 |
| Genuinely new production | 6 files + 1 static |
That reframes the day entirely. It was not thirteen new pieces of creative. It was six new files and a permutation layer — the same combinatorial machine documented in the Grand Games and Block Craft 3D teardowns pulled the same month, compressed into a single day.
This is the tiebreaker mentioned earlier. The four Android instances in this cohort were shipped deliberately, on the same day, alongside nine iOS instances — and they were given a placement footprint (848,509 placements between them) that dwarfs everything else in the account. Nobody accidentally allocates 47% of a fleet's total placement count on a single day. Whatever the Android buy is doing, it is a decision, not an oversight.
Note also the spread within the iOS half of this cohort. Nine instances, all 30 seconds, all launched simultaneously, delivering between 3,906,015 and 109,508,755 impressions — a 28x range. Their impressions-per-placement rates, however, cluster between 890 and 1,733. Same day, same length, same inventory density; wildly different volume.
The fingerprints sharpen that observation into something much more useful. Instances #12 and #29 are the same video file (V4) and differ by 4.9x in impressions — 18,969,739 against 3,906,015. #12 runs bare; #29 carries playable P6. Instances #6 and #26 are also the same file (V2) and differ by 15.3x — but those two are split across listings, iOS versus Android, which is the known 11x effect.
So within a single listing, on a single day, the identical video file produced a 4.9x outcome gap depending on what was attached to it and how many placements it won. That combination tells you the auction is doing the sorting. Each instance gets served at roughly the same intensity, and the difference in outcome comes almost entirely from how many placements each one wins — not from the film.
The one creative that was switched off
Twenty-nine of thirty assets were still recording placements on the pull date. One was not.
Creative #14 is a static Android-listing asset, first seen 2026-07-15, last seen 2026-07-27. It ran twelve days, recorded 96,991 placements and 12,894,770 impressions, at 133 impressions per placement.
The date it died is the interesting part. 2026-07-27 is the day thirteen new instances entered the fleet, four of them on the Android listing.
Read as a sequence: Cypher Games ran a single static Android test starting 2026-07-15. Twelve days later, on the day of the big salvo, that test was retired and four new Android instances replaced it — including instance #4, which went on to take 727,543 placements and become the fourth-largest asset in the account.
That is a functioning test-and-replace loop, and it is the only retirement decision this account has made. Everything else it has ever launched is still running.
It also sharpens the efficiency question. The retired asset ran at 133 impressions per placement. Its replacement runs at 129. If Cypher Games were treating low impressions-per-placement as a failure signal, it would not have swapped a 133 for a 129 and then scaled it 7.5x. The Android buy is being judged on something the impression data does not show — almost certainly installs.
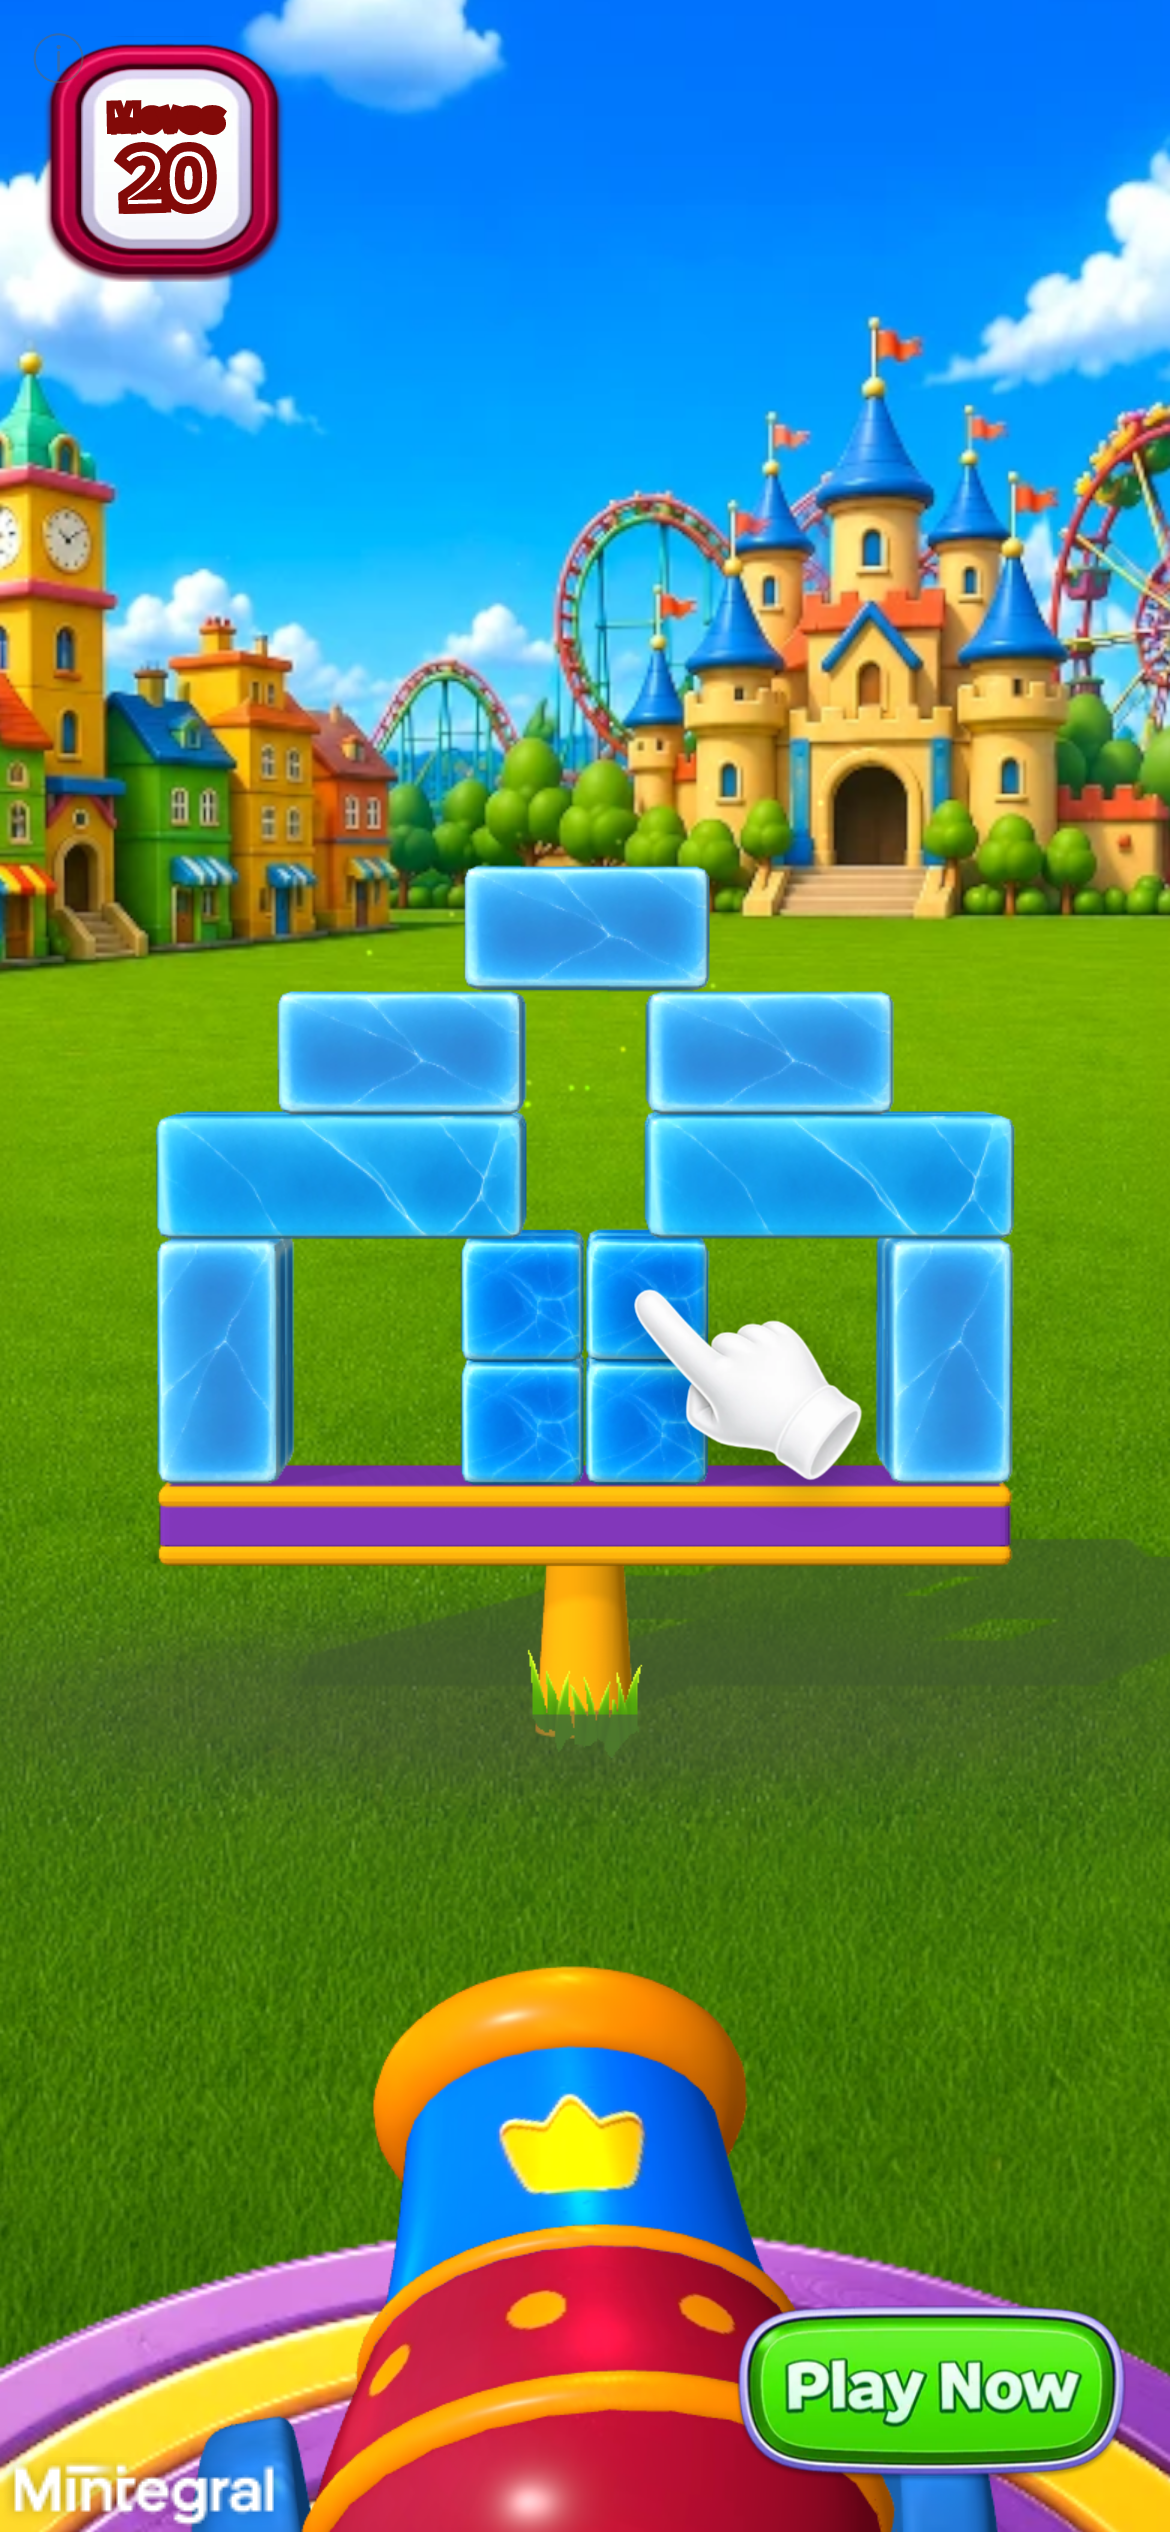 Instance #14 — the account's only retirement. First seen 2026-07-15, last seen 2026-07-27, twelve days live, 96,991 placements. It was switched off the same day four replacement Android instances launched.
Duration: a 30-second house standard with three exceptions
Cypher Games has an unusually rigid length policy for a fleet assembled this quickly.
| Duration | Creatives | Impressions | Share of fleet | Impr/placement |
|---|---|---|---|---|
| Playable / static (no video duration recorded) | 9 | 693,889,717 | 65.3% | 521 |
| 30s | 16 | 343,512,264 | 32.3% | 828 |
| 60s | 3 | 18,723,585 | 1.8% | 479 |
| 15s | 1 | 5,162,073 | 0.5% | 1,302 |
| 45s | 1 | 2,049,901 | 0.2% | 90 |
Sixteen of thirty instances are exactly 30 seconds — but they are only seven distinct video files. Nine instances carry no video duration at all; these are the playable and static units, and they carry 65.3% of fleet impressions. Three instances are 60 seconds (three distinct files), one is 45, one is 15.
The 30-second band is where all of the reuse lives:
| Video file | Duration | Instances | Combined impressions | First seen |
|---|---|---|---|---|
5bd973e2… | 30s | 5 | 57,423,731 | 2026-07-27 |
76ae4ddb… | 30s | 4 | 94,557,955 | 2026-07-27 |
49c3aaf3… | 30s | 3 | 61,734,391 | 2026-07-18 |
8ed3cc85… | 30s | 1 | 109,508,755 | 2026-07-27 |
c46e4545… | 30s | 1 | 8,736,358 | 2026-07-27 |
bfcc2cda… | 30s | 1 | 6,765,148 | 2026-07-18 |
eef81307… | 30s | 1 | 4,785,926 | 2026-07-15 |
| Total | — | 16 | 343,512,264 | — |
Three files account for twelve of the sixteen 30-second instances. Cypher Games did not ship sixteen 30-second videos; it shipped seven and ran three of them repeatedly against different end cards and different listings. The single largest 30-second earner, 8ed3cc85… at 109.5 million, is the one that was not recombined at all — it ran once and out-delivered the five-instance file by 1.9x.
Note that the aggregate impressions-per-placement figures in that table are contaminated by the listing split — the four Android instances sitting in the 30s and no-duration bands drag those rows down. The clean view is within the iOS listing.
Within the iOS listing specifically, where the volume is:
| Duration | Creatives | Impressions | Impr/placement |
|---|---|---|---|
| No video duration (playable/static) | 7 | 587,301,985 | 1,156 |
| 30s | 14 | 332,488,542 | 1,050 |
| 60s | 2 | 13,680,355 | 1,425 |
| 15s | 1 | 5,162,073 | 1,302 |
The interactive and static units carry 62.6% of iOS impressions off seven instances. The fourteen 30-second iOS instances carry 35.4% — and they resolve to seven distinct video files, so the "fourteen" in that row is fourteen delivery records, not fourteen edits. The two 60-second cuts and the single 15-second cut are rounding errors by volume — but note that both minority formats deliver at higher impressions-per-placement than the 30-second standard.
That is a small, real signal. The 60-second assets (1,425 per placement) and the 15-second asset (1,302) are being served more densely than the 30-second house format (1,050), yet almost nothing is being spent on them. Either those formats reach inventory that is harder to fill at scale, or the production pipeline is standardised on 30 seconds and the exceptions are leftovers.
Given that both 60-second iOS instances — two distinct video files — were first seen on 2026-07-05 — in the opening week, before the format settled — the second explanation is more likely. They look like early experiments that were never repeated.
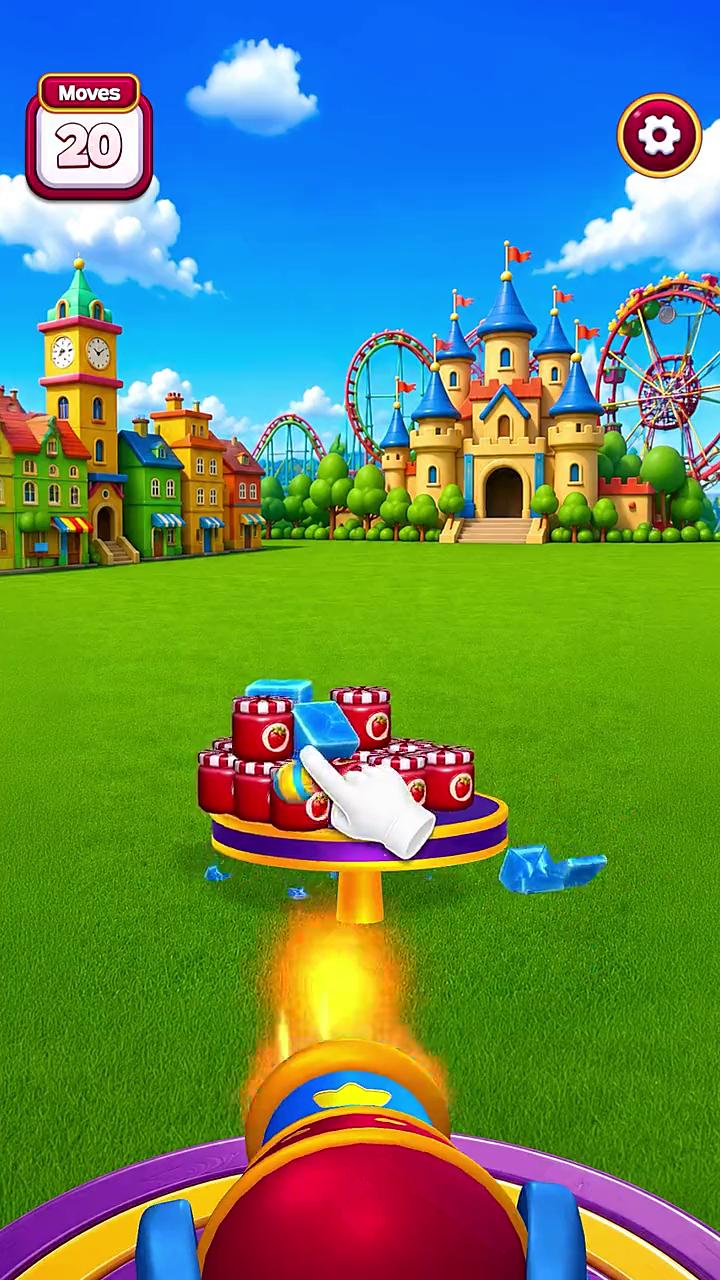 Creative #16 — 60 seconds, first seen 2026-07-05, 9,335,642 impressions at 1,427 per placement. One of only two long-form assets, both from the opening week, neither repeated after the format standardised on 30 seconds.
Why this teardown has no "impressions per day" column
The obvious next move with a fleet this young is to divide each row's impressions by its age and rank by intensity. We ran that calculation, found it produced a confidently wrong answer, and then found that no valid version of it exists for this account. Both steps are worth showing, because this is the single most common error available with this data source.
Step one: the naive version is wrong. The impression field is a rolling 30-day value. Dividing instance #1's window impressions by its full 47-day age gives 4,676,680 per day and makes instance #3 (23 days old, 4,761,250) look like the fastest asset in the fleet. That divides a 30-day numerator by a 47-day denominator. Correct the divisor to the days each row actually sat inside the window and instance #1 runs at 7,326,798 — 1.54x instance #3, the opposite ranking.
Step two: even the corrected version does not survive here. A daily rate is only meaningful if most of the delivery comes from rows that were live for the whole window. In this fleet:
| Value | |
|---|---|
| Rows covering the full window (first seen ≤ 2026-07-20, still live 2026-08-19) | 11 of 30 |
| Share of window impressions from those rows | 46.5% |
| Rows that entered mid-window | 18 |
| Rows that stopped mid-window | 1 |
Less than half of this account's delivery comes from rows that were exposed to the whole measurement period. Eighteen of thirty instances launched after the window opened, including the entire 2026-07-27 salvo. Any per-day figure would be averaging assets measured over 30 days against assets measured over 20, and the resulting ranking would say more about launch dates than about performance.
So there is no intensity table in this article. What we can say without a divisor:
- Instance #1 leads on window impressions (219,803,951) despite being the oldest asset, and it is a single playable end card.
- The 2026-07-27 cohort's thirteen instances carry 365,969,662 — 34.4% of window delivery — having entered only 23 days before the window closed.
- The six opening-week instances (2026-07-03 to 2026-07-06) carry 421,134,848, more than the thirteen-instance salvo, from less than half the rows.
That last comparison is the one that matters, and it needs no rate at all: fewer, earlier assets are carrying more delivery than the big single-day salvo.
Playables: attached to just over half the fleet
Sixteen of the thirty instances carry a playable attachment, and those sixteen reference nine distinct playable files. Nine instances record no video duration at all; eight of those are playable units carrying the account's largest single block of iOS volume, and the ninth is the Android static image.
The reuse is concentrated in one file. Playable 97800cb8… appears in four instances — the account's oldest and largest asset plus three video pairings — totalling 238,646,379 impressions, 22.4% of the fleet. That is more than any single video file in the account, including the 109.5-million-impression 30-second leader.
This is a middle-of-the-road posture. Set against the other US fleets measured on this date:
| Publisher | Playable attachment rate | Notes |
|---|---|---|
| Block Out! (Grand Games) | 15 / 15 | Playable treated as the core product |
| Vita Mahjong (Vita Studio) | 12 / 15 | Attached to most, drives 13% of volume |
| Royal Smash! (Cypher Games) | 16 / 30 | Attached to just over half; interactive units carry 62.6% of iOS impressions |
| Gossip Harbor (Microfun) | 5 / 15 | Playable treated as a placement requirement |
For a physics-destruction puzzle the emphasis on interactive units makes obvious sense. The appeal of the genre is the moment of collapse — a static screenshot cannot convey it, and a 30-second video shows it once. A playable lets the user cause it. That the interactive and static units carry 62.6% of iOS impressions off only seven assets suggests those placements are both abundant and being won.
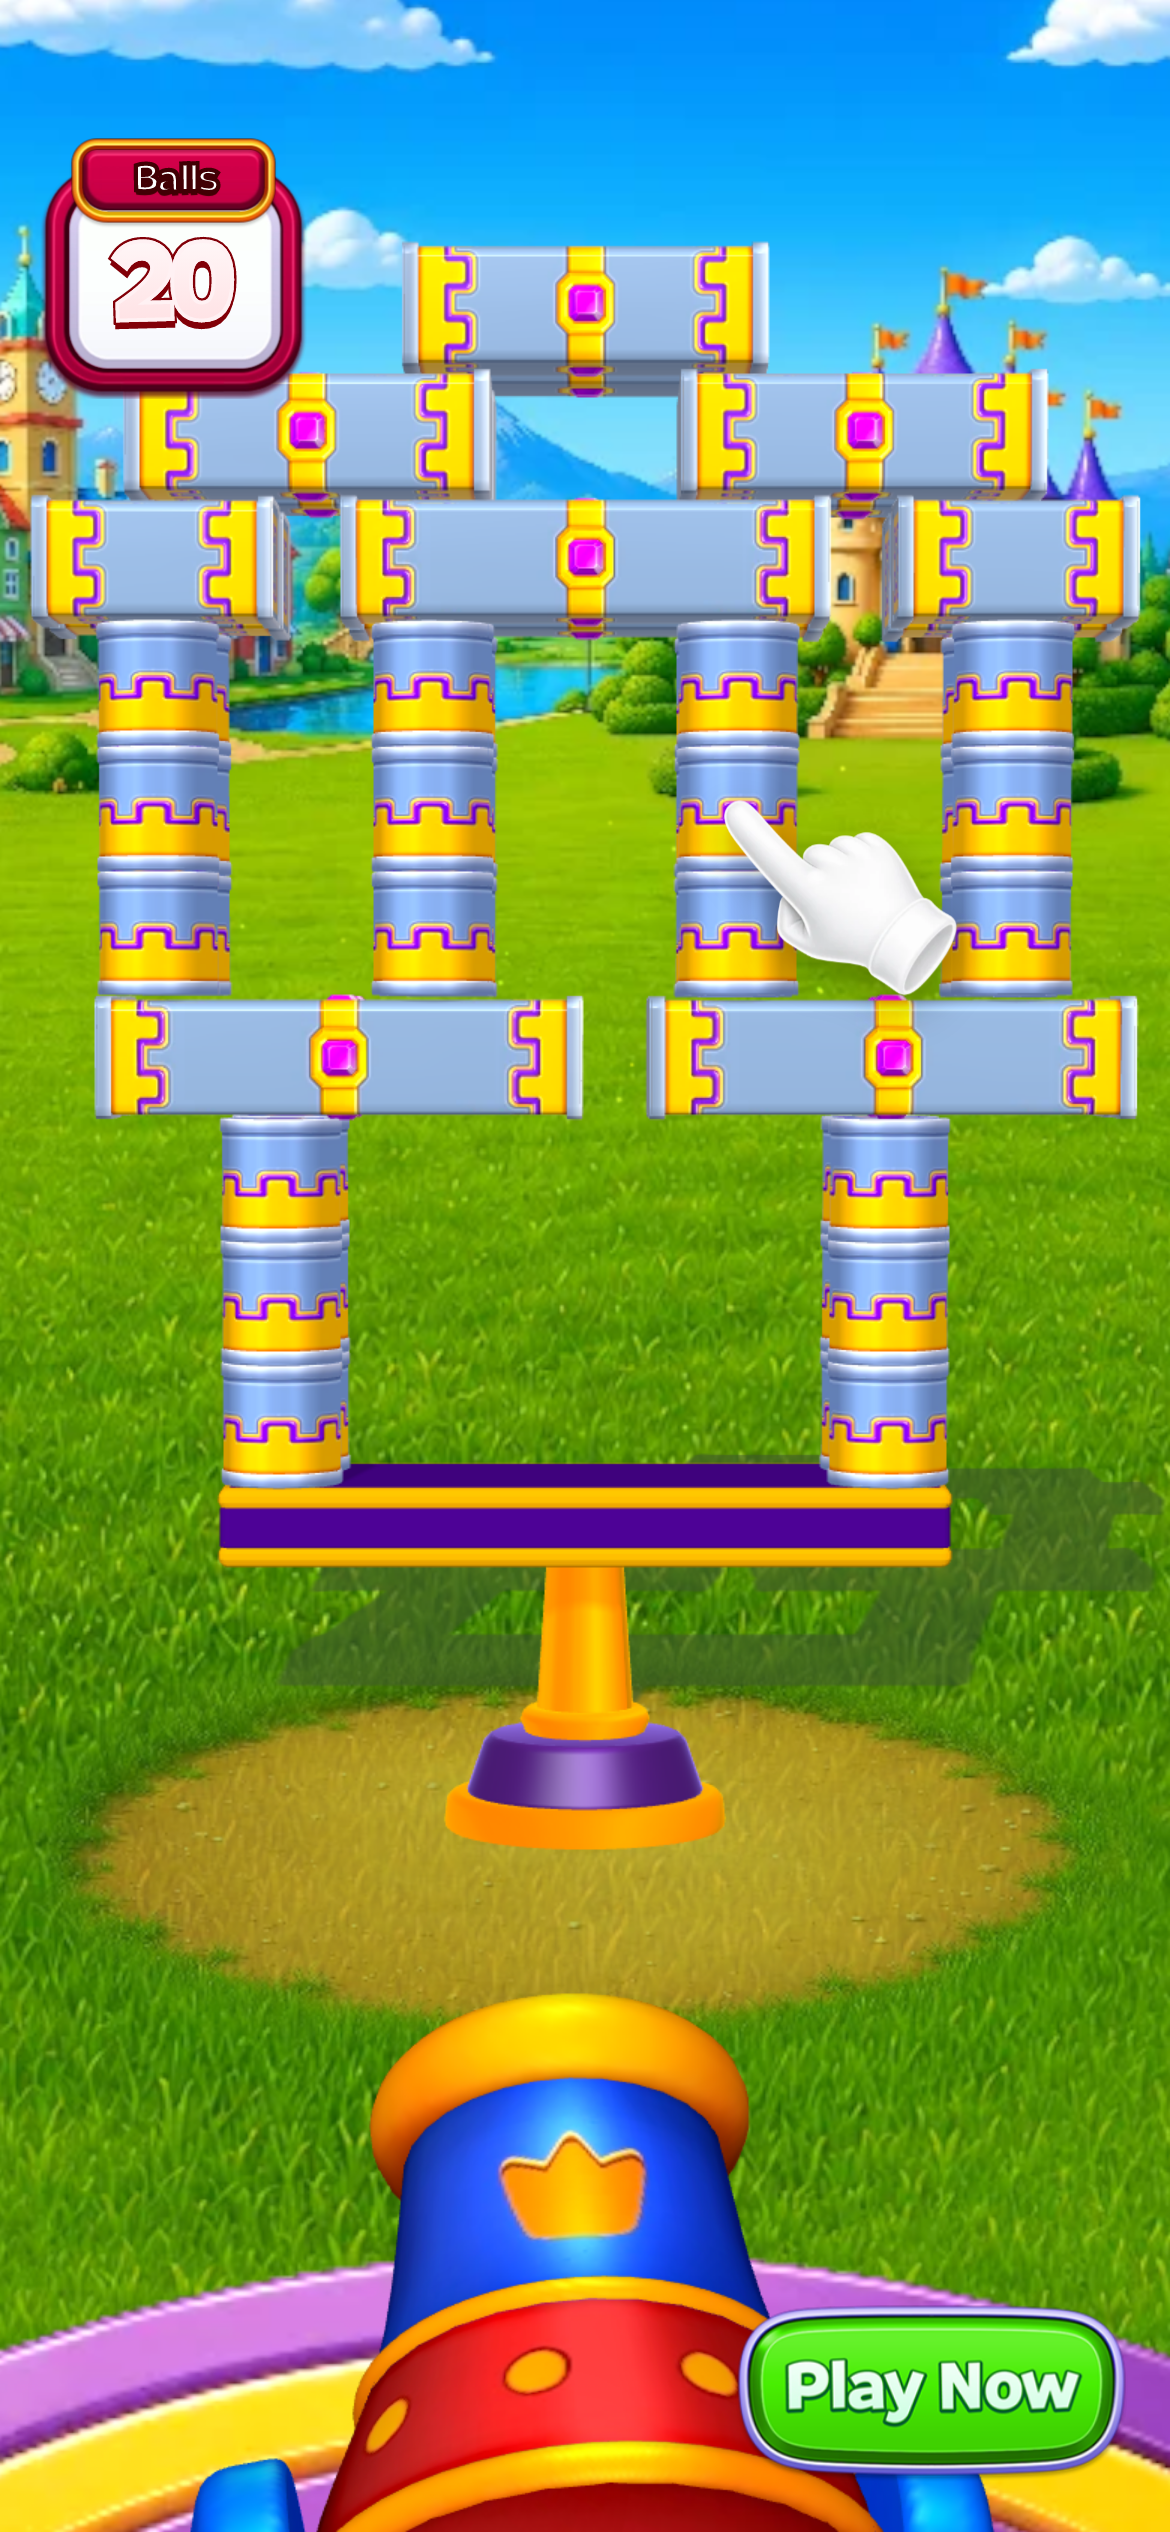 Creative #5 — 73,204,592 impressions in 20 days at 1,343 per placement, first seen 2026-07-30. One of seven interactive/static units on the iOS listing that together carry 62.6% of that listing's impressions.
Same-genre comparison: single-creative intensity
The most useful competitive framing is not fleet totals — those depend on how much budget a publisher happens to have — but how hard each publisher's best single asset is being pushed, and at what density.
All figures below are creative-side measurements taken on 2026-08-19, keyed to the app ID observed on each creative. Where a title runs two store listings, each listing is shown separately, because as the Royal Smash! data demonstrates they behave as different media plans.
| Title (listing) | Publisher | Creatives sampled | Total impressions | Top single creative | Top-creative placements | Top-creative impr/placement | Top-creative first seen |
|---|---|---|---|---|---|---|---|
Pixel Flow! (com.loomgames.pixelflow) | Loom Games A.Ş. | 8 | 2,645,797,236 | 2,298,804,130 | 2,113,657 | 1,088 | 2025-12-13 |
Smash Fest! (com.flow.cannonball) | Flow Games A.S. | 10 | 1,269,232,833 | 472,973,903 | 1,346,163 | 351 | 2026-07-23 |
Royal Smash! (6780891673) | Cypher Games | 24 | 938,632,955 | 219,803,951 | 214,755 | 1,024 | 2026-07-03 |
Royal Smash! (com.cyphergames.royalsmash) | Cypher Games | 6 | 124,704,585 | 93,692,962 | 727,543 | 129 | 2026-07-27 |
Pixel Flow! (6751056652) | Loom Games | 2 | 215,651,438 | 154,459,662 | 517,440 | 299 | 2026-08-04 |
Castle Busters (6746328263) | Voodoo | 6 | 13,634,992 | 7,134,466 | 20,176 | 354 | 2026-05-22 |
Castle Busters (com.epicoro.castleclashers) | VOODOO | 4 | 6,401,200 | 2,264,242 | 1,956,618 | 1.2 | 2026-07-29 |
Three things worth pulling out.
The two-listing split is not a Royal Smash! quirk. Pixel Flow! shows it (1,088 on Android versus 299 on iOS — reversed from Royal Smash!, but the same structural gap), and Castle Busters shows it in an extreme form: its Android listing recorded 1,956,618 placements for 2,264,242 impressions, or 1.2 impressions per placement. Any competitive analysis that aggregates a title's listings into one number is averaging two incompatible things.
Royal Smash! is being pushed harder per placement than its nearest genre rival. Smash Fest!'s top asset delivers 351 impressions per placement across 1,346,163 placements — a wide, thin buy. Royal Smash!'s iOS top asset delivers 1,024 across 214,755 — narrow and dense. Both are physics-destruction casual games launched into the same US auction. They are buying it very differently.
Pixel Flow! shows what maturity looks like in this genre. Its lead creative has been running since 2025-12-13 and has accumulated 2.3 billion impressions — more than twice Royal Smash!'s entire fleet. That asset is 249 days old. Royal Smash!'s equivalent is 47. If Cypher Games sustains its current rate, the comparison in six months is the one to watch.
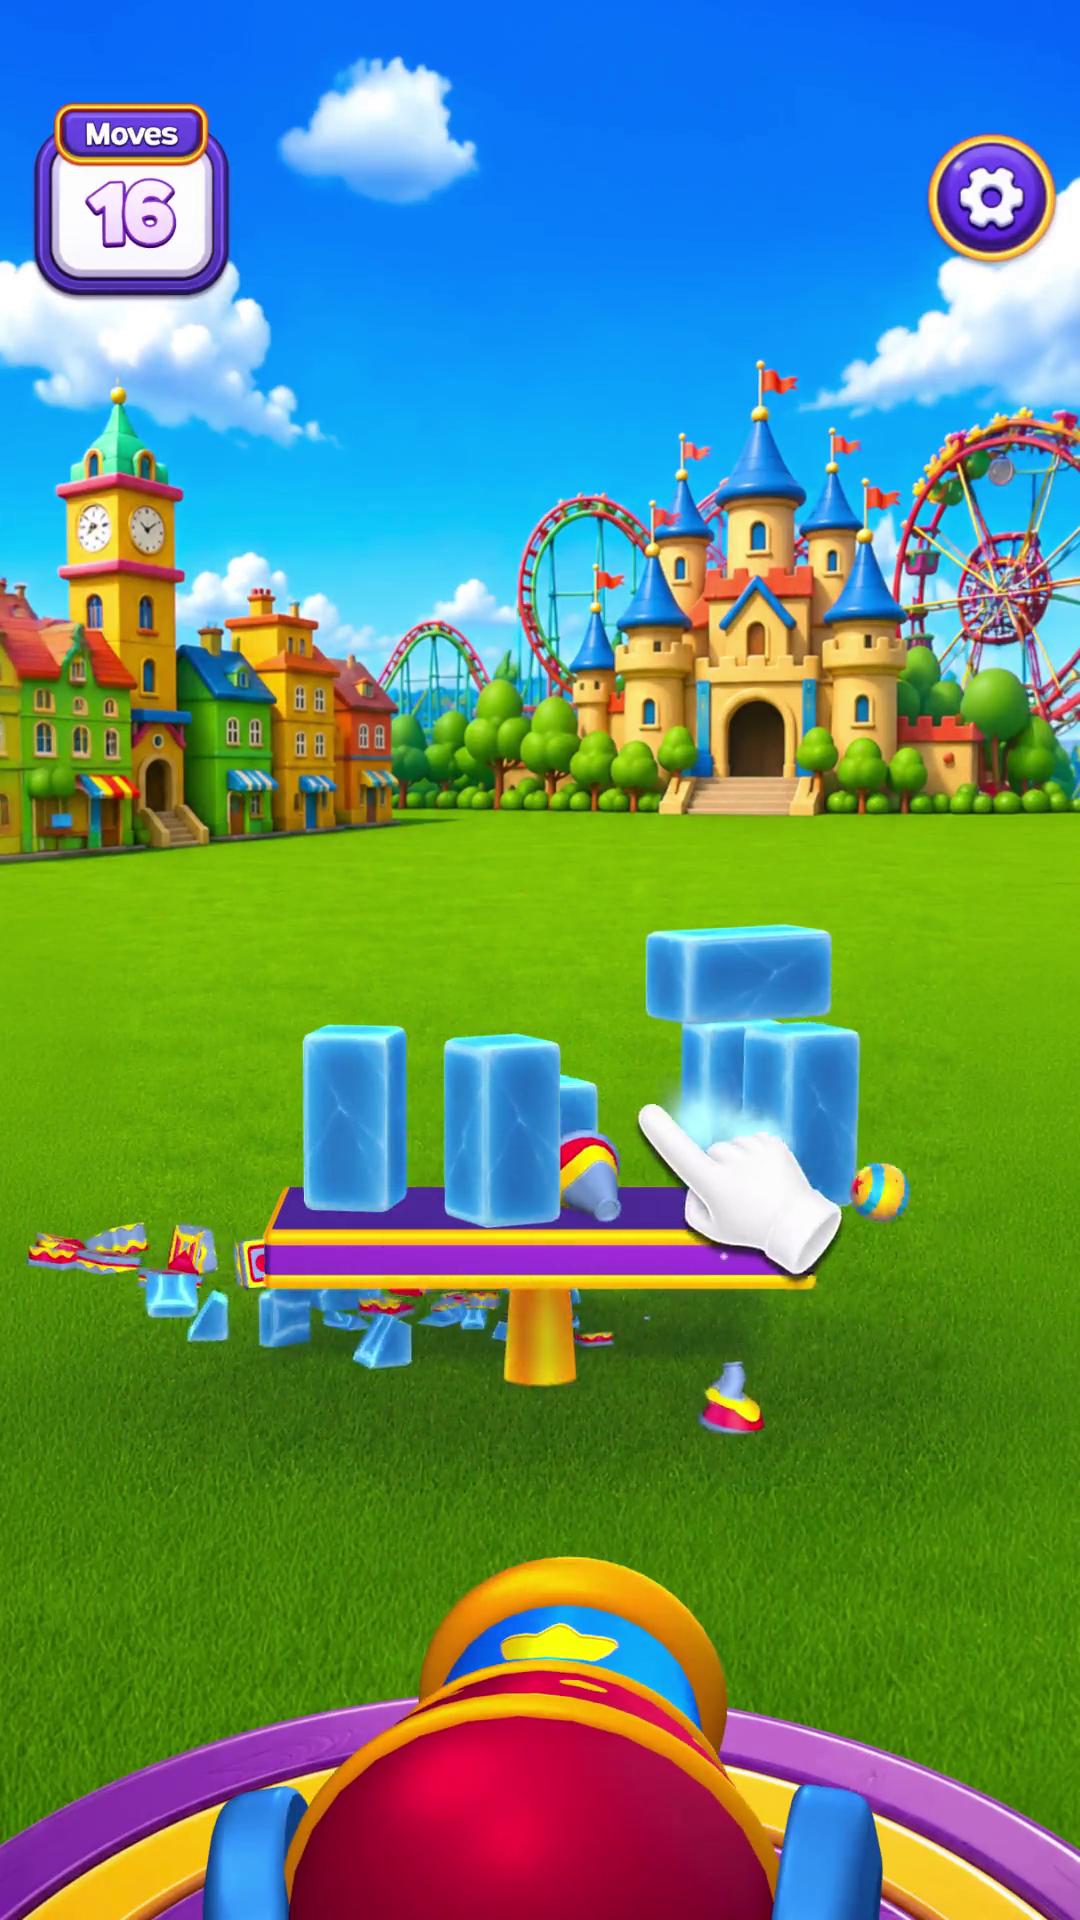 Instance #9 — 30 seconds, 33,553,880 impressions at 846 per placement. The strongest row in the 2026-07-18 cohort, whose four instances are only two video files and collectively run at 552 per placement, well below the iOS median of 1,353.
The 2026-07-18 cohort: one video file, three delivery rates
One sub-pattern is worth flagging because it complicates the clean two-listing story — and because the fingerprints turn it from an observation into a controlled experiment.
Four instances were first seen on 2026-07-18, all on the iOS listing, all 30 seconds. Their impressions-per-placement rates are 846, 524, 300 and 283 — the four lowest iOS values in the entire fleet. Collectively the cohort runs at 552 per placement against an iOS median of 1,353.
But those four instances are two video files, not four:
| Instance | Video file | Impressions | Placements | Impr/placement | demoadCnt |
|---|---|---|---|---|---|
| #9 | 49c3aaf3… | 33,553,880 | 39,674 | 846 | 4 |
| #10 | 49c3aaf3… | 23,472,600 | 44,808 | 524 | 4 |
| #25 | 49c3aaf3… | 4,707,911 | 15,708 | 300 | 2 |
| #19 | bfcc2cda… | 6,765,148 | 23,950 | 282 | 4 |
Three of the four are the same 30-second file, and it delivered at 846, 524 and 300 impressions per placement — a 2.8x spread from one piece of footage on one listing. Whatever separates those three rows, it is not the creative. It is the placement mix each instance was fed into.
Every other iOS cohort sits between 1,024 and 1,425. The 2026-07-18 batch is an outlier as a group, and now demonstrably not because of the film.
Three of the four also record a demoadCnt of 4, the highest playable-variant count in the account, where most rows record 1 or 2.
What that most likely means: this cohort was built for a different placement mix — probably interactive or rewarded inventory with multiple playable variants attached — and that inventory yields fewer impressions per appearance. It sits between the dense iOS video buy and the sparse Android buy, which is consistent with it being a third inventory type rather than a failure.
It is a useful reminder that "impressions per placement" is measuring inventory shape, not creative quality. The 2026-07-18 cohort's best asset, creative #9, is the ninth-largest in the account by volume. It is doing fine.
What the +260.93% actually tells you, and what it does not
The download change is the reason this title was selected for a teardown, so it deserves an honest treatment.
What it supports: the estimated US download volume in the current ranking window is roughly 3.6x the prior window (591,117 against 163,774). The ad fleet went from nothing to 1.06 billion impressions across the same rough period. It is a reasonable inference that the buy caused the download move.
What it does not support: any claim about revenue, retention, cost, or profitability. Downloads bought at scale are the easiest metric in mobile to move and the least informative about whether the business works. A fleet can produce 1.06 billion impressions and 427,343 incremental installs and still be losing money on every one of them.
What the creative data does add is a genuine efficiency signal, in the shape of the account's behaviour rather than any single number. Cypher Games ran a small opening set, paused for nine days, then committed thirteen instances — six new files — on one day and has retired exactly one asset since. That is the behaviour of a team that got a positive read and scaled it — not a team spraying budget and hoping. Whether the read was on install volume or on downstream value, only they know.
The number to watch is whether the 2026-07-27 cohort's share of window delivery holds. It currently carries 34.4% across thirteen instances, against 39.6% from the six opening-week rows. If the salvo's share rises through September with no retirements, the scale-up is working. If assets start disappearing — this account has shown it will retire things — the read has changed.
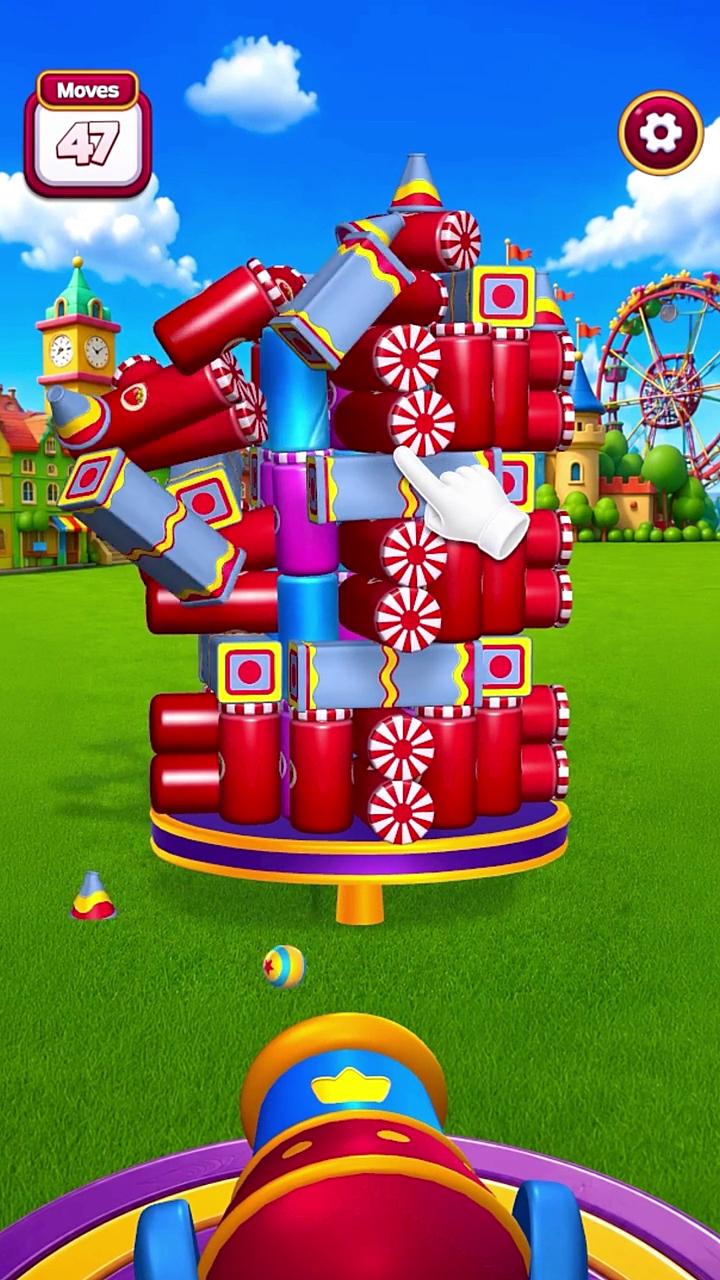 Creative #22 — the fleet's only 15-second cut, first seen 2026-07-06. 5,162,073 impressions at 1,302 per placement, a higher density than the 30-second house standard, yet the format was never repeated.
What transfers to your UA program
If you run media buying: the nine-day pause between 2026-07-06 and 2026-07-15 is the most instructive thing here. Four instances, then wait, then commit. Most teams either ship continuously (and never get a clean read on anything) or ship one big batch at launch (and cannot attribute the result). A small opening set followed by a deliberate hold is how you buy a decision rather than a guess.
If you run competitive intelligence: never aggregate a competitor's store listings into one fleet. Royal Smash!'s two listings differ by 11.1x in median impressions-per-placement, Castle Busters' differ by roughly 300x, and Pixel Flow!'s differ in the opposite direction from Royal Smash!'s. An aggregated "average impressions per placement" for any of these titles is a number describing nothing that exists.
If you run creative production: the real lesson here is not "make sixteen 30-second videos." It is that sixteen 30-second instances came from seven files, three of which were recombined against different end cards. Cypher Games built a 1.06-billion-impression account on twenty-one production assets in seven weeks — twelve videos and nine playables. The 60- and 15-second exceptions, which both deliver at higher per-placement density, were shipped in week one and never repeated. If you are budgeting a launch fleet, budget for a dozen videos and a permutation layer, not for thirty films.
If you are competing with Cypher Games: the exploitable structure is the concentration of the 2026-07-27 cohort. Thirteen instances launched together will fatigue together — and because five of them share two video files, they will fatigue in correlated groups rather than independently. A fleet built in one day has a synchronised decay curve, and unless Cypher Games staggers its next wave, there is a window in which a third of its impression volume degrades at once.
A falsifiable prediction
Prediction: on a re-pull at 2026-10-31 using the same 30-day-window default, instance #1 (playable 97800cb8…, first seen 2026-07-03) will still lead the fleet on window impressions, and Cypher Games will have retired at least three of the thirteen instances from the 2026-07-27 cohort.
The basis for the first half: #1 leads the next-largest row by 23% on window impressions and has held the top position since the account opened. The interesting failure mode is #1 fatiguing — it is a single playable end card that has carried the account since day one, and playables fatigue.
(An earlier version of this article predicted that instance #3 would overtake #1, based on a daily rate computed by dividing each row's 30-day window impressions by its full age. That divisor is invalid for any asset older than the window, and this account does not support a daily rate at all — see the section on why there is no intensity column.)
The basis for the second half: this account has already demonstrated it retires assets (instance #14, killed at twelve days), and thirteen simultaneously-launched instances will not all survive a fatigue cycle. If all thirteen are still live on 2026-10-31, the "never retires" posture seen in the mature fleets in this series has arrived here too, and that would be the more interesting finding.
We will re-pull and report either way.
How to reproduce this teardown
- Deduplicate on asset fingerprints before you count anything. Group the rows by
videoFpandplayHtmlFp. Here that turns "thirty creatives" into twelve videos and nine playables, and "sixteen 30-second creatives" into seven files. Every count-based conclusion changes; no impression total does. - Pull the fleet sorted by impressions, then re-sort by first-seen date. The 2026-07-27 salvo and the nine-day pause are invisible in the impression-ranked view. Build order is where intent lives.
- Separate rows by store listing before computing anything. Check
appList[].idon every row. If a title has both an iOS numeric ID and an Android package, treat them as two fleets. Averaging across them produced no correct number in any of the seven listings compared above. - Compute impressions per placement per row, then look at the distribution shape. A single tight band means undifferentiated buying. Two non-overlapping bands, as here, means two inventory types.
- Before computing any daily rate, check window coverage. The
impressionfield is a rolling 30-day figure. Compute what share of delivery comes from rows that were live for the entire window; below roughly 60%, drop the rate column, because you would be averaging assets measured over different exposures. This account sits at 46.5% and gets no rate column. Dividing by full asset age — the naive version — is wrong in every case and here inverts the ranking. - Check last-observed dates on every row, and note the dates of any retirements. Royal Smash!'s single retirement date lines up exactly with its largest launch day, which is how the test-and-replace loop became visible.
- Verify the ranking-chart row against the creative data by app ID, not by name. The chart row for this title carries
productId6780891673, which matches the iOS ID on 24 of the 30 rows. Matching on title text alone is unreliable — the next teardown in this series covers a title whose store listing and ad creatives use two different product names.
Methodology and data notes
- Source: AdMapix creative search and ranking APIs, queried 2026-08-19, country filter
US, sorted by impressions descending, sample size 30 rows attributable to Cypher Games. - Measurement window (important): the
impressionfield returned by this API is a rolling 30-day figure, not a lifetime total. All impression figures in this article are for the window 2026-07-20 → 2026-08-19 (verified: an explicit query for those dates returns values identical to the default query, row for row). Pulling the same rows with a wider window returns substantially larger numbers. Wording such as "carries", "delivers" and "runs at" throughout refers to this 30-day window; nothing here is a lifetime cumulative figure. This article publishes no daily rates. The test is what share of window delivery comes from rows live for the entire window: here that is 46.5% (11 of 30 rows), below the ~60% threshold at which a rate carries meaning, so the column was dropped. The reasoning has its own section in the body. - Rows are ad instances, not production assets. Each row is a distinct delivery record with its own impressions, placements and date range. Deduplicating on the
videoFpandplayHtmlFpasset fingerprints, the 30 rows resolve to 12 distinct videos and 9 distinct playables. Impressions are reported per row and are not double-counted, so all impression totals here are unaffected; every count of "how many things were made" in this article is stated in asset terms and labelled as such. - Sampling boundary: this is the top 30 rows by impressions. Cypher Games' full measurable US footprint for this title extends well beyond that into a long tail of very low-impression rows; the top 30 carry the overwhelming majority of delivery, but the row count here is a sample size, not a fleet census.
- Entity resolution: the download-chart row used here reports
productId6780891673and publisherCypher Games, which matches the iOSappList[].idon 24 of 30 sampled rows. The remaining six carrycom.cyphergames.royalsmash(developer ID175569991), also published by Cypher Games. Both listings are treated as the same product and reported separately throughout. No figures in this article were joined on app name. - "Days live" is the span between first-observed and last-observed timestamps. Twenty-nine rows showed a last-observed date equal to the pull date and are treated as live; row #14 last recorded on 2026-07-27 and is treated as retired, with its days-live measured first-to-last.
- "Placements" (
showCnt) counts recorded creative appearances, not unique users or unique publishers. Impressions-per-placement is a distribution-shape indicator, not a frequency metric — the absolute value is only meaningful when compared across creatives measured the same way. - Impressions are third-party estimates, not publisher-reported figures and not spend. They support relative comparison; they are not absolute delivery counts and should not be converted to dollar figures.
- Download figures are US-region estimates for the current ranking period. The +260.93% is a period-over-period change in that estimate, calculated by the ranking provider against a prior-period figure of 163,774. It is not a user-growth, revenue, or install-quality measure.
- Duration is taken from the
videoTimeSpanfield. Rows with no value recorded are playable or static units and are labelled as such rather than assigned a length. - Comparison figures for Pixel Flow!, Smash Fest! and Castle Busters were pulled on the same date with the same method and sample sizes of 10 per keyword; each is keyed to the app ID observed on the creative, not to the chart.
- Store information for this title is available on the App Store listing. Genre-comparison publisher information for Voodoo is available at voodoo.io.
- Coverage is limited to creatives observable through third-party ad monitoring. A fleet may contain assets not captured here.
Frequently Asked Questions
How many ads is Royal Smash! running in the US? Thirty measurable ad instances as of 2026-08-19, totalling 1,063,337,540 impressions across 1,813,057 placements, with twenty-nine of the thirty still live on that date. Those thirty instances resolve to only twelve distinct video files and nine distinct playable end cards — 21 production assets, not 30. The entire fleet was built in 47 days; the oldest instance was first observed on 2026-07-03.
What is Royal Smash!'s best-performing ad creative? A playable unit first seen 2026-07-03, carrying 219,803,951 impressions across 214,755 placements — 20.7% of the fleet. It was the first asset the account ever ran and is still the highest-volume one. This article publishes no per-day comparison: only 46.5% of window delivery comes from rows exposed to the full measurement period, which is too low for a daily rate to carry meaning.
Why did Royal Smash!'s downloads increase 260.93%? US downloads rose from 163,774 to 591,117 period-over-period, an increase of 427,343. Over the same window Cypher Games built an ad fleet from zero to thirty ad instances — 21 distinct files — and 1.06 billion impressions. The figure is a period-over-period change in a third-party download estimate; it does not measure revenue, retention, or install quality, and no cost data is publicly observable.
What is the difference between Royal Smash!'s iOS and Android ad delivery?
The Android listing takes 53.8% of the account's placements and returns 11.7% of its impressions. Median impressions per placement is 1,353 on the iOS listing (6780891673) versus 122 on the Android package (com.cyphergames.royalsmash) — an 11.1x gap, with zero overlap between the two groups across all thirty instances. The two listings should be analysed as separate media plans.
How long are Royal Smash!'s ads? Sixteen of thirty ad instances are exactly 30 seconds, but those sixteen instances resolve to only seven distinct video files — one file appears in five instances, another in four, a third in three. Nine instances record no video duration and are playable or static units. Three instances are 60 seconds, one is 45, one is 15. The 60-second files were shipped in the account's opening week and the format was never repeated, suggesting 30 seconds became the house length after early testing.
Has Cypher Games retired any Royal Smash! ads? One, out of thirty. A static Android-listing instance ran from 2026-07-15 to 2026-07-27 — twelve days — and was switched off on the same day four replacement Android instances launched. Every other instance the account has ever run was still live on 2026-08-19.
What happened on 2026-07-27? Thirteen ad instances entered the fleet on that single day, 43% of the account, but they are only five new video files and one new playable. Two of the three playables used that day had already been running since 2026-07-23, and the largest row in the cohort is a static image with no video or playable fingerprint. The cohort carries 365,969,662 impressions — 34.4% of window delivery — which is less than the 421,134,848 carried by the six instances launched in the account's opening week. Eleven of the thirteen instances are exactly 30 seconds long, resolving to four distinct videos.
Want to see whether a competitor's fleet is one media plan or two? Per-creative impressions, placement counts, store-listing IDs, first-seen and last-seen dates, duration and playable attachment are all live in AdMapix, filterable by country, publisher and app ID. Create a free account to run this teardown on any title in your category, or see plans for full historical access.
Data source: AdMapix third-party ad intelligence estimates, United States, retrieved 2026-08-19. Impression and download figures are modelled estimates for comparative analysis and are not publisher-reported. Figures change as new creatives enter rotation. </content> </invoke>
Related Reading
- Ad strategy teardowns (series index) — every teardown in the series, in publication order
- Mobile game ads guide: formats, examples and research — the format matrix, research workflow and KPI guardrails every teardown in this series applies
- Century Games — one publisher, three titles, playable vs video decided between them
- Smash Fest! — playable creatives in the observed US launch sample
- Pixel Flow! — one playable took 2.3B impressions in 30 days
Turn these observations into your next creative study
Open the creative library and select samples for your market, network and research question.
Related Articles
Magic Tiles 3 Ad Strategy in 2026: Two Store Listings, Two Completely Different Advertising Machines — and an August Fleet Swap That Is Half the Size It Looks
A fingerprint-deduplicated teardown of Amanotes' US user acquisition for Magic Tiles 3. Thirty ad instances carry 197,841,786 impressions in a 30-day window, but resolve to just seventeen videos and four playables — split across two systems sharing nothing: an iOS buy of six videos running up to 443 days at 131 impressions per placement, and an Android lab of eleven videos and four playables at 2,685. The early-August swap retired four assets and launched three, not eight and five.
Voodoo UA Playbook 2026: Paper.io 2 and Hole.io Are Not Being Advertised — They Are Being Harvested
A publisher-level teardown of Voodoo's four US chart titles. Paper.io 2, Hole.io, Castle Busters and Mob Control together carry 129 million impressions from 263 video assets — and produce 1.9 million monthly downloads on 7.2% of the window impressions a single competing puzzle title carries. Only 9.8% of Paper.io 2's impressions come from creative made in the last 90 days.
Bus Traffic Fever! Ad Strategy in 2026: One Asset Carrying 66% of a 3.0-Billion-Impression Fleet — and the Second Name Nobody Notices
A creative-level teardown of GOODROID's US user acquisition for Bus Traffic Fever!. Twenty-two ad instances carry 3,004,140,963 impressions, all still live after 139 days, and one asset alone carries 66.0%. The twenty-two instances resolve to just nine videos and eight playables. The title also runs under a second name — Bus Rush Fever! — on its Android listing, which is where most competitive analyses of this product go wrong.