
MONOPOLY GO! Ad Strategy in 2026: Inside a 7-Billion-Impression Creative Machine
We pulled MONOPOLY GO!'s top 15 US ad creatives from the AdMapix index: 7.17 billion model-estimated impressions, a 22-second video sweet spot, a synchronized creative reset that retired six ads in 31 minutes, and a single-creative intensity roughly 2,000x higher than Royal Match. Full teardown with tables, real creative frames, and a competitor comparison.
Last updated 2026-09-01 — the falsifiable prediction made in this piece has now been checked against fresh data. Jump to Track B Update. MONOPOLY GO! is not on the US download chart — and it doesn't need to be. As of August 7, 2026, the game's top 15 US ad creatives alone account for 7.17 billion model-estimated impressions in the AdMapix index, led by a single 28-second video that collected 1.85 billion impressions in 67 days — roughly 27.6 million impressions every day it ran. Then, on July 29 at around 2 AM, Scopely retired six of those creatives — including its two biggest hitters — inside a 31-minute window.
That combination — extreme per-creative intensity plus surgical rotation discipline — is the whole playbook. This teardown reconstructs it from observable ad data: what Scopely ran, how long each creative lived, what specs repeat, and how the strategy compares with Royal Match and Coin Master. If you want to run the same queries live, create a free AdMapix account and search the app yourself.
TL;DR — Executive Summary
- 7.17 billion model-estimated impressions across MONOPOLY GO!'s top 15 US creatives, observed in the AdMapix index as of 2026-08-07.
- The #1 creative earned 1.85 billion impressions in 67 days (2026-05-23 → 2026-07-29), or ~27.6M/day — the highest single-creative intensity we measured in this genre.
- All top 15 are videos. Not one static image or playable leads the board. Median duration: 22 seconds; 9 of 15 fall in the 21–30s band.
- On July 29, six creatives were retired within 31 minutes (01:57–02:28), taking 4.47 billion impressions' worth of proven ads out of rotation at once — a synchronized creative reset, visible in the raw timestamps.
- 9 of the 15 were still live on August 7, including all six creatives launched in a single batch on June 18.
- Versus competitors, the contrast is stark: Royal Match's top US creative runs at ~13K impressions/day for 221 days; MONOPOLY GO!'s runs at ~27.6M/day for 67 days — a ~2,000x intensity gap, in opposite directions on longevity.
Where MONOPOLY GO! Sits in the US Market Right Now
Start with what the US download chart looked like on the day we pulled the data (AdMapix general top chart, all categories, daily window):
| # | App | Developer | Est. downloads | Growth |
|---|---|---|---|---|
| 1 | TikTok | Bytedance | 6,511,608 | -4.08% |
| 2 | ChatGPT | OpenAI | 4,957,231 | -19.32% |
| 3 | CapCut | Bytedance | 3,068,563 | -12.68% |
| 4 | Netflix Game Controller | Netflix | 2,588,860 | +6.97% |
| 5 | YouTube | 2,475,852 | -29.51% | |
| 6 | WhatsApp Messenger | WhatsApp Inc. | 2,469,340 | -24.53% |
| 7 | Instagram, Inc. | 2,421,928 | -12.44% | |
| 8 | Meowdoku! | Oakever Games | 2,343,787 | -15.53% |
| 9 | Depop | Depop Ltd | 2,041,602 | +23.44% |
| 10 | Smash Fest! | Flow Games | 1,990,869 | +51.75% |
| 11 | PineDrama | Bytedance | 1,902,947 | +112.85% |
| 12 | Roblox | Roblox Corporation | 1,866,711 | -10.97% |
MONOPOLY GO! is nowhere on this list. The organic chart belongs to super-apps and to launch-spike newcomers like Smash Fest! (+51.75%) and PineDrama (+112.85%). A three-year-old board game cannot win that chart organically — so Scopely doesn't compete there. It buys its distribution directly, at a scale the chart never shows. That invisible layer is exactly what ad intelligence exists to expose.
The chart's two visible games are worth a second look precisely because they contrast with our subject. Meowdoku! and Smash Fest! are in their launch spike — the brief phase where novelty, featuring, and early buzz carry a title onto the chart without proportionate spend. That phase ends for every game, usually within weeks. What follows is the phase MONOPOLY GO! has occupied for three years: chart-invisible, spend-sustained, and — as the next sections show — operated with a rigor that launch-phase games rarely need. The download chart is a snapshot of games entering the market; the ad index is where you watch games staying in it.
 MONOPOLY GO! (Scopely, Inc., App Store ID 1621328561) — absent from the organic top chart, dominant in paid reach.
MONOPOLY GO! is also one of the advertisers profiled in our State of Mobile Advertising H2 2026 report, which sets single-advertiser behaviour against monthly creative volume, vertical shares, and the H1 2026 download chart.
The Revenue Chart Tells the Same Story
The revenue side of the general chart makes the point even harder. Here is the US revenue top 10 from the same pull (AdMapix estimates; we report ranks and growth only, since absolute revenue values in this dataset are an internal index rather than audited dollars):
| # | App | Developer | Revenue growth |
|---|---|---|---|
| 1 | Instagram, Inc. | +420.75% | |
| 2 | Meta | +416.16% | |
| 3 | Gmail | -30.99% | |
| 4 | WhatsApp Messenger | WhatsApp Inc. | -32.15% |
| 5 | Discord | Discord Inc. | +12.73% |
| 6 | Google Maps | -53.31% | |
| 7 | Snapchat | Snap, Inc. | +418.22% |
| 8 | YouTube | -71.38% | |
| 9 | Google Chrome | -41.36% | |
| 10 | -38.28% |
Not a single game appears in the general revenue top 10. Every row is a platform — social networks, messaging, Google's estate. The apps that actually monetize players hardest, MONOPOLY GO! among them, operate entirely below this aggregate radar. That's the structural reason ad intelligence matters for this category: the charts measure where attention arrives organically and where platform revenue concentrates, but the games economy runs on a third axis — purchased attention — that neither chart displays. The only public place that axis leaves footprints is the ad index we're about to read.
The Top 15 US Creatives: One Table, 7.17 Billion Impressions
Everything below comes from a single AdMapix query: creatives matching MONOPOLY GO!, US market, sorted by model-estimated impressions, pulled 2026-08-07. Days live = first seen → last seen in the index.
| # | Duration | First seen | Last seen | Days live | Est. impressions | Shows tracked | Status |
|---|---|---|---|---|---|---|---|
| 1 | 28s | 2026-05-23 | 2026-07-29 | 67 | 1,847,295,849 | 219,700 | Retired |
| 2 | 22s | 2026-05-23 | 2026-07-29 | 67 | 1,017,734,902 | 119,221 | Retired |
| 3 | 30s | 2026-06-25 | 2026-08-07 | 43 | 592,372,579 | 71,043 | Live |
| 4 | 22s | 2026-05-23 | 2026-07-29 | 67 | 590,453,213 | 70,230 | Retired |
| 5 | 60s | 2026-06-16 | 2026-07-29 | 43 | 415,664,613 | 49,581 | Retired |
| 6 | 13s | 2026-06-18 | 2026-08-07 | 50 | 414,593,206 | 49,726 | Live |
| 7 | 27s | 2026-06-25 | 2026-08-07 | 43 | 325,874,520 | 38,956 | Live |
| 8 | 22s | 2026-06-25 | 2026-07-29 | 34 | 320,527,462 | 38,183 | Retired |
| 9 | 34s | 2026-06-18 | 2026-08-07 | 50 | 304,199,951 | 36,481 | Live |
| 10 | 21s | 2026-06-21 | 2026-07-29 | 38 | 279,298,454 | 33,620 | Retired |
| 11 | 30s | 2026-06-18 | 2026-08-07 | 50 | 254,838,857 | 30,363 | Live |
| 12 | 15s | 2026-06-06 | 2026-08-07 | 62 | 236,728,627 | 28,373 | Live |
| 13 | 22s | 2026-06-18 | 2026-08-07 | 50 | 207,509,223 | 24,679 | Live |
| 14 | 8s | 2026-06-18 | 2026-08-07 | 50 | 185,035,565 | 22,233 | Live |
| 15 | 29s | 2026-06-18 | 2026-08-07 | 50 | 174,063,805 | 20,813 | Live |
Totals: 7,166,190,826 model-estimated impressions and 853,202 tracked show events across fifteen videos. Three structural facts jump out of this table before any interpretation: every entry is a video; every entry was first seen between May 23 and June 25 (a ~5-week window); and the board splits cleanly into a retired cohort (all ending July 29) and a live cohort (all still running August 7). Each of those facts gets its own section below.
Creative #1: 1.85 Billion Impressions in 67 Days
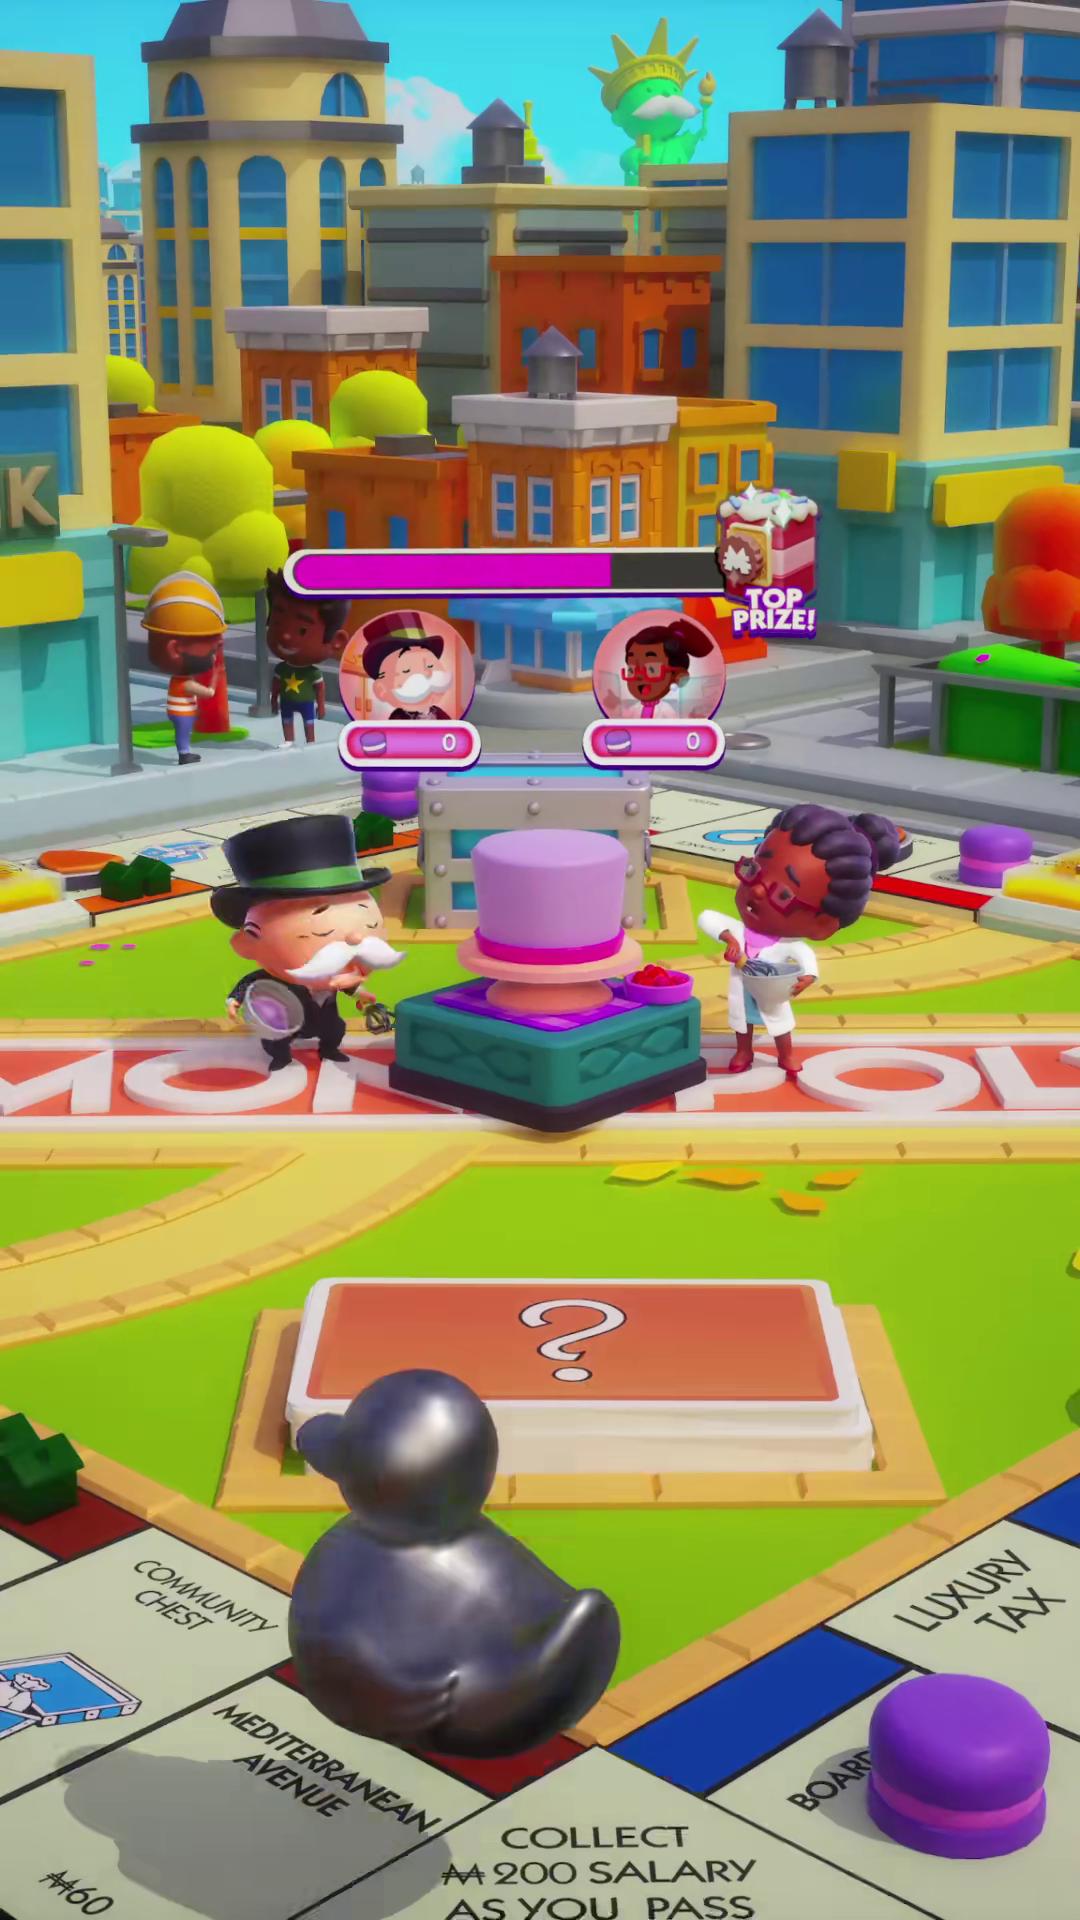 Creative #1 — 28-second video, first seen 2026-05-23, retired 2026-07-29. 1.85B model-estimated impressions in 67 days: ~27.6M per day, every day.
The flagship creative deserves its own math. 1,847,295,849 impressions over 67 days is 27.6 million impressions per day, sustained for more than two months. For scale: that single ad's daily reach exceeds the daily download volume of TikTok, the #1 app on the US chart (6.5M/day), by more than 4x — impressions and downloads aren't the same currency, but it calibrates how loud one ad can be.
The tracked copy on this creative is the same line that appears across the entire titled set: "Hit GO! Roll the dice! Earn MONOPOLY m…" (the index truncates the tail). Note what that implies: Scopely did not differentiate its top creatives by copy. One store-style line serves the whole fleet, and differentiation happens entirely in the video content. When one line has to serve 7 billion impressions, the words are doing brand consistency, not persuasion — the first three seconds of footage do the persuading.
A 28-second runtime is also a deliberate choice. It is long enough to show a full mechanic loop (roll → move → collect → upgrade) and short enough to survive skippable placements. As the duration table later shows, this isn't an accident — it's the center of the spec distribution.
The Billion-Impression Pair That's Actually One Video
Rows #2 and #4 in the table look like separate creatives — 1.02B and 590M impressions respectively. The index says otherwise: both entries reference the same underlying video file (identical content fingerprint, 22 seconds, both first seen 2026-05-23, both retired 2026-07-29). Combined, that one video accounts for 1.61 billion impressions across two tracked placements.
 The same 22-second video runs as two tracked creative entries — 1.02B + 590M = 1.61B combined impressions. Entry #4 also carries a playable companion.
Two practical lessons hide in this duplication. First, when you audit a competitor, aggregate by video fingerprint, not by creative ID — counting these as two ads understates the winner's true weight by almost half. Second, entry #4 carries a playable ad companion alongside the video (the only playable attachment in the top 15), which suggests Scopely tested an interactive end-card variant of its best asset rather than a standalone playable — a low-risk way to trial a format on top of proven footage.
The July 29 Reset: Six Creatives Retired in 31 Minutes
Sort the retired cohort by their final timestamp and a pattern appears that no dashboard summary would surface:
| Creative | Est. impressions | Last seen (2026-07-29) |
|---|---|---|
| #4 (22s) | 590,453,213 | 01:57 |
| #1 (28s) | 1,847,295,849 | 02:17 |
| #2 (22s) | 1,017,734,902 | 02:17 |
| #5 (60s) | 415,664,613 | 02:21 |
| #8 (22s) | 320,527,462 | 02:21 |
| #10 (21s) | 279,298,454 | 02:28 |
Six creatives — carrying a combined 4.47 billion impressions — all stopped between 01:57 and 02:28 on the same night. That's not fatigue decay, where ads fade out one by one over weeks. That's a scheduled, synchronized reset: someone (or some automated rule) turned off the entire May–June hero cohort in one operation, while the June 18 batch kept running untouched.
The discipline is the story. The #1 creative was still averaging tens of millions of daily impressions when it was cut. Most UA teams ride a winner until performance visibly collapses; the data here shows Scopely retiring winners on schedule, before the decay is visible from outside. If you track competitors and only check monthly, you'd see "creative churn." Checking daily timestamps shows you it was one decision, executed in half an hour.
There's a benchmark buried in this for everyone else. Fatigue thresholds are usually set from internal data — you watch your own CPI creep and call time when it hurts. A synchronized reset gives you the same threshold from the outside, set by an advertiser with vastly more data than you have: the biggest spender in the genre treats ~60–67 days as the ceiling for a hero video at full intensity. If your creatives die at 20 days, the gap is diagnostic — either your concept has less headroom or your audience is narrower and saturating faster. Either way, you now have a number to argue against, published in someone else's timestamps.
The June 18 Cohort: Six Ads, One Launch, All Still Running
The other half of the board tells the succession story. Six of the fifteen creatives were first seen on a single day — June 18 — and all six were still live on August 7, 50 days later, with a combined 1.54 billion impressions:
| Creative | Duration | Est. impressions | Status at 08-07 |
|---|---|---|---|
| #6 | 13s | 414,593,206 | Live |
| #9 | 34s | 304,199,951 | Live |
| #11 | 30s | 254,838,857 | Live |
| #13 | 22s | 207,509,223 | Live |
| #14 | 8s | 185,035,565 | Live |
| #15 | 29s | 174,063,805 | Live |
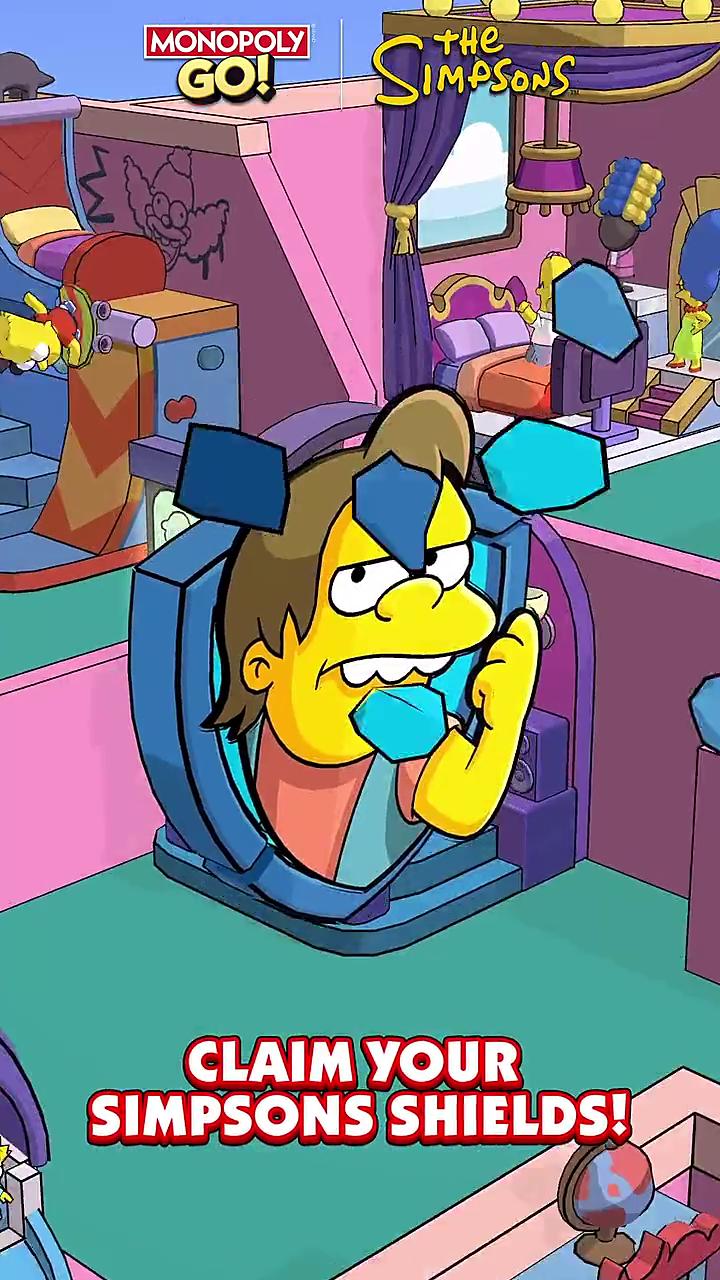 Creative #6 from the June 18 batch — a 13-second cut, 414M impressions in 50 days and still live. The batch launched six durations at once: 8s, 13s, 22s, 29s, 30s, 34s.
Look at the durations as a set: 8, 13, 22, 29, 30, and 34 seconds. That's not six ads — that's one duration experiment, shipping a spread from bumper-length to extended-cut on the same day and letting delivery decide. Notably, these six entries carry no title/copy metadata in the index at all, unlike the May cohort — consistent with a different placement mix for the new generation.
Put the two cohorts together and the rotation model is legible: launch a batch → let it prove itself alongside the incumbents → retire the old generation in one sweep → repeat. The June 18 batch had 41 days of overlap with the May heroes before the July 29 reset handed it the stage.
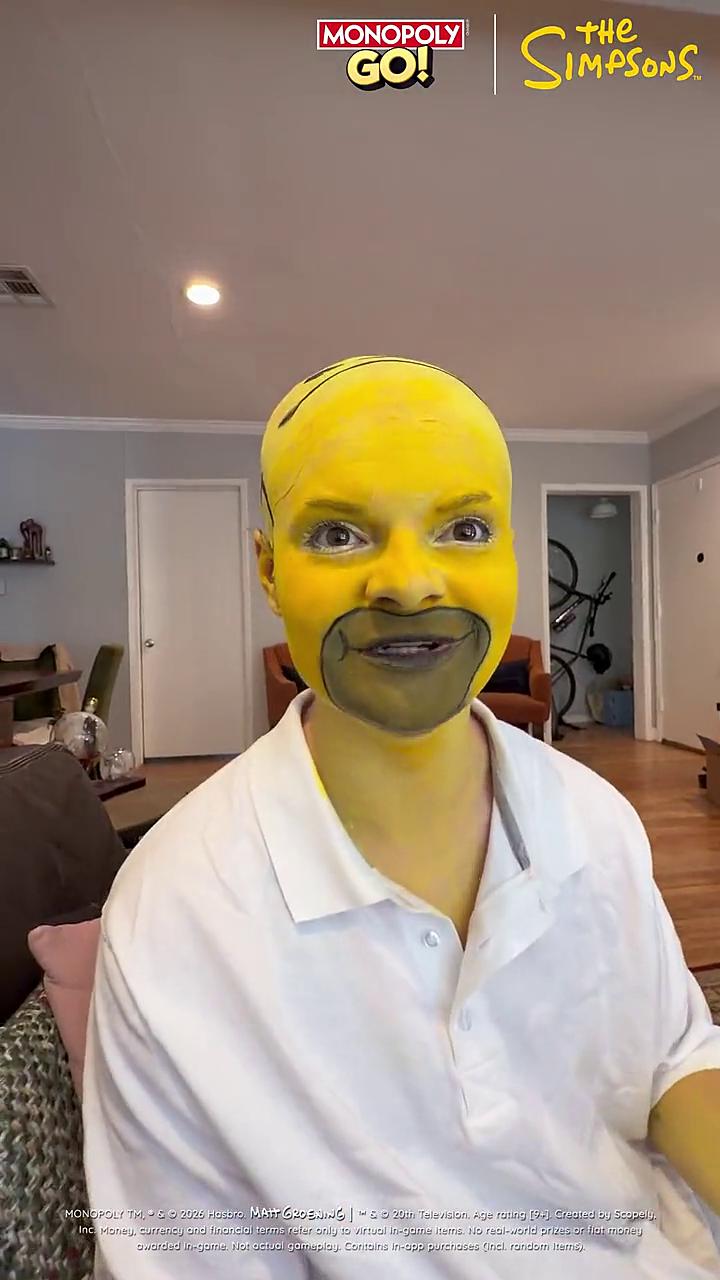 Creative #9 (34s) — the long end of the June 18 duration experiment. 304M impressions in 50 days.
Track B Update (2026-09-01): The Prediction, Checked
On 2026-08-07 this piece closed with a falsifiable claim:
If Scopely's operating rhythm holds — generations launched roughly five to six weeks apart, hero creatives capped near the 60-day mark — then the June 18 cohort, which turned 50 days old on August 7, is due for its own reset in late August or early September, and a successor batch should surface in the index before that happens.
Twenty-five days later, here is the check. Half of it was right, and the half that was wrong is the more interesting half.
What actually happened
| Prediction | Verdict |
|---|---|
| A successor batch surfaces before the reset | ✅ Correct — 50 new creatives first seen in August |
| The June 18 cohort gets reset in late Aug / early Sep | ❌ Wrong — all 20 are still running at day 75 |
| Hero creatives capped near 60 days | ❌ Wrong — the cap does not exist |
The June 18 cohort did not just survive. Not one of its creatives was retired.
| June 18 cohort (US, measured 2026-08-02 → 2026-09-01) | |
|---|---|
| Creatives first seen 2026-06-18 | 20 |
| Still live on 2026-09-01 | 20 |
| Retired during August | 0 |
| Days running | 75 |
| Combined impressions in this window | 779.9M |
The original article named six of these by duration — 8s, 13s, 22s, 29s, 30s, 34s. Every one of those durations is still in rotation.
The part that makes this a real finding
August was not a quiet month. Scopely retired 43 creatives during it, in exactly the synchronized style the original teardown described:
| Date | Retired | Which generation they came from |
|---|---|---|
| 2026-08-07 | 10 | Jul 16 (×6), Jul 15 (×2), Jul 17, Jul 14 |
| 2026-08-14 | 7 | Jul 3 (×3), Jul 16 (×2), Jul 15, Jun 17 |
| 2026-08-17 | 12 | Jul 29 (×3), Jul 30 (×2), Jul 22 (×2), Jul 27 |
| 2026-08-26 / 08-29 | 8 | mixed May–July |
Every single one came from a July cohort. Zero came from June 18.
So the reset machinery ran on schedule — it just aimed somewhere else. Creatives launched in late July were retired after two to four weeks, while the June 18 batch passed day 75 untouched. The newer cohorts are dying faster than the older one.
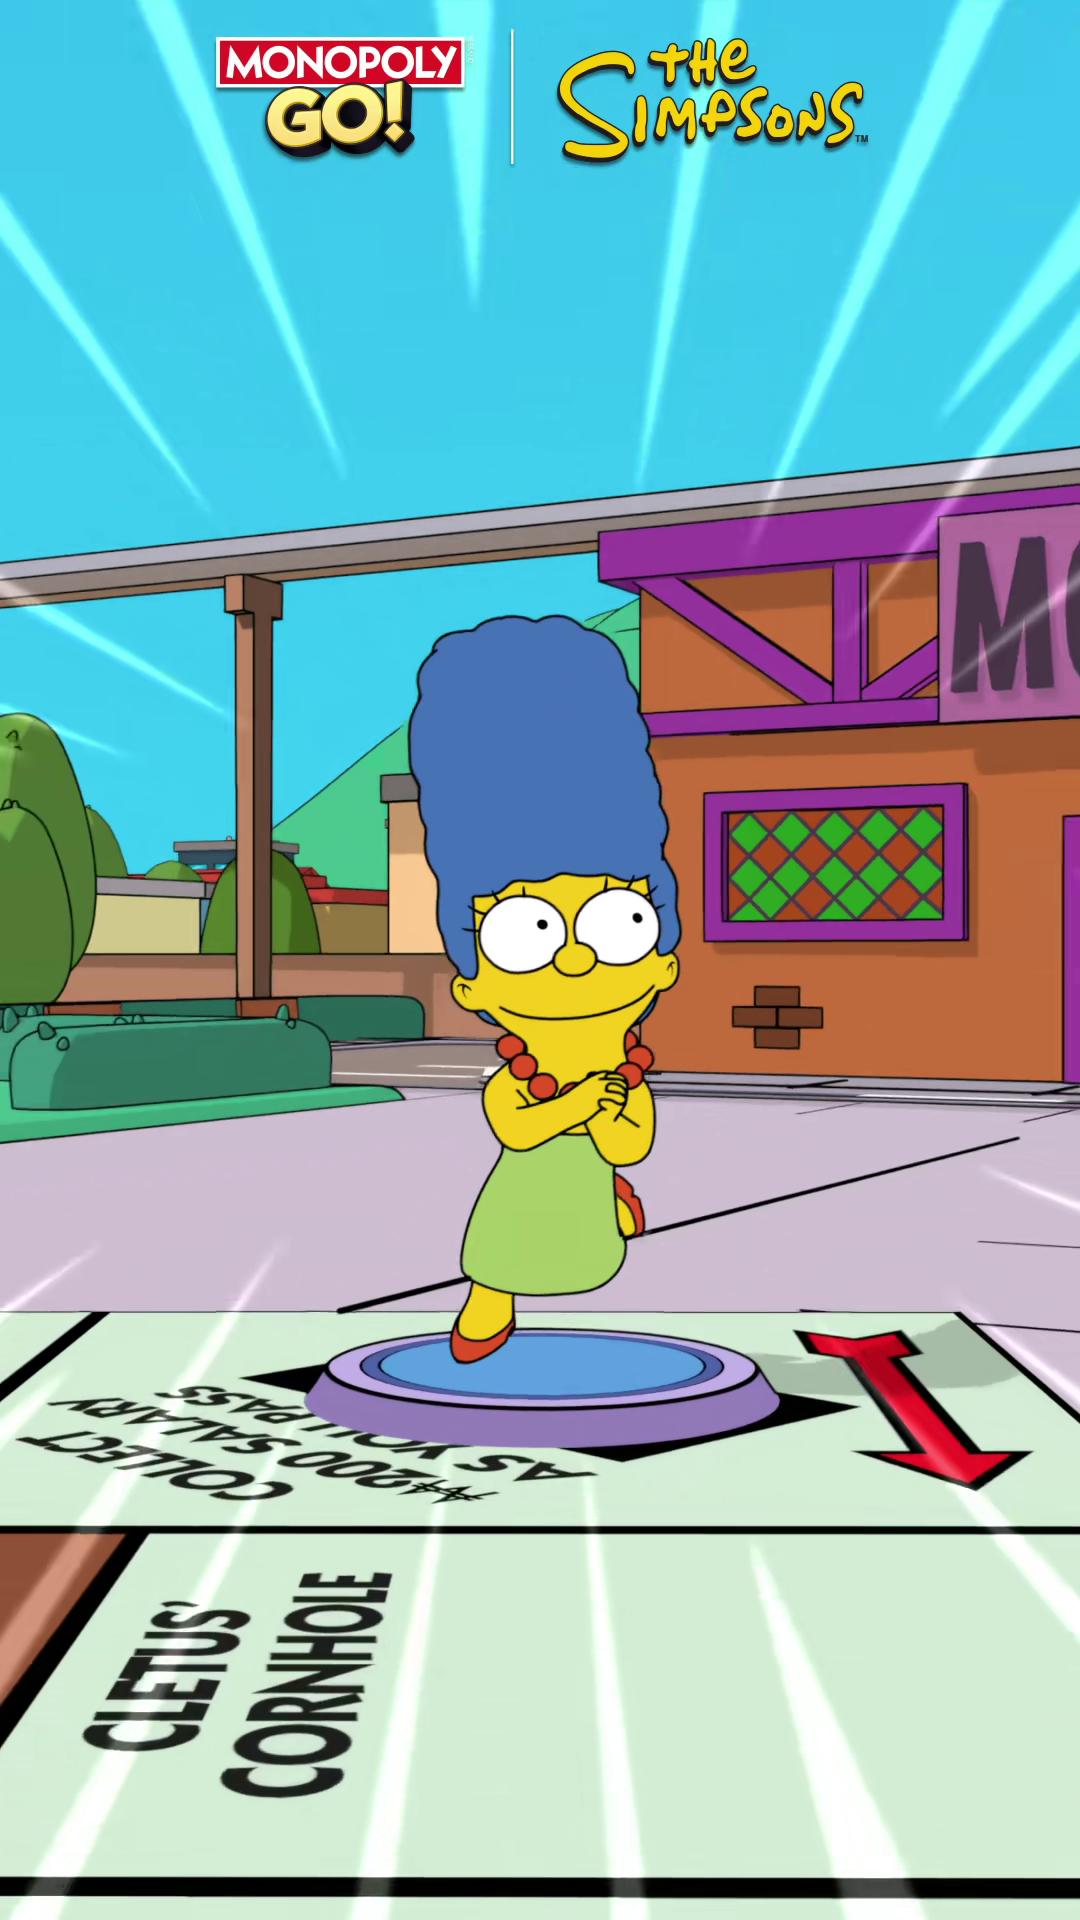 A 27-second cut from the June 18 batch. On 2026-09-01 it is the single highest-delivery US creative in the index for this app — 409.6M impressions in the 30-day window, still running at day 75.
Why I trust the negative result
A "nothing happened" finding is exactly where a measurement error hides, so the method was checked in the opposite direction first: can this data even detect a reset?
Re-running the July 29 event on a 92-day window returns it clearly — and bigger than the original article reported:
- 23 creatives stopped on 2026-07-29, timestamps clustered between 01:24 and 02:35
- The original piece said six, because it only looked at the top 15 by impressions
Same field, same query shape, same app. It resolves a synchronized retirement down to the minute when one occurs. Applied to the June 18 cohort at the end of August, it returns nothing — because nothing happened.
The corrected model
The original read was generational rotation: launch a batch, let it prove itself, sweep the old generation, repeat. The August data does not support that. What it supports is a two-tier structure:
- An evergreen core. The June 18 cohort, plus older survivors first seen on 2026-05-23 and 2026-06-01, still delivering. These are not being cycled out on a clock.
- A high-churn test layer. The July and August batches, launched in waves and retired in two to four weeks. The July 29 sweep took out creatives first seen on July 22 — seven days old.
Under that model the "60-day cap" was never a rule; it was an artifact of reading one sweep. The evergreen creatives are not on a timer at all, and the short-lived ones are far shorter-lived than 60 days.
One thing the cohort did lose is intensity. The June 18 creatives are still running, but at a fraction of their former delivery — they hold 2 of the current top 15 slots, down from 6 on August 7. Scopely did not retire them. It demoted them and kept them running, which is a cheaper decision than either killing or scaling a proven asset.
What to watch next
The revised prediction is narrower, and still falsifiable: if the two-tier model is right, the August cohorts will be gone before the June 18 cohort is. The August batches (50 creatives, 49 still live on 2026-09-01) should show heavy attrition through September while the June 18 survivors keep delivering at low intensity. If instead June 18 is swept while the August batch survives, the two-tier read is wrong and generational rotation was right all along, just on a longer clock.
Measurement note: figures are counts of creatives active in the 2026-08-02 → 2026-09-01 window, matched to MONOPOLY GO! by app id 1621328561 / com.scopely.monopolygo rather than by name — a keyword search for "MONOPOLY GO" returns other advertisers' creatives, which are excluded here. Impressions are modeled window estimates and are not comparable across differently-sized windows, so the August 7 and September 1 figures are not differenced anywhere above.
Lifecycle Analysis: What a 60-Day Survivor Looks Like
Three creatives in the top 15 crossed the 60-day mark:
| Creative | Duration | Days live | Est. impressions | Est. per day |
|---|---|---|---|---|
| #1 | 28s | 67 | 1.85B | ~27.6M |
| #2/#4 (one video) | 22s | 67 | 1.61B combined | ~24.0M |
| #12 | 15s | 62 (still live) | 236.7M | ~3.8M |
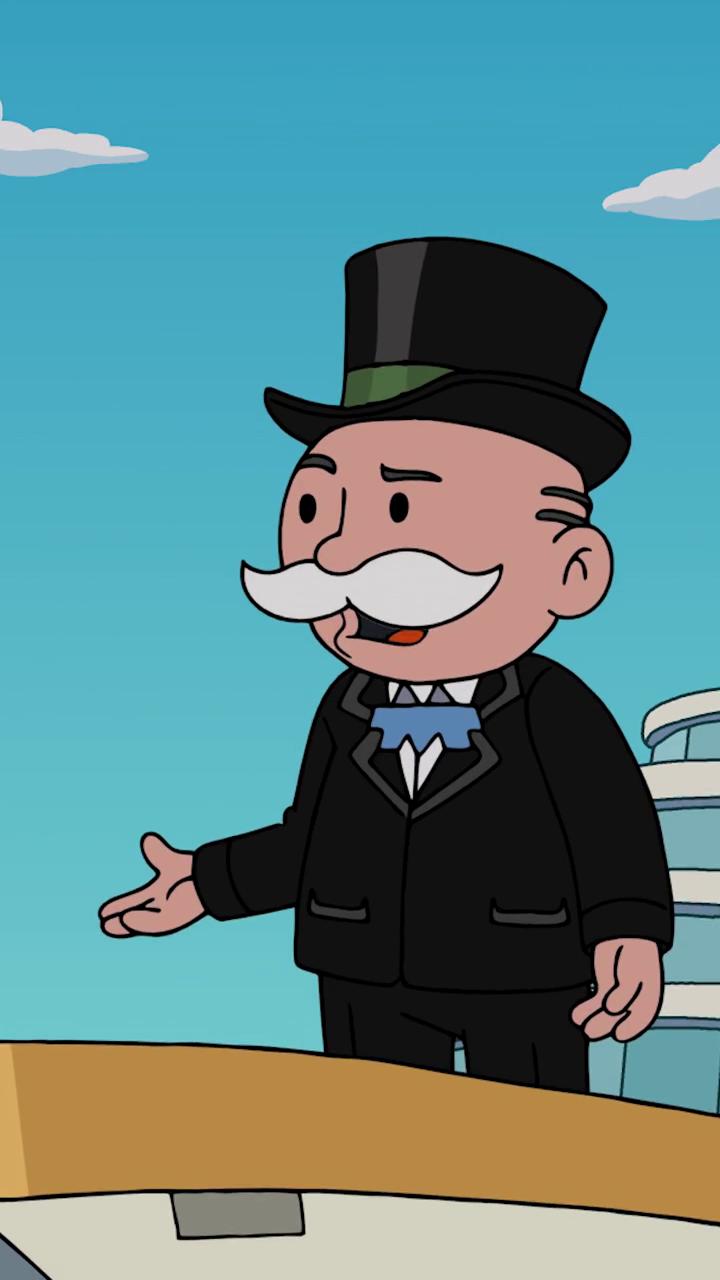 Creative #12 — first seen 2026-06-06, still live 62 days later. The longest-surviving creative that hasn't been reset.
The survivors share three observable traits. They are all short-to-mid videos (15–28s), they all launched as part of a cohort rather than solo, and none of them died of fatigue — the two 67-day creatives were killed by the July 29 reset while still at scale. In our data, creative lifespan at MONOPOLY GO! is not a performance outcome; it's a policy decision. That inverts the usual analysis: instead of asking "how long do their ads last?", the better question is "how long does Scopely let an ad last?" — and the answer appears to be roughly two months, regardless of remaining headroom.
For teams benchmarking against this: days-live is a stronger competitive signal than raw impressions. A creative that a disciplined advertiser keeps paying to run for 60+ days is, by revealed preference, a winner — the advertiser has better information than any external observer, and their budget is the confession.
Creative Specs: The 22-Second Sweet Spot
Duration distribution across the fifteen:
| Duration band | Creatives | Share | Impressions in band |
|---|---|---|---|
| ≤15s (8, 13, 15) | 3 | 20% | 836.4M |
| 21–30s (21, 22×4, 27, 28, 29, 30×2) | 10 | 67% | 5.61B |
| >30s (34, 60) | 2 | 13% | 719.9M |
The median creative is 22 seconds, the mode is 22 seconds (four creatives), and two-thirds of the fleet — carrying 78% of the impressions — lives in the 21–30 second band. The 60-second cut (#5) is the interesting exception: it earned 415M impressions in 43 days, proving the long format can scale, yet it was retired in the July 29 reset and nothing longer than 34s replaced it. Whatever the internal numbers said, Scopely's revealed verdict on 60-second ads was: not worth a second batch.
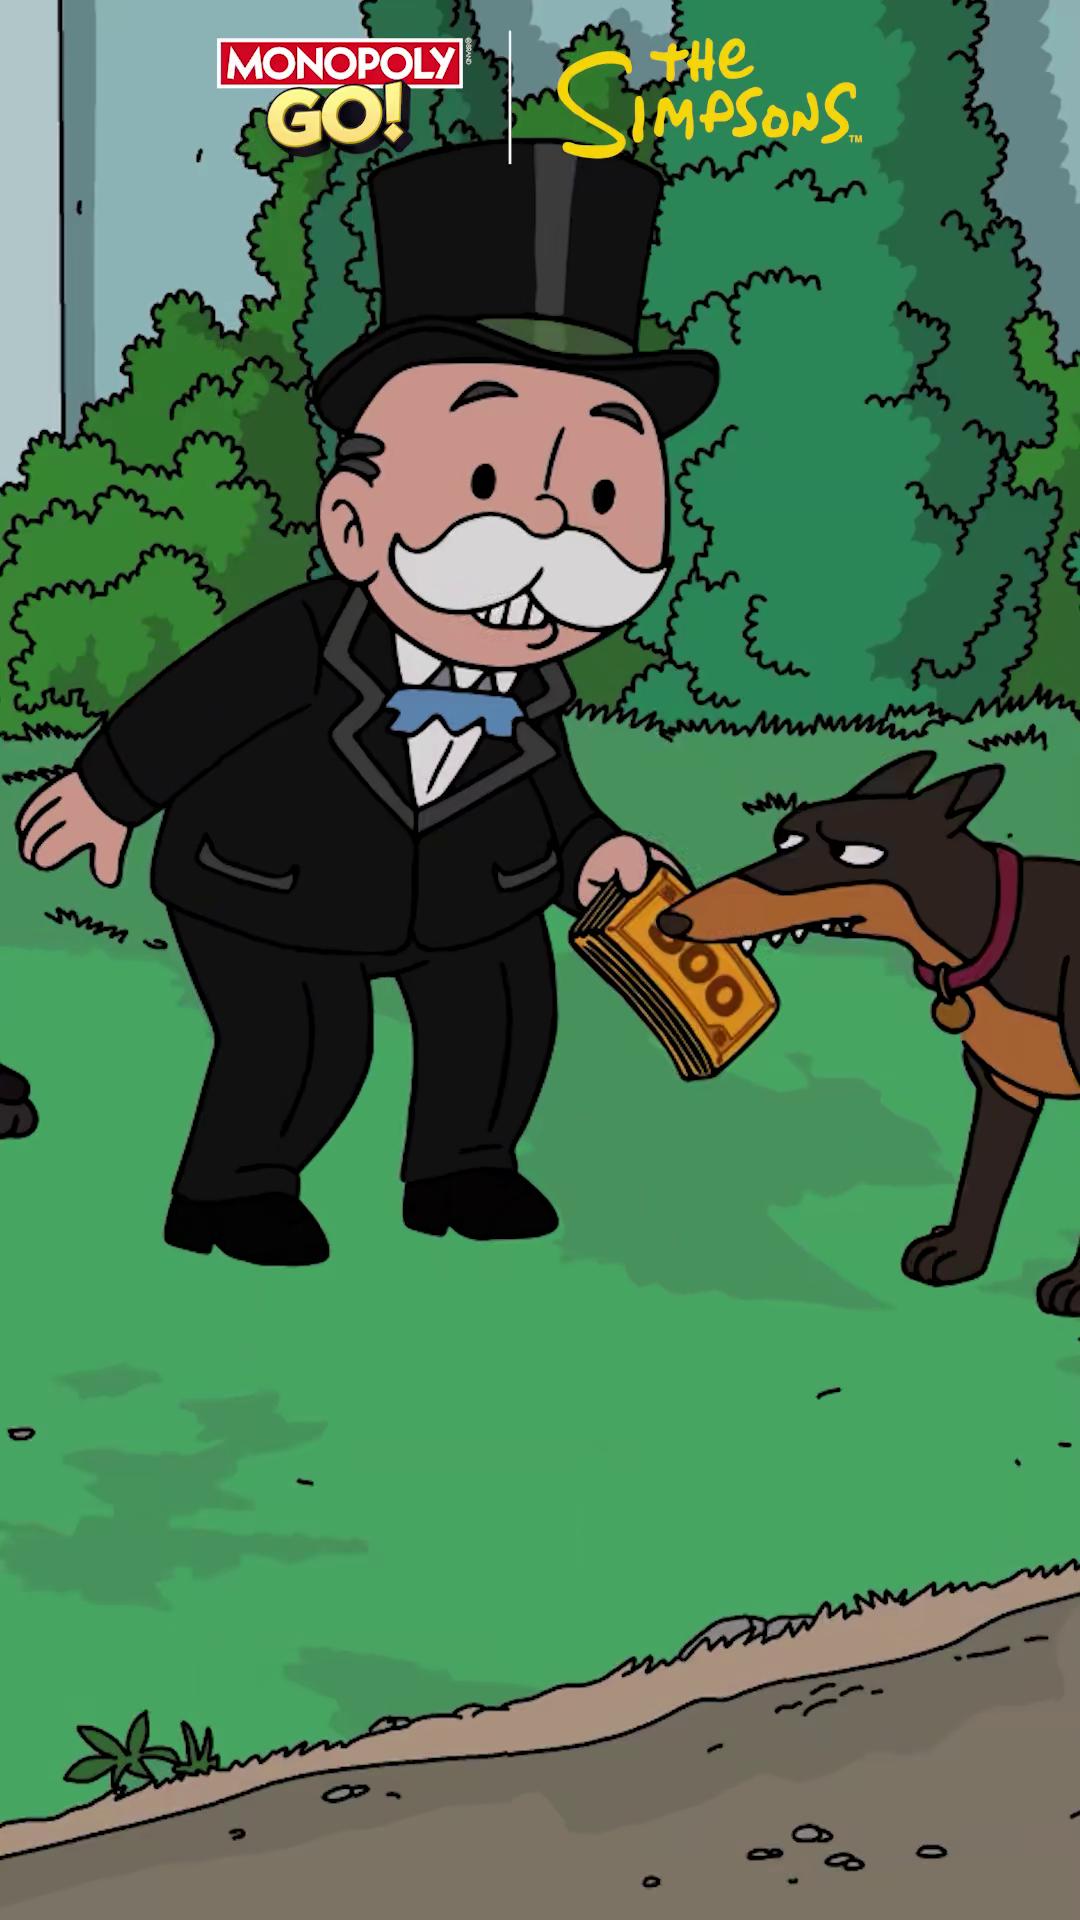 Creative #5 — the only 60-second cut in the top 15. 415M impressions in 43 days, then retired without a long-form successor.
Equally telling is what's absent. Zero static images and zero standalone playables in the US top 15 — for a game whose competitors (see below) lead with playables, MONOPOLY GO! commits its entire top-of-funnel to video, and reserves interactivity for one end-card experiment on its best asset. The 8-second cut (#14, 185M impressions) covers the bumper slot; verticals are covered by cohort variety rather than format variety.
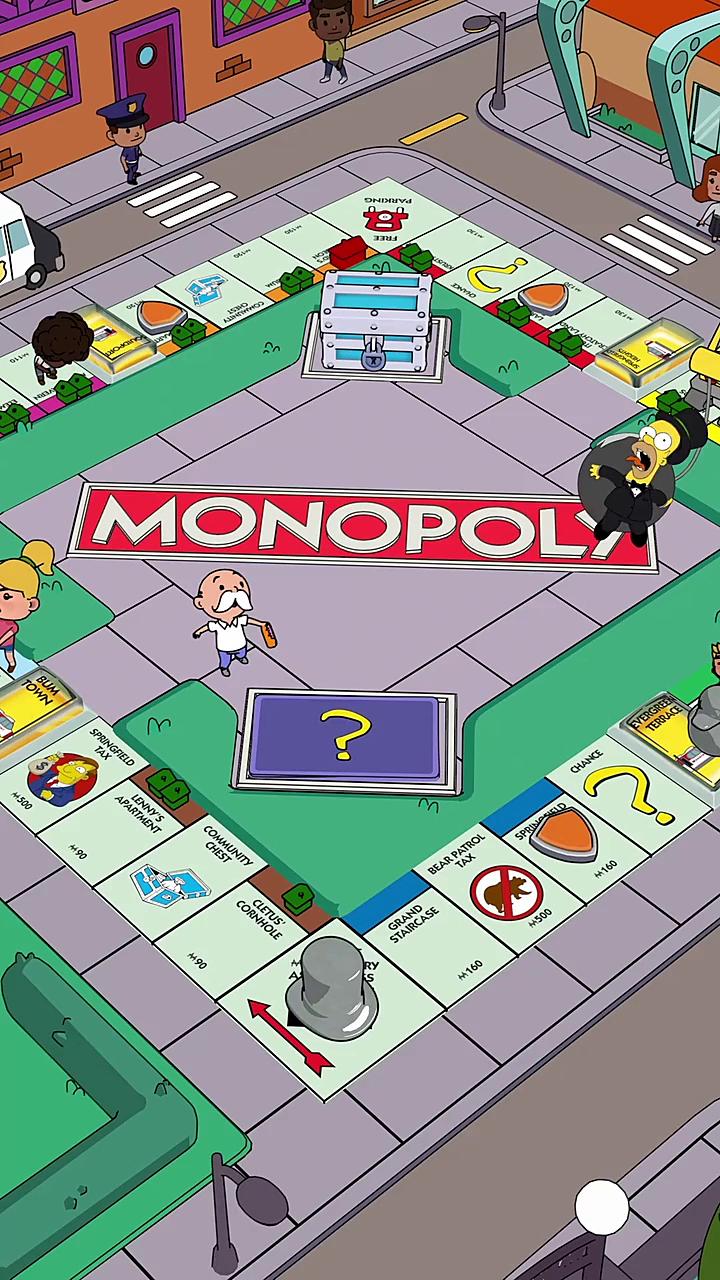 Creative #14 — the 8-second bumper: shortest cut in the fleet, 185M impressions in 50 days, still live.
Hooks: What the First Frames Sell
With copy held constant (one line across the fleet), the hooks live entirely in the opening visuals. Across the fifteen keyframes, three motifs repeat:
- The dice roll as the first beat. Nearly every opening frame centers oversized dice mid-tumble over the board — instantly readable as "Monopoly + one-tap action" even at bumper length. The mechanic is the hook.
- Board-scale spectacle. Winning moments are staged as physical spectacle — cash bursts, landmark upgrades, the Monopoly Man reacting — rather than UI captures. The game is shown as a place, not an app.
- A jackpot/near-miss rhythm borrowed from casual-casino ads: setup, spin/roll, oversized payoff, all inside the first ten seconds. The 22-second cuts essentially run this loop twice.
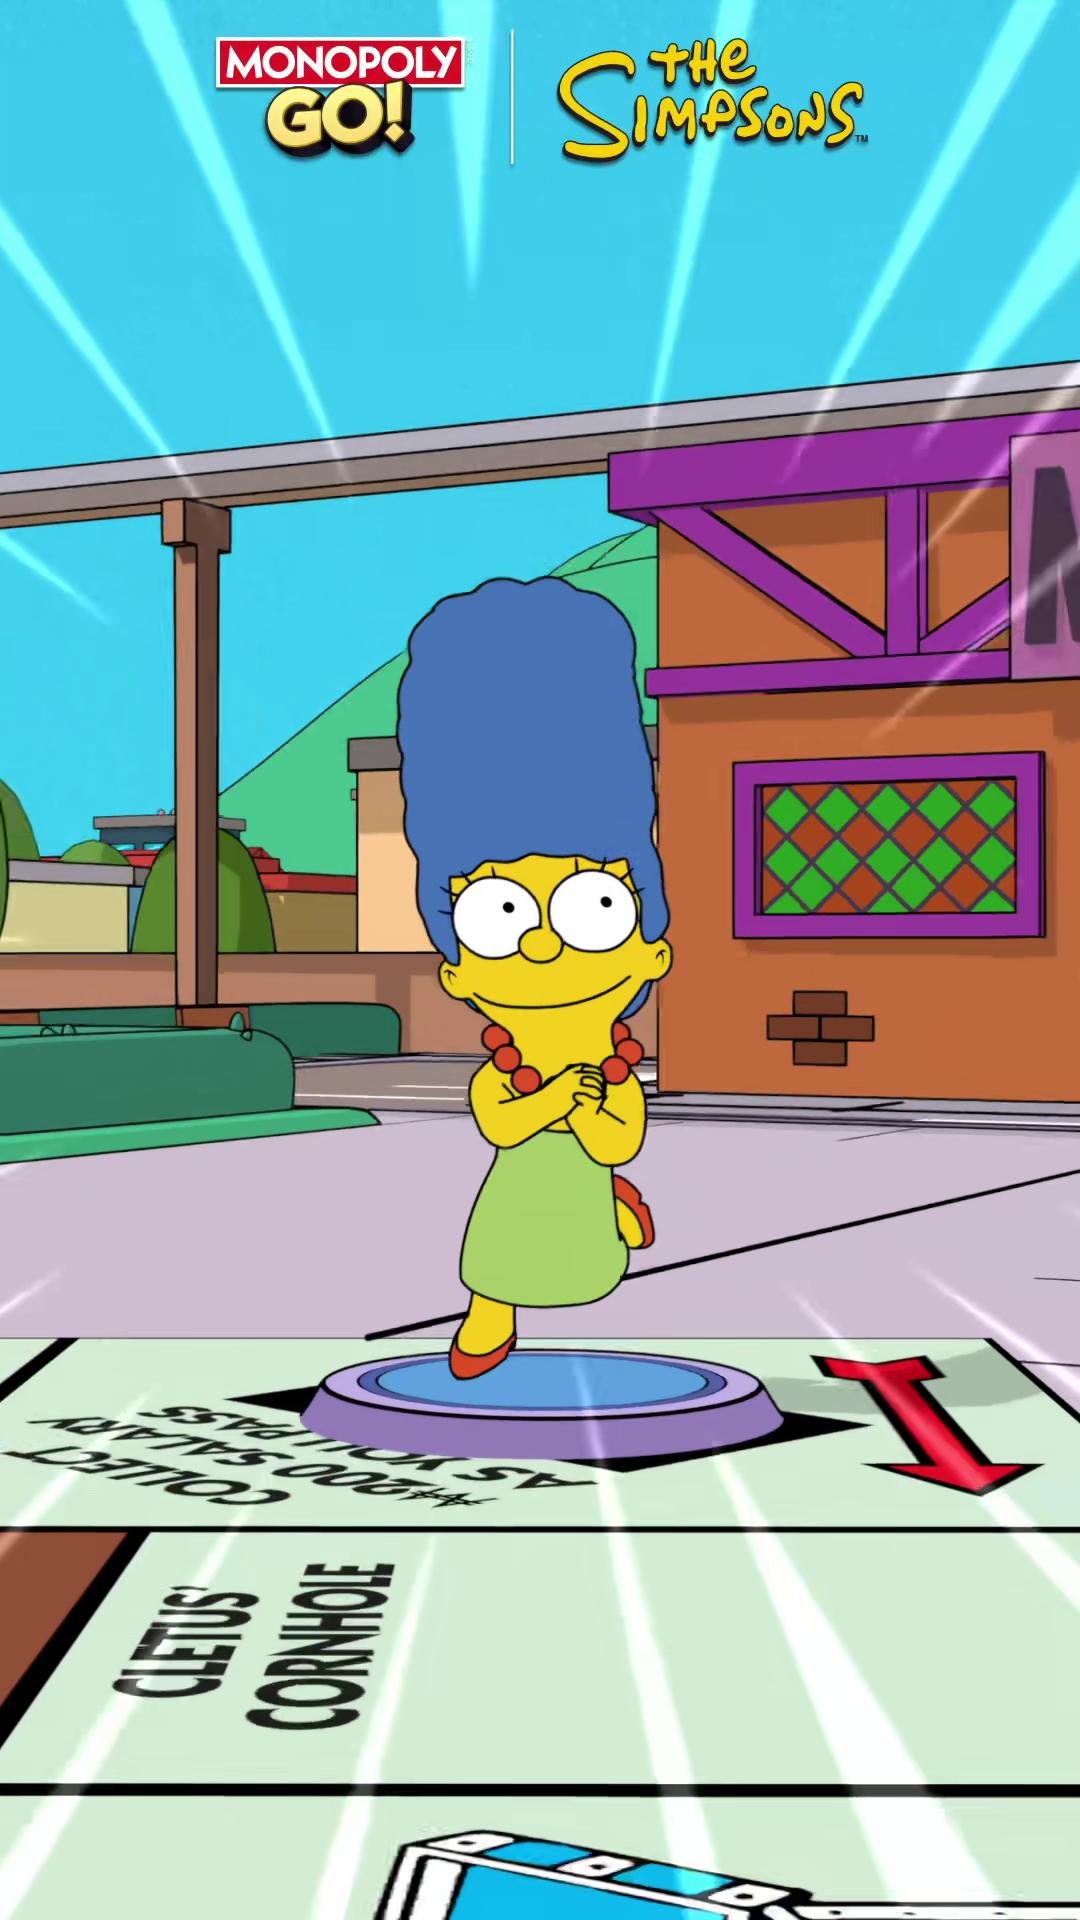 Creative #7 (27s, 326M impressions, live) — payoff staging typical of the fleet: oversized rewards over the board within the opening seconds.
The honest caveat: an index sees frames and metadata, not full narratives, and the copy field is truncated at the source. What the data supports is narrower but firmer — one copy line, one visual language, fifteen edits. The variation Scopely actually ships is durational and rhythmic, not conceptual. That's a mature system: concept is settled, production iterates within it.
A Consistency Check: Impressions per Tracked Show
Before trusting any third-party estimate, test it against itself. The index reports two independent measures per creative — model-estimated impressions and tracked show events — so their ratio is a free internal audit:
| Creative | Est. impressions | Shows tracked | Impressions per show |
|---|---|---|---|
| #1 (28s) | 1,847,295,849 | 219,700 | ~8,408 |
| #2 (22s) | 1,017,734,902 | 119,221 | ~8,536 |
| #5 (60s) | 415,664,613 | 49,581 | ~8,383 |
| #12 (15s) | 236,728,627 | 28,373 | ~8,343 |
| #15 (29s) | 174,063,805 | 20,813 | ~8,363 |
Across a 10x spread in scale, the ratio holds within ±2% of ~8,400 impressions per tracked show. The two measures move in lockstep for this advertiser, which means the ranking is robust — whichever axis you sort by, you get the same top 15 in the same order.
The cross-advertiser comparison is where the ratio gets genuinely informative rather than merely reassuring: Royal Match's top creative runs at ~95 impressions per tracked show, Coin Master – Board Adventure's playable at ~808, Carnival Tycoon's video at ~7,782. Those aren't data errors — they're placement fingerprints. Different channel mixes and formats yield wildly different reach-per-observation, which leads to a practical rule: within one advertiser, show counts and impressions are interchangeable ranking axes; across advertisers, compare impressions only. Cross-advertiser show-count comparisons will mislead you by two orders of magnitude.
Run This Audit Yourself: Five Queries, Fifteen Minutes
Everything in this teardown came from repeatable queries, not privileged access. The workflow, in order:
- Pull the entity's creative board. Search the app by name, filter to one market (US here), sort by estimated impressions. The top 15–20 rows are your dataset. Elapsed time: one query.
- Read the clocks before the numbers. For each creative, note first seen, last seen, and duration, and compute days live. Impressions tell you what won; timestamps tell you how the advertiser operates — and operations are the copyable part.
- Group by first-seen date. Launch cohorts appear immediately (three creatives on May 23, six on June 18, three on June 25 here). A cohort structure means deliberate batch testing; scattered solo launches mean improvisation.
- Sort the retired creatives by final timestamp. Simultaneous end-times expose scheduled resets — the July 29 cluster in this data was invisible at monthly granularity and unmistakable at minute granularity.
- Repeat for two or three genre neighbors and build the intensity table (top-creative impressions ÷ days live). That one column classifies every advertiser in your genre into blitz vs marathon — and tells you which of them you can realistically outspend or outlast.
Worth setting alerts on afterwards: any competitor creative crossing 60 days live (a revealed winner), any batch of 4+ creatives first seen on one day (a new generation shipping), and any synchronized retirement cluster (a reset — their fatigue benchmark, published for free). Each of these is a single saved search in an AdMapix account.
MONOPOLY GO! vs Royal Match vs Coin Master: Opposite Playbooks
Same query, same market, same sort, run against the neighbors (top US creative for each, pulled 2026-08-07):
| App | Developer | Top creative | Days live | Est. impressions | Est./day | Leading format |
|---|---|---|---|---|---|---|
| MONOPOLY GO! | Scopely | 28s video | 67 | 1,847,295,849 | ~27.6M | Video |
| Carnival Tycoon: Coin Games | Wild Candle Spin | 59s video | 116 | 258,595,662 | ~2.2M | Video + playable |
| Coin Master – Board Adventure | Moon Active | Playable | 316 (live) | 44,576,142 | ~141K | Playable |
| Royal Match | Dream Games | 29s video | 221 (live) | 2,915,135 | ~13K | Video + playable |
(Carnival Tycoon surfaced via keyword adjacency in the same genre query; it's included as a mid-scale reference point, not as a Coin Master product.)
The spread is enormous and it isn't noise. MONOPOLY GO!'s top creative runs at roughly 2,000x the daily impression intensity of Royal Match's — and Royal Match is no small advertiser. The two companies are simply playing different games:
- Scopely runs a blitz: few formats, massive concentration, ~60-day creative lives, scheduled resets. High burn, maximum share-of-voice, requires deep pockets and a creative pipeline that can reliably produce the next hero batch.
- Dream Games runs a marathon: its oldest top creative has been live 344 days (first seen August 2025), one top-5 entry is a static image live for 207 days, and playable companions appear throughout. Low per-creative intensity, extreme longevity, fatigue managed by rotation breadth instead of resets.
- Moon Active's Coin Master – Board Adventure skips video entirely at the top: its five biggest US creatives are all playables, two live for 250–316 days. For a spin-mechanic game, the try-it hook outperforms the watch-it hook.
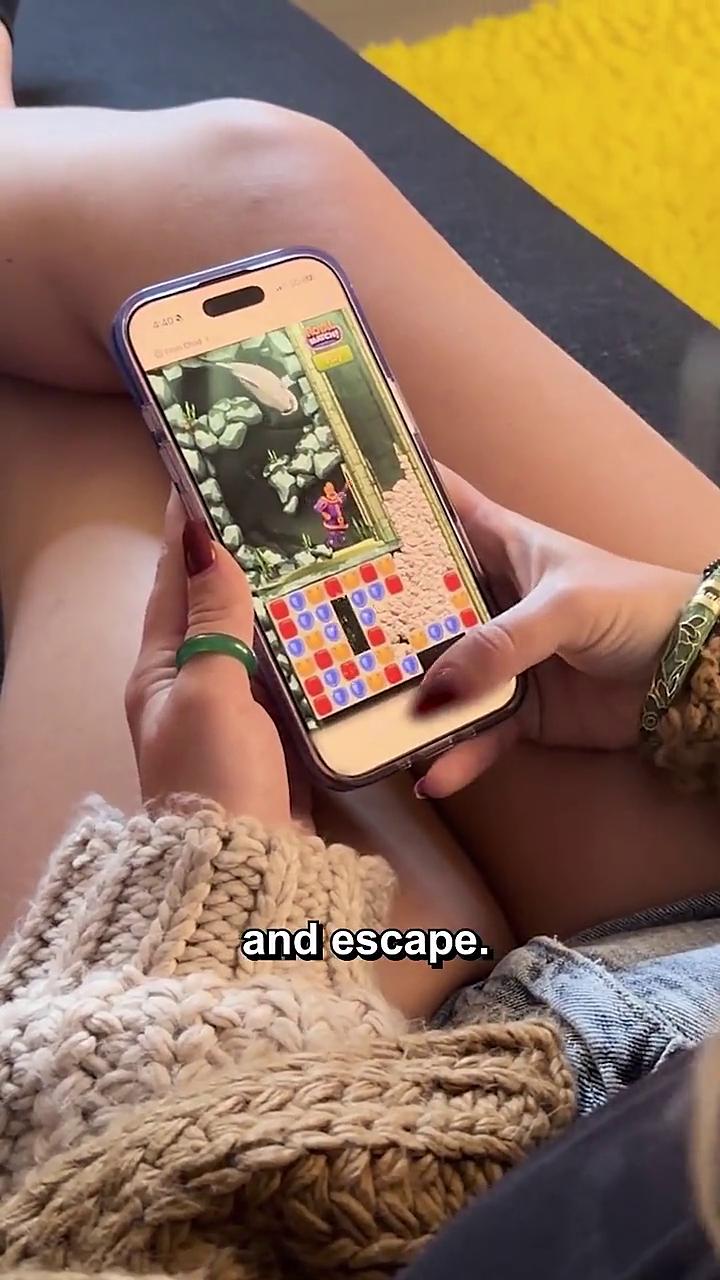 Royal Match's top US creative — 29 seconds, live for 221 days at ~13K est. impressions/day: the marathon playbook in one image.
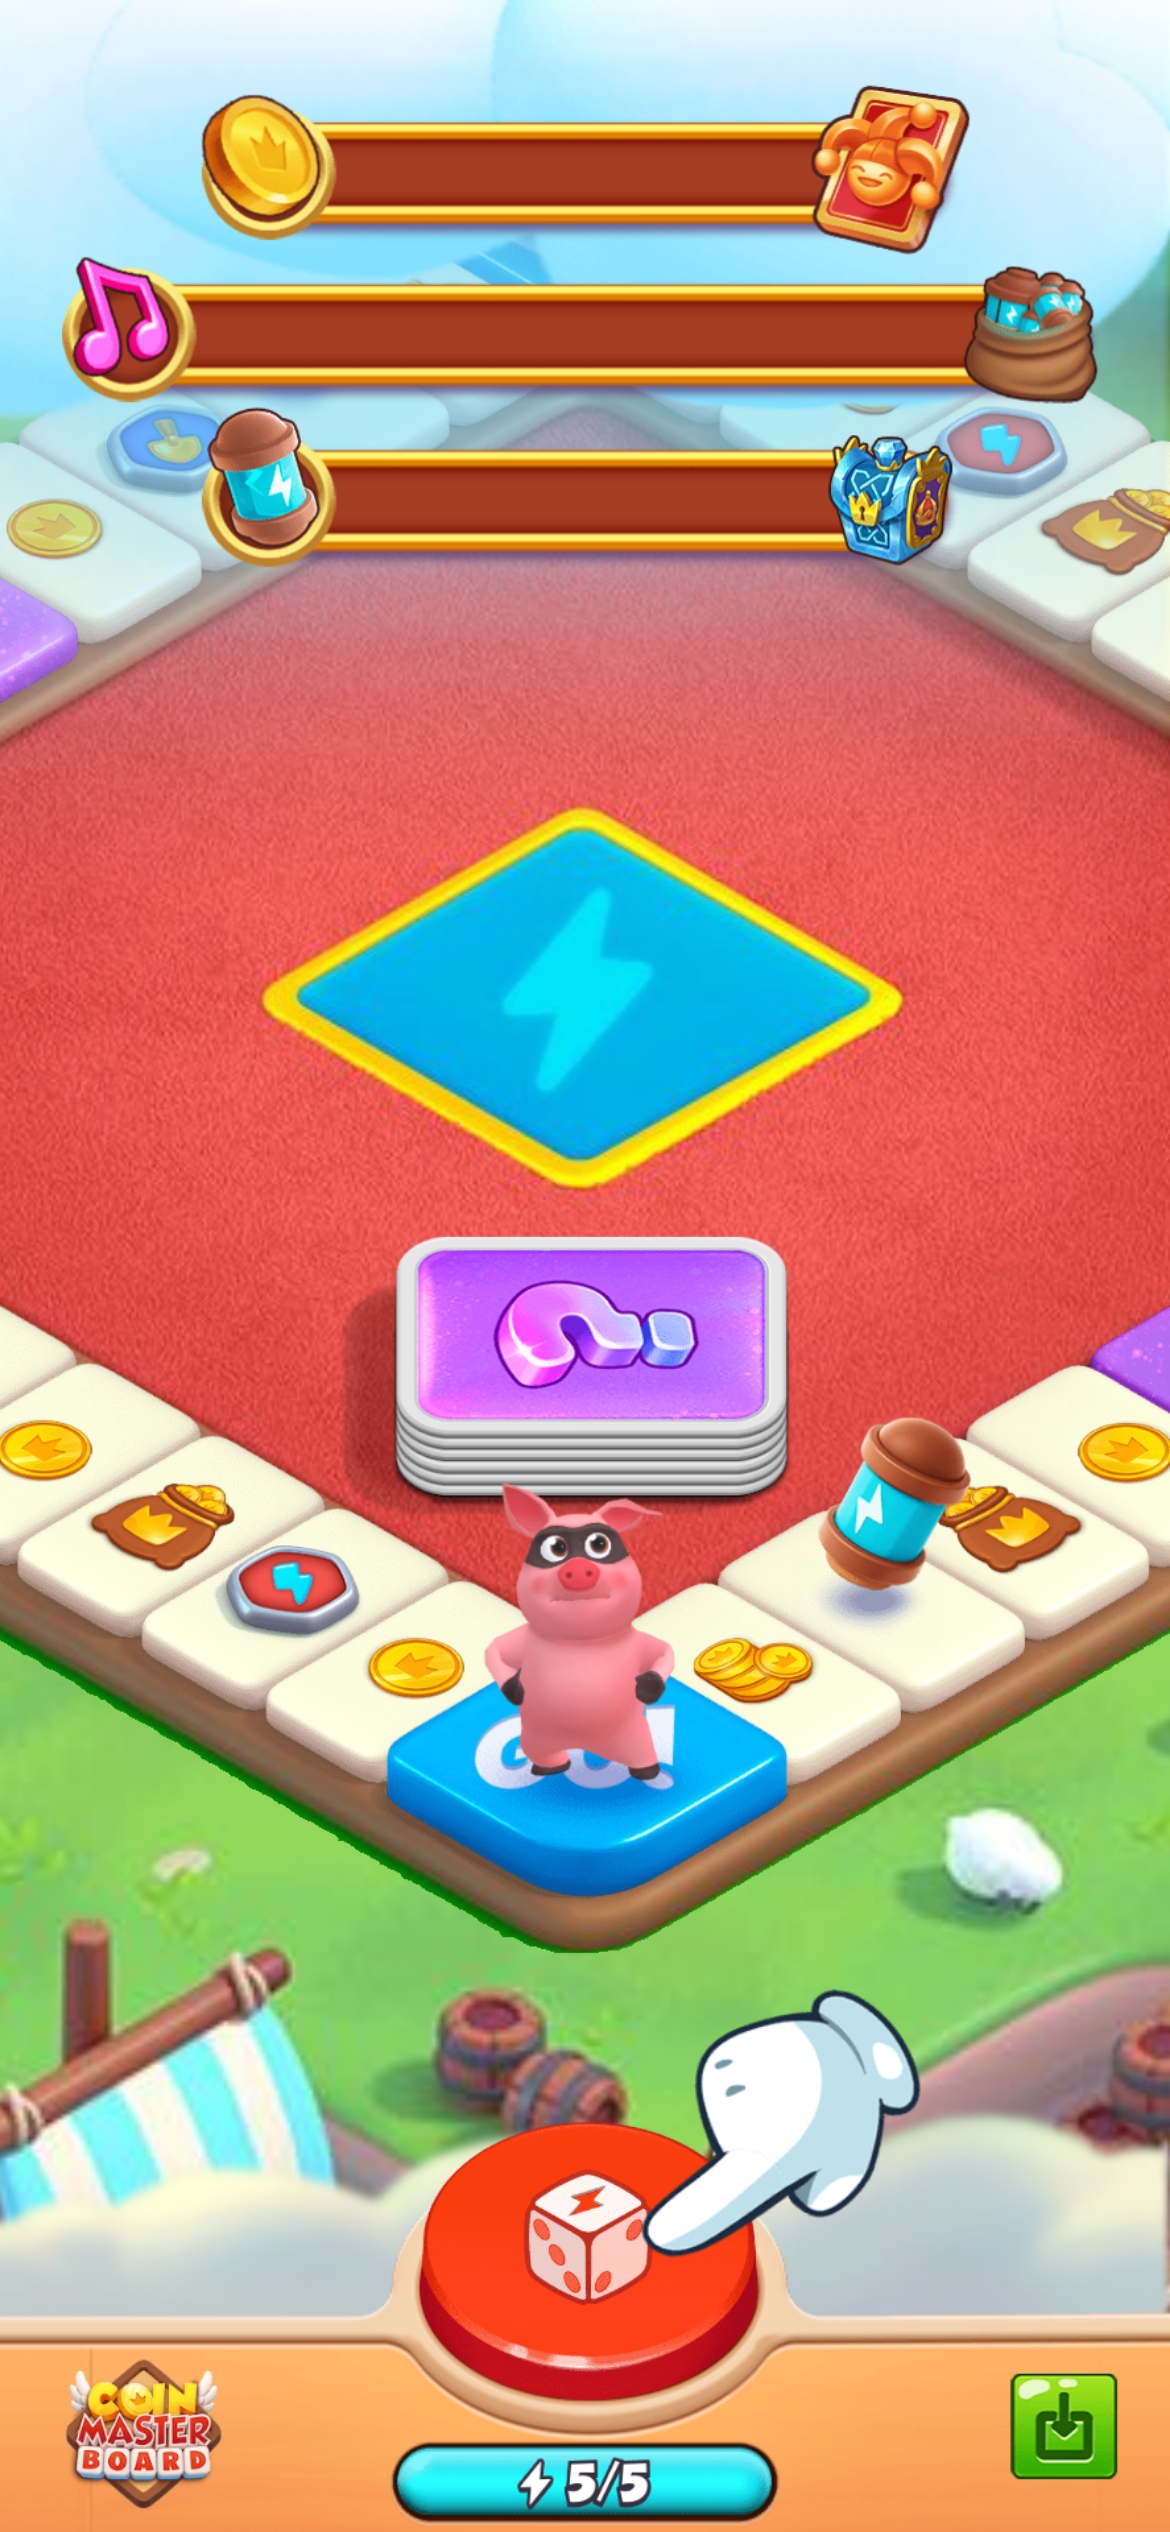 Coin Master – Board Adventure (Moon Active) — a playable live since September 2025: 316 days and counting. No video in its US top five.
There is no "correct" strategy in this table — there are budget structures. Blitz buying converts cash into immediate share-of-voice; marathon buying converts creative R&D into durable, cheap reach. What the table does settle is that single-creative intensity is a fingerprint: you can identify which playbook a competitor runs from five rows of index data, before reading a single earnings call.
Can You Copy This Playbook?
Depends on which part — and on who you are.
If you run UA at a mid-size studio: the transferable asset is the rotation discipline, not the budget. Launch creatives in deliberate cohorts (the June 18 batch pattern), define a maximum creative age in advance (~60 days here), and retire generations on schedule instead of waiting for visible decay. None of that costs Scopely money to do; it costs process. The duration experiment is equally copyable: same concept, five cuts from 8s to 34s, shipped simultaneously — let the auction pick.
If you lead creative strategy: notice that the fleet holds concept constant and varies rhythm. Before producing ten new concepts, test whether your proven concept has unexploited durations. And steal the aggregation lesson: when auditing competitors, merge entries by video fingerprint or you'll misread their concentration by 2x.
If you're an indie or a small publisher: do not copy the blitz. The Royal Match and Coin Master rows are the realistic templates — long-lived creatives, playable-heavy mixes, intensity you can sustain. The most actionable single metric to watch is days-live on your genre's leaders: any creative a disciplined competitor keeps paying for past 60 days is a free lesson in what converts, published daily, in public.
What to watch next. The cadence itself is a testable prediction. If Scopely's operating rhythm holds — generations launched roughly five to six weeks apart, hero creatives capped near the 60-day mark — then the June 18 cohort, which turned 50 days old on August 7, is due for its own reset in late August or early September, and a successor batch should surface in the index before that happens. Anyone can check this claim against public data in a month. That is what separates an operating model read from raw metrics from a narrative guess: it makes falsifiable predictions about a competitor's next move.
For everyone: the numbers in this piece are a snapshot of one game, one market, one window. The same five-minute query answers the same questions for your genre — an AdMapix account gets you the live index, and the pricing page shows what's included at each tier.
Methodology & Data Notes
- Source: AdMapix creative index, queried 2026-08-07, US market filter, sorted by model-estimated impressions. Top 15 creatives analyzed for MONOPOLY GO!; top 5 each for comparison apps.
- Impressions are model estimates, not platform-reported figures, and reflect the index's observation window for each creative. Treat absolute values as directional; ratios and rankings are more robust than raw numbers.
- Days live = first seen → last seen in the index. A creative marked "Live" was observed within the final day of the window. Index observation may lag or undercount placements outside coverage.
- Show counts are index-tracked display events, a coverage proxy rather than a census.
- Download-chart figures come from the AdMapix general top chart (all categories, daily window, US) pulled the same day.
- App identity per the index: MONOPOLY GO!, developer Scopely, Inc., App Store ID 1621328561.
- All figures are third-party estimates provided for research purposes; they may differ from advertisers' internal data.
Frequently Asked Questions
How many impressions do MONOPOLY GO!'s ads get? The top 15 US creatives account for 7.17 billion model-estimated impressions in the AdMapix index as of August 7, 2026, led by a single 28-second video with 1.85 billion impressions over 67 days (~27.6M/day).
How long does MONOPOLY GO! run each ad creative? Roughly two months for hero creatives. The two longest-lived top creatives ran 67 days each and were retired in a synchronized reset on July 29, 2026, while still at scale — lifespan at this advertiser is a policy choice, not a fatigue outcome.
What video length does MONOPOLY GO! use most? The 21–30 second band dominates: two-thirds of the top 15 creatives fall in it, carrying 78% of impressions. The median and modal duration is 22 seconds; the fleet spans 8 to 60 seconds.
Does MONOPOLY GO! use playable ads? Not as standalone units in the US top 15 — every top creative is a video. One playable appears only as a companion to the best-performing video. Competitors differ sharply: Coin Master – Board Adventure's top five US creatives are all playables.
How does MONOPOLY GO!'s ad spend intensity compare with Royal Match? The top MONOPOLY GO! creative averaged ~27.6M estimated impressions/day versus ~13K/day for Royal Match's top creative — a roughly 2,000x intensity gap. Royal Match compensates with longevity: its top creatives stay live 200–340+ days.
What are "model-estimated impressions" and how reliable are they? They are third-party estimates produced by AdMapix's index models from tracked ad observations, not platform-reported figures. Within one advertiser they are internally consistent — in this dataset, impressions scale linearly with tracked show events (±2%) across a 10x size range — so rankings and ratios are robust even where absolute values are approximate.
Why did MONOPOLY GO! retire its best-performing ad? The data can't show intent, but it shows policy: the top two creatives were cut on July 29, 2026 in a synchronized 31-minute sweep alongside four others, at ~60–67 days of age, while a newer June 18 cohort continued untouched. That pattern matches scheduled generational rotation — retiring heroes at a fixed age before fatigue becomes externally visible — rather than a performance-triggered shutdown.
Data: AdMapix creative index and top charts, US, pulled 2026-08-07. All figures are third-party model estimates for research reference only.
See this data live, for any app. The queries behind this teardown take minutes in AdMapix — search a competitor, sort by impressions, read the timestamps. Create your account and run your first teardown today.
Related Reading
- Ad strategy teardowns (series index) — every teardown in the series, in publication order
- Mobile game ads guide: formats, examples and research — the format matrix, research workflow and KPI guardrails every teardown in this series applies
- Smash Fest! — playable creatives in the observed US launch sample
- Roblox — 1.5B US impressions, 61% of it launched inside three days
- Township — two fleets in one account — 5% of impressions driving 71% of delivery
Turn these observations into your next creative study
Open the creative library and select samples for your market, network and research question.
Related Articles
Playable Ad Analysis for Mobile Games: A Practical Method
A practical method for playable ad analysis in mobile games: how to reverse-engineer a competitor's playable by the job it is built to do, decode its structure beat by beat, infer which concepts are likely working, turn observations into testable briefs, and stay honest about what a public playable proves (structure and intent) versus what it never can (spend, installs, retention, ROAS).
Best Mobile Game Ad Formats Across Platforms: A 2026 UA Playbook
A platform-by-platform guide to the best mobile game ad formats in 2026: which formats do the heavy lifting on Meta, Google, TikTok, AppLovin, and Unity; why the right format depends on platform, genre, and funnel stage; a format-selection framework; a creative-testing cadence; and the honest limits of what competitor ads can and cannot tell you about which format wins.
Meta Ads Library vs Ad Intelligence Tools for Game UA (2026): Which to Use, When, and Why
A definitive 2026 comparison of the Meta Ads Library vs dedicated ad intelligence tools for mobile game user acquisition — where the free transparency library genuinely helps, the structural limits that create blind spots for game UA creative research, a side-by-side capability matrix, the exact decision criteria for when to add a paid intelligence layer, and an honest account of what neither can show.