Atria Alternative: How to Choose the Right Creative Intelligence Stack in 2026
A bottleneck-first guide to picking an Atria alternative. Diagnose whether discovery, swipe-file workflow, AI ideation, analytics, or reporting is your slowest step, then choose the tool that removes it — with comparison tables and an honest read on what public ad data can prove.
Atria Alternative: How to Choose the Right Creative Intelligence Stack in 2026
Updated June 21, 2026.
The right Atria alternative is whichever tool fixes your slowest step, not whichever has the biggest ad library. Atria is an AI ad workflow platform built around insights, inspiration, and ideation, so teams usually leave it for one specific reason: discovery is too narrow, the swipe file is clumsy, the AI output is thin, the analytics do not match owned-account data, or the reporting does not survive a client meeting. This guide is for creative strategists, media buyers, agencies, and DTC growth teams. By the end you should be able to name your bottleneck and pick the alternative that removes it — instead of buying another general-purpose tool and hoping the friction disappears. AdMapix is our product; we include it where relevant and keep product claims separate from what public ad data can actually prove.
TL;DR
- The best Atria alternative is the one that fixes your slowest workflow, not the one with the largest library. Name the bottleneck first; the shortlist follows.
- There are five common bottlenecks: narrow discovery, a clumsy swipe file, thin AI output, analytics that do not match owned accounts, and reporting that does not travel. Each points to a different kind of tool.
- Use a swipe-file-first tool (Foreplay, MagicBrief) when saving and organizing references is the slow step. Use a market-intelligence layer when cross-channel discovery, video breakdowns, or client-ready reporting is the slow step.
- AI ideation is only as good as the source ads and constraints you feed it. Treat AI summaries as a starting point for a human brief, never as proof of what will work.
- Public ad data proves intent, not performance. No tool — Atria, AdMapix, or any competitor — can see a rival's spend, conversion rate, or ROAS. Validate every angle with your own results.
- AdMapix fits teams that need cross-network creative search, saved media, video analysis, and shareable reports before a brief, especially when competitors span multiple countries and channels.
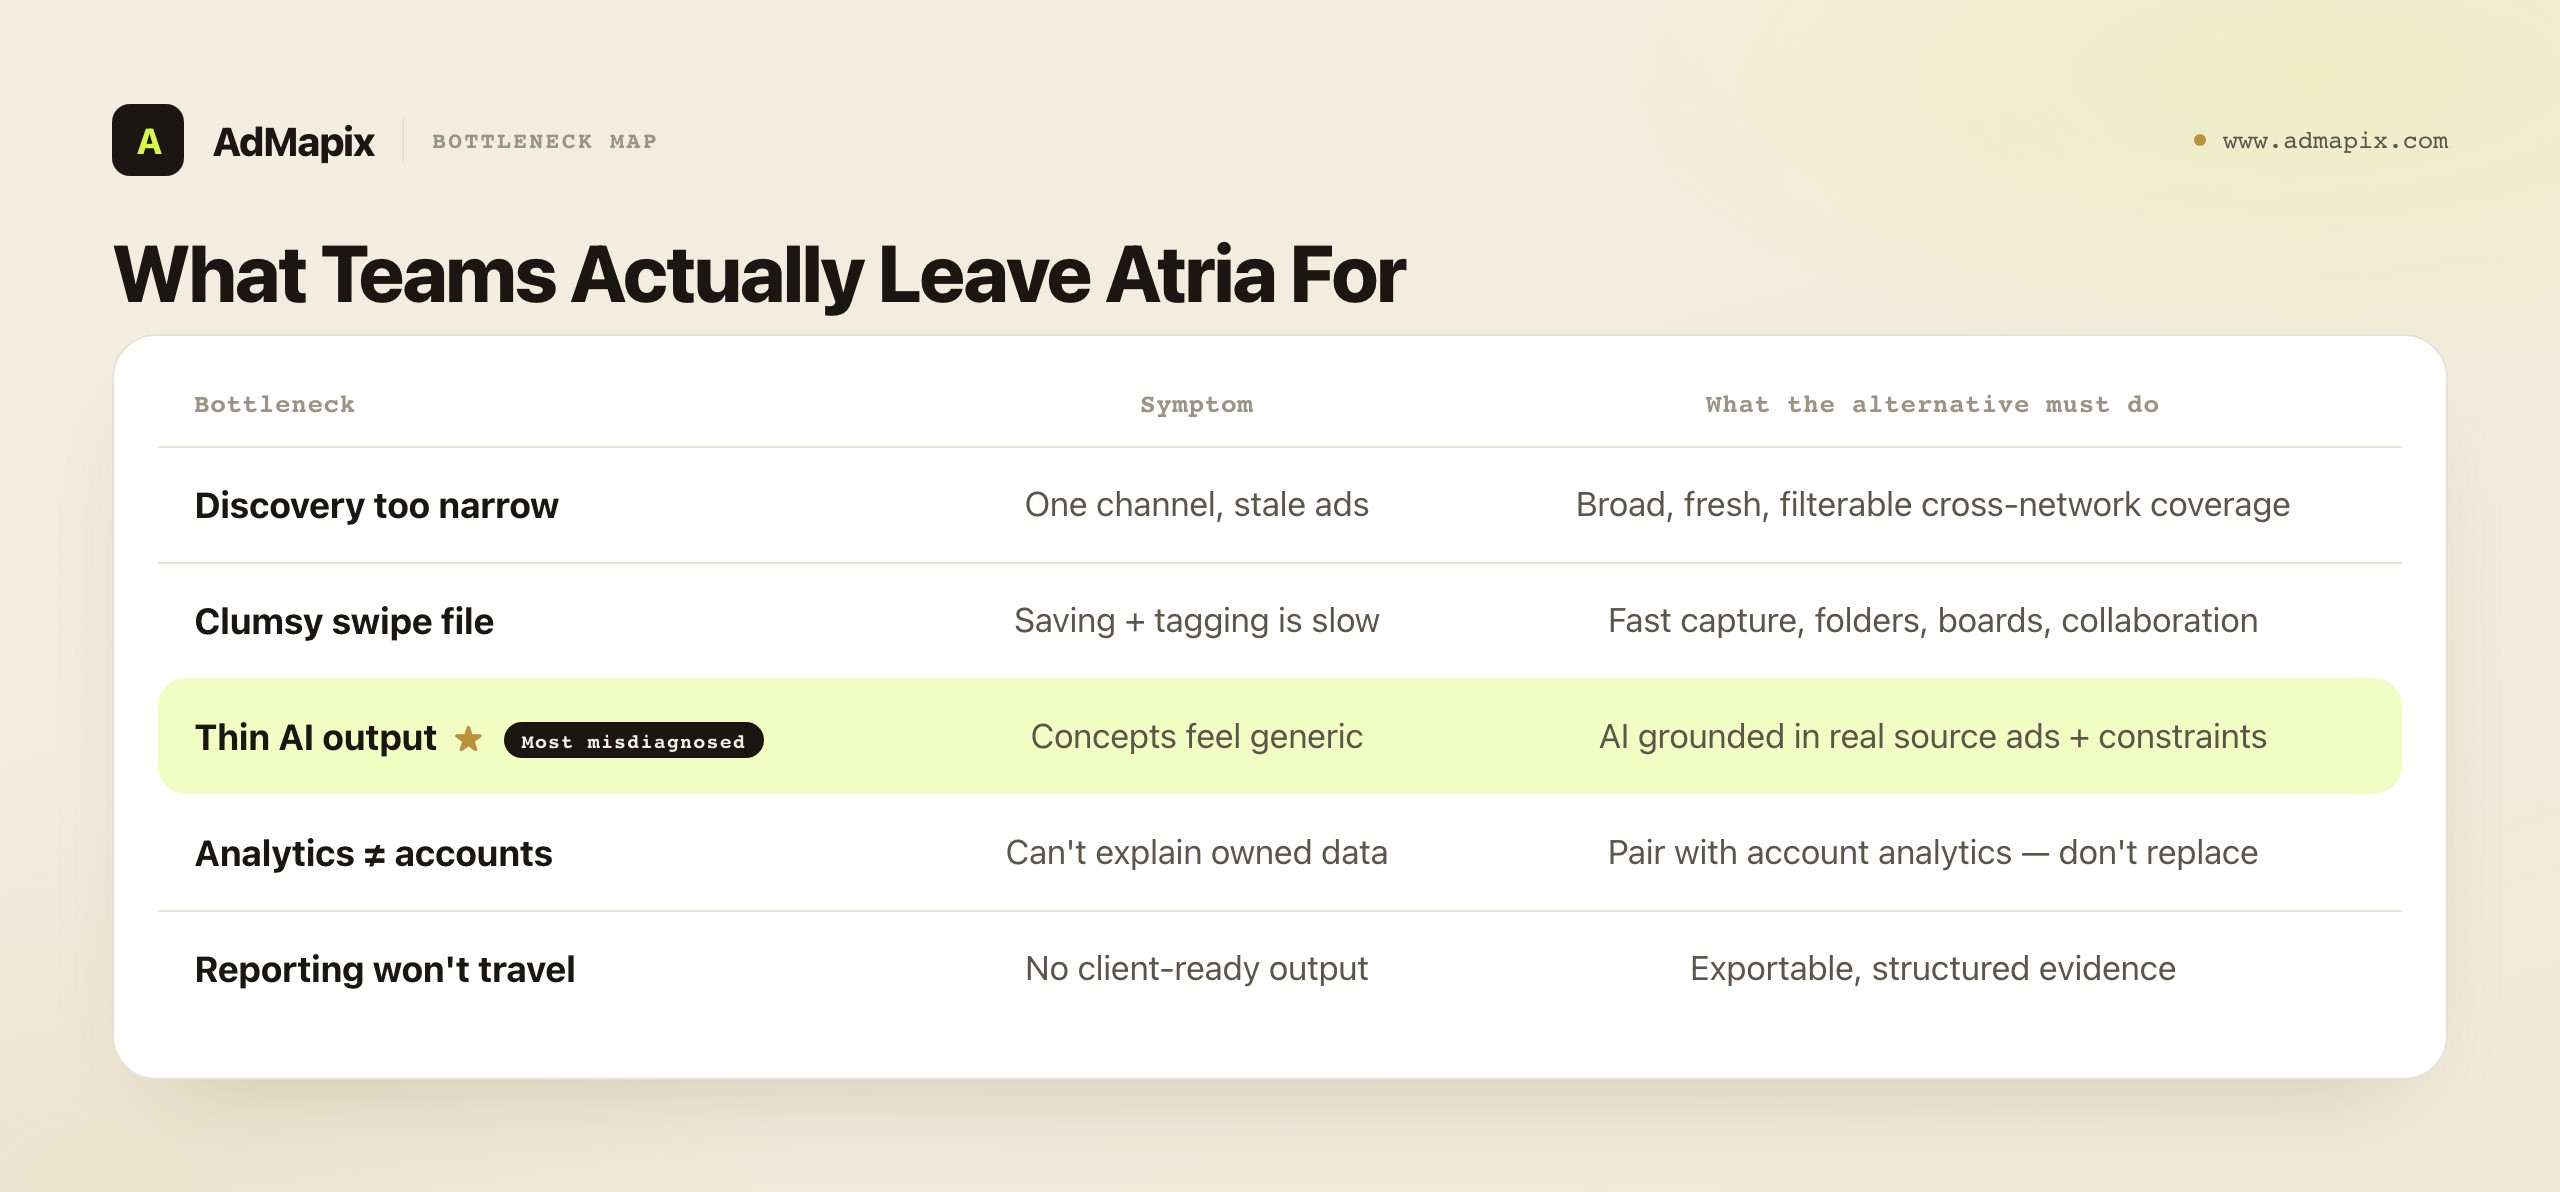
What Teams Actually Leave Atria For
Most teams searching for an Atria alternative are not looking for one more screenshot folder — they are trying to remove a specific block in a weekly cycle. Naming that block is the entire decision. Atria covers ideation well; the friction usually shows up at the edges, in the steps before and after the AI does its part. Before you compare a single vendor, get specific about which step is actually slow, because the answer determines which category of tool you should even be looking at.
The trap here is buying by reputation or library size. "This tool has ten million ads" is a fact about a database, not about your workflow. If your weekly bottleneck is that saving and tagging references takes forty minutes of manual drudgery, a bigger library does nothing for you — you needed a faster swipe file. If your bottleneck is that you keep missing what competitors run on channels your current tool does not cover, a slicker swipe file does nothing — you needed broader discovery. The five common bottlenecks are genuinely different problems, and the tools that solve them are genuinely different tools.
| Bottleneck | Symptom | What the alternative needs to do |
|---|---|---|
| Discovery is too narrow | You only see one channel or stale ads | Broad, fresh, filterable cross-network coverage |
| Swipe file is clumsy | Saving and tagging references is slow | Fast capture, folders, boards, collaboration |
| AI output is thin | Concepts feel generic or unsupported | AI grounded in real source ads and constraints |
| Analytics don't match accounts | Tool can't explain owned performance | Pair with account analytics, not replace it |
| Reporting doesn't travel | No client-ready output | Exportable, structured evidence |
Read that table as a diagnostic, not a menu. Your job is to find the one row that describes your most painful recurring moment — the step where you sigh every week — and then shortlist only the tools that solve that row. Most teams have a primary bottleneck and one or two secondary ones; solve the primary first, because moving it usually reveals whether the secondaries were real constraints or just symptoms of the first.
There is a reason the bottleneck is so easy to misname. The five steps form one continuous workflow — discover, save, ideate, validate, report — so when the chain feels slow, it is tempting to blame the whole chain and reach for "a better all-in-one." But a chain is only as fast as its slowest link, and replacing the whole chain to fix one link is expensive and usually fails, because the new all-in-one is a generalist that is mediocre at the very link you needed to be excellent. The disciplined move is to find the slow link and replace that, keeping what already works.
A simple diagnostic exercise cuts through the fog. For one week, keep a rough log of where your creative-research time actually goes — minutes spent finding ads, minutes saving and tagging, minutes turning evidence into concepts, minutes reconciling numbers, minutes building the deliverable. Most teams who do this are surprised: the step they complained about is rarely the step that actually eats the most time. People remember the annoying moments (a clunky save flow) more vividly than the slow ones (forty minutes of scrolling because discovery is weak), and they shop to fix the memory rather than the data. A week of honest logging replaces a vibe with a measurement, and a measurement points to exactly one row in the bottleneck table.
It also helps to be precise about who feels which bottleneck, because the seat predicts the pain. The media buyer and the performance marketer feel discovery and validation pain most — they need to find fresh testable angles and prove them against spend. The creative strategist and the production team feel swipe-file and AI-ideation pain most — their output depends on a fast reference workflow and concepts worth briefing. The agency lead feels the reporting bottleneck most — their retainer depends on the work being visible and defensible to a client. When two people on the same team disagree about "the bottleneck," they are usually both right about their own seat, and the fix is to name whose workflow you are actually optimizing before you shortlist anything.
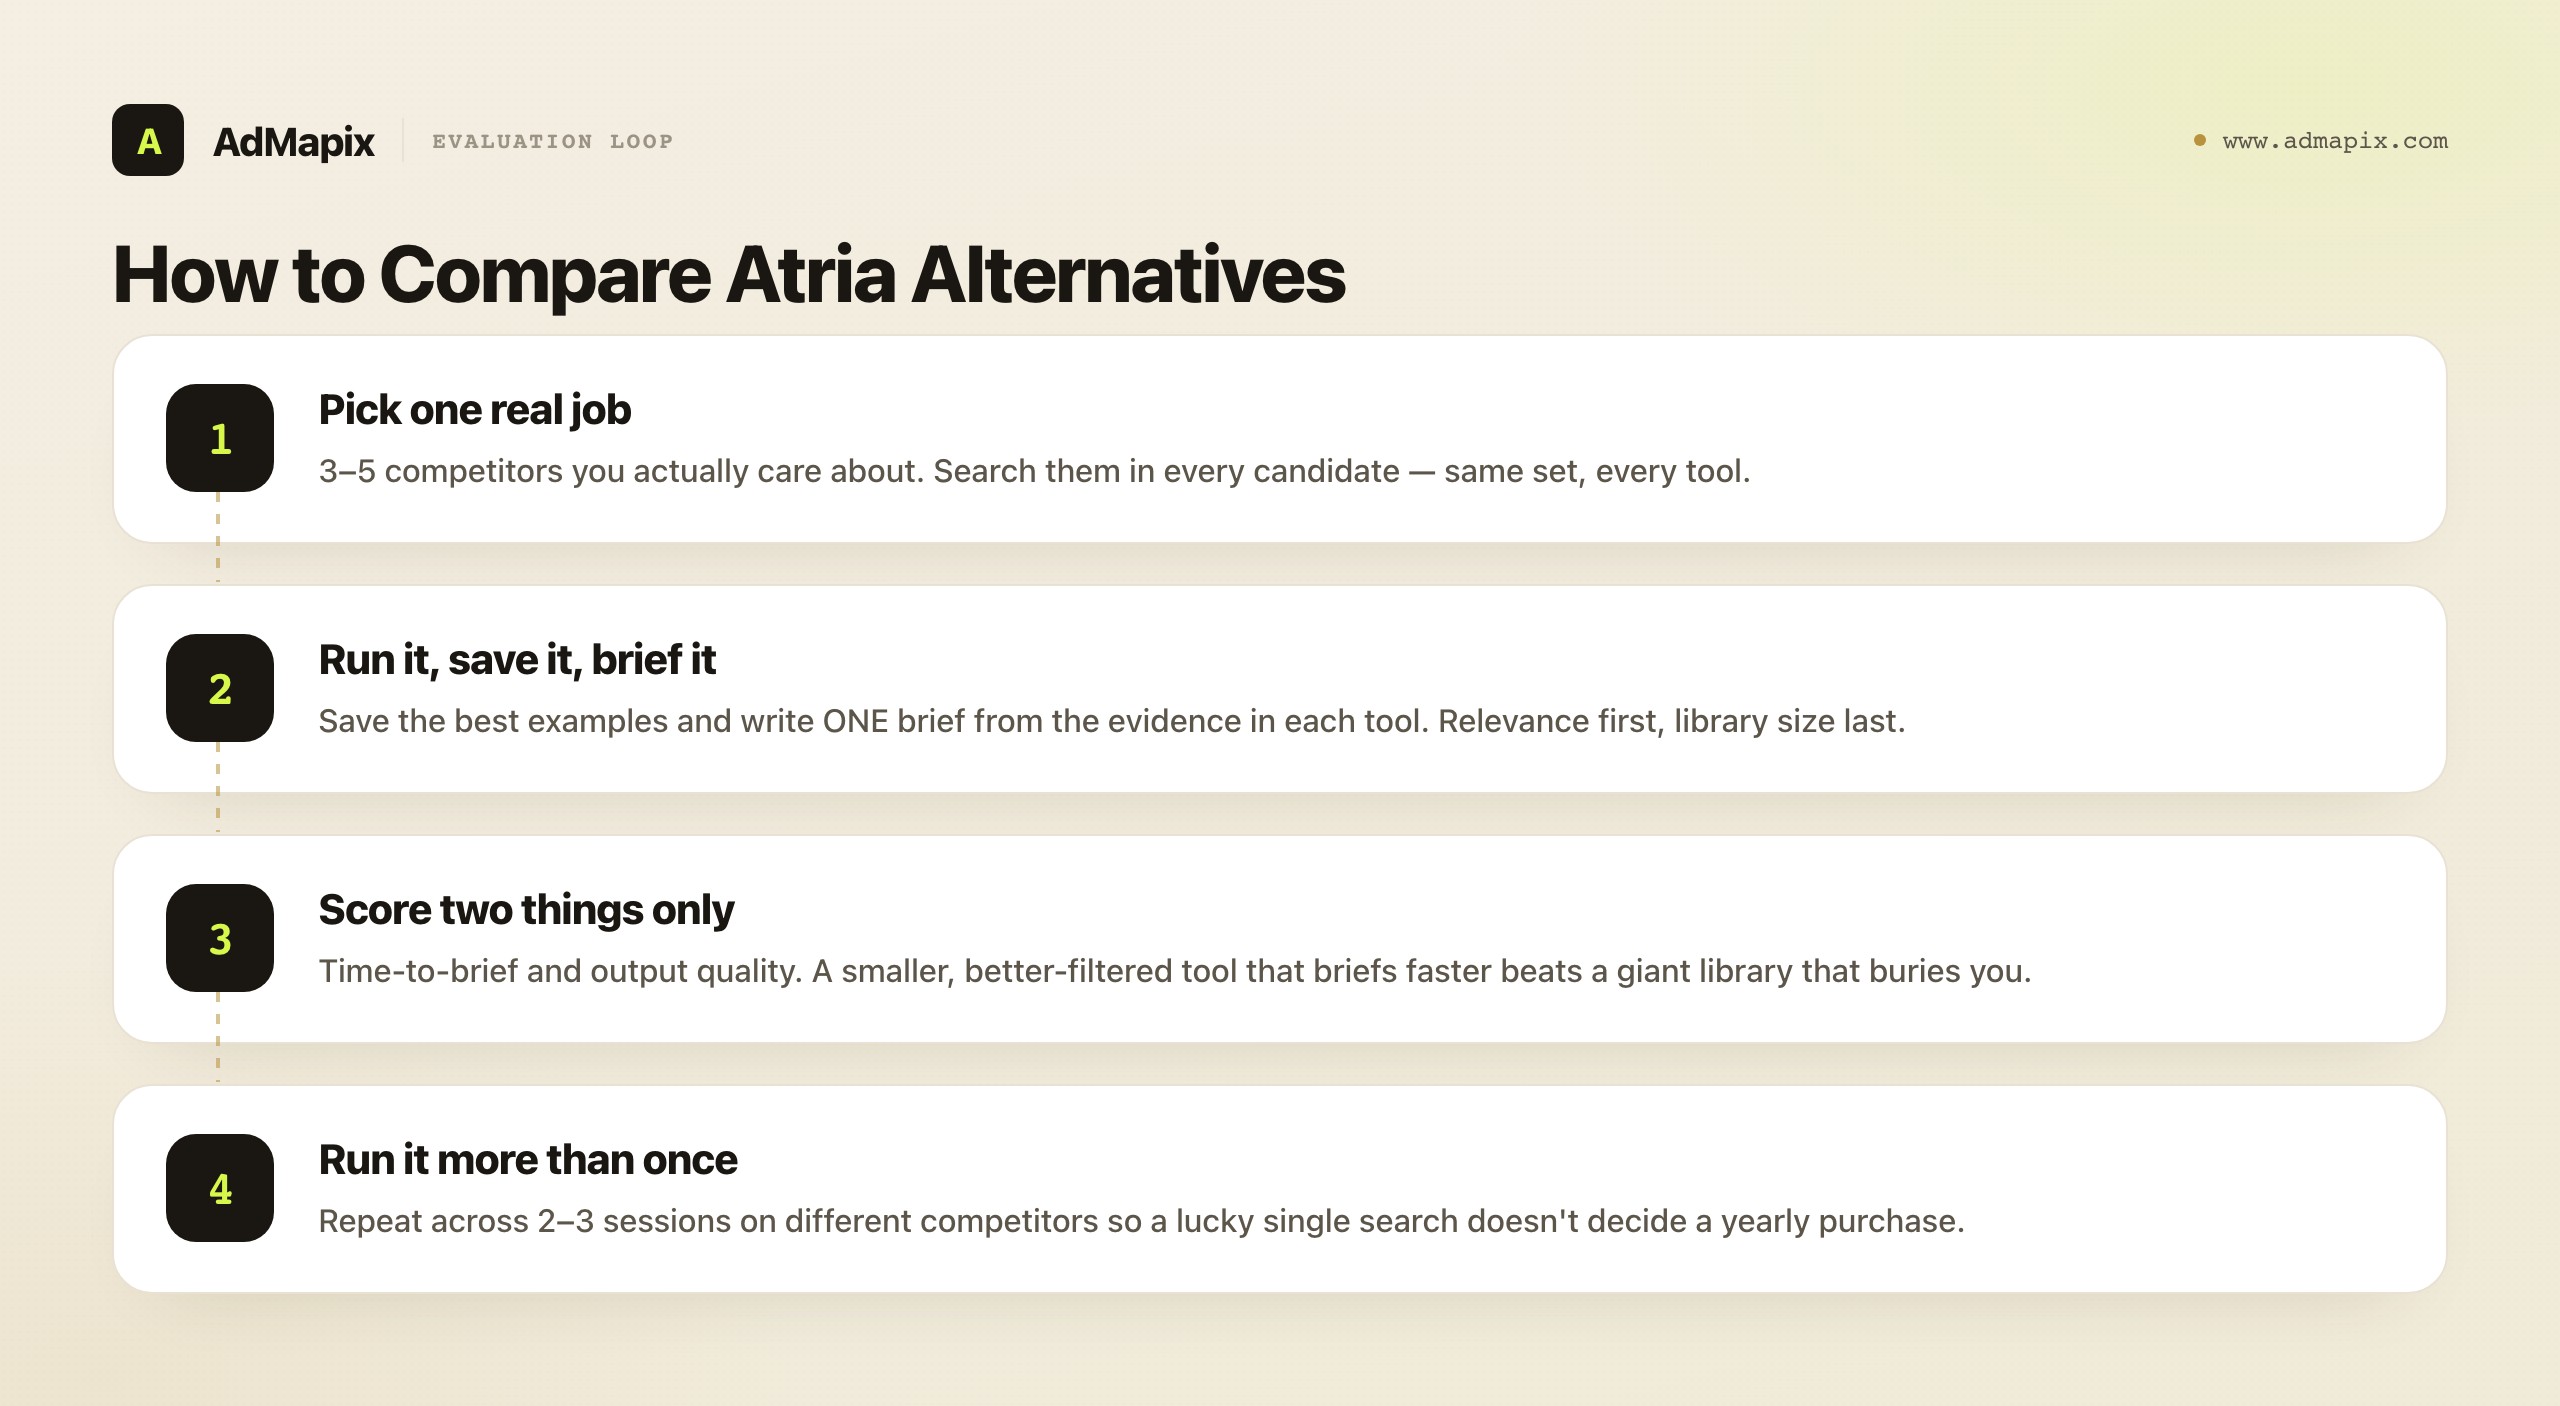
How to Compare Atria Alternatives
Compare alternatives by running the same job through each tool, not by counting features. This is the single most important method in the whole guide, because feature lists lie and workflows do not. Pick three to five real competitors you actually care about, search them in every candidate, save the best examples, and write one brief from the evidence. Then compare two things and only two things: time-to-brief and the quality of the output. A smaller, better-filtered tool that gets you to a usable brief faster beats a giant library that buries you in irrelevant results.
The most common buying mistake is comparing database size while ignoring whether the results are relevant to your next brief. Coverage matters, but only after relevance. A tool that surfaces five thousand ads for your search, of which four are actually useful, has worse relevance than a tool that surfaces forty ads of which fifteen are useful — even though the first tool "has more ads." You are not buying a database; you are buying the speed and quality of your next decision.
| Criterion | What to check | Why it decides the purchase |
|---|---|---|
| Discovery depth | Channel coverage, freshness, filters | Determines whether you find testable angles at all |
| Swipe-file workflow | Capture speed, tagging, boards | Decides daily friction for the production team |
| AI grounding | Whether output cites real source ads | Thin, ungrounded AI produces generic concepts |
| Video analysis | Hook, pacing, first-screen breakdown | Where paid-social tests are actually won |
| Reporting | Export, structure, client-readiness | Decides whether findings survive a meeting |
| Time-to-brief | Search → saved → brief, end to end | The only metric that compounds weekly |
Weight these by your bottleneck rather than scoring them equally. If discovery is your slow step, discovery depth and freshness dominate and everything else is secondary. If reporting is your slow step, weight export and structure above raw library size. The goal of the comparison is not to crown the "best tool in general" — there is no such thing — but to find the tool that most reduces your specific friction at a price you can defend.
One discipline that separates good evaluations from wasted ones: run the comparison set more than once. A single search can get lucky (or unlucky), and the whole point of these tools is the repeated weekly query, not a one-off impression. Run your three-to-five-competitor set through each candidate across at least two or three sessions, on different competitors, and watch whether the tool stays fast and relevant or whether the first good result was a fluke. The tool that is consistently fast across runs is the one that will actually save you time after the trial ends.
A few evaluation traps are worth naming explicitly, because they pass a quick trial and then bite in month two. The demo-data trap: vendor demos are tuned to look great on a hand-picked competitor in a popular category, usually a US brand on Meta where coverage is densest. Always run your trial on your competitors in your category and your markets, even if they are smaller or messier, because that is where you will live. The single-search trap: you run one impressive search, you buy, and then the second week's search disappoints — which is why running the set across multiple sessions matters. The export trap: the evidence looks complete inside the tool until you try to get it into a brief or a client deck and discover the export is gated to a higher tier or strips the fields you needed; test the full round trip — search, save, export, share — not just the search box. And the champion trap: one enthusiastic person drives the trial, learns the tool's quirks, and the team buys it, only for adoption to collapse because nobody else can extract value. Have at least two intended users run the same job during the trial; the strongest predictor of adoption after the novelty wears off is a second, less-invested teammate independently reaching a useful brief quickly.
The reason to be this rigorous is that the cost of a wrong pick is not just the subscription. It is a quarter of a team running a workflow that does not fit, quietly losing time every week, plus the switching cost of migrating off it later, plus the harder-to-measure cost of the team concluding "these tools don't really help" when the truth is they bought the wrong category. A careful two-week evaluation that ends in the right tool is cheap insurance against all three of those costs.
One more practical note before you start trialing: write down, in a single sentence, what the trial is meant to prove. "Can this get me from my five competitors to a usable brief in under thirty minutes, twice in a row, on my markets?" A trial with a written success sentence ends in a clear yes or no; a trial without one ends in a vague impression and a purchase you half-regret. The sentence is free, it takes ten seconds, and it is the difference between an evaluation that decides something and a demo that merely entertains. Pair the success sentence with the same-job method above and you have a process that reliably surfaces the tool that removes your bottleneck — which, after all, is the only tool worth buying.
Bottleneck 1: Discovery Is Too Narrow
If your recurring pain is that you only ever see one channel, or the ads you find are weeks stale, or you cannot filter down to the angles that matter, then discovery is your bottleneck — and no swipe file or AI layer will fix it, because the problem is upstream of both. You cannot save or ideate on ads you never surfaced in the first place.
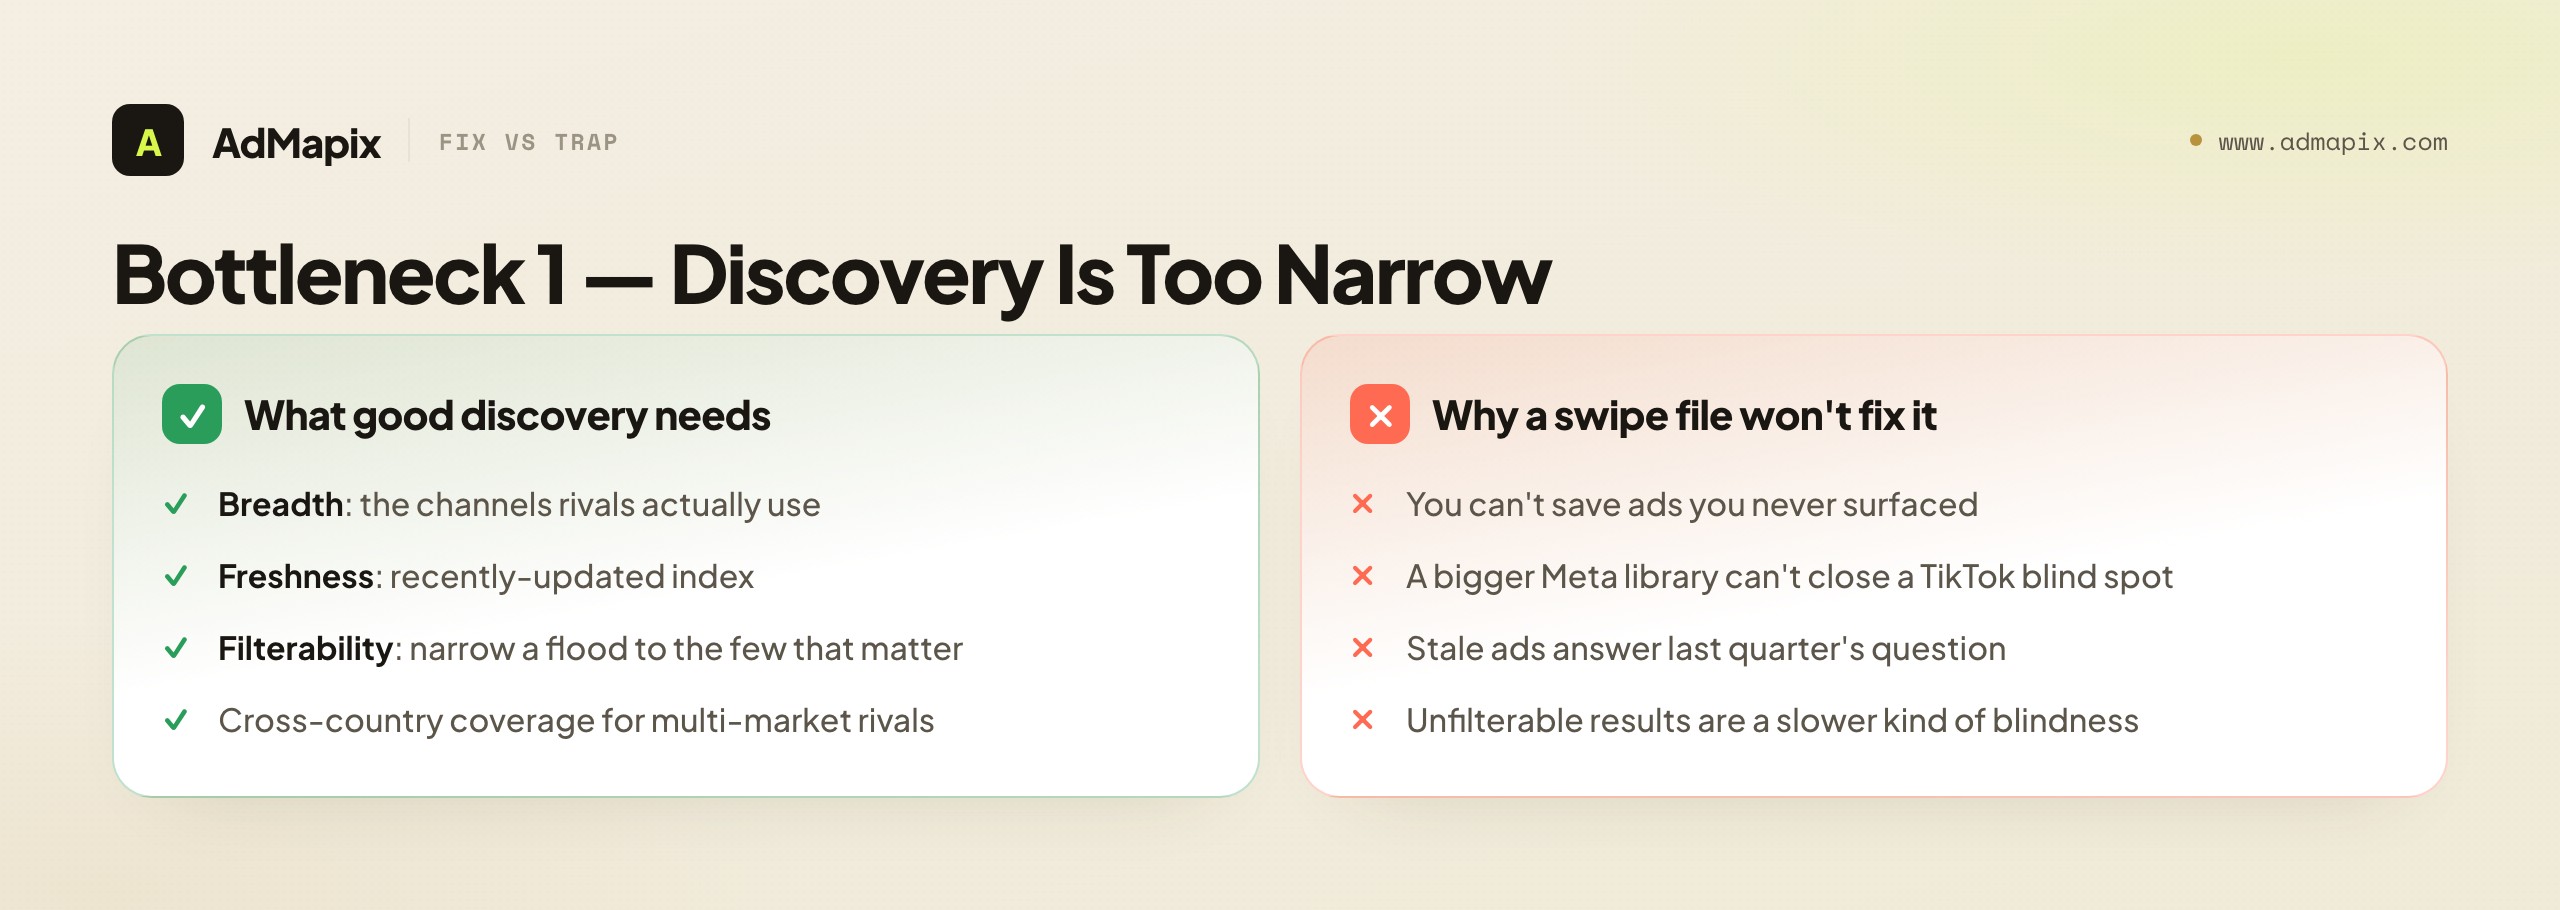
What "good discovery" means concretely is breadth, freshness, and filterability working together. Breadth is cross-network coverage — the channels your competitors actually advertise on, not just the one your current tool happens to index well. If your category lives on TikTok and your tool is strong on Meta but thin on TikTok, you have a structural blind spot that a bigger Meta library cannot close. Freshness is how recently the index was updated; stale ads tell you what worked last quarter, which is the wrong question in a fast-moving creative market. Filterability is whether you can narrow a flood of results down to the handful relevant to your next brief — by format, by network, by recency, by competitor — because an unfilterable flood is just a slower kind of blindness.
The discovery bottleneck is especially acute for teams whose competitors span multiple countries and channels. A US-only, Meta-only view is fine if that is your whole world, but if your rivals are running different creative in different markets, a narrow tool systematically hides the most important signal — the divergence between what works in one region and another. This is where a market-intelligence layer that searches across networks and geographies earns its place over a single-channel swipe tool. We cover the broader landscape of cross-network research in our guide to the best ad spy tools of 2026, which is worth a read if discovery is your primary constraint.
When discovery is your bottleneck, the fix is a tool whose core competence is finding things — broad, fresh, filterable, cross-network search — rather than a tool whose core competence is organizing things you have already found. Those are different products optimized for different jobs, and choosing the organizing tool to fix a finding problem is the most common version of buying the wrong category.
A concrete test for whether discovery is genuinely your bottleneck: when you sit down to research a competitor, do you regularly find yourself thinking "I know they run more than this, I just can't see it"? That nagging sense of a blind spot is the discovery symptom. It shows up as surprise — a colleague or a client mentions a competitor ad you never surfaced, or you stumble on a whole campaign on a channel your tool barely covers. If that happens more than occasionally, no downstream tool will help, because everything downstream operates only on what discovery surfaced. Fixing discovery first is non-negotiable when this is your pattern, because a blind spot at the top of the funnel silently corrupts every step after it: you brief on a partial picture, you ideate from incomplete evidence, and you report with confidence about a landscape you only half saw.
Bottleneck 2: The Swipe File Is Clumsy
If discovery is fine but saving, tagging, and organizing references is the slow, annoying part of every week — if you find good ads but lose them, or your "swipe file" is a chaotic screenshot folder nobody can search — then the swipe-file workflow is your bottleneck, and the right alternative is a tool built first and foremost around fast capture and organization.
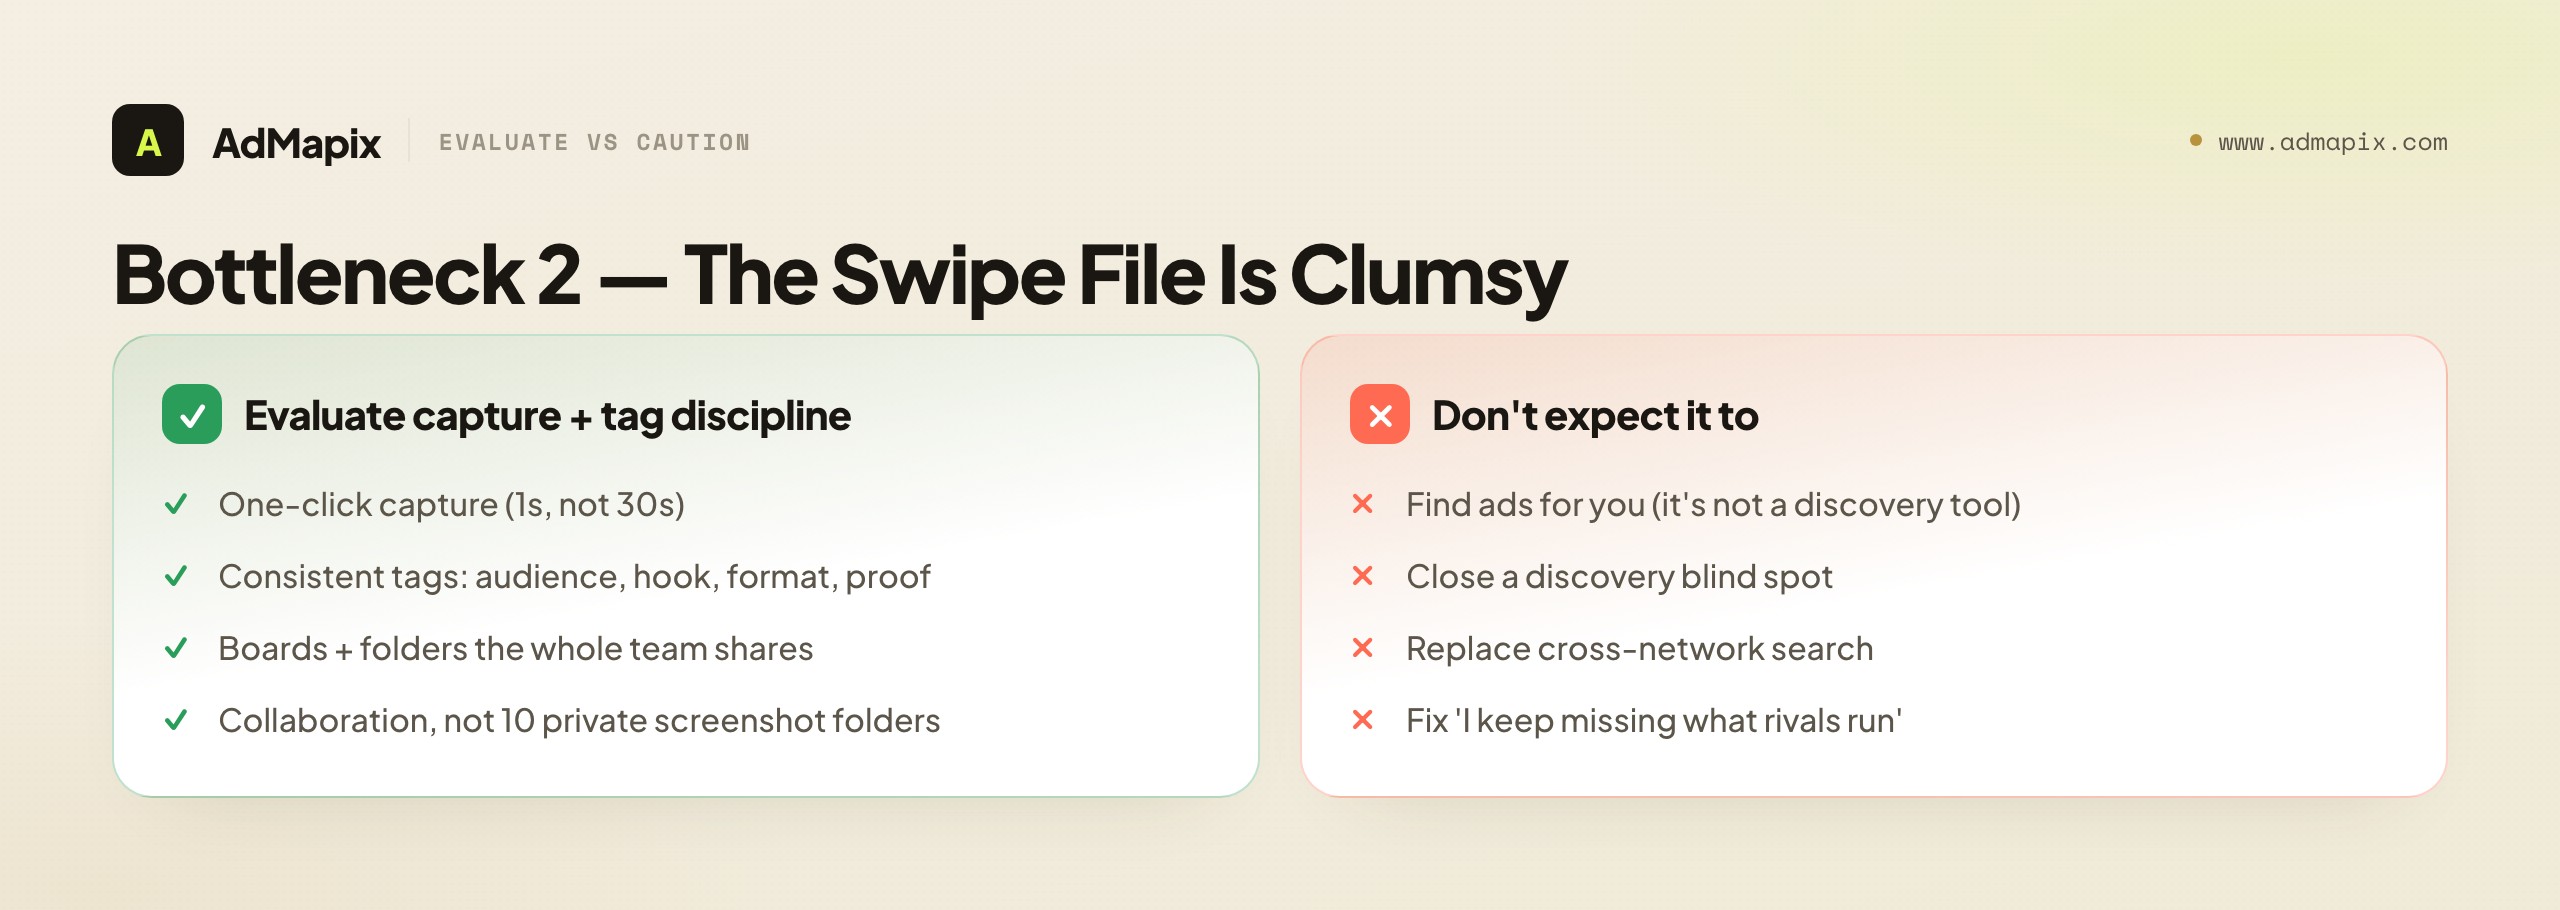
This is the category where swipe-file-first tools like Foreplay and MagicBrief are strongest. Their core competence is the production-team workflow: capture an ad in one click, tag it with a consistent scheme, drop it into boards or folders, and collaborate so the whole team is building one shared, searchable library rather than ten private screenshot graveyards. If your discovery is already adequate and what slows you down is the friction between "I found a good ad" and "it is saved, tagged, and findable later," that friction is exactly what these tools were designed to remove.
The thing to evaluate here is capture speed and tag discipline, not library size. A swipe-file tool succeeds or fails on whether saving a reference takes one second or thirty, and whether your tagging scheme is consistent enough that you can actually retrieve things later by audience, hook, format, or proof type. A beautiful boards UI that is slow to capture into will not get used; a fast capture flow with a sloppy tag scheme produces an unsearchable pile. The best swipe-file workflows make both fast and disciplined. If you are weighing specific swipe-file tools against Atria, our MagicBrief alternative guide goes deeper on that category and how to evaluate it.
A practical tip for getting tag discipline right from day one: design the smallest tag scheme that still lets you answer the questions you actually ask. Most teams over-engineer tags at the start — a dozen dimensions nobody maintains — and end up with an unsearchable mess anyway, because elaborate schemes decay fastest. Start with three or four dimensions that map to how you brief: audience or angle, hook type, format, and proof element. That is usually enough to retrieve what you need without becoming a chore that the team abandons by week three. You can always add a dimension later when you find yourself repeatedly unable to filter for something; you can rarely recover a library that was tagged inconsistently because the scheme was too heavy to keep up. Simplicity is what makes a swipe file stay searchable, and searchable is the entire point.
One caution: a swipe-file tool is not a discovery tool, and many teams discover this the hard way after buying one to fix a discovery problem. If you find yourself with a beautifully organized swipe file that still misses half of what competitors are running, the swipe file was never your bottleneck — discovery was. Re-diagnose before you blame the tool.
There is also a subtle organizational dimension to the swipe-file bottleneck that pure feature comparisons miss: the swipe file only delivers value if the whole team actually uses it consistently. A swipe-file tool that one strategist loves and nobody else touches becomes a private library, which defeats the collaboration that justified buying it in the first place. So when this is your bottleneck, weight the social adoption factors — is capture frictionless enough that a busy buyer will actually do it, is the tagging scheme simple enough that everyone applies it the same way, does the tool fit into where the team already works — at least as heavily as the raw feature set. The best swipe-file tool for your team is the one your team will actually keep using in week ten, not the one with the most impressive boards in the demo. A disciplined, shared, lightly-tagged library beats a feature-rich one that decays into chaos because the tagging was too elaborate to maintain.
Bottleneck 3: The AI Output Is Thin
If your frustration with Atria is specifically that the AI-generated concepts feel generic, untethered, or "could apply to any brand," then your bottleneck is AI grounding — and the fix is not "more AI" but better-grounded AI, fed by real source ads and real constraints.
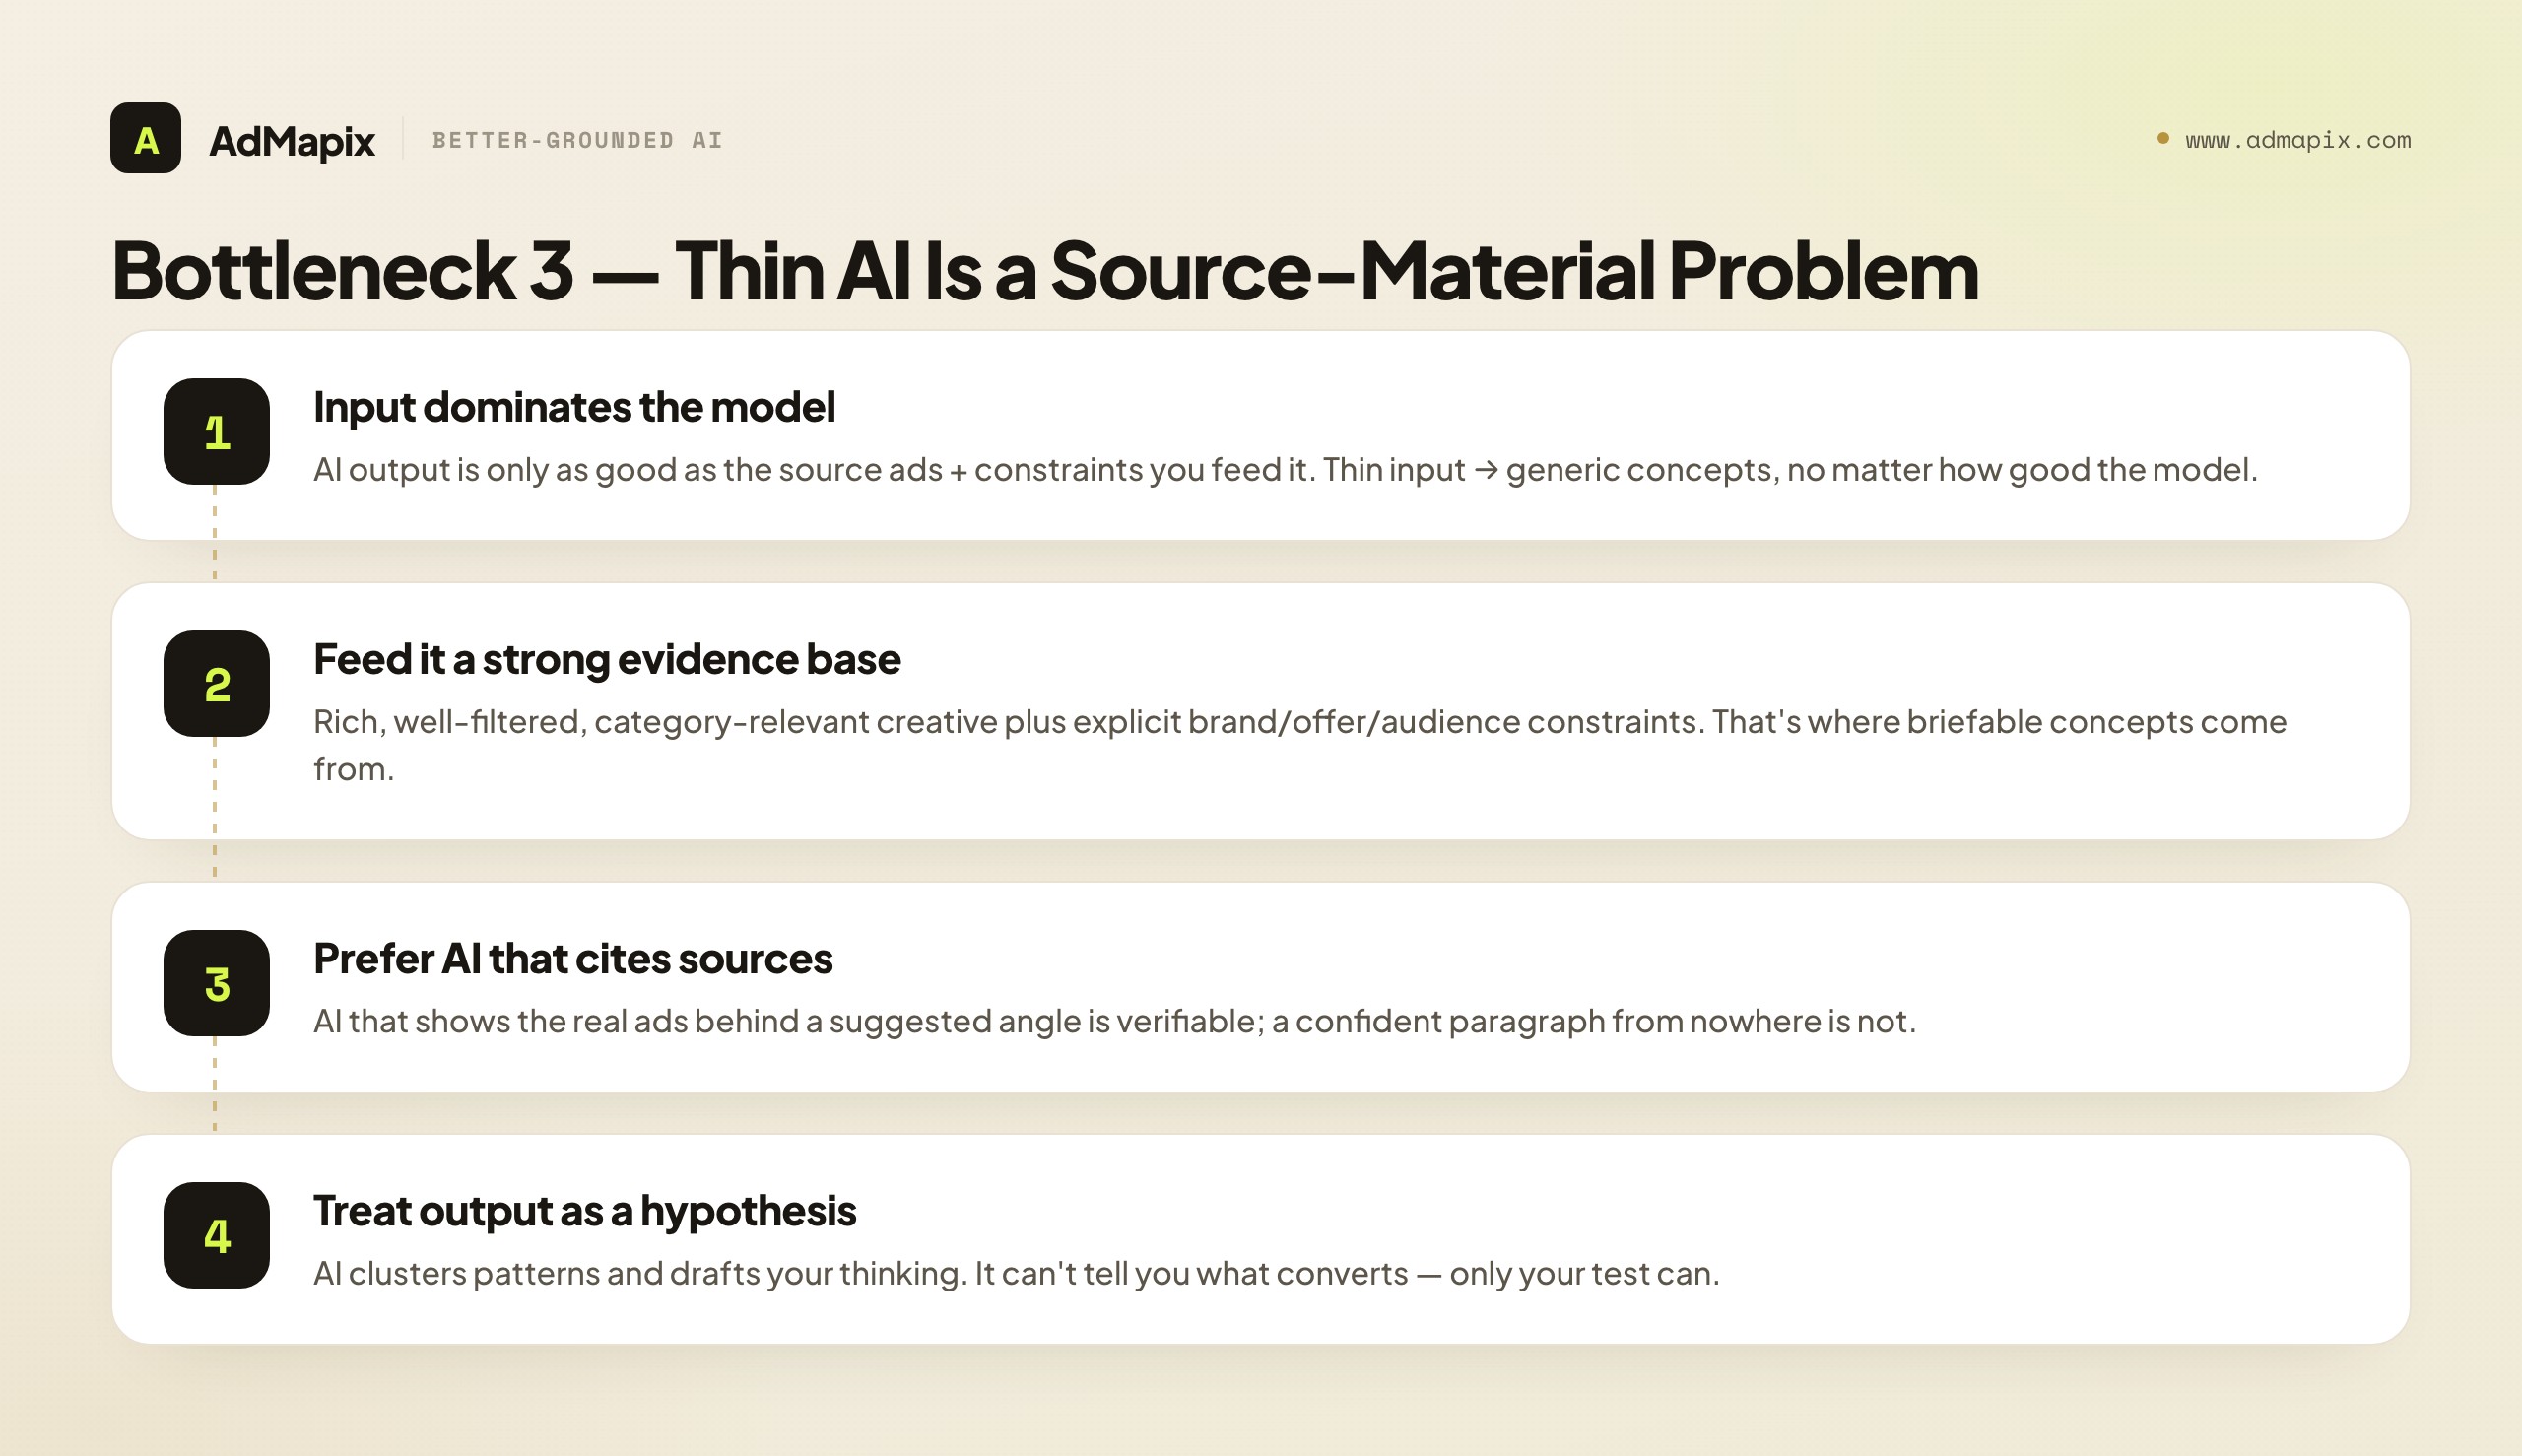
Here is the core truth about AI ideation that vendors rarely state plainly: AI output is only as good as the source ads and constraints you feed it. An AI that ideates from a thin or irrelevant set of reference ads will produce thin, generic concepts, no matter how sophisticated the model. An AI that ideates from a rich, well-filtered set of your category's best-performing creative, with explicit constraints about your brand, offer, and audience, will produce concepts worth briefing. The quality of the input set dominates the quality of the model almost every time. So when AI output feels thin, the usual cause is not the AI — it is the source material the AI was given.
This reframes the fix. Instead of shopping for "a tool with better AI," shop for a tool that lets you assemble a strong, relevant evidence base and then runs AI on top of it, with the source ads visible so you can check the AI's reasoning against real creative. AI that cites its sources — that shows you the actual ads behind a suggested angle — is dramatically more useful than AI that hands you a confident paragraph from nowhere, because you can verify it, push back on it, and use the underlying ads directly. We dig into this dynamic in our guide to AI ad creative tools, which covers how to get useful output rather than confident-sounding filler.
The discipline to carry into any AI-ideation tool: treat the AI summary as a starting point for a human brief, never as proof. The AI can cluster patterns, suggest angles, and accelerate the first draft of your thinking. It cannot tell you what will actually convert your audience — only your test can. Teams that treat AI output as a hypothesis generator get enormous leverage from it; teams that treat it as an oracle ship generic creative and wonder why it underperforms.
It is worth understanding why ungrounded AI produces generic output, because the mechanism tells you how to fix it. A language model generates plausible text from patterns; if you ask it for "ad concepts for a skincare brand" with no specific reference creative, it will return the statistical center of all skincare ads it has ever seen — which is, by definition, generic, because the center of a distribution is the least distinctive point in it. The way to pull the output away from that bland center is to feed it specific, distinctive, recent source ads from your actual category and your actual competitors, plus hard constraints about your offer and audience. The model then has something concrete to react to and build from, and the output sharpens accordingly. This is why "the AI is thin" is almost always a source-material problem in disguise: the model was asked to be creative with nothing distinctive to be creative about. Give it strong evidence and clear constraints and the same model produces briefable concepts; give it a vague prompt and it produces the average of the internet.
Bottleneck 4: Analytics Don't Match Owned-Account Data
If the issue is that your tool's analytics do not square with what you see in your own ad accounts — different numbers, unexplained gaps, a story that does not match your real performance — then the bottleneck is a category confusion: you are asking a creative-intelligence tool to do account analytics, and it cannot.
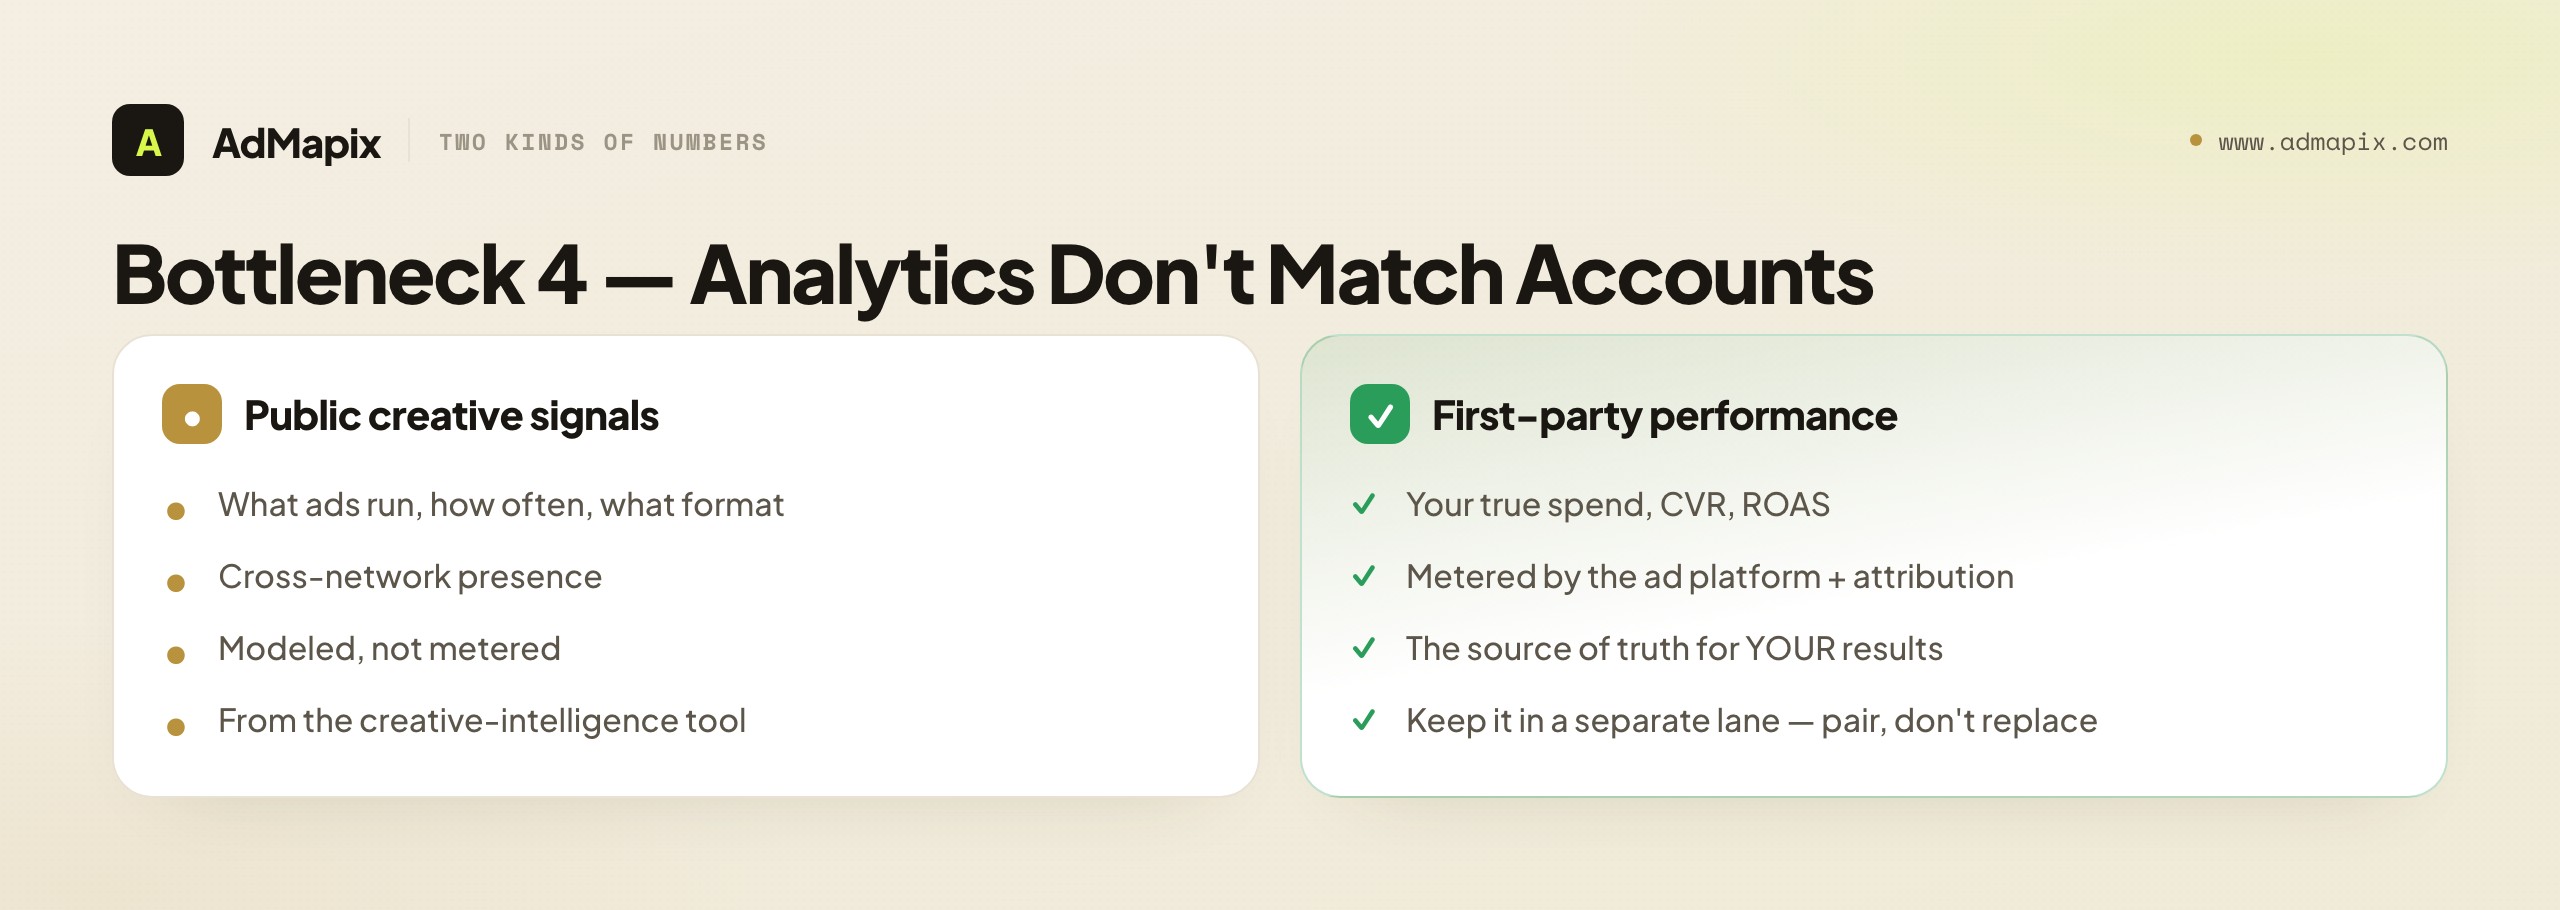
This is worth being blunt about because it causes a lot of wasted shopping. Creative-intelligence and ad-research tools see public signals — what ads are running, how often, in what formats, across which networks. They do not see your account's true performance, and they certainly do not see a competitor's. When a tool's "analytics" seem not to match your owned-account data, that is not a bug to fix by switching creative tools; it is the expected result of comparing modeled public signals against metered first-party data. They are different kinds of numbers measuring different things.
The fix is not to replace your creative tool with a different creative tool that promises better analytics — it is to pair the creative layer with proper account analytics, and to keep the two clearly separated in your head. Your ad platform's own reporting and your attribution stack tell you the truth about your performance. Your creative-intelligence tool tells you what is happening in the competitive creative landscape. Asking either one to do the other's job produces exactly the mismatch that sent you shopping. Keep first-party performance data and public creative signals in separate lanes, and the confusion disappears.
If owned-account performance is genuinely your bottleneck — if you cannot explain why your own campaigns are doing what they are doing — no creative-intelligence tool is your answer. You need analytics and attribution, and the creative tool is a complement to that, not a substitute. We map the broader tool landscape in our guide to the best ad intelligence tools, including where the analytics line falls.
The reason this confusion is worth dwelling on is that the two kinds of data actually work best together, once you stop expecting one to be the other. Your first-party analytics tell you what is working in your own account — which creatives are scaling, which are fatiguing, where cost per result is climbing. Your creative-intelligence layer tells you what is happening in the competitive landscape — which angles rivals are amplifying, what formats are spreading, where the category is moving. The powerful move is to read them side by side: when your own data shows a creative fatiguing and your competitive data shows the category shifting to a new angle, that alignment is a strong signal about where to point your next test. Neither layer produces that insight alone; the synthesis does. So the goal is not to find one tool that does both adequately — it is to run both and to have one person read them together each cycle, which is a far more productive frame than endlessly shopping for a creative tool whose analytics will finally "match," because they never will, and they were never supposed to.
Bottleneck 5: Reporting Doesn't Travel
If your bottleneck is the last mile — you can find, save, and ideate, but you have no clean way to package the evidence into something that survives a client meeting or an internal review — then reporting is your slow step, and the right alternative is one whose output is structured, exportable, and client-ready by default.
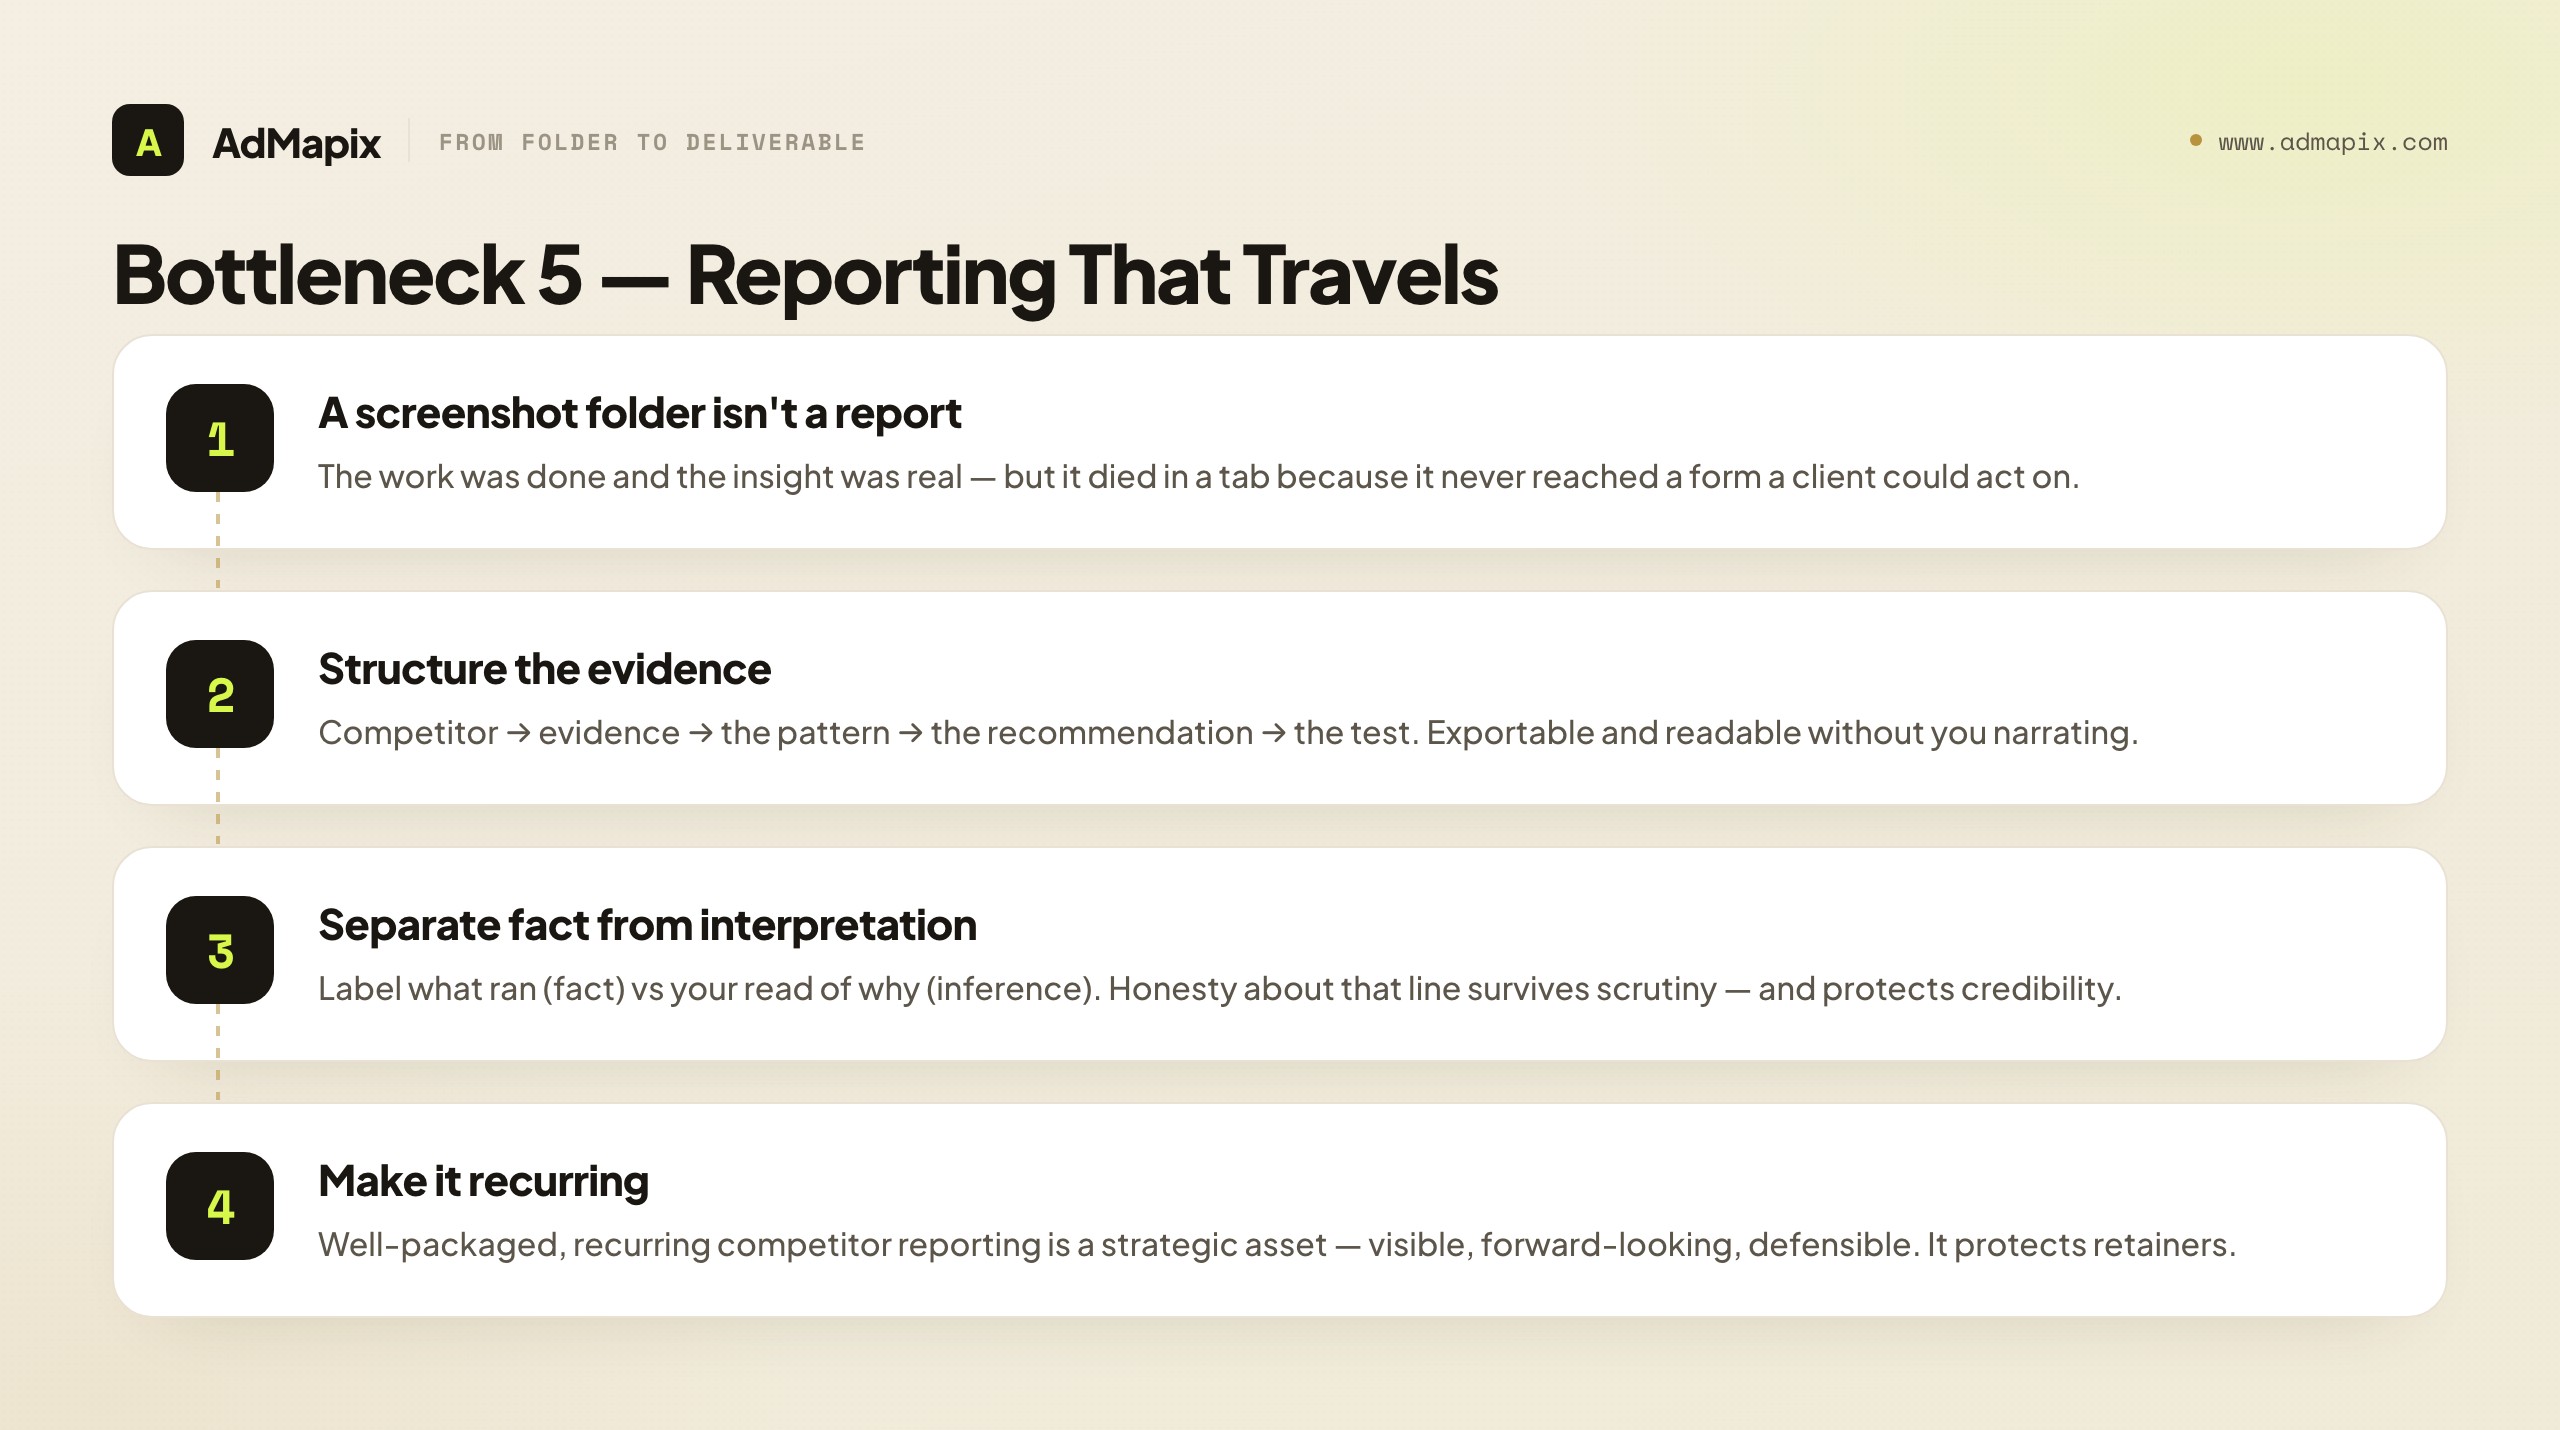
This bottleneck is most acute for agencies and any team that has to justify its creative decisions to someone who was not in the research. A folder of screenshots is not a deliverable. A structured report — competitor, evidence, the pattern you observed, the recommendation, and the test you propose — is. The gap between those two is where a lot of creative-research value leaks out: the work was done, the insight was real, but it never made it into a form that a client or executive could act on, so it died in a tab.
What to evaluate here is whether the tool produces output that travels: can you export it, is it structured rather than a raw dump, does it cleanly separate fact (what ran) from interpretation (your read of why), and can a client read it without you narrating? The fact-versus-interpretation separation matters enormously in client work, because the moment you present a modeled estimate or a hypothesis as if it were fact, your credibility is at risk the first time someone checks. A report that is honest about what is observed versus inferred is more persuasive, not less, because it survives scrutiny.
The deeper point is that recurring, well-packaged competitor reporting is itself a strategic asset, especially for agencies — it makes the work visible, forward-looking, and defensible, which is exactly what protects a retainer. We cover the discipline of turning competitor signals into recurring, decision-driving reports in our ad tracking and competitive research guide.
A useful structure for a report that travels is to end every section with a decision, not an observation. "Competitor X launched three new UGC testimonial videos this month" is an observation, and observations are where reports go to die — the reader nods and moves on. "Competitor X has shifted to UGC testimonials; we recommend testing a testimonial hook against our current feature-led opener, measured on three-second view rate over two weeks" is a decision, and decisions force a response. The difference between a report that drives action and a report that gets filed is almost entirely whether each finding is tied to a recommendation and a test. When you evaluate a reporting-focused tool, check whether its output nudges you toward decisions or just toward prettier observations; the former is worth far more, because the entire point of the reporting layer is to convert research into the next move. A tool that makes it easy to produce beautiful observation-only decks is, paradoxically, a trap — it makes the unproductive thing easy.
Where AdMapix Fits (and Where It Doesn't)
We will be precise about where AdMapix fits, because the whole point of this guide is to match the tool to the bottleneck rather than oversell a single product. AdMapix is a creative-intelligence and ad-research layer. It fits teams whose bottleneck is on the discovery-to-report side: cross-network creative search, saving the media worth keeping, breaking down video, and packaging findings into shareable reports before a brief — especially when competitors span multiple countries and channels, which is exactly where narrow, single-channel tools fail.
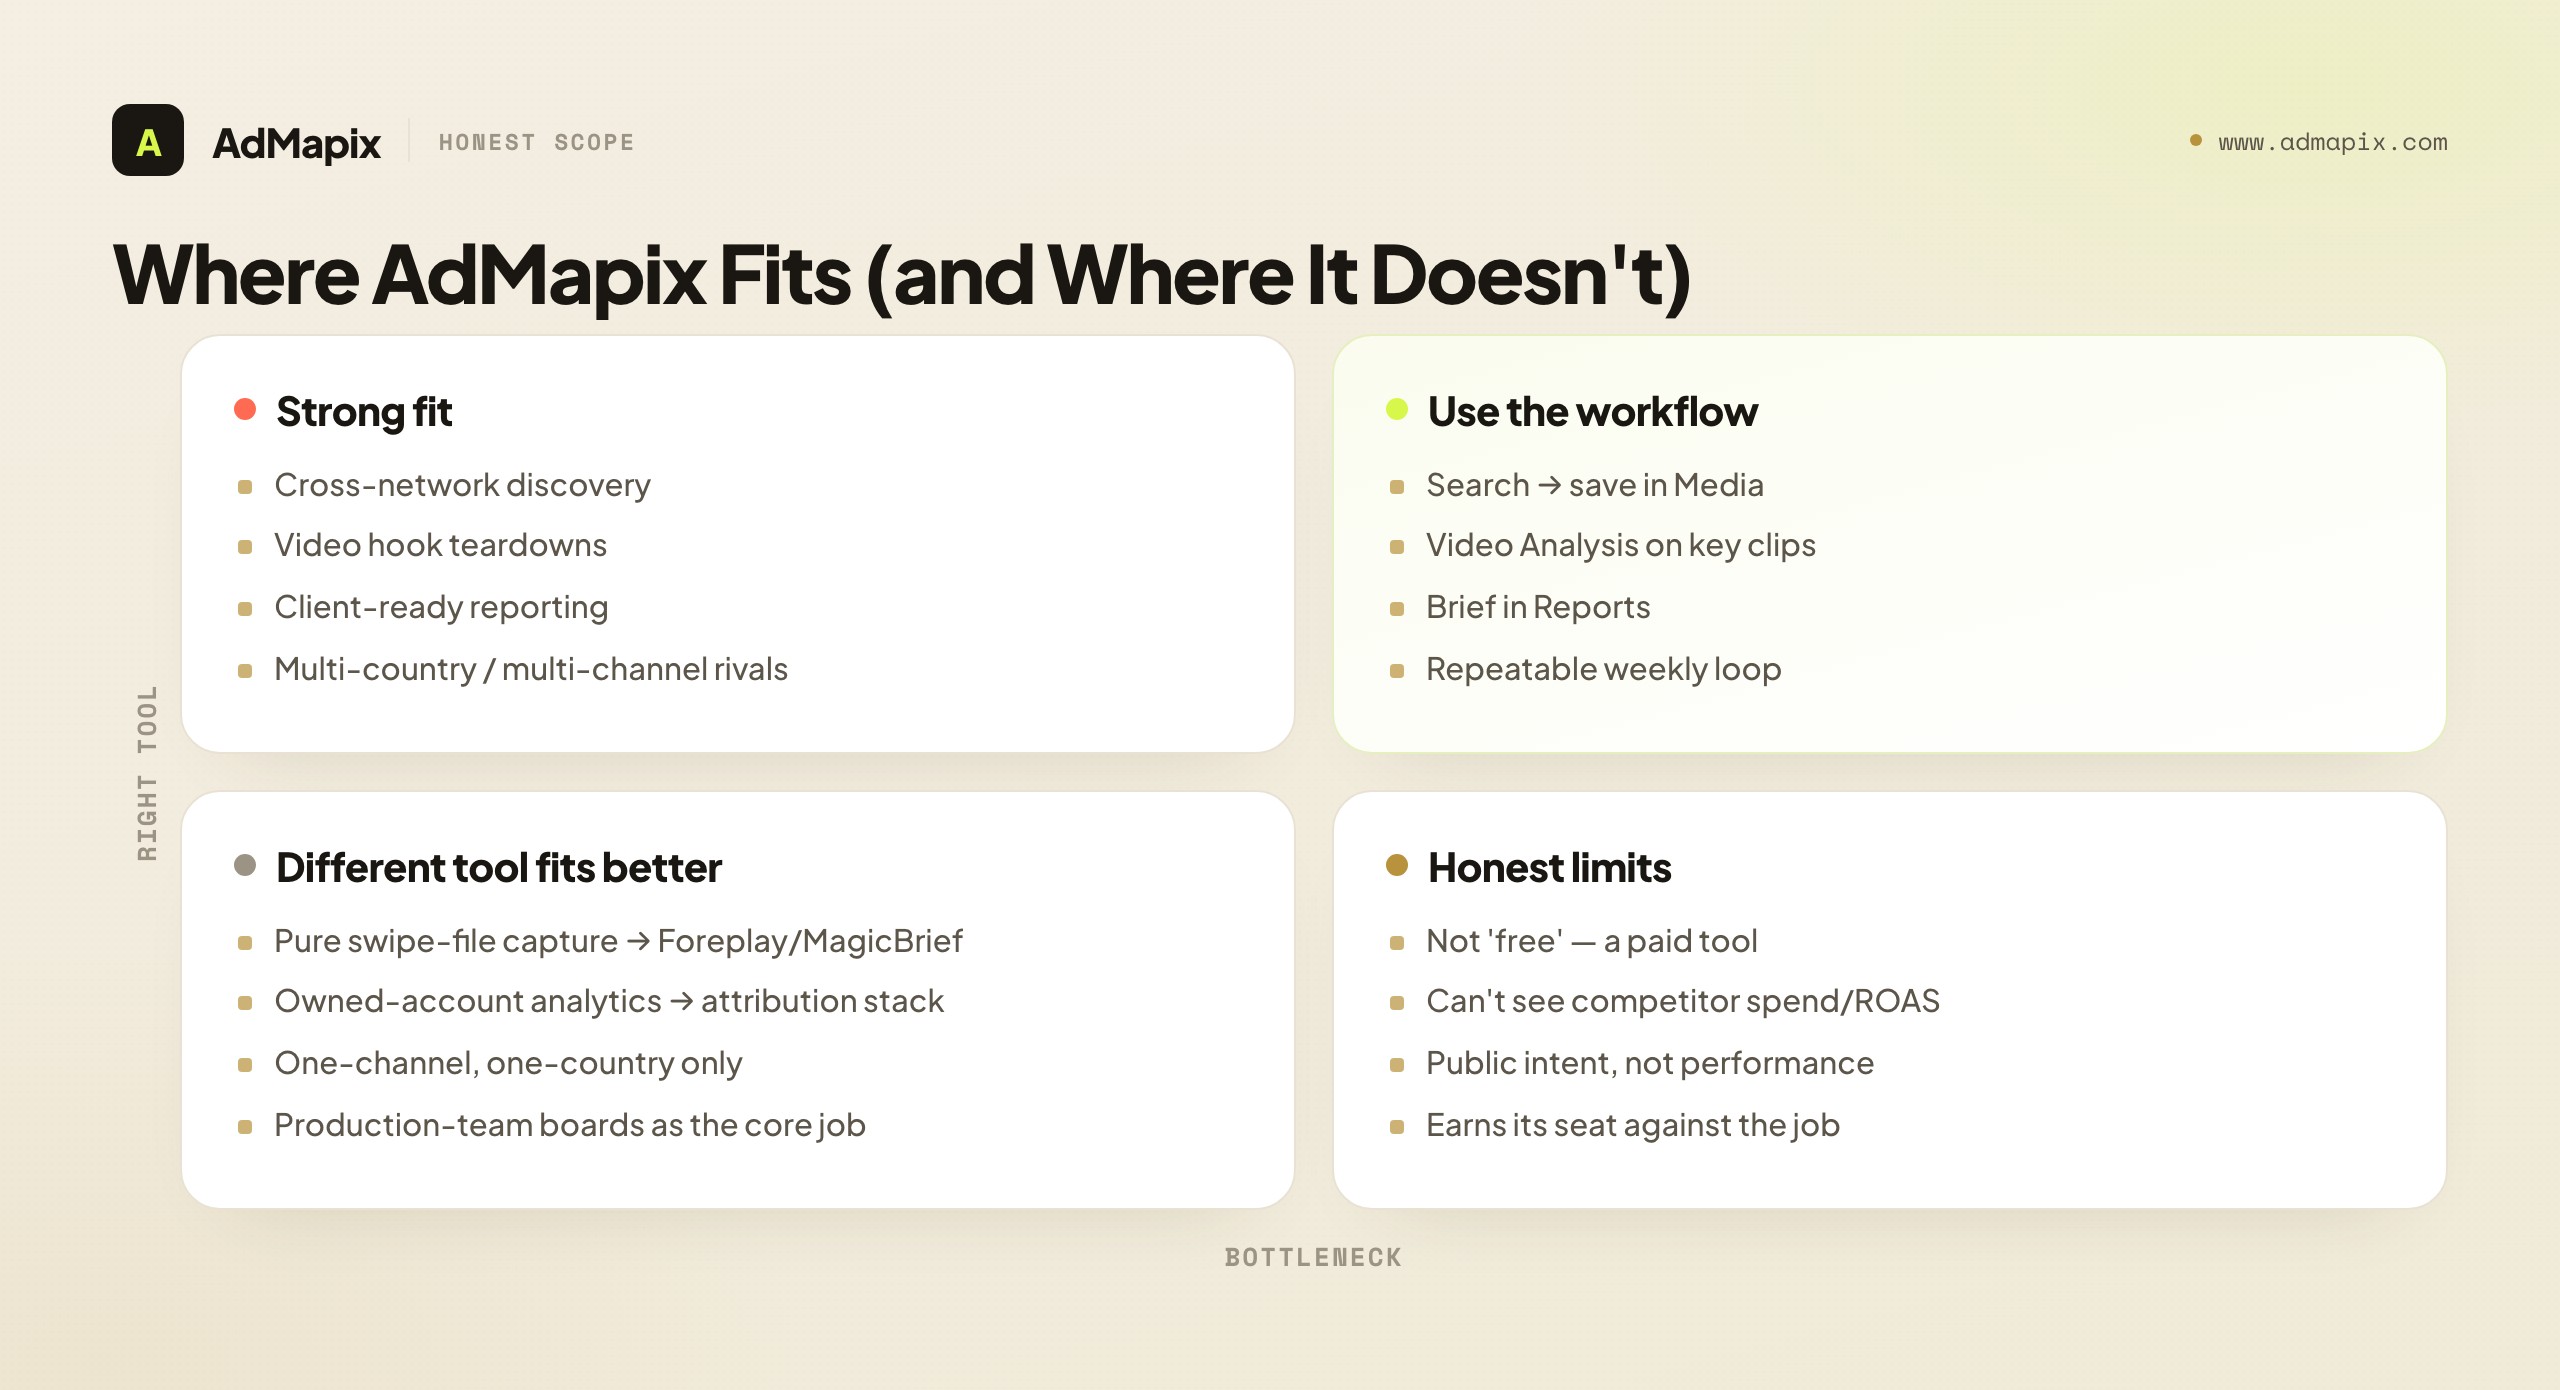
It is not the right fix for every bottleneck on the list, and we will say so. If your slow step is purely the production-team swipe-file workflow — one-click capture, boards, tight collaboration on references you have already found — a swipe-file-first tool may fit that specific job better, and that is a fine answer. If your bottleneck is owned-account performance, you need analytics and attribution, not a creative tool of any kind. AdMapix does not do account analytics, it does not see competitor spend or ROAS, and we are not going to call it "free" — it is a paid product that should earn its seat against the job it actually does. Where it is strongest is the cross-network discovery, video analysis, and reporting layer; where another category fits better, we would rather tell you than sell you a mismatch.
To make the fit concrete, here is the kind of team AdMapix suits best and the kind it does not. It suits a growth or agency team whose competitors run creative across several networks and countries, who need to find what is new and consequential quickly, break down the videos that matter, and turn the evidence into a brief or a client-ready report on a weekly rhythm — the discovery-through-reporting span. It suits less well a single-channel, single-country brand whose entire creative world is one platform and whose only real friction is one-click saving into a shared board for a production team; that team's slow step is swipe-file capture, and a capture-first tool is the cleaner fit for that specific job. The honest framing is that AdMapix is a market-intelligence-leaning creative layer, not a production-team swipe file, and the two have different centers of gravity. Matching the tool's center of gravity to your bottleneck's center of gravity is the whole game, and it is why the two dedicated comparisons later in this guide exist — to show exactly where each tool's strength sits rather than pretend any one tool wins everywhere.
The practical workflow looks like this. Use Search AdMapix to find competitor creative across networks and geographies, Media to save the strongest examples so you are not re-finding them every week, Video Analysis to break down hooks and first-screen structure where paid-social tests are actually won, and Reports to package the evidence into something a team or client can act on. A concrete weekly loop: take your three-to-five-competitor set, run it in Search AdMapix, save the best in Media, break down the two or three most consequential videos in Video Analysis, and write the brief in Reports — naming the angle you will test and the metric you will judge it by. That loop turns scattered competitor watching into a repeatable, decision-driving deliverable.
The reason this discovery-to-report loop is worth building deliberately is that it closes a gap most teams leave open: the gap between watching competitors and actually deciding something because of it. Plenty of teams "keep an eye on competitors" in a loose, ad-hoc way that produces a vague sense of the landscape and almost no decisions. The structured loop — same competitor set, same cadence, search to saved evidence to video teardown to a brief that names a test — converts that loose watching into a steady stream of testable hypotheses. The value is not in any single search; it is in the compounding effect of a saved evidence base that gets richer every week, so that month three shows you trajectories and shifts you could never see in a one-off look. That compounding is the real product, and it is why a tool that merely surfaces ads (without a place to save, analyze, and report) leaves most of the value on the table.
If the workflow earns its place — if it is genuinely shaving time off your weekly research and producing briefs your team acts on — compare seats on Pricing or start from Login. If you are specifically weighing AdMapix against the two best-known swipe-file tools, we have dedicated comparisons: Atria vs MagicBrief and Atria vs Foreplay, which break down where each tool's center of gravity actually sits. For the broader swipe-file category and how to evaluate it against an ideation-led tool like Atria, the MagicBrief alternative guide and the rundown of ad hook examples are both useful companions.
What Public Ad Data Can and Cannot Prove
This is the most important section in the guide, because misreading public ad data is the costliest mistake in this entire category — and it applies to Atria, to AdMapix, and to every creative tool with an AI layer equally. The discipline is simple to state and hard to hold: know the difference between evidence and proof.
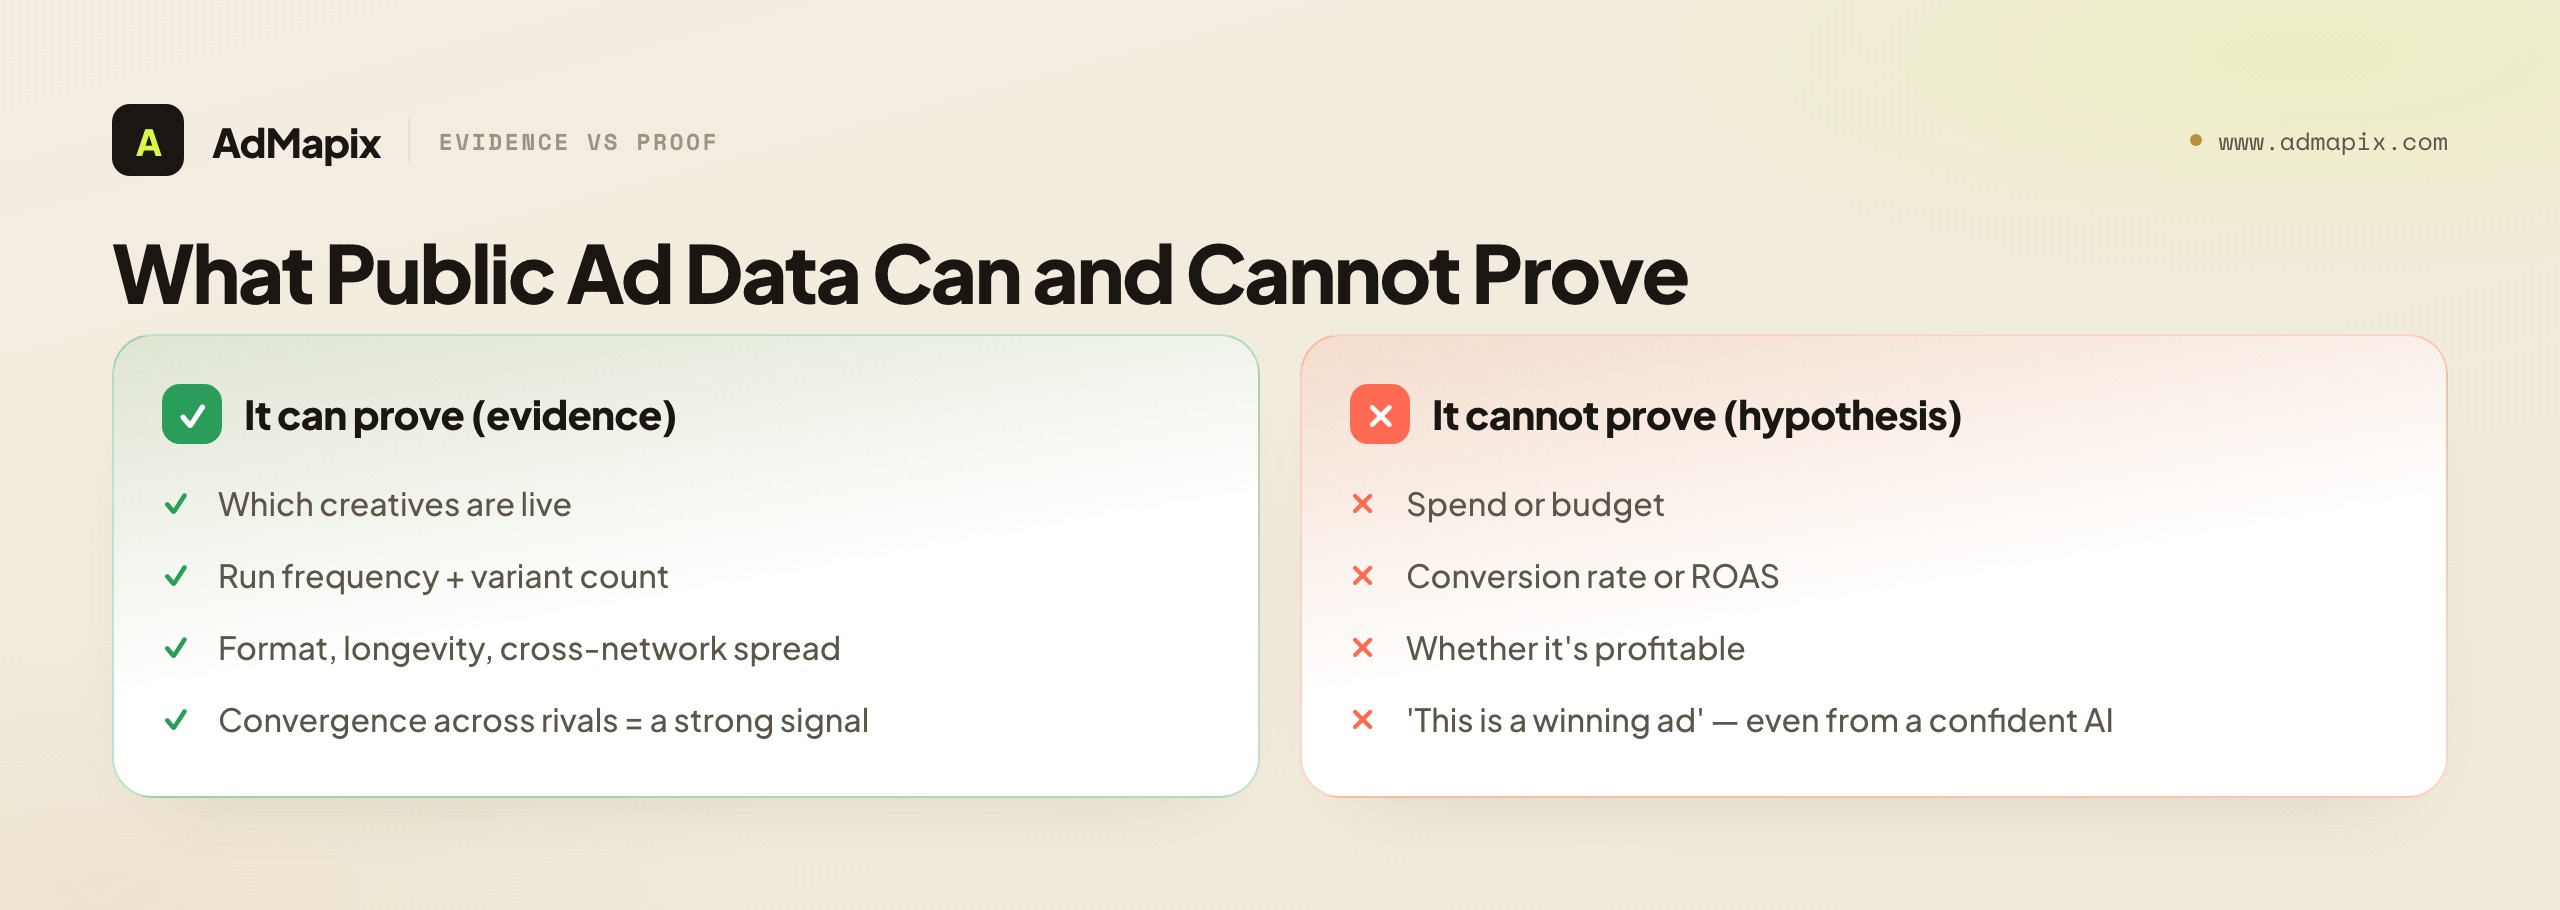
Competitor ads are evidence of intent, not proof of performance. When you find a competitor running a specific video hook or offer framing across many variants, sustained over weeks, that is strong evidence they are investing in it and likely iterating. It is not proof that it works. The public data does not reveal their spend, their conversion rate, their ROAS, or whether the campaign is profitable. A competitor can run a creative heavily for reasons that have nothing to do with it converting — brand calendars, internal politics, a misread dashboard, plain inertia. No public tool, AdMapix included, can see a competitor's internal performance data. Any tool — or any AI summary — that claims to surface "winning ads" from public data alone is overselling what the data can structurally support.
The AI layer makes this trap more dangerous, not less, because a confident AI paragraph feels like proof even when it is built on the same public-intent data. When an AI tool tells you "this is a winning hook," what it can actually justify is "this hook appears frequently across competitors," which is an intent signal, not a performance result. Treat the AI's confidence as a property of the model's writing style, not as evidence about the world. The honest read is always the same: heavily-run creative is a hypothesis worth testing, and your own results are the only proof.
There is, however, a genuinely reliable use of public data that is easy to underrate: convergence. If several independent competitors all shift to the same format or angle within a short window, that convergence is much harder to fake than any single advertiser's choice, and it is near-certain reason to at least test that direction — regardless of whether you can see anyone's exact numbers. Use public data defensively first (am I the last team in my category to notice this shift?) and offensively second (which specific angle do I borrow?). The defensive read is where a lot of underrated value lives. We go deeper on this whole discipline in our competitive analysis for paid advertising guide.
This is also the honesty test to apply to any vendor, ours included. Ask point-blank: "Can your tool — or your AI — tell me how a competitor's specific ad actually performed?" The correct answer is no, with an explanation of what it can show: run frequency, variant count, format, longevity, cross-network spread, and convergence patterns across rivals. If you hear "yes, we show you their winners," or if an AI feature confidently labels ads as "high-performing" without any access to performance data, you are being sold a story the data cannot back. A tool that is honest about this boundary is more trustworthy on everything else, because it means the vendor understands the difference between what is observed and what is inferred — the same difference your own reports have to respect.
The unifying practice across every bottleneck and every tool: use public data and AI output to form hypotheses, then validate with data you own. The competitor ad suggests an angle; your test proves whether it works for your audience. Keep that line crisp — evidence and ideation in, proof from your own results — and you get the full value of any Atria alternative while sidestepping the expensive mistake of mistaking a confident summary for a fact.
A Practical Decision Path
If you remember nothing else, remember the order of operations. The tool is the last decision, not the first.
Start by naming the single slowest step in your weekly creative cycle — the moment you dread. Is it finding what competitors run (discovery)? Saving and organizing what you find (swipe file)? Turning evidence into concepts (AI ideation)? Explaining your own performance (analytics)? Or packaging it for a client (reporting)? Be honest and specific; "the whole thing is slow" is not a diagnosis, it is an avoidance of one.
Then map that step to its tool category using the bottleneck table, and shortlist only within that category. Discovery points to a cross-network market-intelligence layer; swipe-file friction points to a capture-first tool; thin AI points to a better-grounded ideation layer; analytics mismatch points to account analytics, not a creative tool at all; reporting friction points to a tool with structured, exportable output.
Next, evaluate by running the same three-to-five-competitor job through each candidate across two or three sessions, and score time-to-brief and output quality — not feature count, not library size. Verify current coverage and pricing on the plan you would actually buy before you migrate a workflow onto it.
Finally, treat every competitor ad and every AI suggestion as a hypothesis, and validate with your own results. That single discipline protects you from the most expensive mistake in the category. Do that, and "Atria alternative" stops being a vague vendor hunt and becomes a precise question with a precise answer: the tool that removes your slowest step.
The deeper lesson underneath all of this is that tooling decisions are downstream of an honest read of your own workflow. The teams that waste the least are not the ones with the biggest tool budgets — they are the ones who slow down for a week to measure where their time actually goes before they ever open a vendor's pricing page. Most wasted spend in this category is not a bad tool; it is a perfectly good tool bought to fix a bottleneck that was never the real one, because nobody measured first. Spend the diagnostic week. It is the cheapest, highest-leverage week in the whole process, and it turns a confusing market of overlapping tools into a simple matching problem: this is my slow step, this is the category that fixes it, this is the tool in that category that fits my team and my budget. Everything else is noise dressed up as due diligence.
FAQ
What is the best Atria alternative?
There is no single best one — it depends on your slowest step. If discovery is too narrow, you want a broad, fresh, cross-network market-intelligence layer. If saving and organizing references is the slow part, a swipe-file-first tool like Foreplay or MagicBrief fits. If AI output feels thin, you want better-grounded ideation fed by real source ads. If reporting does not travel, you want structured, exportable output. Name the bottleneck first; the best alternative is whichever tool removes that specific friction, not whichever has the biggest library.
Can AdMapix replace Atria?
It depends on which part of Atria you rely on. AdMapix covers cross-network creative discovery, saved media, video analysis, and shareable reports, so it replaces Atria's discovery-to-report side well — especially for multi-country, multi-channel competitors. It is not a pure production-team swipe-file tool, and it does not do owned-account analytics or see competitor spend or ROAS. If your core use of Atria is AI ideation plus discovery and reporting, AdMapix fits; if it is purely fast swipe-file capture, a capture-first tool may fit that job better.
How should I compare Atria alternatives?
Run the same job through each tool rather than counting features. Pick three to five real competitors, search them in every candidate, save the best examples, and write one brief from the evidence. Then compare time-to-brief and output quality, and run the set across two or three sessions so a lucky single search does not mislead you. Weight the criteria by your bottleneck. The smaller, better-filtered tool that gets you to a usable brief faster beats the giant library that buries you.
Is AI ad ideation reliable?
It is reliable as a starting point, not as proof. AI ideation is only as good as the source ads and constraints you feed it — rich, relevant input produces useful concepts; thin input produces generic ones. The AI can cluster patterns and accelerate your first draft, but it cannot tell you what will convert your audience; only your test can. Treat AI output as a hypothesis generator and validate with your own results, and prefer tools whose AI cites the real source ads behind a suggestion so you can check its reasoning.
Does competitor ad data show how well an ad performed?
No. Public ad data shows what is running and how often it is varied, which signals investment and iteration. It does not reveal spend, conversion rate, or ROAS. A competitor can run a creative heavily and still lose money on it. Use the data to form hypotheses about what to test, then validate performance with your own campaign and business metrics. Any tool or AI summary claiming to show competitor "winners" from public data alone is overselling what the data can support.
Should I pick a swipe-file tool or a market-intelligence layer?
It depends on your bottleneck. Pick a swipe-file-first tool when saving, tagging, and organizing references you have already found is the slow, annoying part of every week — that is its core competence. Pick a market-intelligence layer when cross-channel discovery, video breakdowns, or client-ready reporting is the slow step. Many teams eventually use both: a discovery and reporting layer to find and package, and a swipe-file tool for the production team's daily reference work. The point is to match each tool to the step it actually fixes.
Why doesn't my creative tool's analytics match my ad accounts?
Because they measure different things. Creative-intelligence tools see public signals — what ads run, how often, in what formats — not your account's true, metered performance. Your ad platform's own reporting and your attribution stack are the source of truth for your performance; the creative tool tells you about the competitive landscape. The mismatch is expected, not a defect. The fix is to pair the two and keep them in separate lanes, not to swap creative tools chasing analytics a creative tool was never built to provide.
How important is video analysis in a creative tool?
For paid social, it is often the most important capability, because that is where tests are actually won. The first few seconds — hook, pacing, offer framing — frequently decide a creative's fate more than anything else, and a tool that only shows static ad thumbnails leaves that signal on the table. If your competitors compete on video, your intelligence layer needs to break video down, not just collect it. If your category is mostly static, video analysis matters less and you can weight discovery and swipe-file workflow higher instead.
How does Atria compare to MagicBrief and Foreplay?
Atria centers on AI ad workflow — insights, inspiration, and ideation. MagicBrief and Foreplay center on the swipe-file and brief workflow for production teams, with strong capture and organization. They overlap but have different centers of gravity, so the right pick depends on whether your bottleneck is ideation, discovery, or organizing references. We break the head-to-heads down in our Atria vs MagicBrief and Atria vs Foreplay comparisons, and cover the swipe-file category in the MagicBrief alternative guide.
How often should I review competitor creative?
A weekly or biweekly cadence works for most teams, matched to your creative production rhythm. The goal is to catch format shifts and new angles early enough to test them before they are exhausted, not to watch competitors constantly. Save the strongest evidence so each review builds on the last instead of starting from scratch, and end every review with a concrete test recommendation. Cadence plus a saved evidence base is what turns ad-watching into a compounding advantage rather than busywork.
Key Takeaways
- The best Atria alternative is the one that fixes your slowest step — name the bottleneck before you shortlist any tool.
- The five common bottlenecks (narrow discovery, clumsy swipe file, thin AI, mismatched analytics, untravelable reporting) each point to a different tool category.
- Compare by running the same job through each tool and scoring time-to-brief and output quality, not library size.
- AI ideation is only as good as its source ads and constraints — treat its output as a hypothesis, never as proof.
- Public ad data proves intent, not performance; no tool sees competitor spend or ROAS. Validate every angle with your own results.
- AdMapix fits the cross-network discovery, video analysis, and reporting bottleneck — and is not a substitute for a swipe-file tool or account analytics.
Sources
Official pages checked as of June 21, 2026. Pricing, product names, and availability can change, so verify the current plan before purchase or migration.
- Atria — positions itself as an AI ad workflow platform built around creative insights, inspiration, and ideation.
- Foreplay — describes itself as a swipe-file and creative workflow tool for saving, organizing, and briefing ad references.
- MagicBrief — positions itself around saving competitor ads, building briefs, and creative analysis for performance teams.
- Meta Ad Library and TikTok Creative Center — public ad-transparency surfaces that creative tools index and that show what is running, not how it performed.
Disclosure: AdMapix is our product. We include it where the job is cross-network creative research, video analysis, and reporting, and we point to other categories where they fit a bottleneck better. We do not describe it as free, and we do not claim it (or any tool) can see competitor spend or performance, because no public tool can.
See what competitors are really running
Search 6M+ ad creatives, landing pages, and weekly spend across 200+ countries. No credit card, no commitment.
Related Articles
Semrush Ad Intelligence Alternative in 2026: PPC Research or Creative Evidence?
A 2026 decision framework for choosing a Semrush ad intelligence alternative — when PPC keyword and spend research wins, when competitor creative and video evidence wins, how AdClarity fits, a fair-trial method, and how to build a two-layer stack.
Moat Alternative in 2026: Ad Verification vs. Creative Intelligence
A complete 2026 buyer's guide to choosing a Moat alternative — why teams look past Oracle Moat, what Moat actually does (viewability, invalid traffic, brand safety), the critical split between the ad-verification layer and the creative-intelligence layer, a layered comparison across coverage and fit, who should choose which, a practical migration plan, the honest limits of public creative data, and where a creative-research tool like AdMapix fits.
Pathmatics Alternative in 2026: Ad Spend Intelligence vs. Creative Workflow
A complete 2026 buyer's guide to choosing a Pathmatics alternative — why teams look past Pathmatics (now Sensor Tower), what it actually measures, a layered comparison of spend-intelligence suites versus creative-workflow tools across coverage, data type, price, and fit, who should choose which, a practical migration plan, the honest limits of estimated spend, and where a lighter cross-network creative tool like AdMapix fits.