Ad Creative Intelligence 2026: What Top Ads Do Differently
The definitive 2026 ad creative intelligence playbook — what creative intelligence actually is, the operating loop that turns public ad evidence into shipped winners, the trends compressing creative lifespans, a maturity model, a weekly SOP, the honest limits of public data, and an FAQ that settles the terminology.
Ad Creative Intelligence 2026: What Top Ads Do Differently
Updated June 21, 2026 — written and reviewed by the AdMapix Research team.
Ad creative intelligence is the discipline of systematically reading the ad creative your market produces — the hooks, formats, offers, and proof that competitors and category leaders put in front of buyers — and converting that evidence into your own faster, better-targeted creative testing. It is the layer that sits between raw ad data and shipped winners: not "look at pretty ads," and not "guess what to make next," but a repeatable loop that turns what's visible in the market into what's testable in your account. The most successful ad programs in 2026 aren't "creative-first" or "media-first" — they are intelligence-first, because creative lifespans have compressed to the point where the brand that decodes what's working this week ships winners while everyone else recycles last quarter's hooks. This playbook is the definitive guide to building that capability. If you want to drill into a single ad, pair it with our ad creative analysis scorecard; for the broader competitive lens, see the competitor ad analysis framework; and for the tooling landscape, the best ad intelligence tools round-up maps the market.
This is a long, opinionated document because ad creative intelligence is frequently sold as a dashboard and practiced as a vibe. We're going to define it precisely, give you the operating loop and the maturity model, walk the 2026 trends that make it urgent, and — crucially — be honest about what public ad evidence can and cannot prove, because the fastest way to lose money with "intelligence" is to mistake evidence of creative for proof of performance. By the end you'll have a system you can stand up in a week and grow for a year.
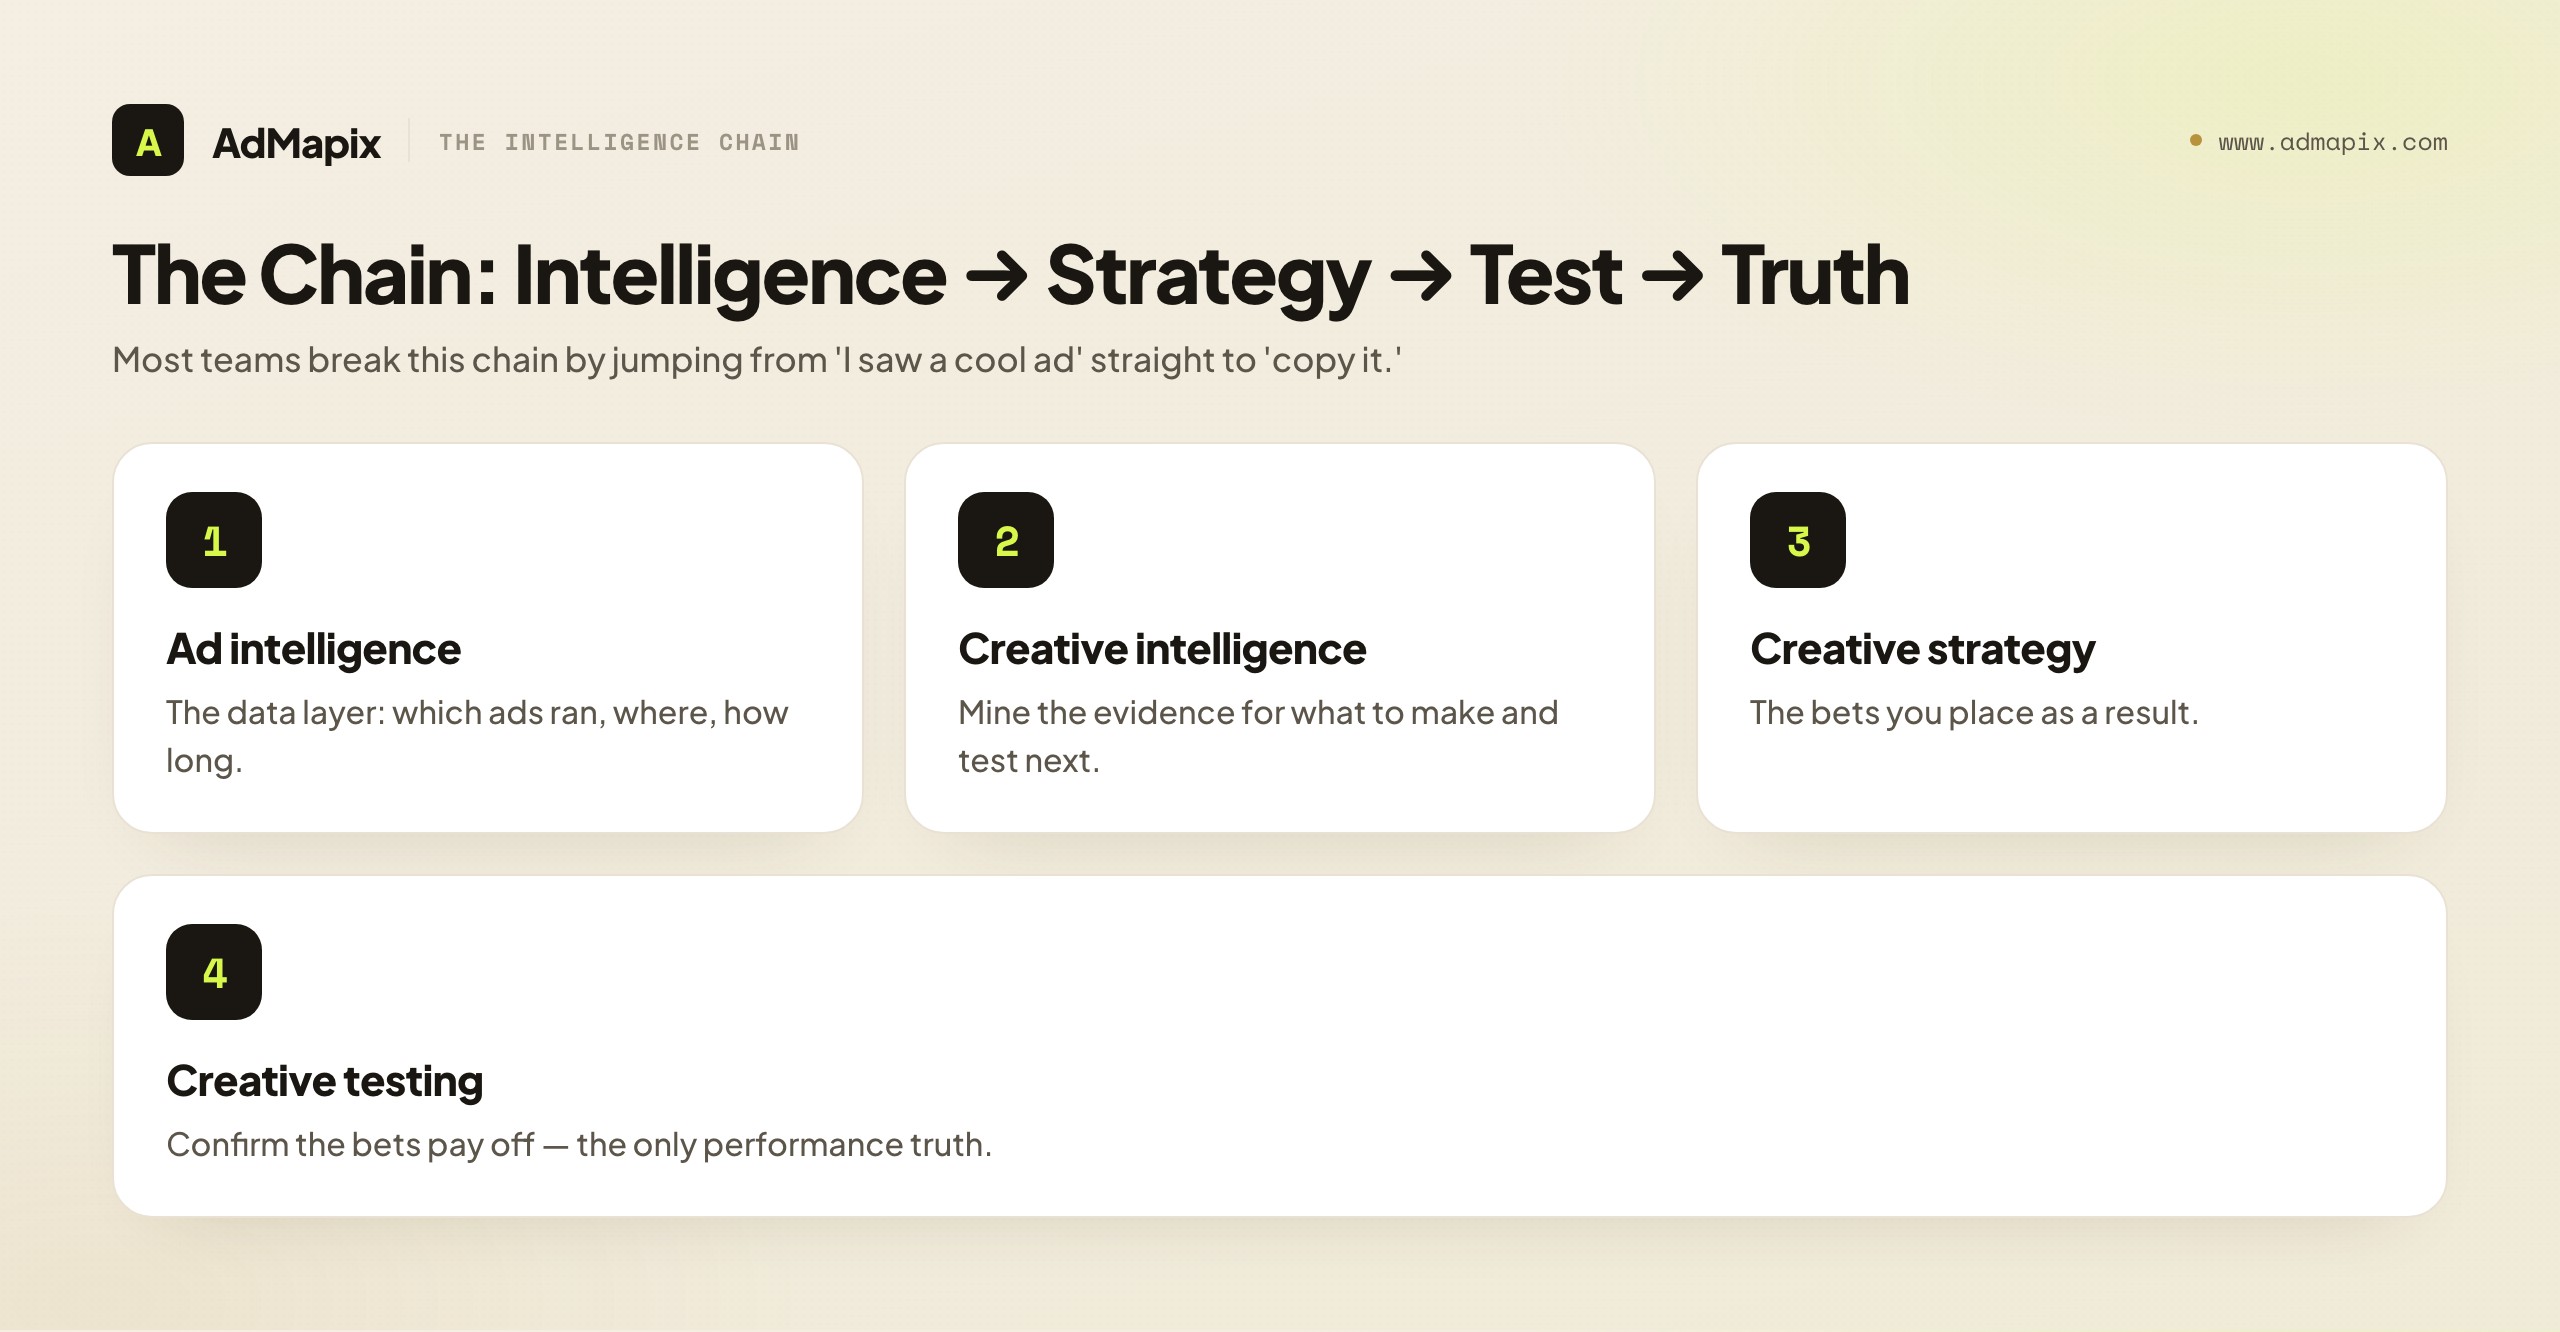
A quick orientation on terms, since they get used loosely. Ad intelligence (broad) is the data layer: the searchable evidence of which ads ran, where, and for how long. Ad creative intelligence (this playbook's subject) is the practice of mining that evidence specifically for creative decisions — what to make and test next. Creative strategy is the set of bets you place as a result. Creative testing is how you confirm those bets pay off. Intelligence informs strategy; strategy produces tests; tests produce the only performance truth you'll ever own. Keep that chain in mind — it's the spine of everything below, and most teams break it by skipping straight from "I saw a cool ad" to "let's copy it," with no hypothesis and no test in between.
TL;DR — The Ad Creative Intelligence Playbook in One Screen
- Ad creative intelligence = systematically reading the market's ad creative (hooks, formats, offers, proof) and converting it into your own faster, sharper creative testing. It's a loop, not a dashboard.
- The operating loop has five stages: gather → decode → hypothesize → test → systematize. Most teams do the first stage and skip the rest, which is why they drown in screenshots and ship nothing.
- Creative lifespans are compressing — the median effective lifespan of a creative has fallen to roughly three weeks in fast-moving categories — so intelligence has to run weekly, not quarterly.
- Public ad evidence proves an ad ran; it does not prove it worked. Treat longevity and recurrence as soft signals; the only proof of performance is your own analytics.
- Tools like AdMapix give you searchable cross-network creative evidence — saved examples, video breakdowns, recurring reports. They cannot show competitor spend, ROAS, impressions, or targeting, and you should plan your inferences around that limit.
- Maturity runs in four levels: ad-hoc → cataloged → looped → systematized. Know where you are; the next level is always the goal, not "buy a better tool."
- The deliverable of intelligence is a ranked test backlog, not a report. If the work doesn't end in a queue of hypotheses, it was admiration, not intelligence.
What Ad Creative Intelligence Actually Is
Ad creative intelligence is the structured practice of using public ad evidence to make better creative decisions. Let's unpack each part, because the precision matters. Public ad evidence means the creatives you can observe running in the market — through ad libraries, transparency centers, and cross-network creative databases. Structured practice means a repeatable process with defined stages and outputs, not an occasional browse. Better creative decisions means the output is always a decision about what you will make and test, never a conclusion about what a competitor "must be" doing.
That last clause is the whole game. The failure mode that defines bad ad creative intelligence is over-reading the evidence — looking at a competitor's long-running ad and concluding "this is their winner, copy it." You can't know that. You can see the ad ran; you cannot see whether it converted, what it cost, who it reached, or whether the advertiser even noticed it was losing money. Good creative intelligence is humble about the evidence and aggressive about the testing: it treats every market observation as a hypothesis for your account, where performance is actually measurable, rather than as a verdict about the competitor, where it never will be.
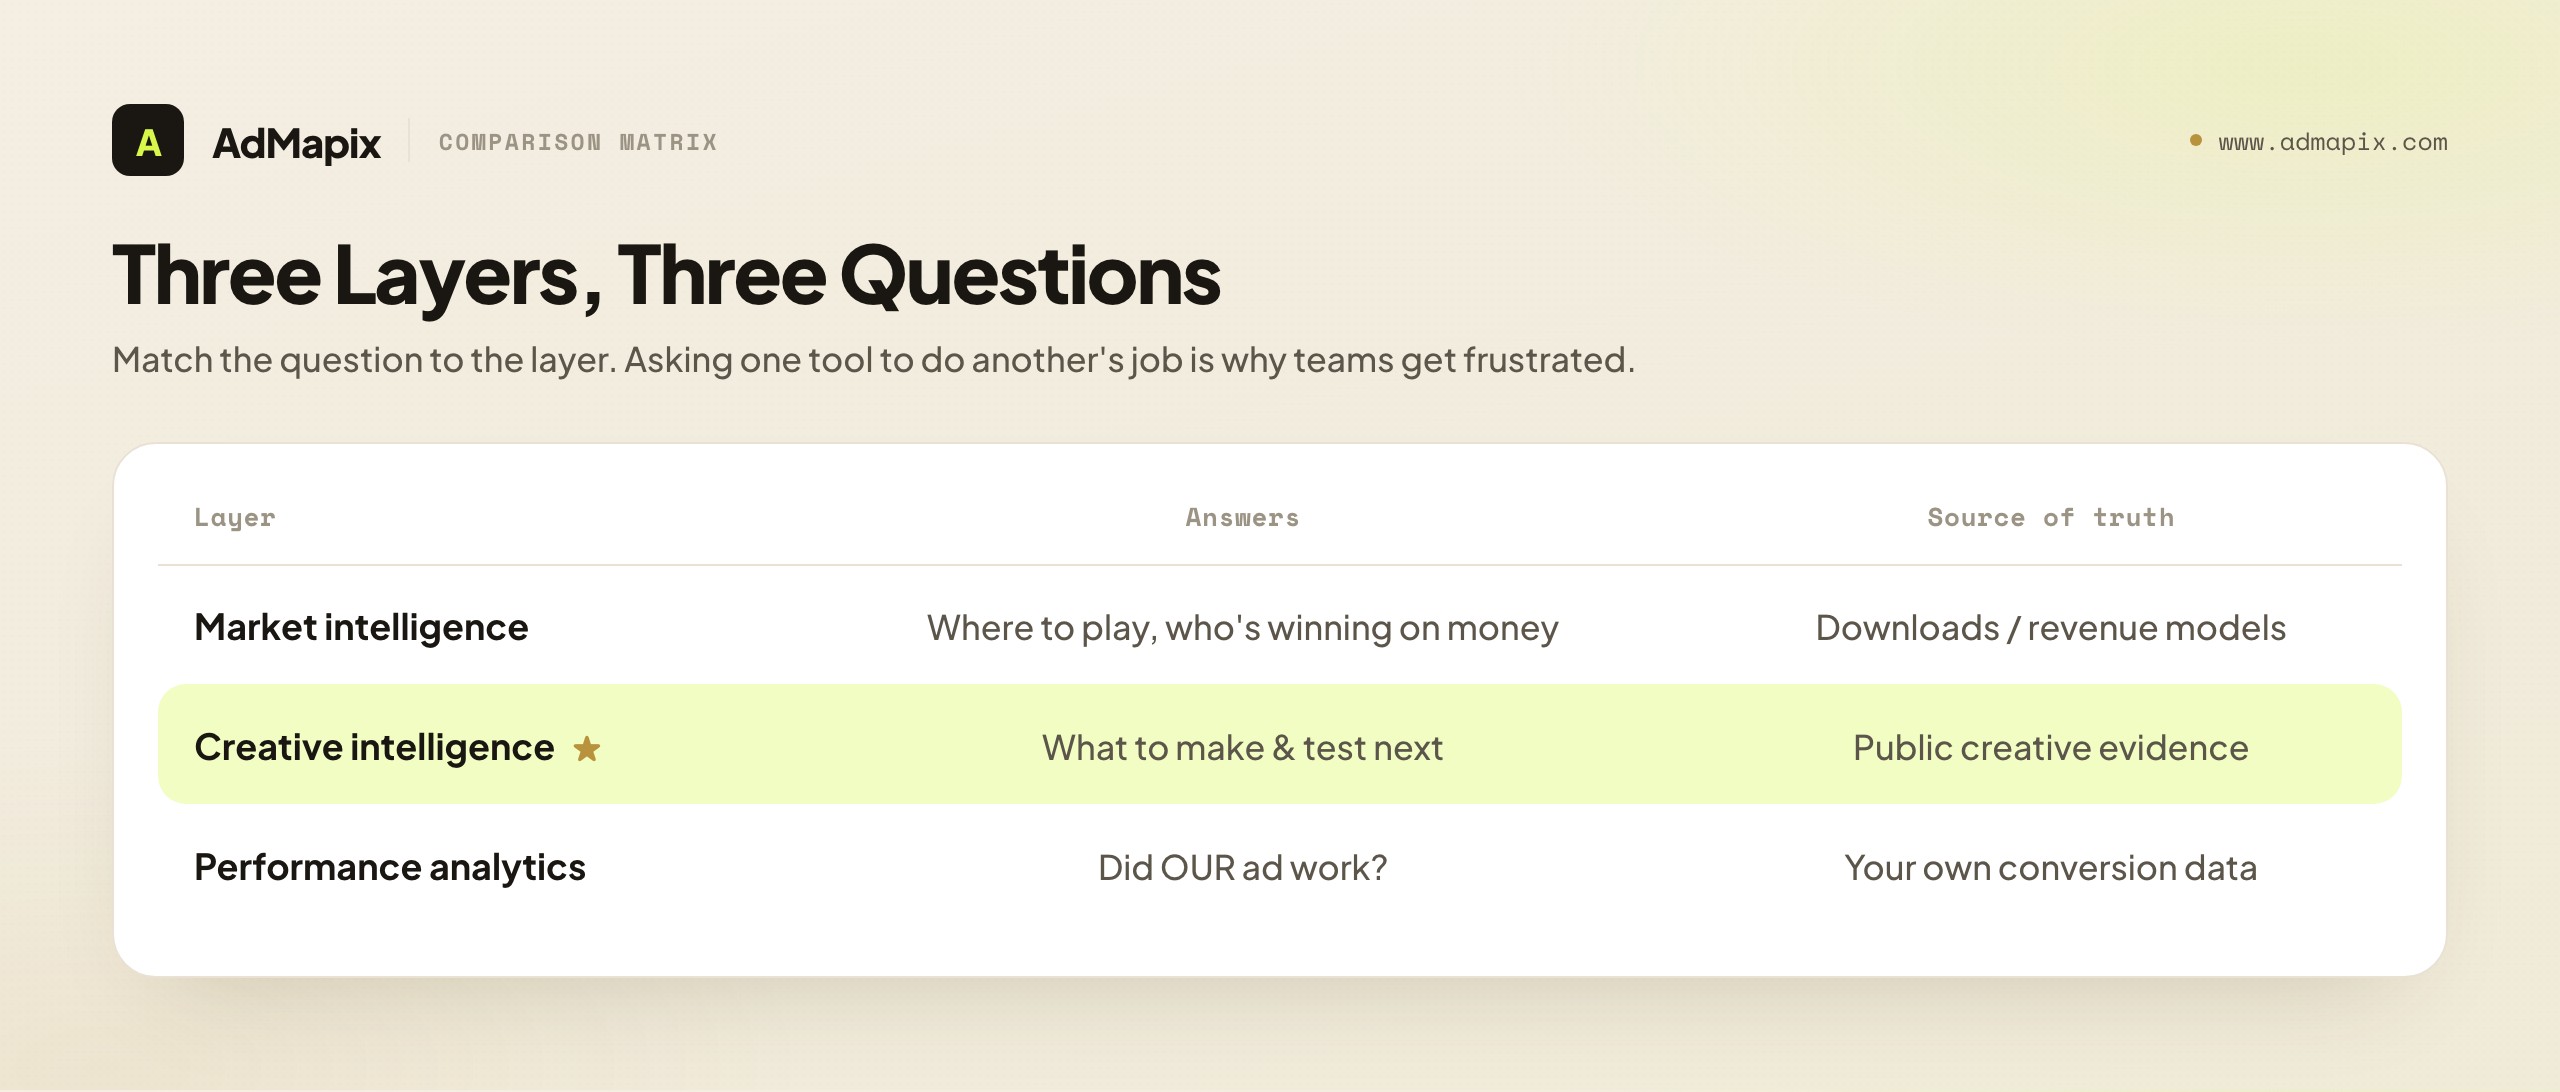
It helps to contrast creative intelligence with two neighbors it's often confused with. It is not the same as market intelligence (downloads, revenue, market sizing), which answers "where should we play and who's winning the category on money?" — a strategic question that no amount of creative teardown will answer. And it is not the same as performance analytics, which answers "did our ad work?" using your own conversion data. Creative intelligence sits in the middle: it answers "given what the market is making, what should we make and test next?" When teams ask one of those tools to do another's job — expecting a creative database to reveal competitor revenue, or expecting their analytics to tell them what hooks rivals are running — they get frustrated for predictable reasons. Match the question to the layer.
The honest one-line definition: ad creative intelligence is the bridge from what's visible in the market to what's testable in your account. Everything in this playbook is about building and running that bridge well.
It's worth dwelling on why this discipline exists as something separate from "just look at competitor ads," because the difference is the entire value proposition. Anyone can open an ad library and scroll. What separates intelligence from browsing is that intelligence is comparative, longitudinal, and decision-oriented. Comparative means you're not reacting to one ad; you're reading patterns across many advertisers, which is the only way to tell a category default from a genuine differentiator. Longitudinal means you're tracking the same advertisers over time, because a single screenshot is one frame of a movie — the real signal is in what changes (a competitor swapping all their hooks to a new archetype is a far louder signal than any single ad). Decision-oriented means every observation is pointed at a choice you'll make, so you stop collecting the moment you have enough to act. Strip away any one of those three properties and you're left with browsing dressed up as research. A team that only looks at one ad at a time has no comparison. A team that only looks once has no time series. A team that looks without a decision in mind has no reason to ever stop looking. The loop in the next section is engineered to force all three properties at once.
There's also a cultural dimension worth naming. Creative intelligence done well requires a particular intellectual humility that's rare in marketing teams: the willingness to say "I don't actually know if that worked" about a competitor's ad you admire, and to treat your own confident reads as hypotheses rather than facts. Teams that lack this humility tend to produce narratives — "their whole strategy is built around X" — from thin evidence, and then anchor real decisions to those narratives. The discipline of creative intelligence is, in large part, the discipline of refusing to write the narrative until your own test data earns it.
The Creative Intelligence Operating Loop
Intelligence isn't a thing you have; it's a loop you run. Here are the five stages, the output of each, and the failure that lurks when you skip it.
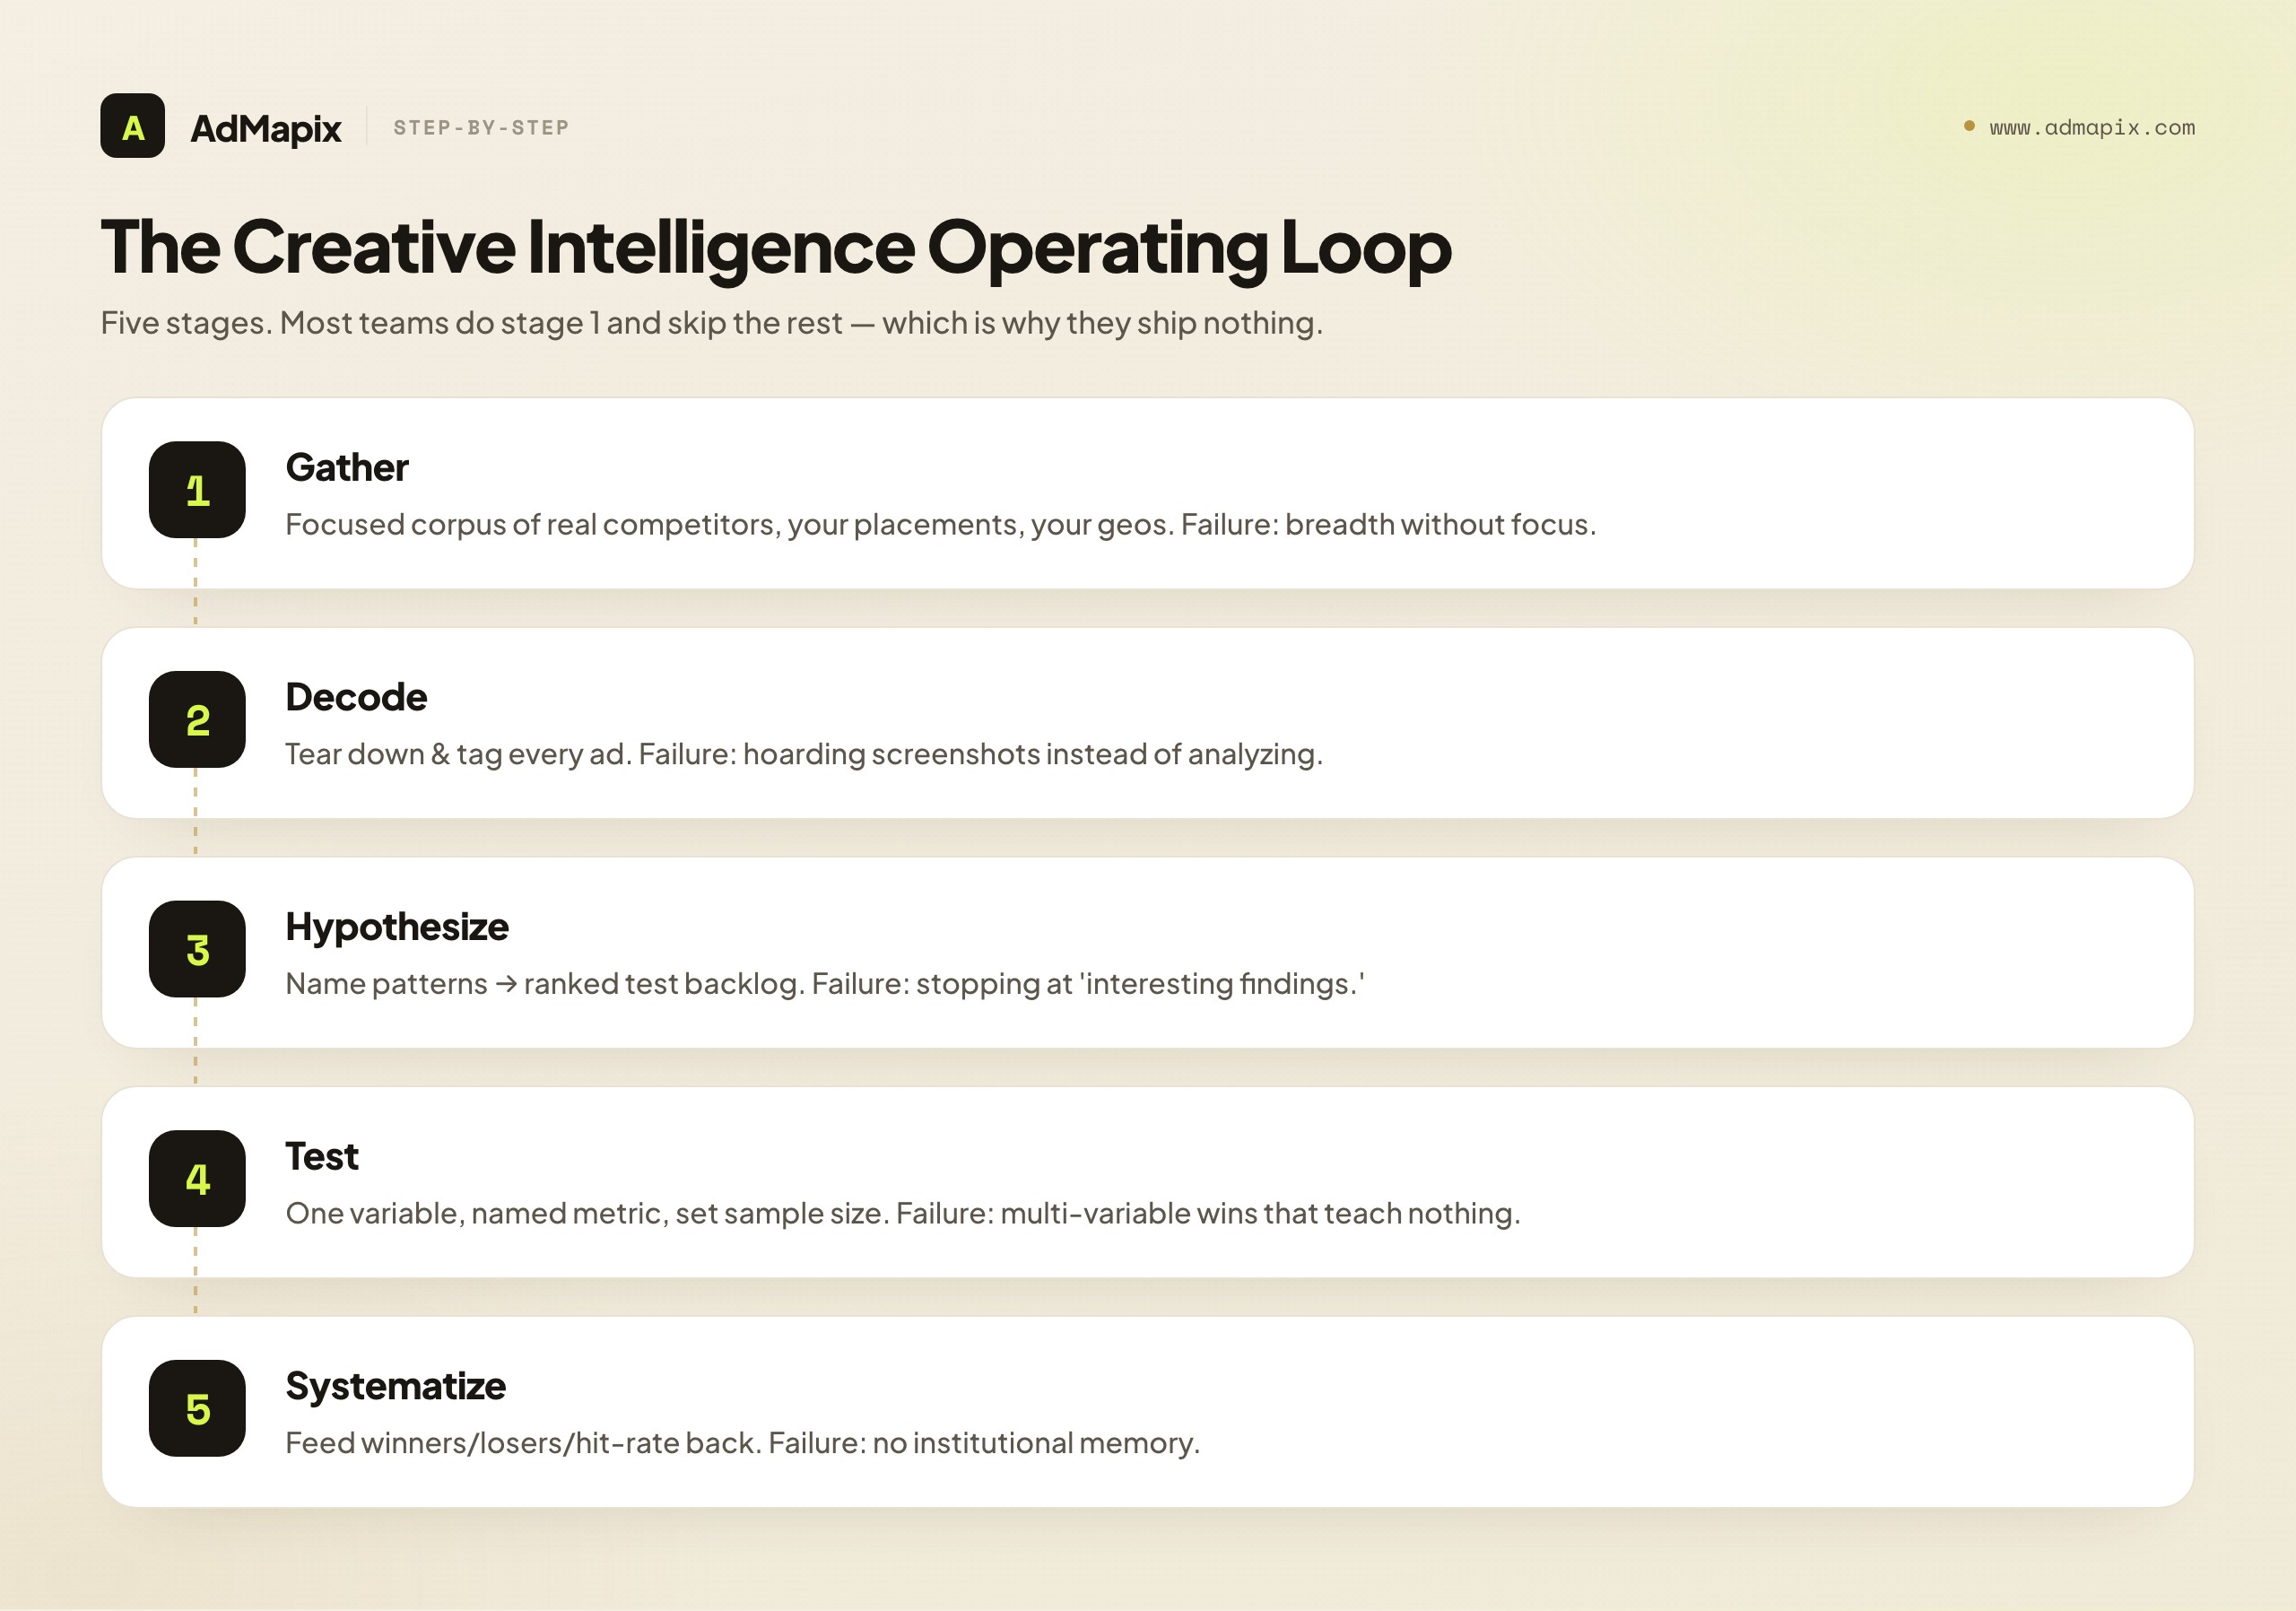
Stage 1 — Gather. Collect the relevant creative evidence: ads from your real competitors and category leaders, across the networks where you actually buy, filtered to the formats and geos that matter to you. The output is a focused corpus, not the whole internet. The failure here is breadth without focus — pulling thousands of unrelated ads you'll never tear down. Tighten the filter to your competitors, your placements, your markets.
Stage 2 — Decode. Tear down what you gathered: hooks, audience signals, proof, offers, formats, and (where visible) landing alignment. Tag every ad so patterns become searchable later. The output is a structured corpus — ads annotated with the choices their makers made. The failure is admiring instead of analyzing: a folder of screenshots with no tags is not decoded, it's hoarded. (Our ad creative analysis scorecard is the exact teardown method this stage uses.)
Stage 3 — Hypothesize. Look across the decoded corpus and name the patterns — which hooks recur among the leaders, which offers cluster, where the category's defaults are, and which gaps nobody's exploiting. Convert the sharpest patterns into testable hypotheses for your account. The output is a ranked test backlog. The failure is stopping at "interesting findings" — insight that never becomes a hypothesis is trivia.
Stage 4 — Test. Ship the top hypotheses as controlled experiments, one variable at a time, against named metrics with pre-set sample sizes. The output is a result your analytics can verify — the only performance truth in the whole loop. The failure is multi-variable tests that win and teach you nothing about why. (See the creative testing framework for how to run these cleanly.)
Stage 5 — Systematize. Feed the results back: winners go into your creative-pattern library, losers get logged so you don't re-test them, and your hit-rate gets graded so you can tell whether your decoding or your testing is the weak link. The output is a smarter loop next week. The failure is treating every cycle as new — never building institutional memory, so the team re-discovers the same patterns forever.
The reason most "ad intelligence" investments disappoint is that teams buy a tool that nails Stage 1 (gathering) and assume the other four stages happen automatically. They don't. The tool gives you evidence; the loop turns evidence into advantage. A modest tool run through a disciplined loop beats a premium tool run as a screenshot machine, every time.
A useful mental model: think of the five stages as a refinery, where raw material loses value at every stage it gets stuck at. Crude ad evidence (Stage 1) is abundant and nearly worthless on its own — it's the equivalent of unrefined ore. Decoding (Stage 2) concentrates it into structured, searchable patterns. Hypothesizing (Stage 3) refines those patterns into a few high-grade decisions. Testing (Stage 4) is where the value actually crystallizes into verified truth. Systematizing (Stage 5) captures that value so it doesn't evaporate. The trap is that the early stages are cheap and feel productive — gathering and decoding look like work and are easy to staff — while the later stages are where the value actually appears and are the hardest to sustain. So teams accumulate huge piles of half-refined ore (a screenshot library, some tags) and never carry enough through to the stage where it becomes money. When you audit your own program, the diagnostic question is always: what fraction of what we gather makes it all the way to a shipped, verified test? For most teams the honest answer is a single-digit percentage, and that ratio — not the size of your corpus — is the real measure of how good your intelligence is.
The 2026 Ad Intelligence Landscape: What Changed
Two forces make creative intelligence more urgent in 2026 than ever: creative saturation and shorter competitive cycles. Ad volume has exploded — partly because AI has made variant production nearly free — and the consequence is faster creative decay. The median effective lifespan of a creative (the time to a meaningful drop in click-through rate) has compressed into the low-twenties of days in fast-moving categories, down sharply year over year. When your creative is half as effective in three weeks, the cadence of your intelligence loop becomes a competitive variable in its own right. A quarterly competitive audit is now roughly as useful as a weather forecast from last season.
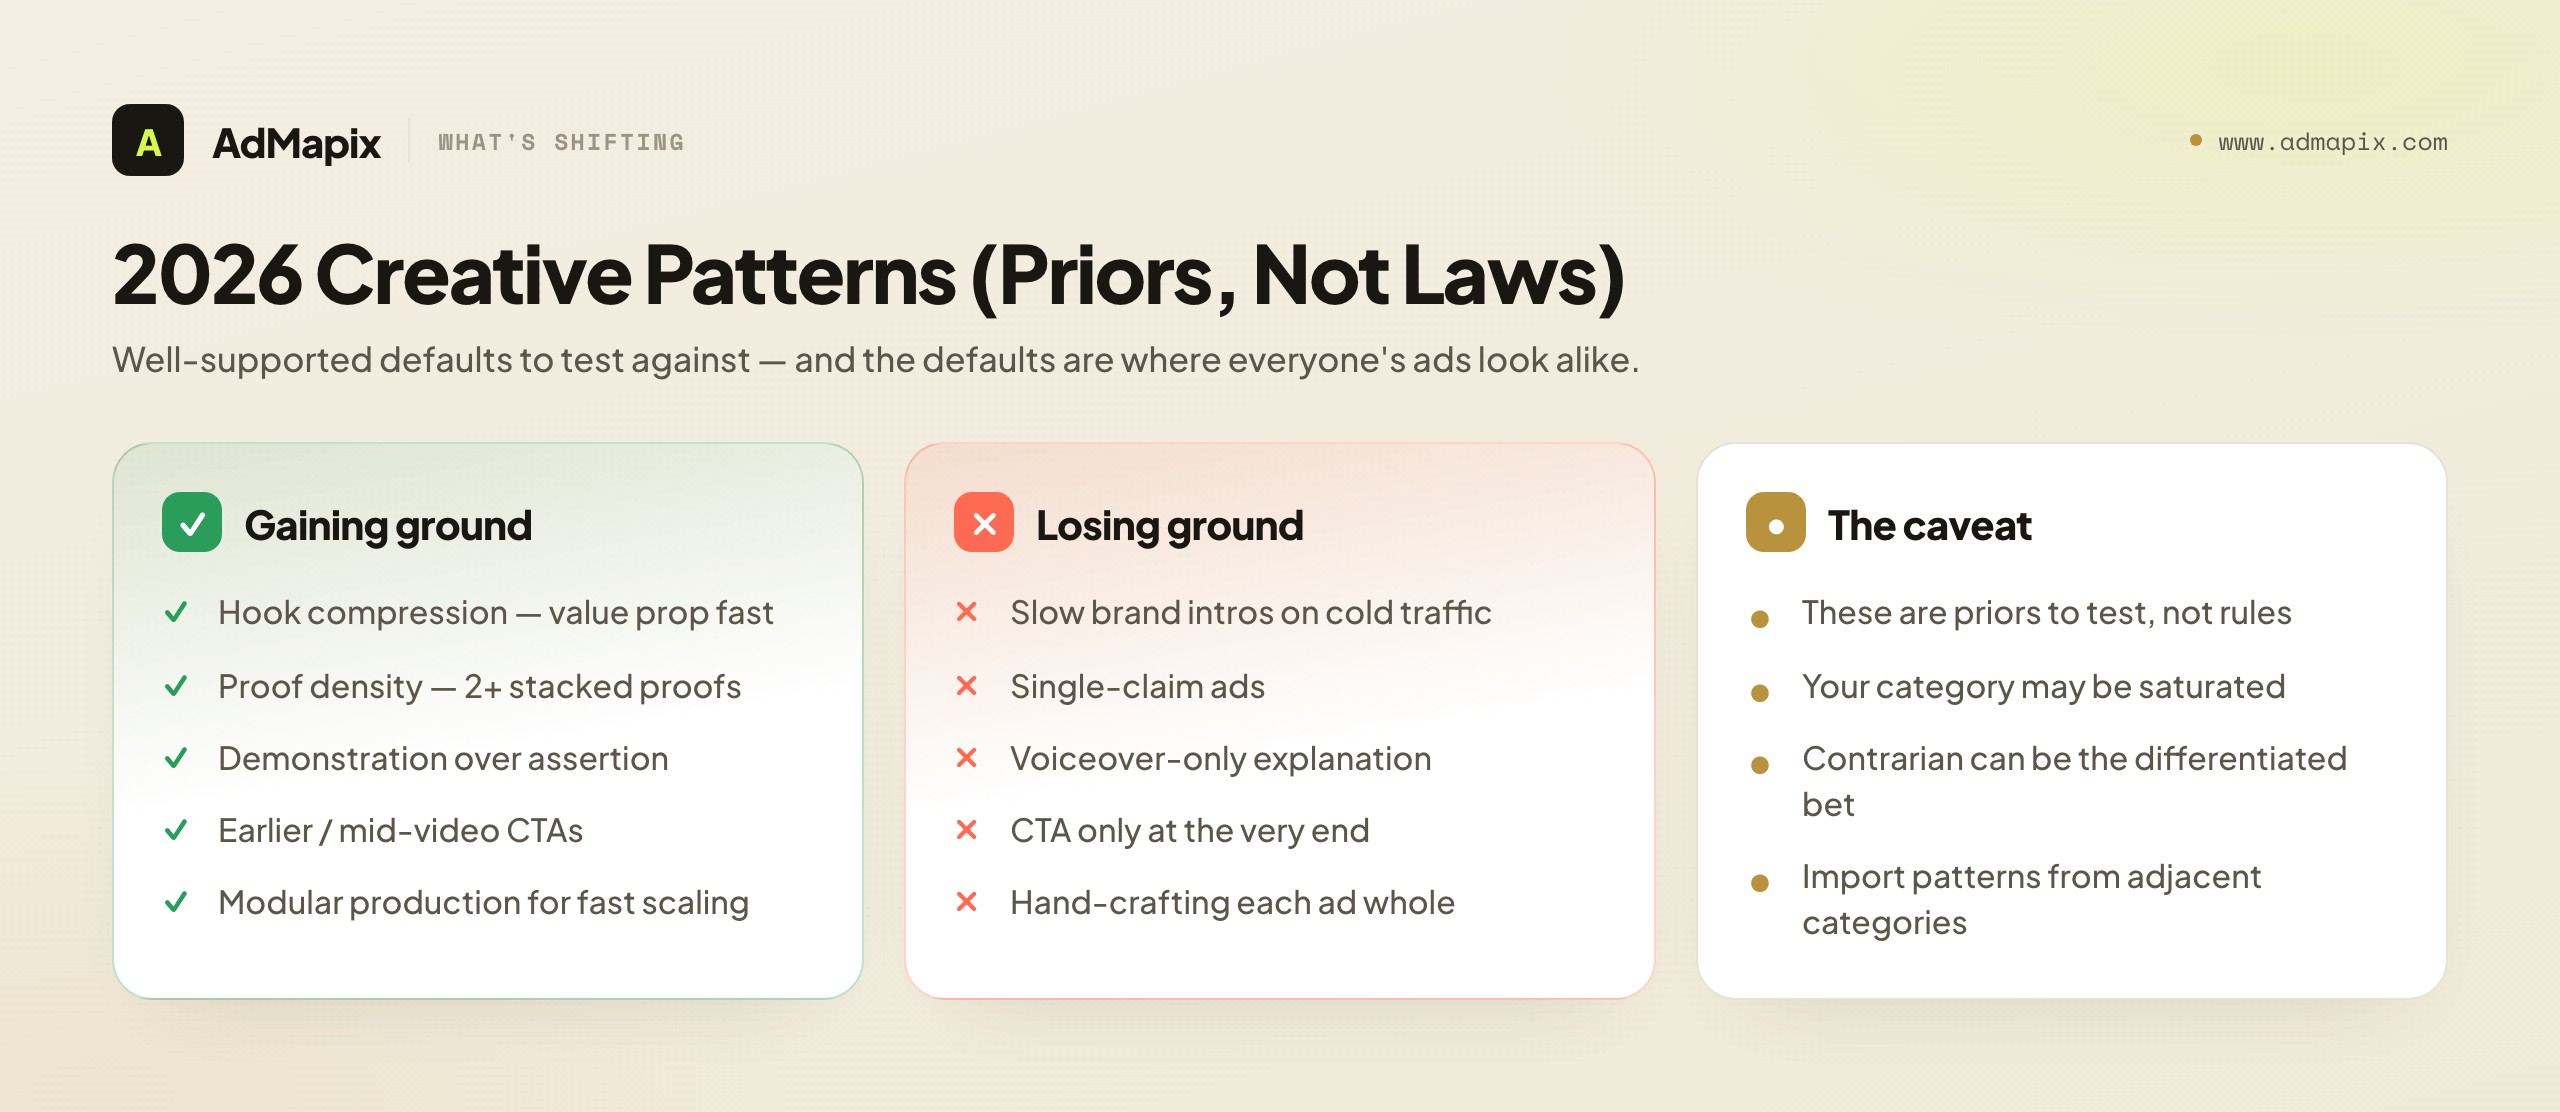
At the same time, the shape of winning creative is shifting in ways that show up consistently across categories when you decode enough ads. A few patterns are worth naming, not as laws but as well-supported priors to test against:
- Hook compression. Winners surface the core value proposition fast — often within the first couple of seconds of short-form video — because autoplay-silent feeds punish slow brand intros. The "slow burn" still exists, but it's increasingly a luxury for warm audiences, not a cold-prospecting default.
- Proof density. Single-claim ads are losing ground to ads that stack two or more proof points (ratings plus a specific result plus a third-party mention). Skeptical buyers discount any single claim; a stack is harder to wave away.
- Demonstration over assertion. Showing the product visibly doing its job consistently out-converts voiceover-only explanation, especially for utility and software products where "see it work" closes the credibility gap an adjective can't.
- Earlier CTAs. The ask is moving earlier in the creative — a soft CTA mid-video, sometimes in the first six seconds of a short ad — because a meaningful share of viewers never reach the end.
- Narrative modularity. Teams that build creative from reusable modules (a library of hooks, a library of proof beats, a library of CTAs) scale across geos and placements far faster than teams that hand-craft each ad whole. Modularity is the production answer to compression.
A word of caution about every bullet above: these are priors to test, not rules to obey. The category leaders in your vertical may have already saturated the "fast clarity" pattern to the point where a contrarian slow-burn is the differentiated bet. The whole value of creative intelligence is that it tells you what your specific market's defaults are — and the defaults are precisely where everyone's ads start to look the same. The compounding wins often come from importing a pattern that's standard in an adjacent category but rare in yours, which is exactly the kind of move only systematic decoding can surface.
Regional and Category Pressure: Where Intelligence Pays Off Most
Creative intelligence is most valuable where competitive pressure is highest and changing fastest, because that's where the gap between "running the category default" and "running a tested winner" is widest. Growth markets in Southeast Asia, MENA, and Latin America are seeing strong ad-spend growth and rapidly improving creative craft, which means the window in which a hook stays differentiated is shorter there than in mature US/EU markets. If you operate in those regions, your intelligence loop needs to run faster and your tooling needs genuine coverage there — a database deep in US/EU but thin in your actual market is an expensive blind spot.
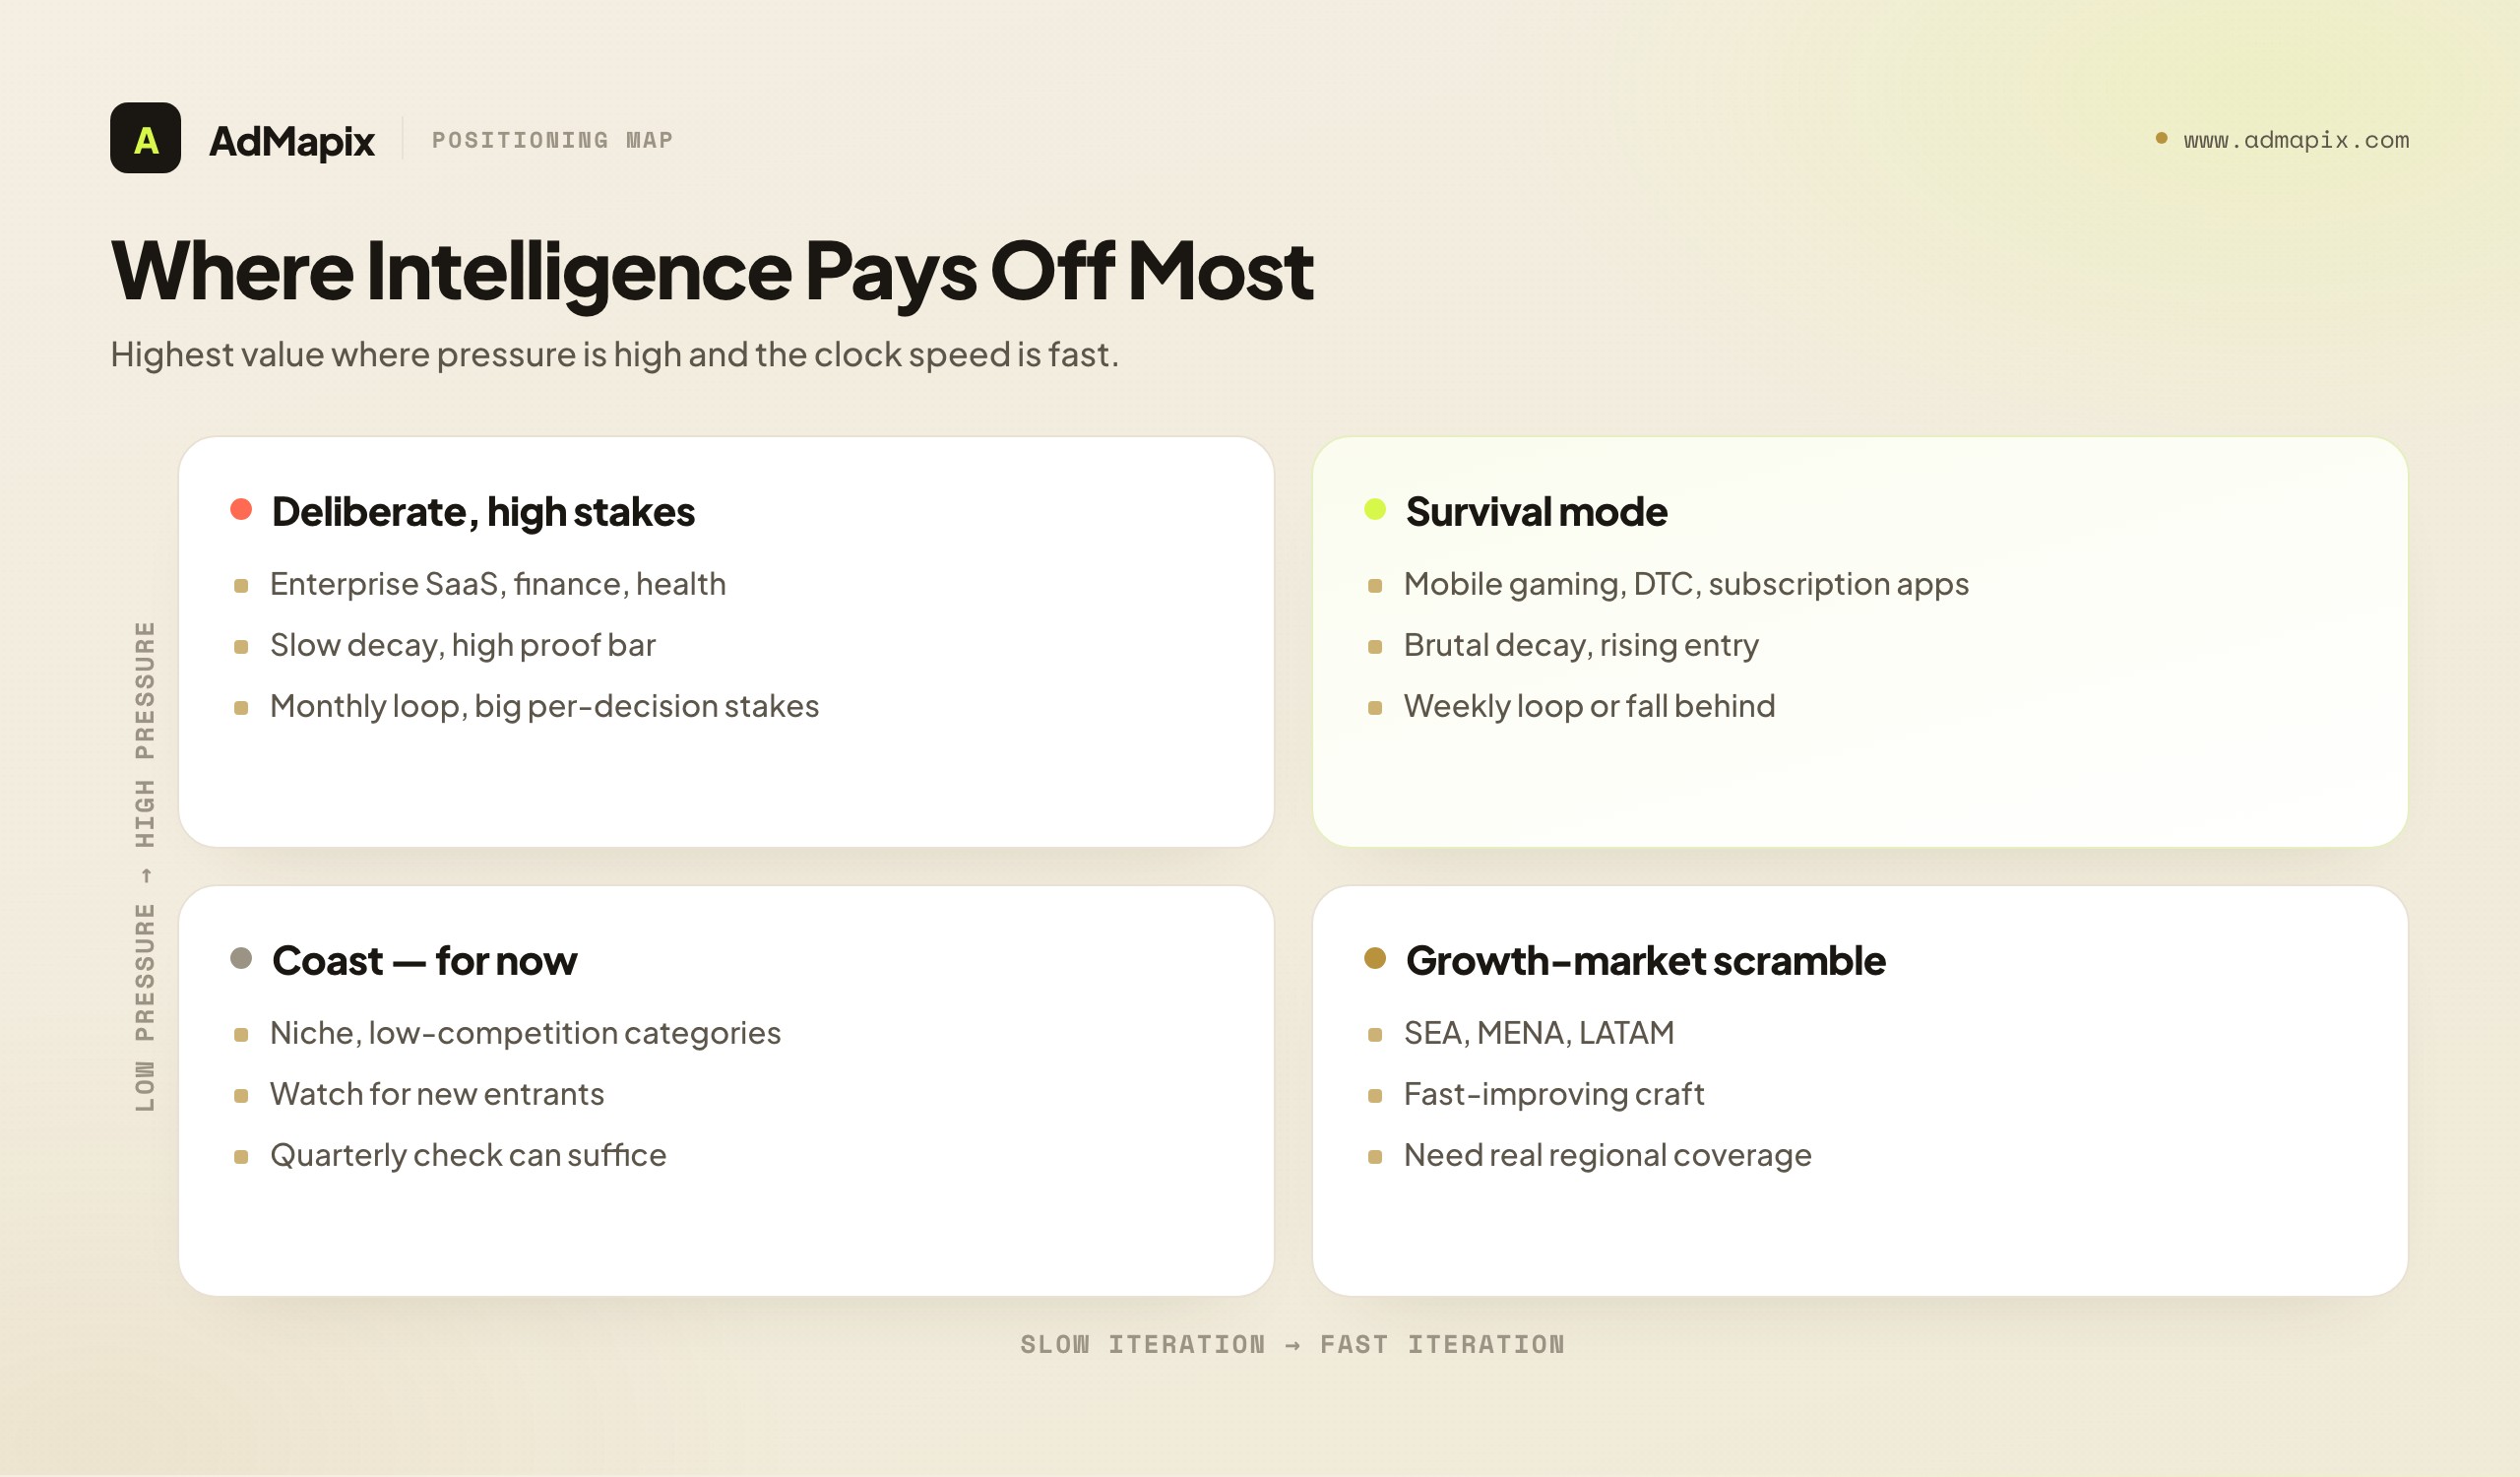
Category matters as much as geography. In categories with cheap, fast iteration — mobile gaming, DTC commodities, subscription apps — creative decay is brutal and the intelligence loop is a survival tool. In high-consideration categories — enterprise software, financial services, healthcare — creative changes more slowly, proof requirements are higher, and the loop runs at a more deliberate pace but with bigger stakes per decision. Calibrate your cadence to your category's clock speed. Running a weekly teardown sprint for a product with a six-month sales cycle is overkill; running a quarterly audit for a DTC brand in a saturated niche is malpractice.
The strategic upshot: don't copy a generic "best practice" cadence. Map your category's iteration speed and your markets' competitive intensity, and set the loop's frequency to match. A team in a slow category with low pressure might run a thorough monthly loop and win. A team in a fast category with rising pressure needs a weekly loop or it falls behind between audits. The cadence is the strategy when lifespans are this short.
A related regional subtlety that trips up global teams: creative patterns do not transfer cleanly across cultures, and the worst version of "intelligence" is lifting a winning US hook into a new market on the assumption that what worked there will work here. Sometimes it does; often the cultural framing, the proof conventions, even the pacing expectations differ enough that a literal port underperforms a locally-decoded variant. This is precisely where having genuine creative coverage in your target market matters — you need to decode what's actually winning locally, not just transplant the home market's playbook. The right move when entering a new region is to run a fresh gather-and-decode pass on local advertisers before you assume any pattern is universal. Treat each market as its own corpus with its own defaults, and use cross-market comparison only to spot the gaps worth a deliberate, tested bet — never as a license to copy-paste a hook across a cultural boundary and call it strategy.
The Creative Intelligence Maturity Model
Teams don't level up by buying better tools; they level up by maturing the loop. Here are the four levels, so you can locate yourself honestly and aim at the next one rather than at a shinier dashboard.
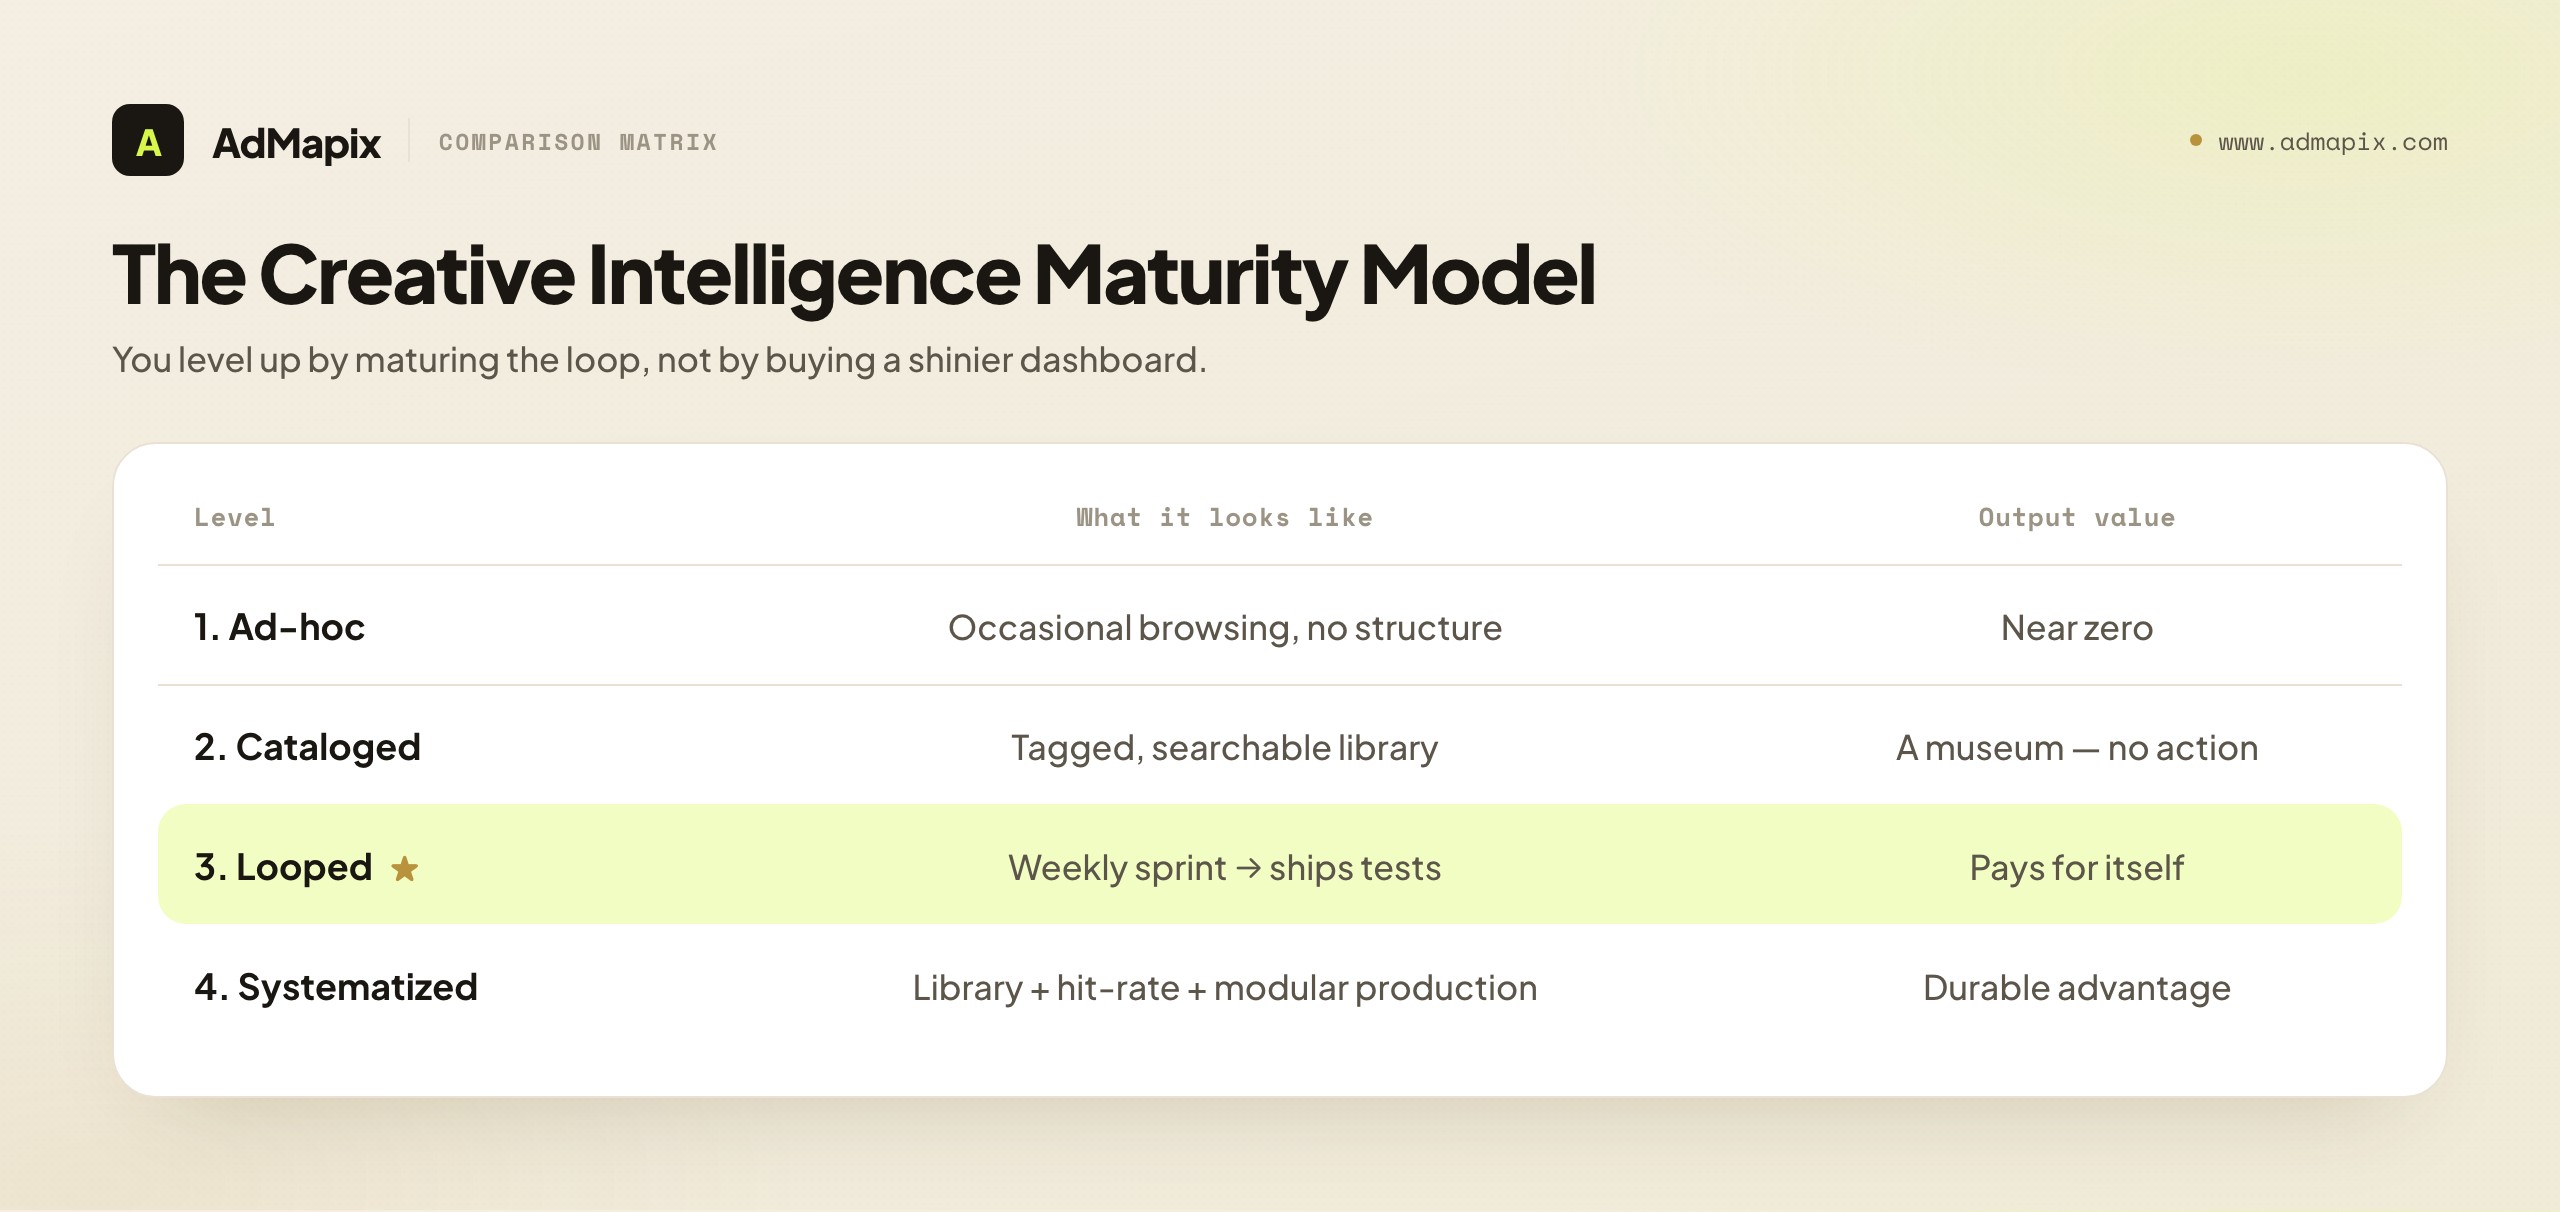
Level 1 — Ad-hoc. Someone occasionally browses a competitor's ads, screenshots a few, and shares them in Slack. No structure, no tags, no test backlog. Value is near zero because nothing is comparable or reusable. Most teams that "do competitive research" live here and don't realize it.
Level 2 — Cataloged. Evidence is collected into a structured library and tagged (hook archetype, format, offer type, vertical) so it's searchable. You can now answer "show me all problem-first UGC hooks in our category." This is real progress, but catalog without action is a museum — the failure mode is a beautiful, growing library that produces no tests.
Level 3 — Looped. The catalog feeds a recurring rhythm: a weekly teardown sprint that produces a ranked hypothesis backlog, hypotheses ship as tests, and results feed back. This is where intelligence starts to pay for itself, because every cycle produces shipped experiments and verified results, not just findings.
Level 4 — Systematized. The loop is institutionalized: a living pattern library that captures what's worked, a hit-rate dashboard that grades the team's decoding and testing, a modular production system that turns hypotheses into assets fast, and onboarding so the capability survives any individual leaving. At this level, creative intelligence is a durable competitive advantage rather than a person's side project.
The arrow always points to the next level, and the next level is almost never "spend more on tools." A Level 1 team with a premium ad intelligence subscription is still Level 1 — they've bought a fire hose and no plumbing. The cheapest, highest-leverage move at any level is to build the process the next level requires. Tools enable maturity; they don't confer it.
A Weekly Creative Intelligence SOP
Here is a concrete, time-boxed weekly routine that runs the full loop for a small performance team. Adjust the volumes to your category's clock speed, but keep the shape.
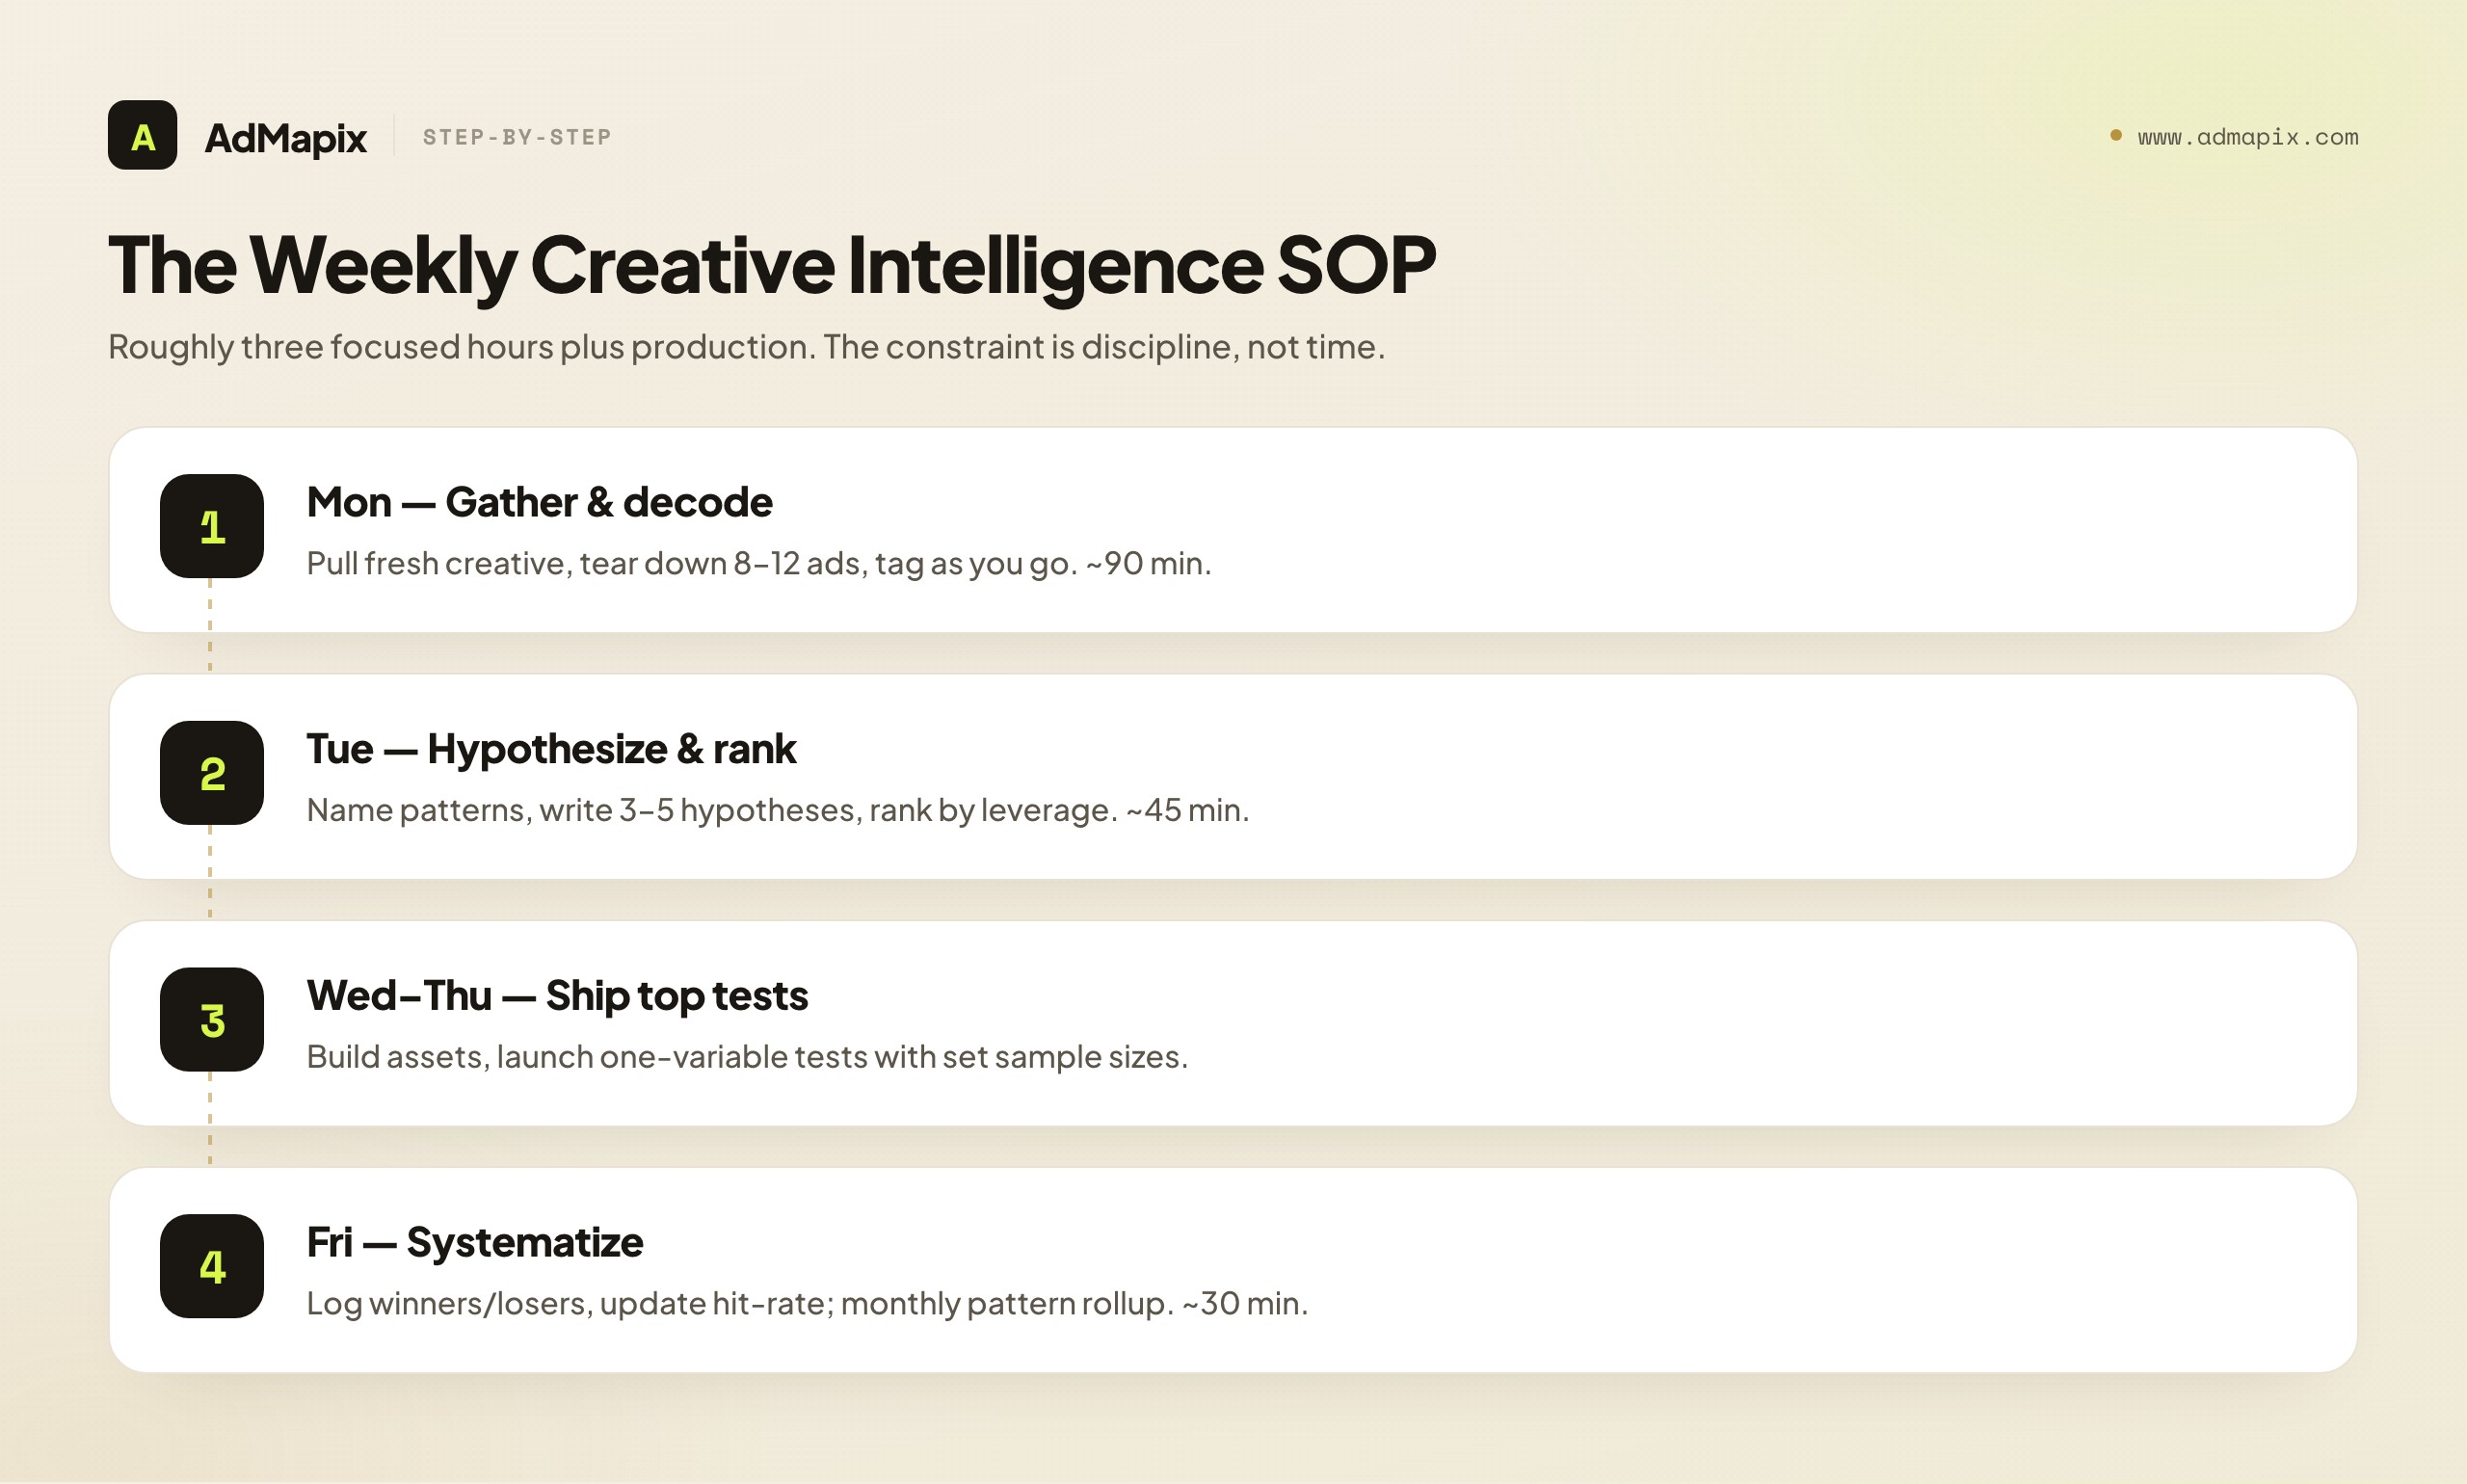
Monday — Gather and decode (90 minutes). Pull the week's fresh creative from your real competitors and category leaders across your buying networks. Tear down 8–12 ads using the six-dimension scorecard, tagging each as you go. Don't aim for depth on one ad; aim for structured coverage across the batch, because the patterns live across the set, not in any single ad.
Tuesday — Hypothesize and rank (45 minutes). Read across Monday's batch and name the patterns: recurring hooks, clustering offers, format conventions, unexploited gaps. Convert the sharpest three to five into testable hypotheses and rank them by leverage — biggest expected lift for the cheapest build goes first. This ranked list is the week's deliverable.
Wednesday–Thursday — Ship the top hypotheses (production-dependent). Build the assets for the top one or two hypotheses and launch them as controlled tests: one variable each, named metric, pre-set sample size, clear stopping rule. Resist the temptation to bundle changes; a clean test is worth more than a fast one.
Friday — Systematize (30 minutes). Log the week's results as they come in: winners into the pattern library, losers into a "don't re-test" list, and update the running hit-rate. Once a month, spend an extra hour on the rollup — name the month's category patterns and grade whether your decoding or your testing is the bottleneck.
Notice the total weekly time commitment is small — roughly three focused hours plus production. The constraint on creative intelligence is almost never time; it's discipline. The teams that win don't spend more hours; they spend the hours in the right order, end every cycle with a ranked backlog, and refuse to let the loop degrade into browsing. Three disciplined hours a week, sustained for a year, compounds into a creative advantage no one-off audit can touch.
Modular Creative: The Production Answer to Compression
There's a structural problem the SOP exposes that's worth its own section: if creative half-lives are measured in weeks and your loop generates three to five new hypotheses every Monday, your production pipeline has to ship that volume or the backlog rots and the whole exercise becomes documentation of things you didn't build. The teams that keep up almost universally adopt modular creative — the practice of building ads from interchangeable, reusable parts rather than crafting each one whole. It's the manufacturing answer to a market that consumes creative faster than artisans can produce it.
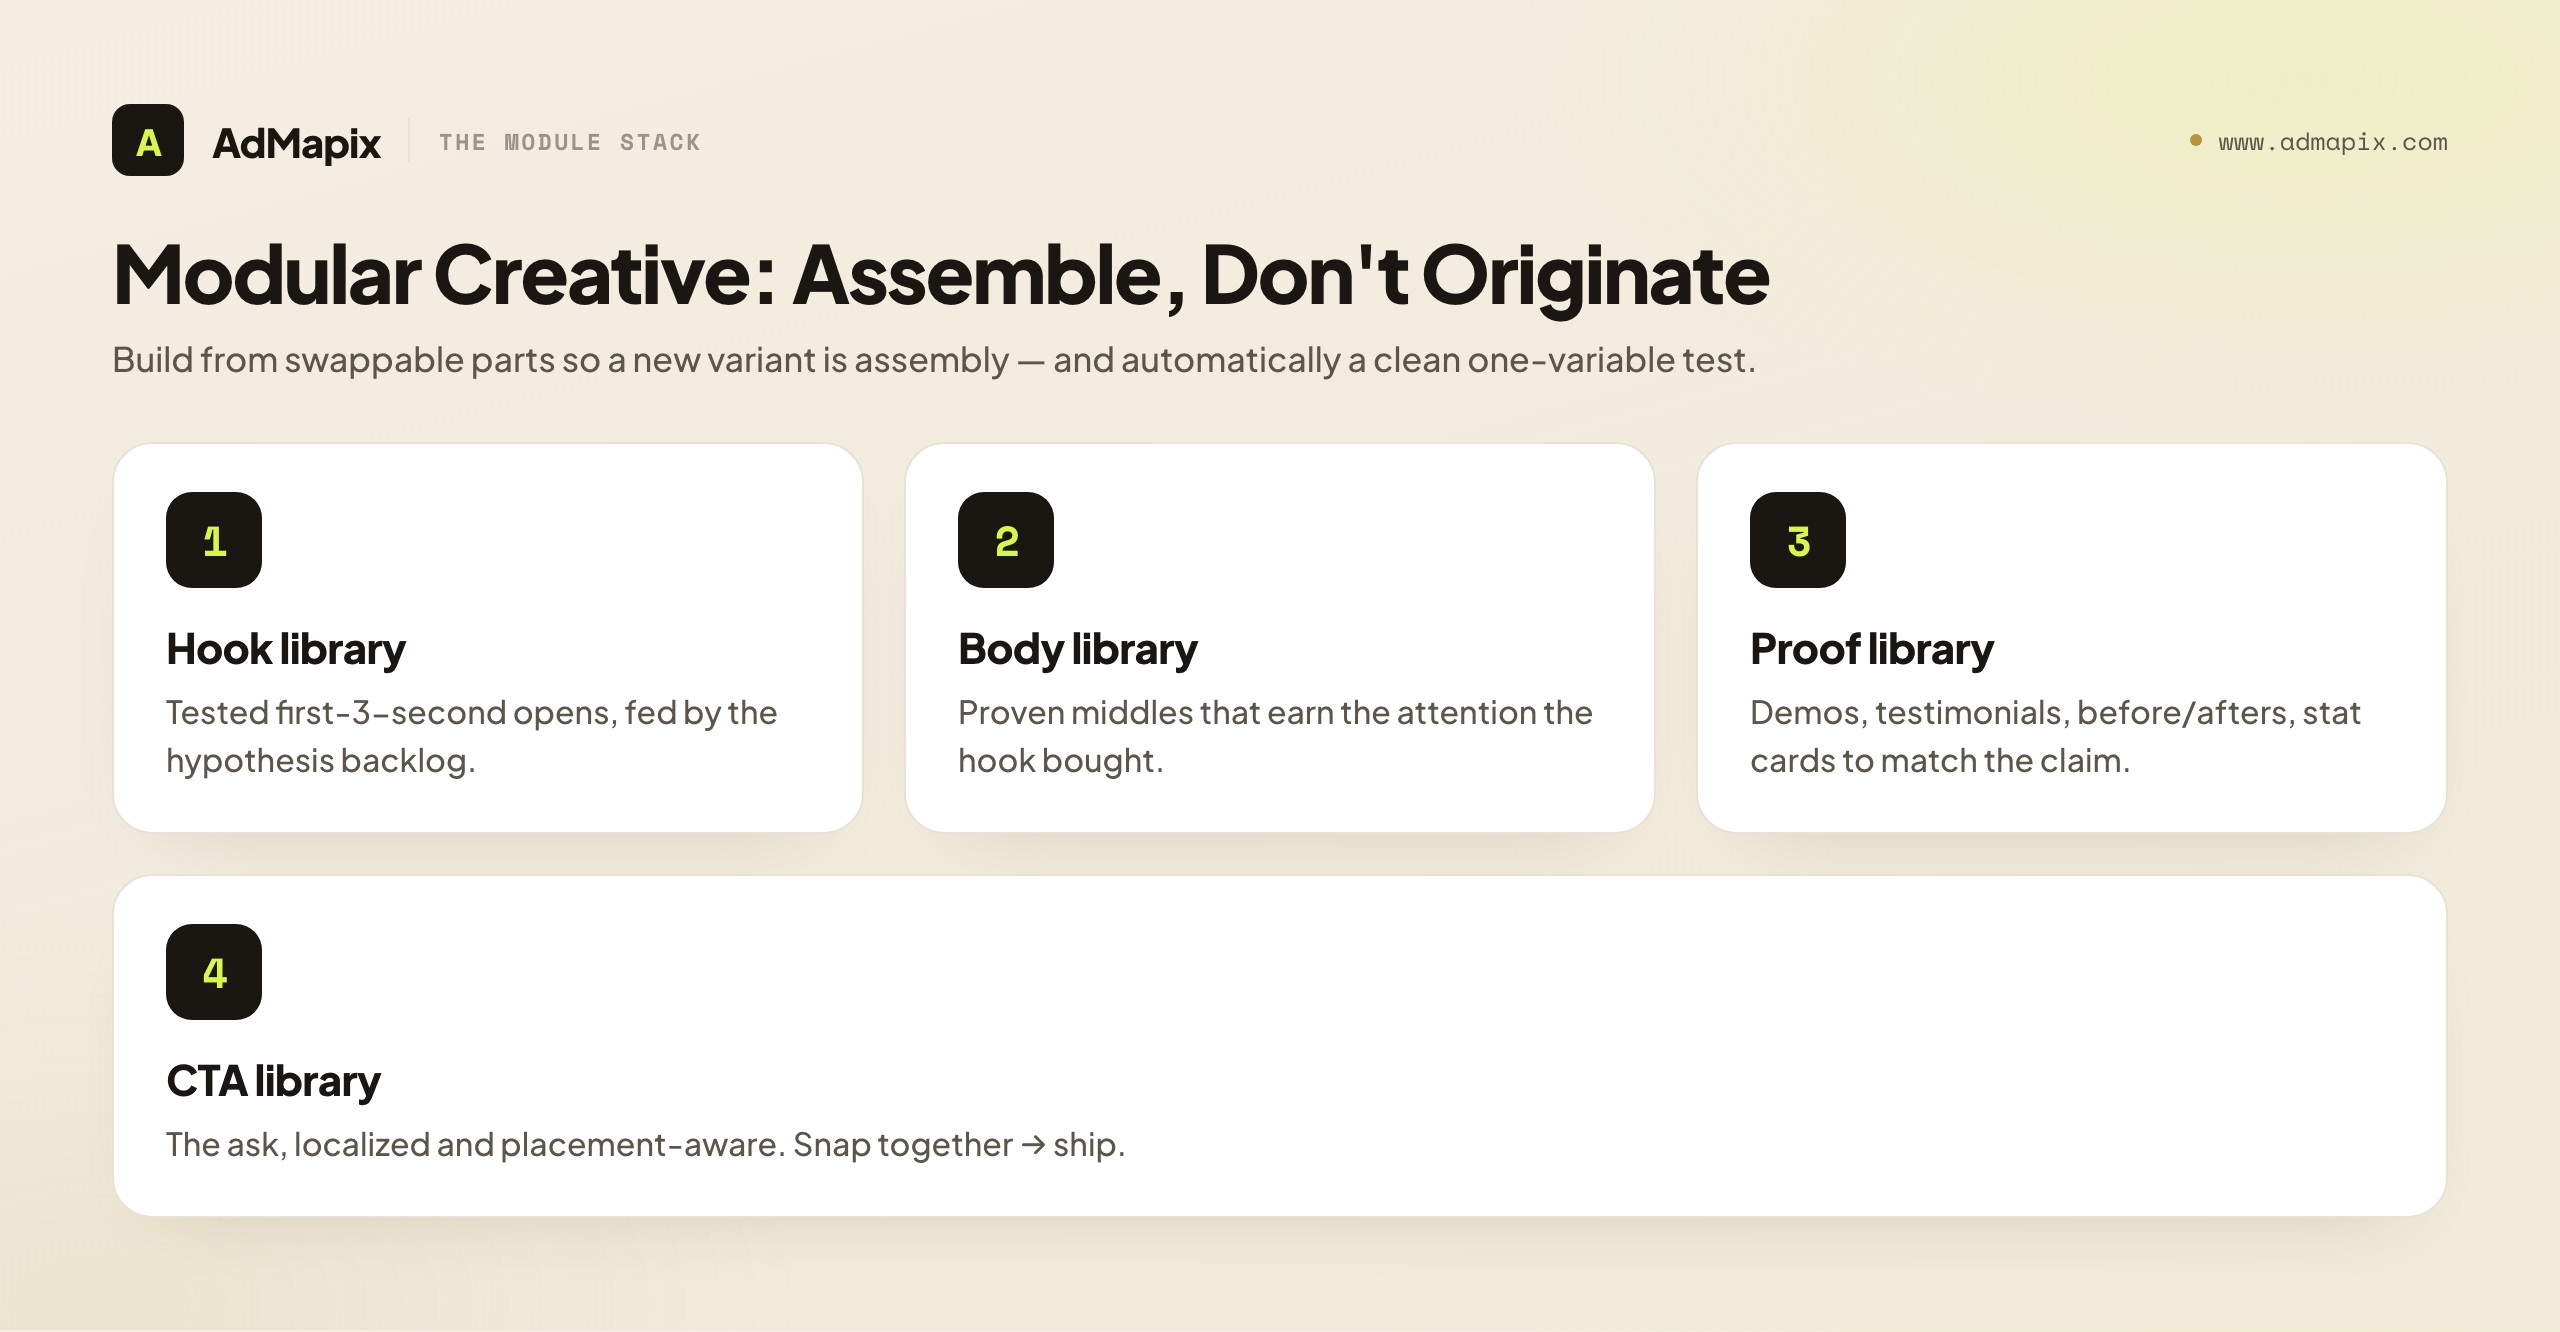
The core idea is to decompose your creative into a small number of independent modules — a library of hooks (the first three seconds), a library of proof beats (demos, testimonials, before/afters, stat cards), a library of bodies (the middle that earns the attention), and a library of CTAs (the ask). Once each module exists as a tested, swappable component, producing a new variant becomes assembly rather than origination: take a proven body, snap on a new hook from your hypothesis backlog, attach a proof beat suited to the claim, and you've shipped a clean, single-variable test in a fraction of the time a from-scratch ad would take. This is also why modular creative and clean testing reinforce each other — when the only thing that changed between two variants is the hook module, your test is automatically a clean one-variable experiment, and your results are automatically interpretable.
Modular creative is also how intelligence scales across geos and placements without exploding your production cost. The body and proof might stay constant while the hook is localized for a new market and the cut is re-framed for a new placement. A team running the same core concept re-cut natively for three placements and two regions — built from shared modules — is operating at a level a hand-crafting team simply cannot match on speed. When your decoding stage reveals that a competitor is doing exactly this (the same concept, recognizably re-modularized across surfaces), that's a strong signal you're up against a mature creative operation, and the strategic response is to build your own module libraries, not to try to out-artisan them ad by ad.
The honest caveat: modularity has a ceiling. Over-modularized creative can start to feel formulaic — the same five hooks bolted onto the same three bodies until the audience pattern-matches your ads as "an ad" and tunes out. The fix is to keep feeding the hook and body libraries with genuinely new concepts surfaced by your intelligence loop, so modularity accelerates fresh ideas rather than recycling stale ones. Modularity is the engine; intelligence is the fuel. An engine with no fuel just burns the same tank dry faster.
A Worked Example: From Market Scan to Shipped Winner
Let's run the whole loop on a realistic scenario so the stages stop being abstract. Imagine you run growth for a budgeting app in a crowded category, buying primarily on short-form video feeds, competing against half a dozen well-funded rivals across the US and a fast-growing Southeast Asian market.
Gather. On Monday you pull the past week's fresh creative from your six named competitors plus three category leaders, filtered to the video placements you actually buy, in both your regions. You end up with a focused corpus of roughly forty new or refreshed ads — not the whole category, just the advertisers and surfaces that matter to your decisions.
Decode. You tear down a representative dozen using the six-dimension scorecard, tagging each by hook archetype, proof type, offer, and format. As you tag, a few things become searchable: most of the US leaders are opening with a "specific-number" hook ("I saved $400 in 60 days"), nearly all stack two or more proof beats, and exactly none of the Southeast Asian ads use the loss-anxiety framing that dominates the US set.
Hypothesize. Reading across the decoded batch, three patterns turn into ranked hypotheses. First and highest-leverage: the US leaders' specific-number hooks are a category default we're not using — testing one against our current generic open could lift hook rate. Second: proof density (we run single-claim ads) may be costing us conversion versus the two-proof norm. Third, the most interesting gap: the loss-anxiety framing absent in our Southeast Asian market is a contrarian bet worth a small test there, since it's working in the US and nobody local is running it. You rank them by expected lift over build cost and put the specific-number hook test first.
Test. Using your modular hook library, you build three specific-number opens on your existing best-performing body, hold proof and offer constant, and launch a clean one-variable test against a named metric (3-second hook rate) with a pre-set sample size and stopping rule. The other two hypotheses queue behind it.
Systematize. When the result comes in — say the specific-number hook lifts hook rate meaningfully — the winning hook module goes into your library, the result is logged against your hit-rate, and the next teardown sprint re-tears-down the winner to attack its next weakest dimension (probably proof density, your second hypothesis). The loser variants go on a "don't re-test" list so you never burn budget re-discovering they don't work.
Notice what made this work: a focused gather (not the whole internet), disciplined decoding (tagged, so patterns surfaced), ranked hypotheses (not a pile of findings), a clean single-variable test (the only thing that produced verifiable truth), and a feedback step that made next week smarter. Also notice what the loop never claimed: it never asserted the competitors' specific-number hooks were their winners — only that the pattern was worth testing in our account, where we could actually measure it. That humility about the evidence is what kept the bet sound. The competitor ads were a hypothesis generator, not an answer key.
What Public Ad Evidence Can and Cannot Prove
This is the section that keeps your intelligence honest, and it's the one most likely to save you from an expensive mistake — so read it slowly. Everything in the gather and decode stages runs on public evidence, and public evidence has a hard ceiling.
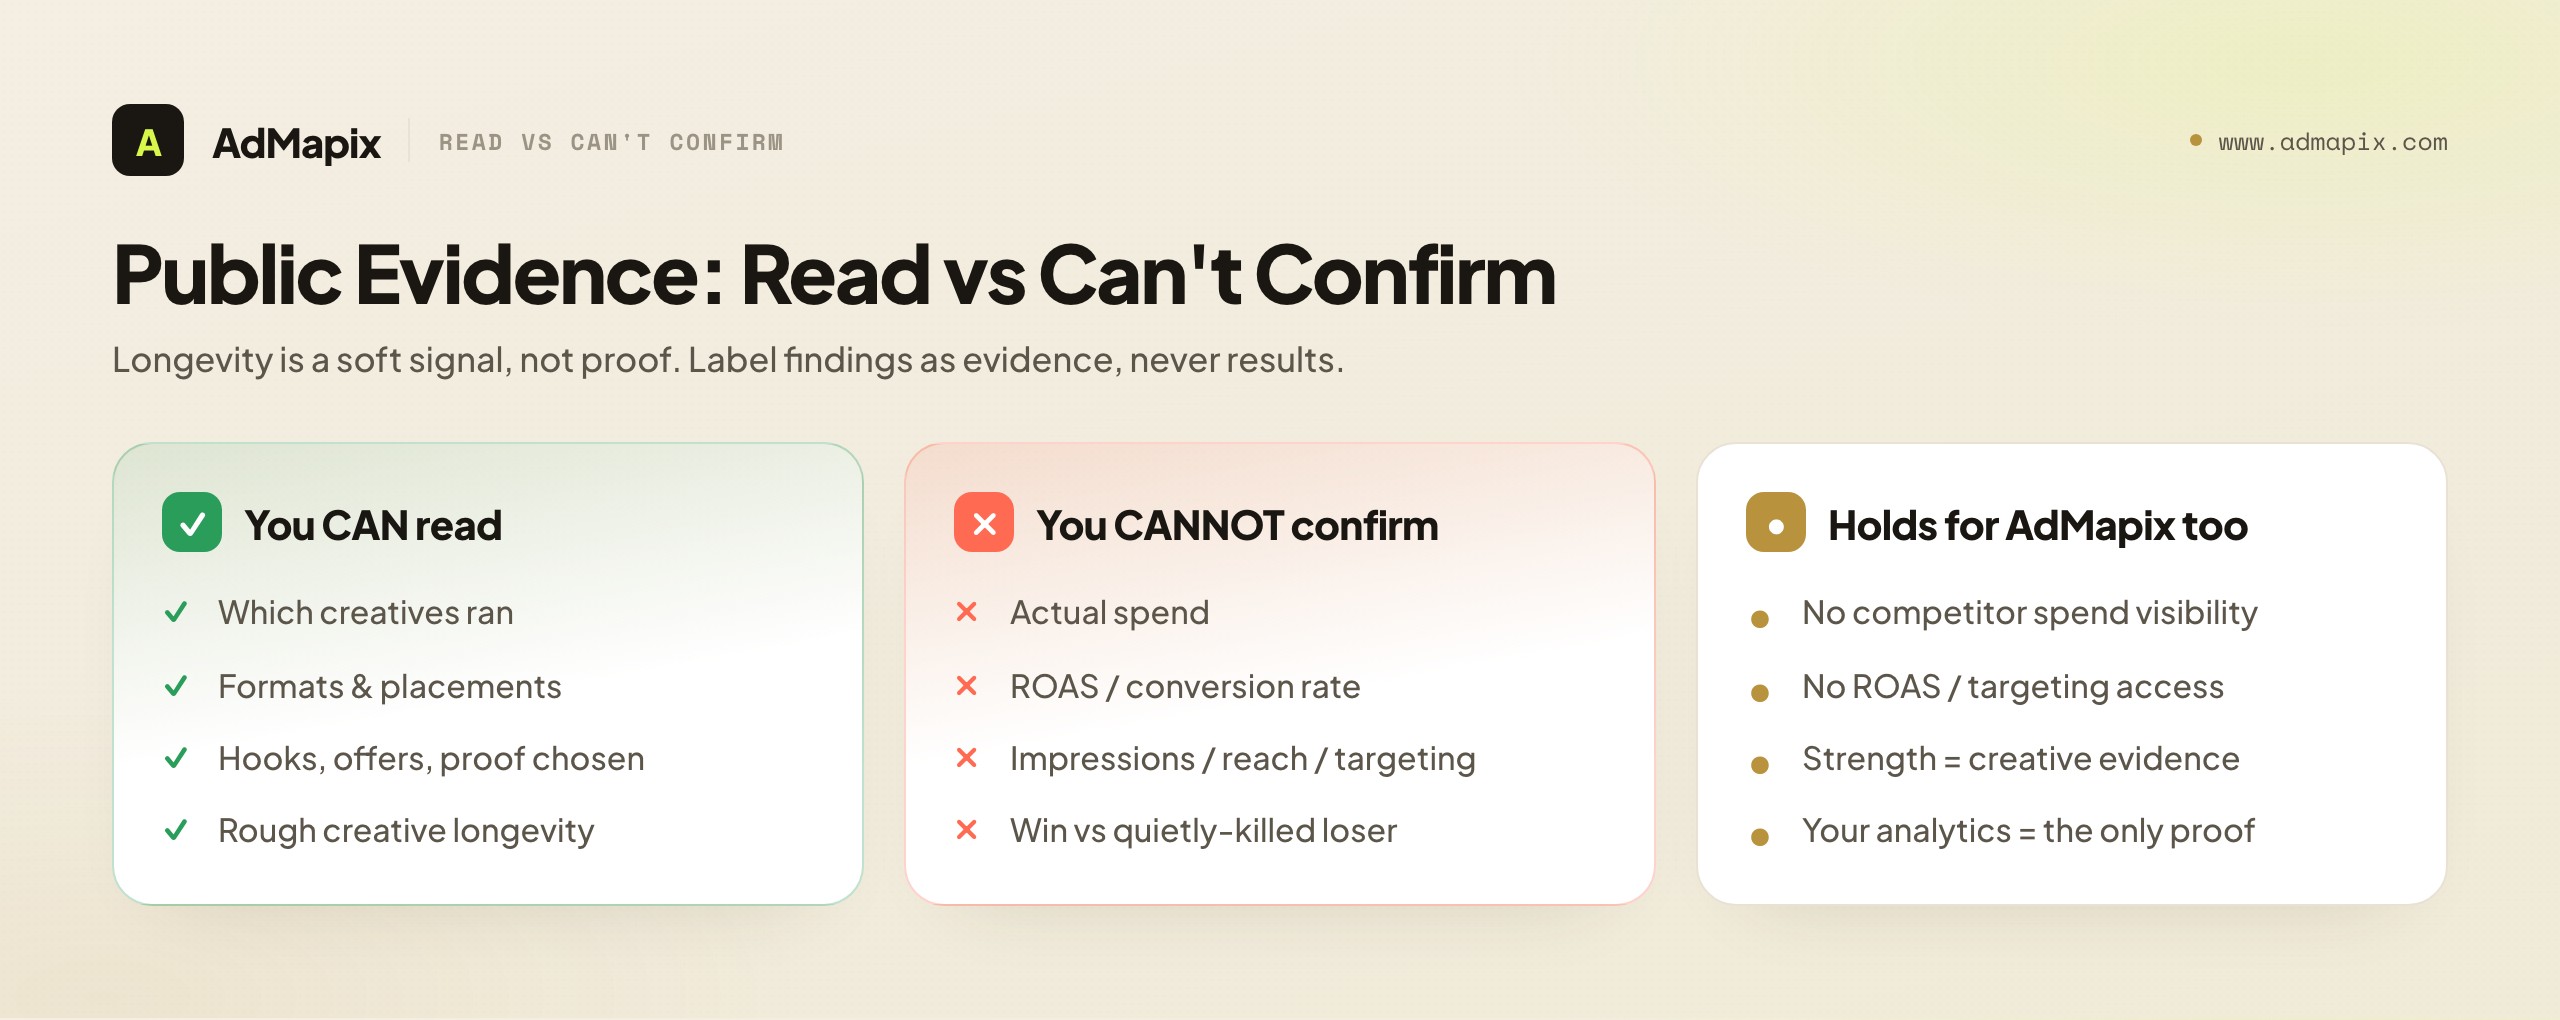
Here's the honest split. From public ad evidence you can read: which creatives an advertiser ran, the formats and placements they used, the hooks, offers, and proof they chose, and — when the source timestamps it — roughly how long a creative stayed live. From public ad evidence you cannot read: the ad's actual spend, its ROAS or conversion rate, its impressions or reach, the audience it targeted, the bids behind it, or whether any given ad was a winner or a quietly-killed loser. The most seductive trap is longevity: "it's been running 60 days, so it must work." That's a soft signal, not proof. Ads run long because they win, because the account is neglected, or because they're brand placements judged on metrics you can't see. Betting real budget on a competitor's unverified longevity is betting on a guess wearing a fact's costume.
This is exactly the lane where tools like AdMapix are clear about what they do. AdMapix provides searchable, cross-network creative evidence — saved ad examples, video breakdowns, and recurring reports — so your gather and decode stages have rich, organized raw material across platforms. That's genuinely valuable; it's the fuel the whole loop runs on. But AdMapix cannot show you a competitor's spend, ROAS, impressions, or targeting, and it doesn't pretend to, because that data simply isn't public. Its strength is evidence of creative, not proof of performance. Build your hypotheses on that foundation — "the leaders are running X, let's test whether X works for us" — and your intelligence stays grounded. Treat a competitor's long-running ad as confirmed truth, and you'll eventually pour budget into copying someone else's mistake.
The discipline this demands is one habit, applied everywhere: label findings as evidence, not results. Write "three category leaders ran proof-dense UGC hooks for 4+ weeks" (evidence — a hypothesis worth testing), never "proof-dense UGC is the winning formula" (a result you cannot verify from outside). The first sentence points at a test in your account, where performance becomes knowable. The second is a superstition dressed as strategy. Your own analytics is the only place creative performance is ever proven — which is why the loop always ends pointed at a test, never at a conclusion about a competitor.
Tooling: What to Look For (and What No Tool Can Do)
Ad creative intelligence tools earn their keep at the gather stage and, increasingly, by helping you tag and search the corpus at the decode stage. When you evaluate them, judge on a small set of things that actually determine value rather than on feature-list length.
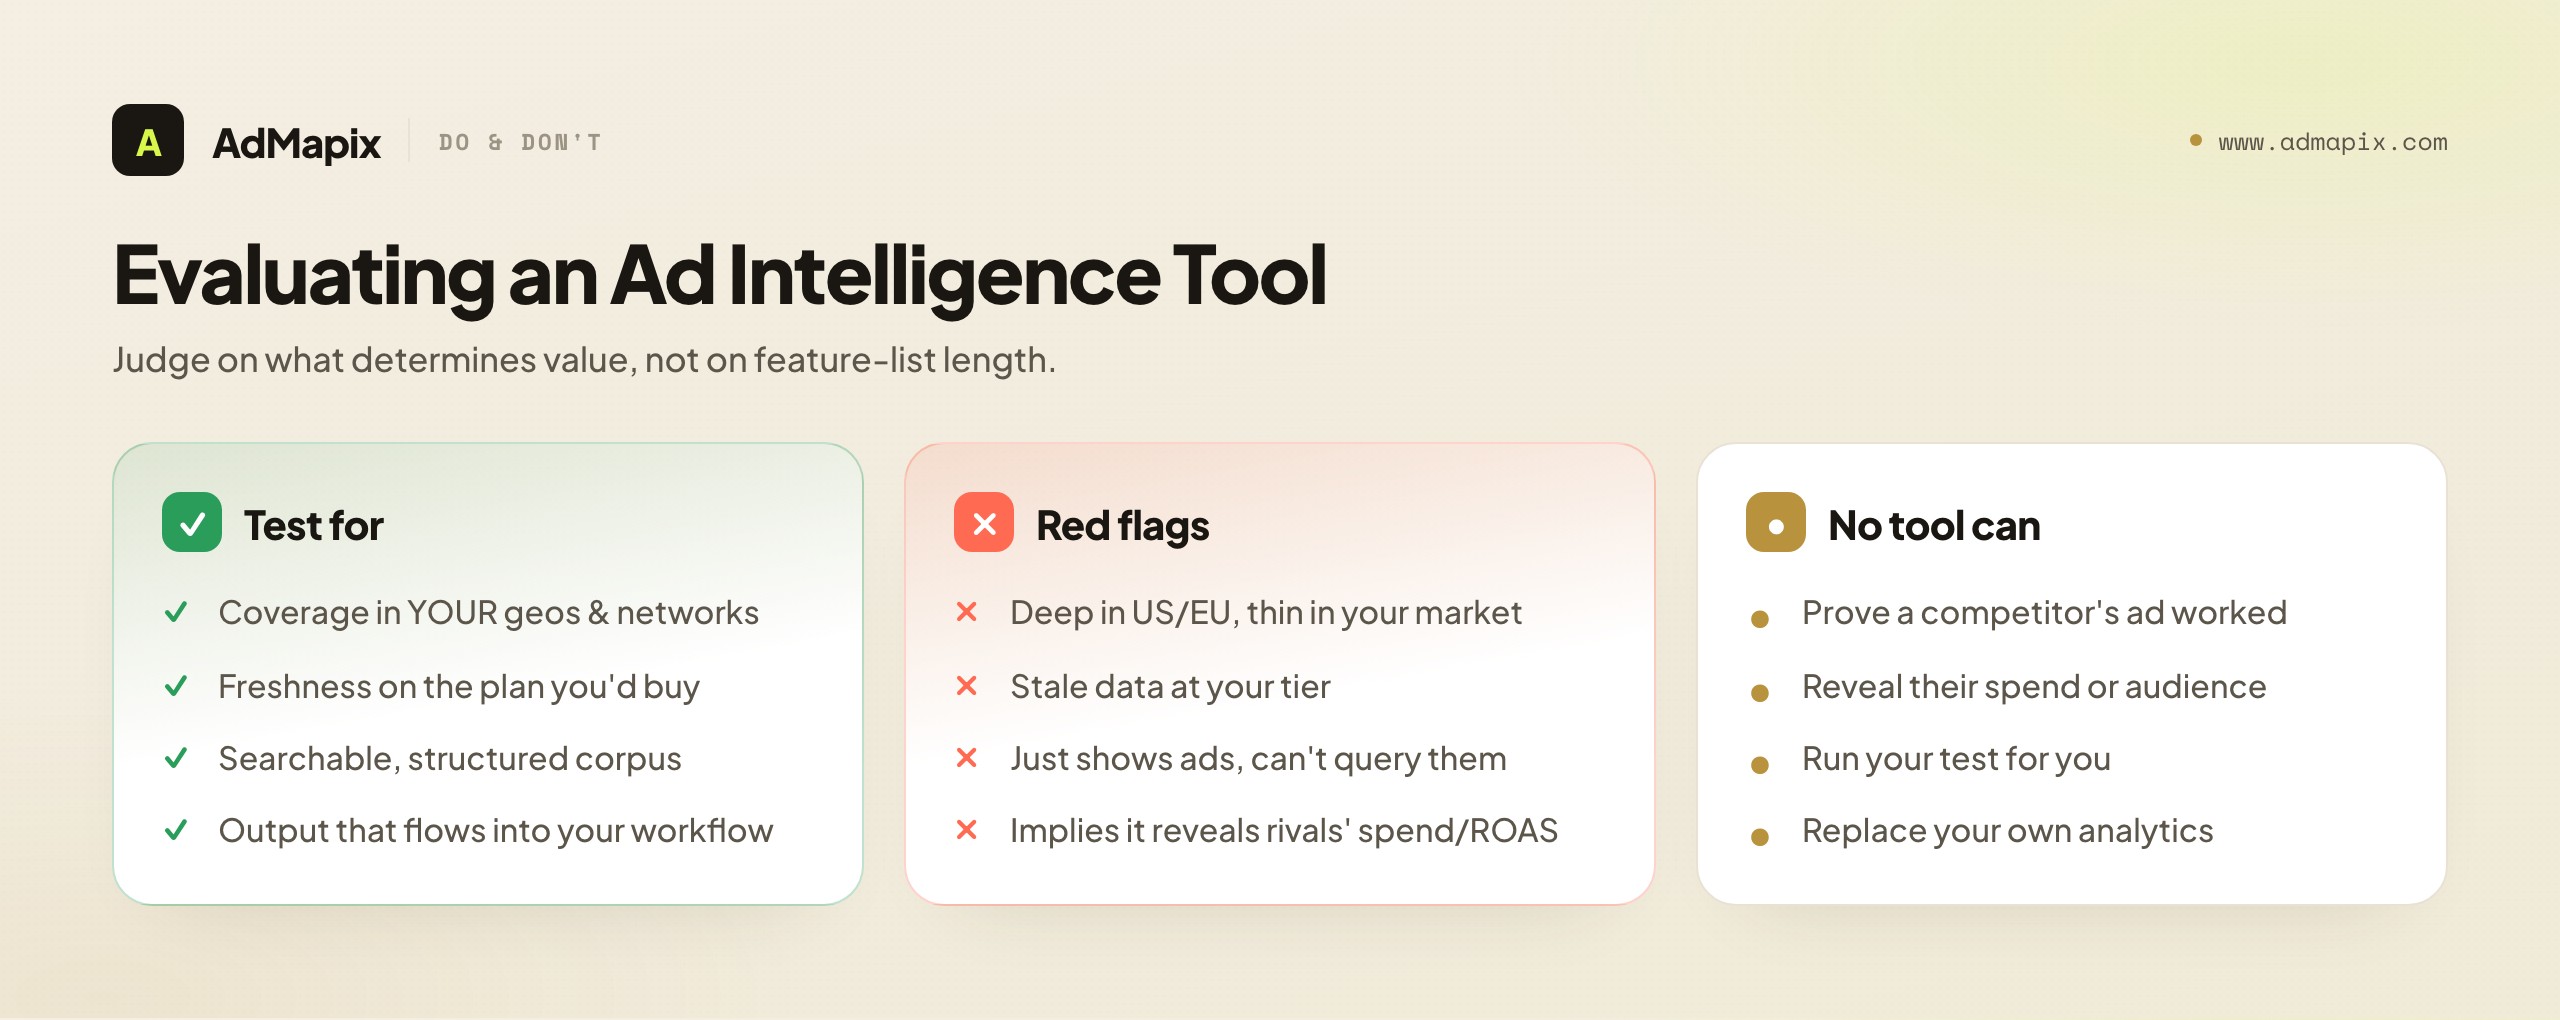
Coverage where it counts. A tool deep in US/EU but thin in your actual markets and networks is a blind spot you're paying for. Test it on your competitors, your geos, and your placements before you trust it — not on the vendor's demo brand.
Freshness at your tier. Compressed creative lifespans mean stale evidence is nearly worthless. Ask how fresh the data is on the plan you'd actually buy, not on the demo tier, which is almost always richer than what you'll get.
Searchability and structure. The difference between a catalog and a museum is whether you can slice the corpus by hook archetype, format, offer, and vertical. A tool that just shows you ads is a fire hose; a tool that lets you query them is plumbing.
Honest scope. The best tools are explicit that they show creative evidence, not competitor performance. Be suspicious of any tool implying it can reveal a rival's exact spend, ROAS, or targeting — that data isn't public, so the claim is either modeled estimation (fine, if labeled) or marketing fiction (run away).
Handoff to your workflow. Evidence that can't get into your teardown sheet, your hypothesis backlog, and your team's reports stays trapped. Value leaks at every manual copy-paste. Favor tools whose output flows into how your team actually works.
What no tool can do, at any price: prove a competitor's ad worked, reveal their spend or audience, or run your test for you. The performance truth lives in your analytics; the strategy lives in your judgment; the test lives in your account. Tools accelerate the gather and decode stages — which is real and worth paying for — but the loop's value is created by the discipline you bring to the other three stages. Buy tools to feed the loop, never in the hope that the tool is the loop. For a structured comparison of the market, the best ad intelligence tools and best ad spy tools for 2026 round-ups map the landscape against these criteria.
Building the Capability: From Side Project to System
The final mile of ad creative intelligence is organizational, not analytical. A loop run by one motivated person is fragile — it dies the week they're on vacation and disappears when they leave. Turning intelligence into a durable advantage means embedding it into how the team works.
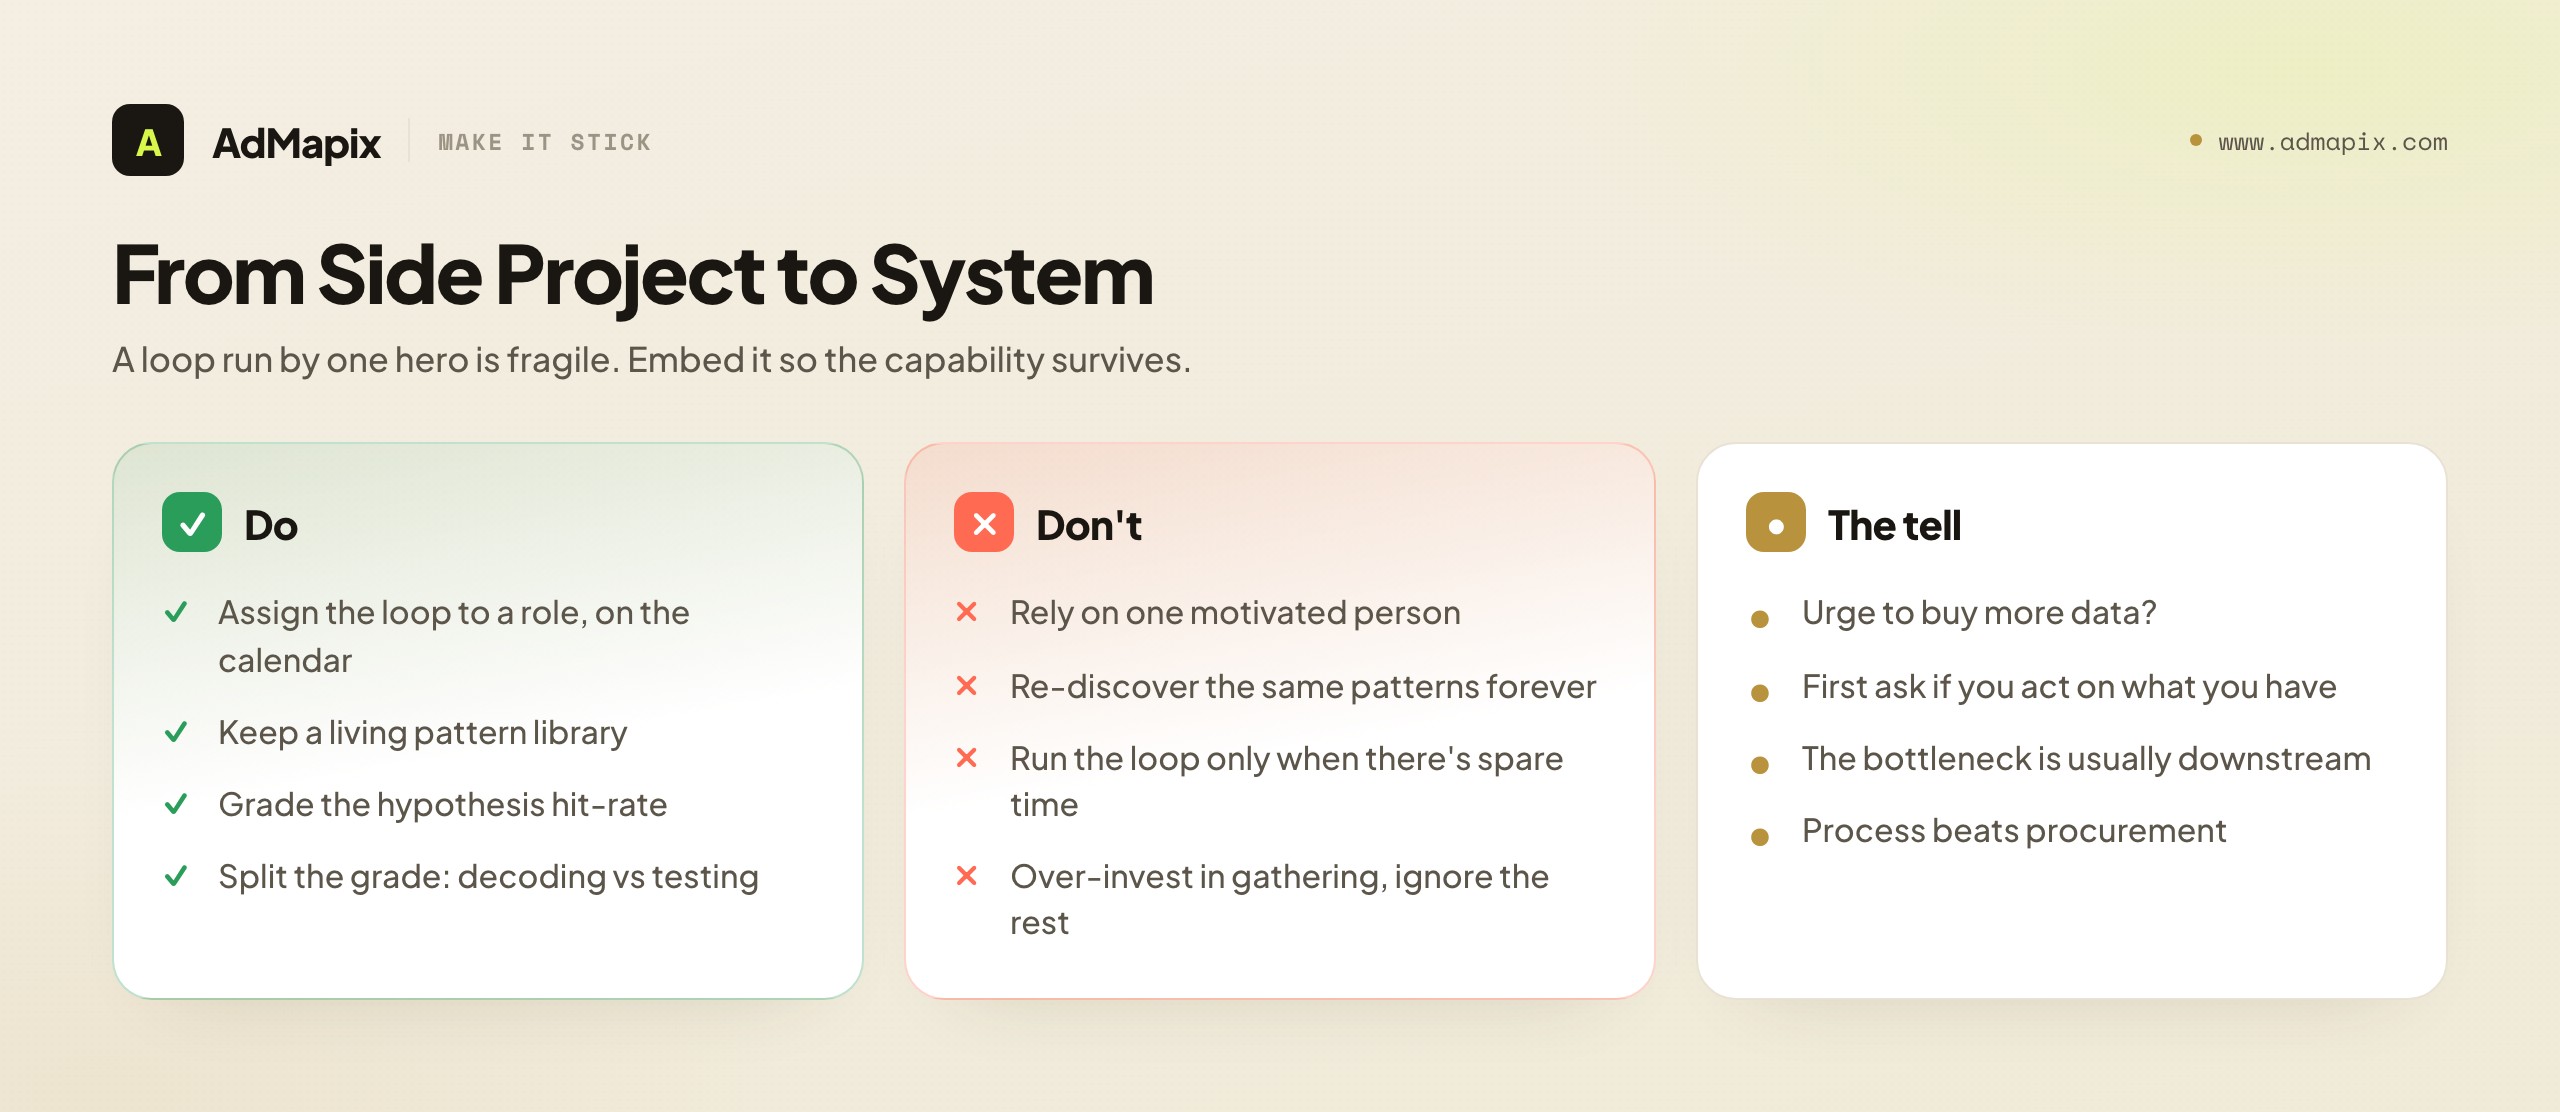
Three commitments make it stick. Ownership with a rhythm: assign the weekly loop to a role, not a hero, with a fixed cadence on the calendar so it survives busy weeks. The loop that only runs when someone has spare time never runs. A living pattern library: maintain the institutional memory — the hooks that worked, the offers that didn't, the gaps you've exploited — so the team builds on the past instead of re-discovering it. The library is the difference between a team that gets smarter and one that just stays busy. A graded hit-rate: track what fraction of your tested hypotheses actually moved the metric, broken down so you can tell whether your decoding (you're reading the market wrong) or your testing (you're running experiments badly) is the bottleneck. Without the grade, you can't improve the loop; you can only run it.
There's a maturity tell worth watching for. Early on, the temptation is to over-invest in gathering — more tools, more sources, bigger corpus — because gathering feels like progress and is the easiest stage to scale by spending money. But the bottleneck for almost every team is downstream: decoding without rigor, hypothesizing without ranking, testing without discipline, or never systematizing. When you feel the urge to buy more data, ask first whether you're acting on the data you already have. The answer is usually no, and the cheaper fix is process, not procurement.
Done right, ad creative intelligence becomes the engine that keeps your creative ahead of a market that's iterating faster every year. Not because you found one magic ad to copy — you can't verify that anyway — but because you built a system that keeps finding the cheapest next improvement, tests it honestly, and remembers what it learned. In a 2026 where creative half-lives are measured in weeks, that system is the difference between leading a category and chasing it.
The Seven Failure Modes That Kill Creative Intelligence
Even teams that adopt the loop fall into predictable traps. Knowing them in advance is far cheaper than discovering them in your spend.
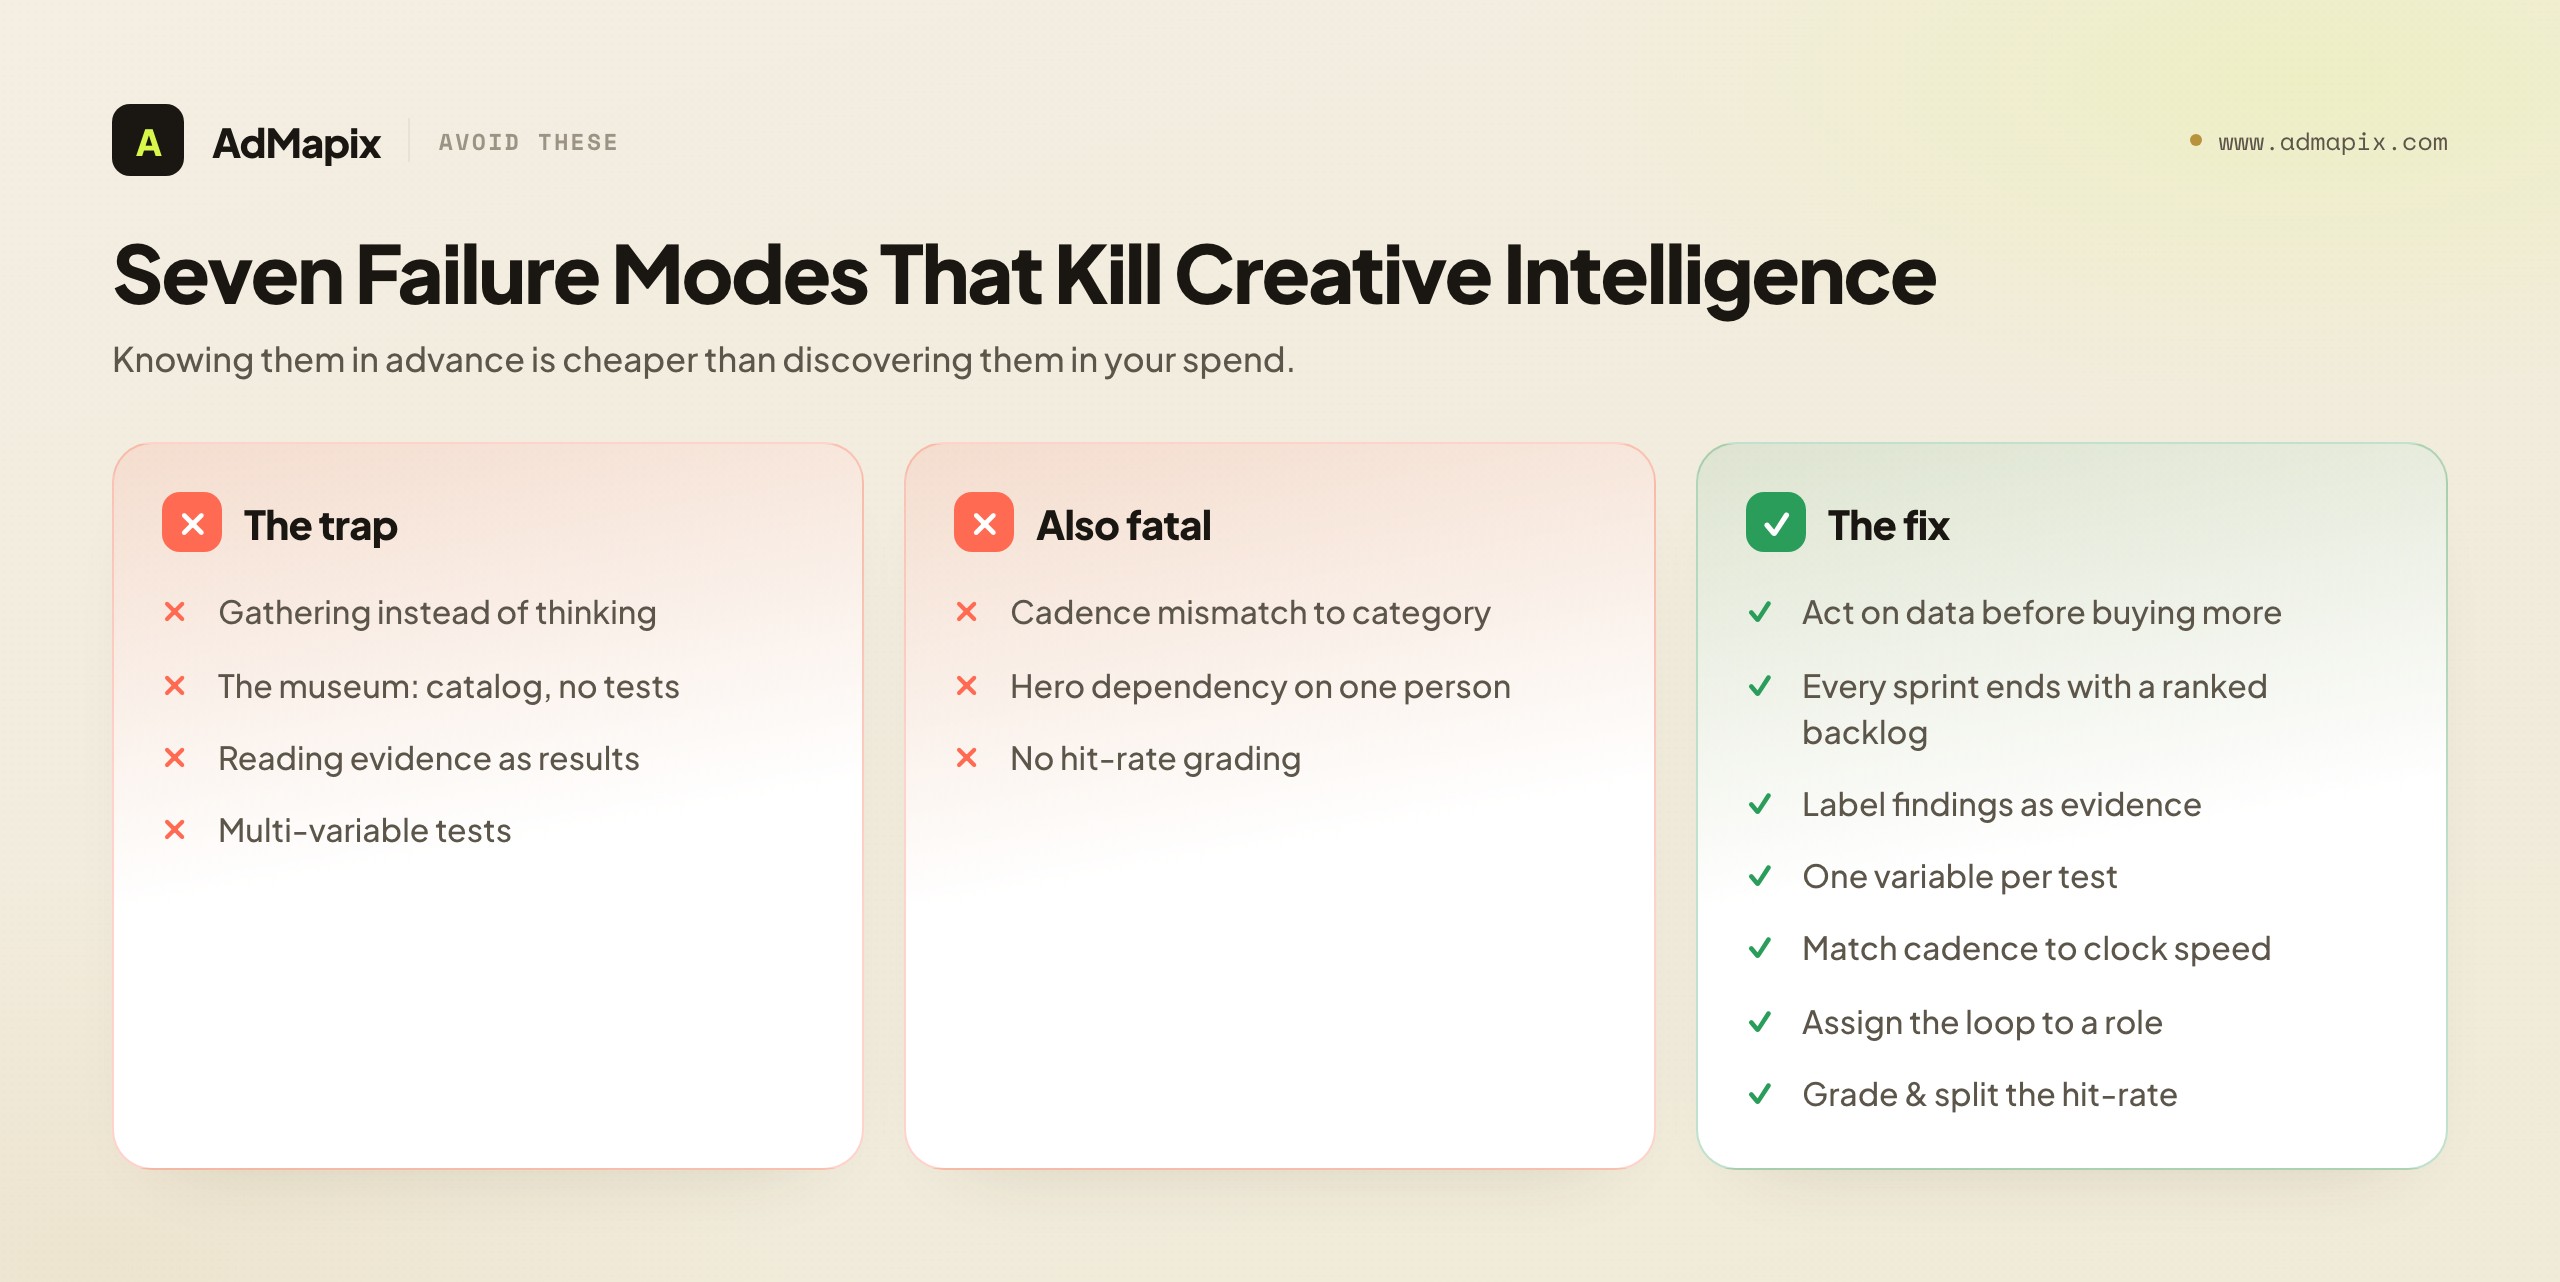
1. Gathering as a substitute for thinking. The easiest stage to scale by spending money is gathering, so anxious teams keep buying more sources and bigger corpora while the actual bottleneck — decoding, hypothesizing, testing — sits untouched. More data feels like progress; it usually isn't. Before you buy another source, ask whether you've acted on the data you already have.
2. The museum. A beautifully tagged, searchable library that never produces a test. Cataloging is genuinely Level 2 progress, but a catalog that doesn't feed a hypothesis backlog is a hobby, not a capability. The cure is a hard rule: every weekly sprint must leave with a ranked backlog or it didn't happen.
3. Reading the evidence as results. The single most expensive error: treating a competitor's long-running ad as a confirmed winner and copying it. You can't verify it, and you'll eventually pour budget into someone else's mistake. Label every market observation as evidence, never as a result.
4. Multi-variable tests. Changing the hook and the offer and the proof, then declaring victory when the bundle wins — having learned nothing about which change mattered. One variable per test, even though modularity makes it tempting to swap several modules at once. The discipline is the point.
5. Cadence mismatch. Running a quarterly audit in a category where creative decays in three weeks (you're perpetually behind), or a frenzied weekly loop for a product with a six-month sales cycle (you're wasting effort). Calibrate the loop to your category's clock speed; copying a generic cadence wastes the whole advantage.
6. The hero dependency. A loop that runs only because one motivated person carries it — and collapses the week they're out and disappears when they leave. Assign the loop to a role with a calendar slot, maintain a shared pattern library, and onboard so the capability is the team's, not an individual's.
7. No grading. Running the loop forever without ever measuring your hypothesis hit-rate, so you can't tell whether your decoding (you're misreading the market) or your testing (you're running experiments badly) is the weak link. Without the grade you can only run the loop; you can't improve it. Track the hit-rate and split it by stage.
Avoid these seven and the loop compounds. Fall into them and you'll have an expensive subscription, a full screenshot folder, and the same creative you started the year with.
If you want a single self-diagnostic to run quarterly, ask three questions in order. Did every weekly sprint this quarter end with a ranked backlog? Did the top item of that backlog actually ship as a clean, single-variable test? And do you know your hypothesis hit-rate well enough to say whether decoding or testing is your weaker stage? Three yeses means your loop is healthy and the only lever left is volume and quality of ideas. A no anywhere tells you exactly which stage to fix next — and it's almost never the gathering stage, which is the one teams instinctively reach to spend more on. The whole art of running creative intelligence well is resisting that instinct and investing instead in the unglamorous downstream stages where evidence finally turns into advantage.
FAQ
What is ad creative intelligence, exactly?
Ad creative intelligence is the structured practice of reading the ad creative your market produces — competitors' and category leaders' hooks, formats, offers, and proof — and converting that public evidence into your own faster, sharper creative testing. It's the bridge from what's visible in the market to what's testable in your account, run as a repeatable loop rather than an occasional browse.
How is ad creative intelligence different from ad intelligence and market intelligence?
Ad intelligence (broad) is the data layer — the searchable evidence of which ads ran where. Ad creative intelligence mines that evidence specifically for creative decisions (what to make and test). Market intelligence is a different layer entirely — downloads, revenue, market sizing — answering "where should we play?" rather than "what should we make?" Match the question to the layer; asking a creative tool to reveal competitor revenue (or vice versa) is a category error.
Can ad creative intelligence tell me what's actually working for my competitors?
No — and believing it can is the costliest mistake in the field. Public evidence proves an ad ran; it can't prove it worked. You can't see a competitor's spend, ROAS, impressions, or targeting from the outside. Treat longevity as a soft signal, record competitor patterns as evidence (not results), and prove what works in your account, where performance is measurable.
What does AdMapix provide for creative intelligence?
AdMapix gives you searchable, cross-network creative evidence — saved ad examples, video breakdowns, and recurring reports — that feeds the gather and decode stages of the loop with organized raw material across platforms. It cannot show competitor spend, ROAS, impressions, or audience targeting, because that data isn't public; its strength is evidence of creative, not proof of performance.
How often should I run the creative intelligence loop?
Calibrate to your category's clock speed. Fast categories (mobile gaming, DTC commodities, subscription apps) with compressed creative lifespans need a weekly loop. High-consideration categories (enterprise software, finance, healthcare) can run a more deliberate monthly loop with bigger stakes per decision. The cadence is part of the strategy — when creative half-lives are measured in weeks, a quarterly audit is too slow to matter.
What's the single biggest reason ad intelligence investments disappoint?
Teams buy a tool that nails the gather stage and assume the other four stages — decode, hypothesize, test, systematize — happen automatically. They don't. The tool gives you evidence; the loop turns evidence into advantage. A modest tool run through a disciplined loop beats a premium tool used as a screenshot machine, every time.
What's the deliverable of ad creative intelligence?
A ranked test backlog — a prioritized queue of hypotheses about what to make and test next, ordered by expected leverage. If the work ends in a report or a folder of admired ads, it was research theater. Intelligence that doesn't produce a queue of shippable tests hasn't done its job.
How do I know how mature my creative intelligence is?
Locate yourself on the four-level model: ad-hoc (occasional browsing, no structure), cataloged (tagged, searchable library but no action), looped (a recurring rhythm that ships tests and feeds back results), and systematized (institutionalized with a pattern library, hit-rate grading, and modular production). The goal is always the next level — and the next level is almost never "buy a better tool," it's "build the missing process."
Are the 2026 trends — hook compression, proof density, earlier CTAs — rules to follow?
No, they're well-supported priors to test, not laws. Your category's leaders may have already saturated a pattern to the point where the contrarian move wins. The value of creative intelligence is that it tells you your specific market's defaults — and the defaults are exactly where everyone's ads look alike. The compounding wins often come from importing a pattern rare in your category but standard in an adjacent one.
Do I need an expensive tool to do this?
No. Tools accelerate the gather and decode stages, which is real value worth paying for — but they don't confer maturity. A Level 1 team with a premium subscription is still Level 1: a fire hose with no plumbing. The cheapest, highest-leverage move at any level is to build the process the next level requires. Buy tools to feed the loop; never assume the tool is the loop.
Where does creative intelligence end and creative testing begin?
Creative intelligence ends when you have a ranked, testable hypothesis; creative testing begins when you ship it as a controlled experiment. The handoff is the hypothesis: one variable, a named metric, a pre-set sample size, a clear stopping rule. Intelligence finds the lever; testing confirms it's real. Skipping the second half is how teams accumulate confident, expensive superstitions — see the creative testing framework for running the test half cleanly.
Related Reading
Go deep on a single ad with the ad creative analysis scorecard, widen to the full competitive picture with the competitor ad analysis framework, and turn your hypotheses into clean experiments with the creative testing framework. For tooling, compare the best ad intelligence tools and the best ad spy tools for 2026; for the strategic context that wraps the whole discipline, read the advertising intelligence guide, and to see where the creative evidence comes from, the ad creative database explains the evidence layer.
See what competitors are really running
Search 6M+ ad creatives, landing pages, and weekly spend across 200+ countries. No credit card, no commitment.
Related Articles
Playable Ad Analysis for Mobile Games: A Practical Method
A practical method for playable ad analysis in mobile games: how to reverse-engineer a competitor's playable by the job it is built to do, decode its structure beat by beat, infer which concepts are likely working, turn observations into testable briefs, and stay honest about what a public playable proves (structure and intent) versus what it never can (spend, installs, retention, ROAS).
Best Mobile Game Ad Formats Across Platforms: A 2026 UA Playbook
A platform-by-platform guide to the best mobile game ad formats in 2026: which formats do the heavy lifting on Meta, Google, TikTok, AppLovin, and Unity; why the right format depends on platform, genre, and funnel stage; a format-selection framework; a creative-testing cadence; and the honest limits of what competitor ads can and cannot tell you about which format wins.
Meta Ads Library vs Ad Intelligence Tools for Game UA (2026): Which to Use, When, and Why
A definitive 2026 comparison of the Meta Ads Library vs dedicated ad intelligence tools for mobile game user acquisition — where the free transparency library genuinely helps, the structural limits that create blind spots for game UA creative research, a side-by-side capability matrix, the exact decision criteria for when to add a paid intelligence layer, and an honest account of what neither can show.