
Solitaire Associations Journey Ad Strategy 2026: Everything Delivers at 100 Impressions per Placement — Playables, Videos, iOS and Android Alike
Hitapps Games' US fleet for Solitaire Associations Journey runs 132,950,973 impressions across fifteen creatives in the 30 days to 2026-08-19, and 44 of 45 sampled creatives were still live on that date. The remarkable thing is the uniformity: pure playables deliver at 95.0 impressions per placement, videos at 99.9, iOS at 96.7, Android at 97.6. Format, platform and a 230-day age spread move the number by less than 6%. Downloads are down 17.41% anyway.
Hitapps Games' Solitaire Associations Journey runs the most uniform ad fleet we have measured. Its fifteen largest US creatives carry 132,950,973 impressions across 1,334,049 placements in the 30 days to 2026-08-19, and all fifteen were live on that date. Across a wider sample of forty-five creatives, forty-four were live.
That is not the finding. The finding is this: pure playable units in this account deliver at 95.0 impressions per placement, and videos deliver at 99.9. Split by platform instead, iOS delivers at 96.7 and Android at 97.6. Thirty-nine of forty-five creatives sit inside an 80–120 band. The oldest asset in the fleet launched 2026-01-01 and the newest 2026-07-24 — a 205-day spread — and it does not move the number either.
Format does not matter here. Platform does not matter. Age does not matter. Everything in this account returns roughly one hundred impressions per recorded placement, and US downloads are down 17.41% regardless.
Executive summary (TL;DR)
- Nothing is being retired. 15 of 15 top creatives live on the pull date; 44 of 45 across the wider sample. The single exception was last seen 2026-08-18, one day before the pull.
- ~100 impressions per placement, everywhere. Playables 95.0, videos 99.9, iOS 96.7, Android 97.6, fleet 96.9. The top-fifteen range is 82.5 to 110.2 — a 1.34x spread, the tightest measured in this series after Vita Mahjong.
- One playable is 45.4% of the fleet. Creative #1, first seen 2026-06-17, holds 60,424,325 window impressions across 627,405 placements — 2.4x the next-largest asset.
- Playables are attached to almost everything. 40 of 45 creatives carry a playable URL, including 28 of 33 videos. Only five creatives in the sample have no interactive component at all.
- Android is a single-format, single-month operation. All ten Android creatives are 59-second videos, and all ten launched between 2026-04-06 and 2026-04-21. Nothing before, nothing since.
- Two creatives deliver at exactly 24.3. Both Android, both 59 seconds, both first seen 2026-04-21 — the same date as three sibling creatives that deliver at 108.5, 108.7 and 108.9. Identical assets, identical launch, a 4.47x gap.
- The name on the chart is not the name on the ads. The US download chart lists Solitaire Associations Journey. Thirty-five of forty-five creatives display the store title Word Solitaire: Associations.
- The fleet is at full strength and downloads are falling. June's cohort produces 70.0% of current daily impressions. Downloads: -17.41%.
All figures are AdMapix third-party estimates for the United States, pulled 2026-08-19. Identity resolution and methodology at the end.
Which Solitaire this is — and why "Solitaire" is the hardest word in mobile
There are more products named some variation of "Solitaire" on the US chart than in any other naming cluster we deal with. Getting this wrong is easy and the failure is silent.
A unified product search resolves cleanly:
| Field | Value |
|---|---|
| Unified product name | Solitaire Associations Journey |
| Unified product ID | 6748950306 |
| Unified company | Hitapps Games LTD |
| Unified company ID | 1049188906 |
| Constituent product IDs | com.hitappsgames.wordsolitaire · 6748950306 |
| Category path | 602 → 60222 → 6022201 (Games → Word) |
| Lifetime unique materials | 13,277 |
| Lifetime global impressions | 44,338,063,108 |
| Lifetime spend index | 184,827,318 |
Now the trap, and it runs the opposite direction from most name collisions.
Thirty-five of the forty-five sampled creatives resolve to product ID 6748950306 — the iOS app ID that appears on the download chart — but the app name attached to those creative records is not "Solitaire Associations Journey". It is Word Solitaire: Associations.
The remaining ten resolve to the Android package com.hitappsgames.wordsolitaire, and those records display the chart title, "Solitaire Associations Journey".
So: the chart name lives on the Android build, and the iOS build — the one whose ID the chart cites — advertises under a different store title. If you matched creatives to products by name you would attribute 75% of this fleet's impressions to a game you would conclude was a different product.
There are two company IDs as well, the platform split that appears on nearly every title in this batch:
1049188906— Hitapps Games LTD, on iOS product67489503061253203597— Hitapps Games, on Android packagecom.hitappsgames.wordsolitaire
The publisher strings differ by two characters. The company IDs are entirely unrelated integers.
Everything in this teardown is locked to unified product 6748950306, Hitapps Games LTD, company 1049188906, and to creatives resolving to one of its two constituent product IDs. Store listings: App Store and Google Play.
The category path is worth noting: AdMapix classifies this as a Word game (6022201), not a card game. The product is a hybrid — solitaire mechanics driving a word-association layer — and the classification follows the word layer. That places it in a different competitive set than the real-cash solitaire titles it superficially resembles.
Where Solitaire Associations Journey sits on the US chart
| Metric | Value |
|---|---|
| US download rank | 151 |
| Downloads (current period) | 611,610 |
| Period-over-period change | -17.41% |
| US revenue rank | not in top 200 |
| Publisher | Hitapps Games LTD |
| iOS app ID | 6748950306 |
| Android package | com.hitappsgames.wordsolitaire |
| AdMapix company IDs | 1049188906 (iOS) · 1253203597 (Android) |
-17.41% places it in the middle of a broadly declining cohort — Pixel Flow! at -19.29%, Toca Boca World at -11.85%, Arrows – Puzzle Escape at -34.65%, EA SPORTS FC Mobile at -40.53%. Only 82-0.com, at +5.48%, is growing among the titles we measured on this date.
It does not appear in the US revenue top 200. Combined with a 13,277-material lifetime library and a spend index of 184,827,318, that is a notable asymmetry: this is a heavily-advertised product that does not surface on the revenue chart. Absence from a top-200 list bounds the figure from above and nothing more, but it is worth stating.
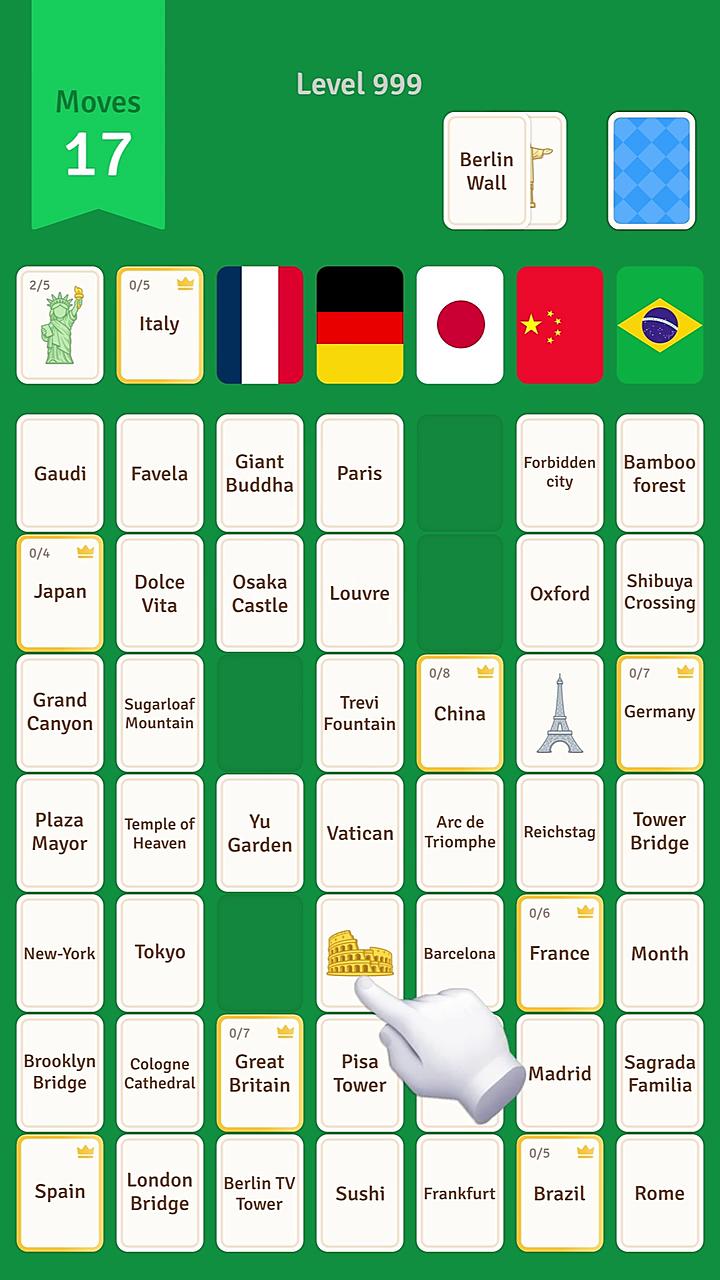 Creative #2 — a 59-second video on the Android package, first seen 2026-04-21 and still live after 120 days. 24,754,276 window impressions across 228,209 placements at 108.5 per placement. It is the largest video in the fleet and the largest Android asset by a factor of 2.9.
The fleet at a glance: fifteen creatives, fifteen live
| # | Window impressions | Share | Placements | Impr/placement | First seen | Days since first seen | Days live in window | Format | Platform |
|---|---|---|---|---|---|---|---|---|---|
| 1 | 60,424,325 | 45.4% | 627,405 | 96.3 | 2026-06-17 | 63 | 30.6 | playable | iOS |
| 2 | 24,754,276 | 18.6% | 228,209 | 108.5 | 2026-04-21 | 120 | 30.6 | 59s | Android |
| 3 | 8,545,530 | 6.4% | 78,490 | 108.9 | 2026-04-21 | 120 | 30.6 | 59s | Android |
| 4 | 6,747,979 | 5.1% | 81,781 | 82.5 | 2026-01-22 | 209 | 30.6 | playable | iOS |
| 5 | 5,365,558 | 4.0% | 49,449 | 108.5 | 2026-05-23 | 88 | 30.6 | 59s | iOS |
| 6 | 5,276,610 | 4.0% | 54,107 | 97.5 | 2026-01-17 | 214 | 30.6 | playable | iOS |
| 7 | 5,053,227 | 3.8% | 49,150 | 102.8 | 2026-06-16 | 64 | 30.6 | playable | iOS |
| 8 | 5,051,478 | 3.8% | 49,132 | 102.8 | 2026-06-27 | 53 | 30.6 | 59s | iOS |
| 9 | 2,931,464 | 2.2% | 27,591 | 106.2 | 2026-07-10 | 40 | 30.6 | playable | iOS |
| 10 | 2,055,167 | 1.5% | 23,143 | 88.8 | 2026-01-29 | 203 | 30.6 | playable | iOS |
| 11 | 1,719,198 | 1.3% | 15,889 | 108.2 | 2026-05-10 | 101 | 30.6 | 59s | iOS |
| 12 | 1,550,476 | 1.2% | 15,166 | 102.2 | 2026-06-28 | 52 | 30.6 | 59s | iOS |
| 13 | 1,182,882 | 0.9% | 10,735 | 110.2 | 2026-02-07 | 193 | 30.6 | playable | iOS |
| 14 | 1,171,117 | 0.9% | 10,639 | 110.1 | 2026-06-13 | 67 | 30.6 | 29s | iOS |
| 15 | 1,121,686 | 0.8% | 13,163 | 85.2 | 2026-01-01 | 230 | 30.6 | playable | iOS |
| Total | 132,950,973 | 100% | 1,334,049 | 99.7 | — | 121.1 avg | 30.6 | — | — |
Every one of these fifteen was live for the entire measurement window. That matters more than it looks. These impression figures are totals inside a 30.6-day window running 2026-07-20 to 2026-08-19 — they are not lifetime totals — and because all fifteen creatives were live across the whole of it, their window impressions are directly comparable to each other with no age adjustment needed. A per-day rate column would be the impressions column divided by the same constant fifteen times over, so we do not publish one. "Days since first seen" ranges from 40 to 230 and is a lifetime quantity; it is not the denominator for these impressions.
Every one of these fifteen recorded a last-observed timestamp of 2026-08-19. The oldest is 230 days old and still running. Nothing has been retired.
Look at the impressions-per-placement column: 82.5, 85.2, 88.8, 96.3, 97.5, 102.2, 102.8, 102.8, 106.2, 108.2, 108.5, 108.5, 108.9, 110.1, 110.2. Fifteen values, all between 82 and 111. A 1.34x total spread.
To put that in context, the same metric on Mahjong Blast's fleet spans 18.65x, on Pixel Flow! 9.24x and on 82-0.com 10.04x. The only tighter fleet we have measured is Vita Mahjong at 1.15x — and Vita's band sits at 967 to 1,117, roughly ten times higher.
The 100-impression band holds across formats
This is the part that separates this account from every other fleet in the series. On Mahjong Blast, format was the cause of variance: videos were pinned at 14.7 while playables ranged across 11.25x. Here, format does nothing at all.
Across the full 45-creative sample:
| Family | Creatives | Impressions | Share | Placements | Impr/placement | Range |
|---|---|---|---|---|---|---|
| Pure playable | 12 | 87,073,039 | 59.9% | 916,268 | 95.0 | 47.8 – 110.2 |
| Video | 33 | 58,408,792 | 40.1% | 584,870 | 99.9 | 24.3 – 117.6 |
| All | 45 | 145,481,831 | 100% | 1,501,138 | 96.9 | 24.3 – 117.6 |
A playable ad and a fifty-nine-second video are not the same object. They occupy different inventory, they are bid on differently, and in every other account we have measured they deliver at wildly different rates. Here the difference is 4.9 percentage points — playables at 95.0, videos at 99.9.
Split the same sample by platform instead and the result repeats:
| Platform | Creatives | Impressions | Share | Impr/placement |
|---|---|---|---|---|
iOS (6748950306) | 35 | 108,993,834 | 74.9% | 96.7 |
Android (com.hitappsgames.wordsolitaire) | 10 | 36,487,997 | 25.1% | 97.6 |
Two separate app store listings, two AdMapix company records, two entirely different creative mixes — and a 0.9% difference in delivery rate.
Split by video runtime and it holds again:
| Duration | Creatives | Impressions | Impr/placement |
|---|---|---|---|
| 15s | 1 | 430,028 | 108.8 |
| 29s | 1 | 1,171,117 | 110.1 |
| 55s | 1 | 574,476 | 94.1 |
| 59s | 28 | 55,519,383 | 100.4 |
| 60s | 1 | 411,021 | 48.7 |
| 119s | 1 | 302,767 | 113.8 |
A 15-second cut and a 119-second cut — an 7.9x runtime difference — deliver at 108.8 and 113.8. They are within 4.6% of each other.
What this means. When a delivery rate is invariant to format, platform, runtime and age, it is not describing the creative. It is describing the buying surface. Hitapps is placing every asset into the same class of inventory, and that inventory returns approximately one hundred impressions per recorded appearance no matter what you put in it.
The operational consequence is uncomfortable and worth stating plainly: in this account, creative iteration is not buying delivery variance. A new video will deliver at about 100. A new playable will deliver at about 95. If the team is running creative tests expecting the delivery rate to move, the data says it will not. Whatever these creatives differ on — install rate, retention, ARPU — it is not visible in impressions per placement, because that number is a property of the placement, not the asset.
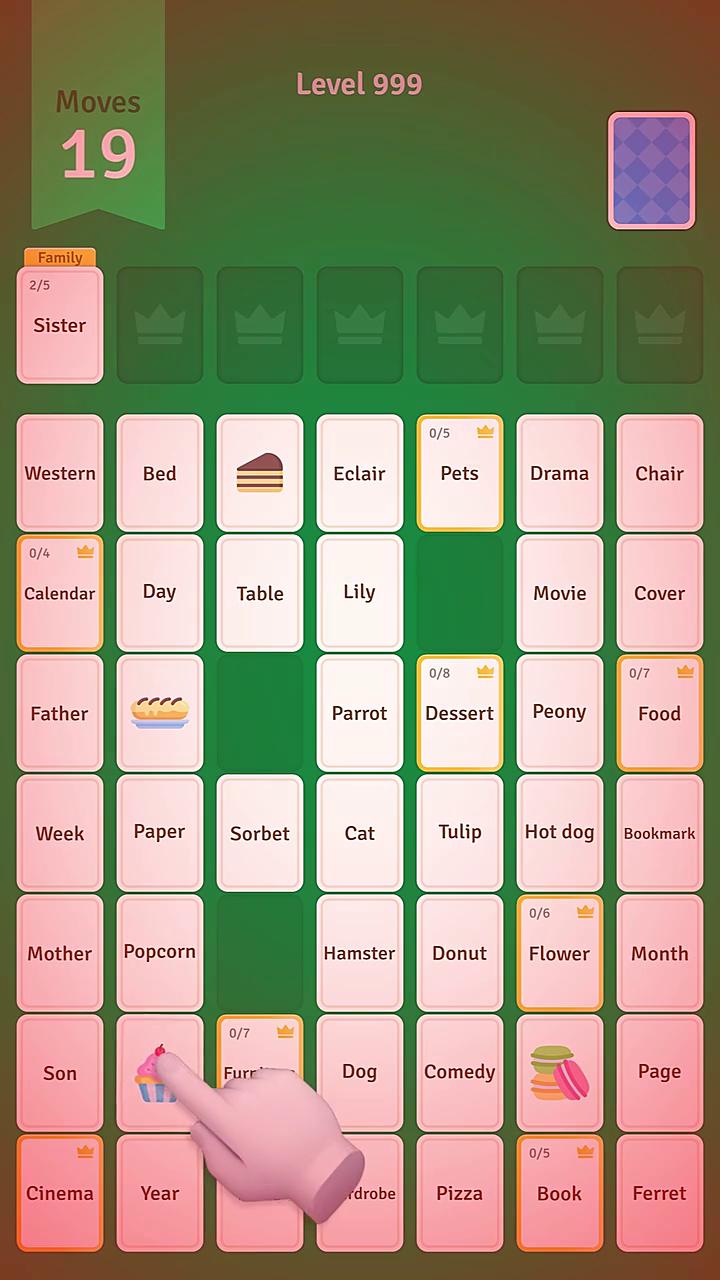 Creative #3 — 59 seconds, Android, first seen 2026-04-21 alongside creative #2 and three others. 8,545,530 impressions across 78,490 placements at 108.9 per placement, running 120 days and still live. Its delivery rate is within 0.4% of creative #2's despite carrying 2.9x fewer impressions.
Creative #1: one playable, 45.4% of the fleet, 627,405 placements
| Creative #1 | |
|---|---|
| Format | playable |
| Platform | iOS (6748950306) |
| First seen | 2026-06-17 |
| Days live | 63 |
| Impressions | 60,424,325 |
| Placements | 627,405 |
| Impressions per placement | 96.3 |
| Days live in window | 30.6 (full window) |
| Share of fleet impressions | 45.4% |
| Share of fleet placements | 47.0% |
Creative #1 is 45.4% of the fleet's impressions and 47.0% of its placements. Those two shares being nearly identical is itself the story: this asset is not dense, it is everywhere. At 96.3 impressions per placement it sits slightly below the fleet average of 99.7. Its dominance comes purely from volume of placement, not from efficiency of delivery.
That is a different pattern from the fleets where a single asset dominates. Pixel Flow!'s leading creative holds 78.1% of impressions on 63.2% of placements — it is both large and dense. Mahjong Blast's holds 59.0% of impressions on 19.5% of placements — it is dense above all. Hitapps' number-one asset holds 45.4% on 47.0%. It is exactly proportional.
It carries 2.4x the window impressions of creative #2, the next-largest asset. Because every creative in this fleet was live for the full window, that ratio is a clean comparison — no age adjustment is required and none is being smuggled in.
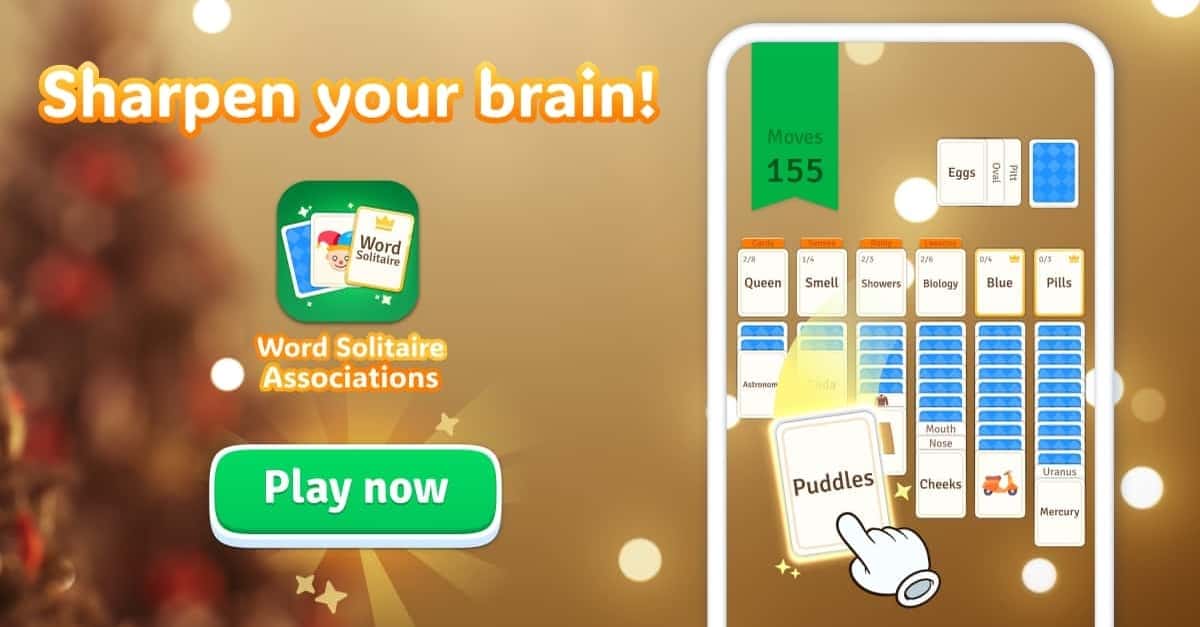 Creative #9 — a playable unit first seen 2026-07-10 and live 40 days, carrying 2,931,464 window impressions across 27,591 placements at 106.2 per placement. It is the ninth-largest asset in the fleet and the second-newest in the top fifteen.
Playables are attached to almost everything
Forty of the forty-five sampled creatives carry a playable URL:
| Creative type | Count | Carries a playable URL |
|---|---|---|
| Pure playable units | 12 | 12 (100%) |
| Videos | 33 | 28 (84.8%) |
| Total | 45 | 40 (88.9%) |
Twenty-eight of thirty-three videos have an interactive component attached — almost certainly a playable end card following the video. Only five creatives in the entire sample are video-only with no interactive element.
Against the two fleets pulled the same day, this is the highest interactive penetration measured:
| Fleet | Sampled | With playable attached | Pure playable |
|---|---|---|---|
| Solitaire Associations Journey | 45 | 40 (88.9%) | 12 |
| Pixel Flow! | 45 | 31 (68.9%) | 4 |
| 82-0.com | 150 | 0 (0.0%) | 0 |
And against the same-day solitaire comparison set on a top-ten basis:
| Fleet | Publisher | With playable attached | Pure playable |
|---|---|---|---|
| Solitaire Associations Journey | Hitapps Games | 10 / 10 | 6 |
| Solitaire Clash: Win Real Cash | Aviagames | 5 / 10 | 1 |
| Solitaire Cash | Papaya Gaming | 2 / 10 | 0 |
| Solitaire Grand Harvest | Supertreat | 1 / 10 | 1 |
Hitapps attaches an interactive unit to every single one of its top ten creatives. Supertreat attaches one to one. The two real-cash solitaire titles sit in between.
Here is the thing that makes this interesting given the section above: an 88.9% interactive attachment rate produces exactly the same delivery rate as the 11.1% that has no attachment. Whatever the playable end card is doing for Hitapps — and it is presumably doing something, or they would not attach it to twenty-eight of thirty-three videos — it is not changing impressions per placement.
Android: one format, one month, and two creatives at exactly 24.3
The Android side of this account is startlingly narrow.
| Property | All ten Android creatives |
|---|---|
| Format | 59-second video (10 of 10) |
| Launch window | 2026-04-06 → 2026-04-21 (16 days) |
| Launches before 2026-04-06 | 0 |
| Launches after 2026-04-21 | 0 |
| Still live on 2026-08-19 | 10 of 10 |
| Impressions | 36,487,997 |
| Impr/placement | 97.6 |
Ten creatives, one runtime, one sixteen-day window in April, nothing since. Meanwhile the iOS side shipped continuously — six creatives in January, two in February, eleven in April, seven in May, nine in June, ten in July.
Within that April window sits the strangest data point in the fleet:
| Creative | First seen | Duration | Impressions | Placements | Impr/placement |
|---|---|---|---|---|---|
| #2 | 2026-04-21 | 59s | 24,754,276 | 228,209 | 108.5 |
| #3 | 2026-04-21 | 59s | 8,545,530 | 78,490 | 108.9 |
| #23 | 2026-04-21 | 59s | 546,769 | 5,031 | 108.7 |
| #19 | 2026-04-21 | 59s | 633,385 | 26,103 | 24.3 |
| #24 | 2026-04-21 | 59s | 532,152 | 21,877 | 24.3 |
Five creatives, same package, same runtime, same launch date. Three deliver at 108.5, 108.7 and 108.9 — within 0.4% of each other. Two deliver at 24.3 and 24.3 — identical to one decimal place.
The ratio between the two groups is 4.47x. And the two outliers are not small in placement terms: #19 recorded 26,103 placements and #24 recorded 21,877, more than four times #23's 5,031, while producing roughly the same impressions.
Two creatives landing on the same value to one decimal place is not measurement noise. It is two assets sharing a placement type that returns about a quarter of what the rest of the fleet returns. The most likely explanation is a distinct inventory bucket — a network, a placement size, or an ad slot type that these two were routed into and the others were not. We cannot identify it from this data and we are not going to guess at a name.
What we can say: the 100-impression band is not a law of physics, it is a description of where 39 of 45 creatives are running. Six creatives sit outside it — the two at 24.3, one at 48.7, one at 47.8, one at 77.2 and one at 79.3 — and finding out what those six have in common would be more valuable to Hitapps than any A/B test on the other thirty-nine.
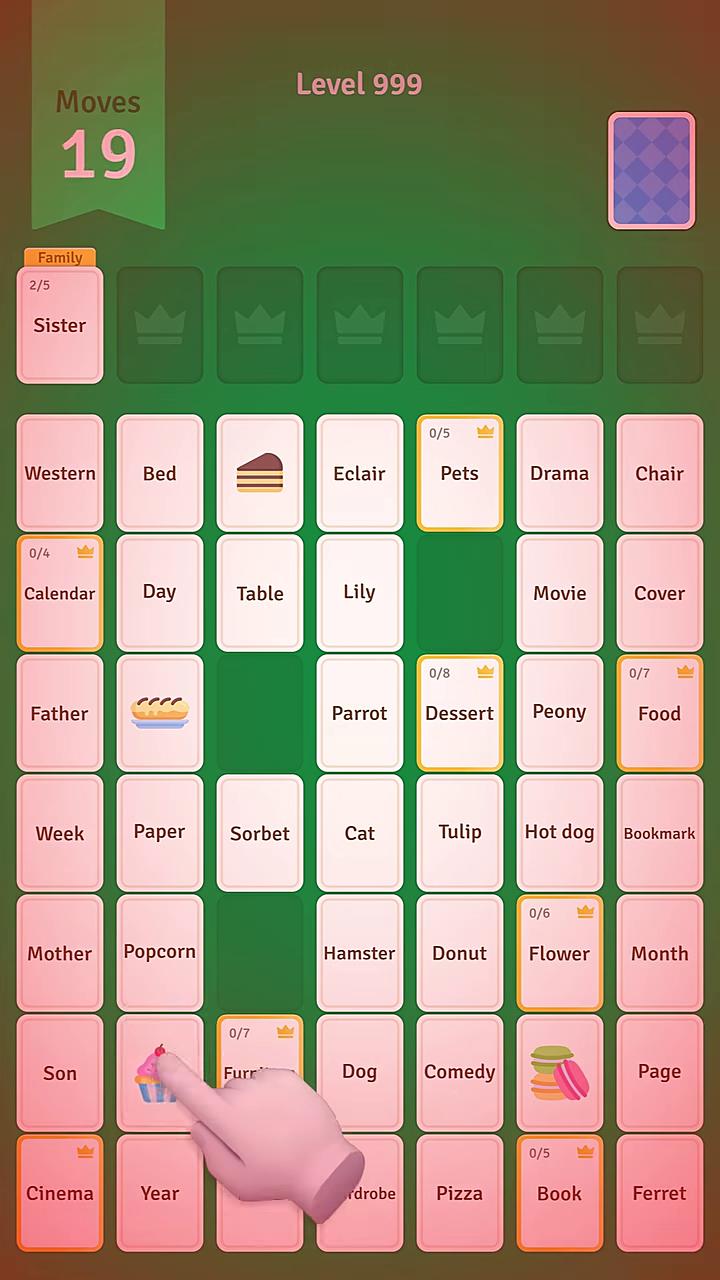 Creative #19 — 59 seconds, Android, first seen 2026-04-21, still live after 120 days. 633,385 impressions across 26,103 placements at exactly 24.3 per placement. Its four same-day siblings deliver at 24.3, 108.5, 108.7 and 108.9.
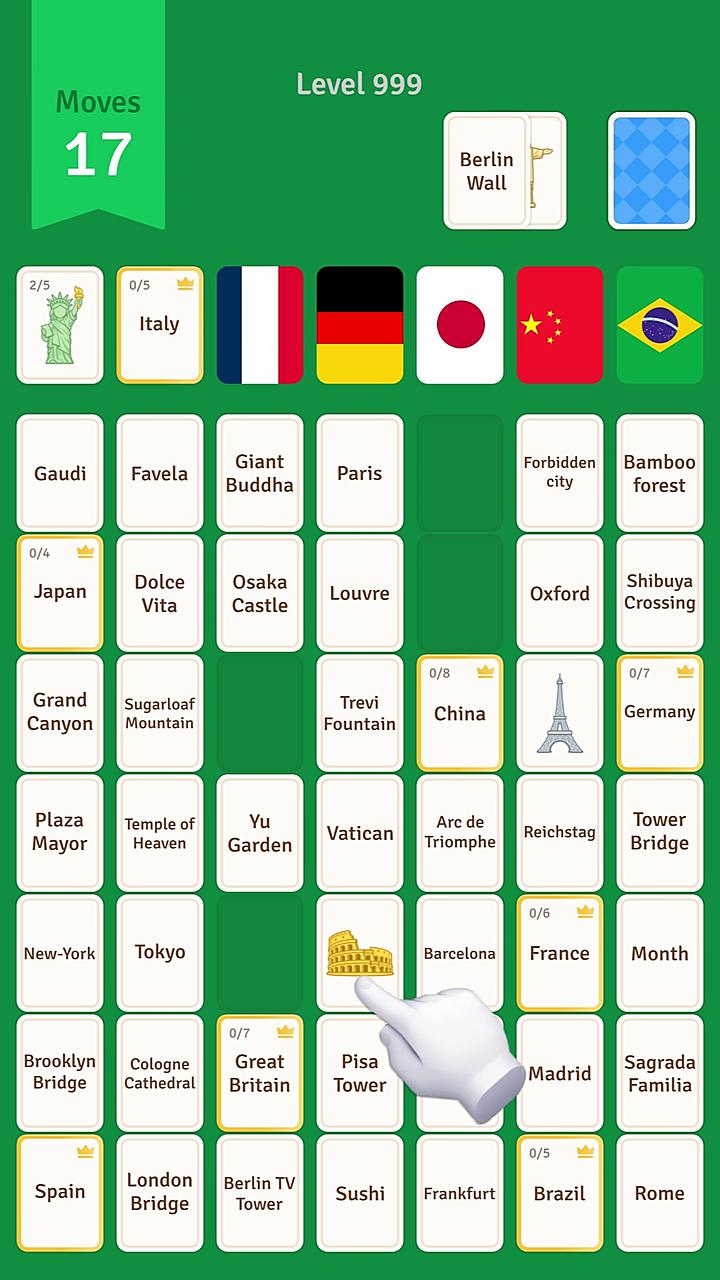 Creative #24 — the fleet's second 24.3 creative. 532,152 impressions across 21,877 placements, 59 seconds, Android, first seen 2026-04-21, still live. Identical delivery rate to creative #19 to one decimal place, and 4.47x below the three siblings launched the same day.
The build cadence: continuous, with one March hole
Grouping all forty-five sampled creatives by launch month:
| Month | Creatives launched |
|---|---|
| 2026-01 | 6 |
| 2026-02 | 2 |
| 2026-03 | 0 |
| 2026-04 | 11 |
| 2026-05 | 7 |
| 2026-06 | 9 |
| 2026-07 | 10 |
And the top-fifteen cohort contributions:
| Cohort | Creatives | Window impressions | Share of window volume |
|---|---|---|---|
| 2026-01 | 4 | 15,201,442 | 11.4% |
| 2026-02 | 1 | 1,182,882 | 0.9% |
| 2026-04 | 2 | 33,299,806 | 25.0% |
| 2026-05 | 2 | 7,084,756 | 5.3% |
| 2026-06 | 5 | 73,250,623 | 55.1% |
| 2026-07 | 1 | 2,931,464 | 2.2% |
The June cohort — five creatives launched 2026-06-13 through 2026-06-28 — carries 55.1% of the fleet's window volume. Creative #1 alone accounts for most of it.
We show only one share column here, and the reason is worth stating. Because every creative in this fleet was live for the whole 30.6-day window, a cohort's share of impressions and its share of output-per-day are the same number by construction. Any apparent divergence between "cumulative share" and "current rate share" in a fleet like this would be an artifact of dividing window impressions by lifetime age, not a fact about the cohorts.
The March hole is real and it is the only gap in the account. Seventy-three days separate the 2026-02-07 launch from the 2026-04-21 batch. What follows it is the Android launch and the fleet's largest video, so whatever happened in March, the account came back bigger.
The other thing the cadence table shows is that July was the second-busiest month by launch count (10) and produced only 2.2% of top-fifteen impressions. The newest asset in the entire 45-creative sample launched 2026-07-24, twenty-six days before the pull, and sits at rank 21 with 574,476 impressions. Hitapps is still shipping at pace; the recent output just has not scaled yet.
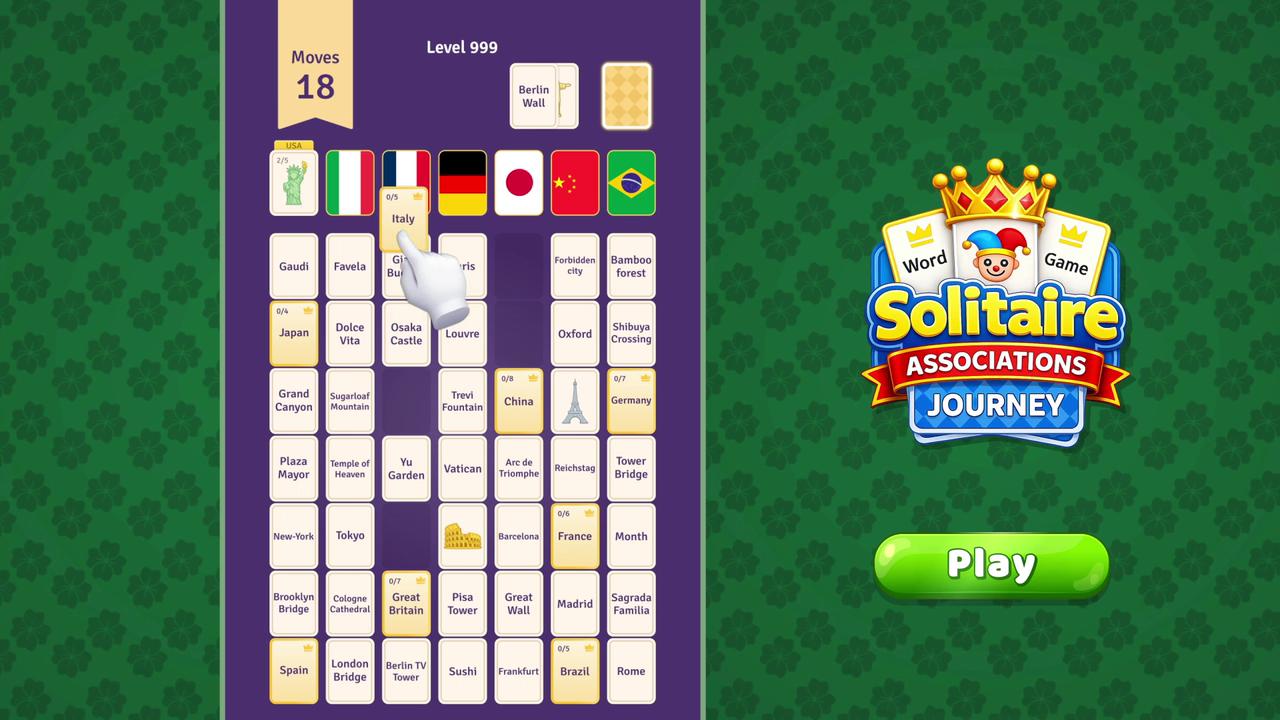 The newest creative in the sample — 55 seconds, iOS, first seen 2026-07-24 and live 26 days, of which 26.2 fall inside the measurement window. 574,476 window impressions across 6,103 placements at 94.1 per placement. It is the only 55-second asset in the account.
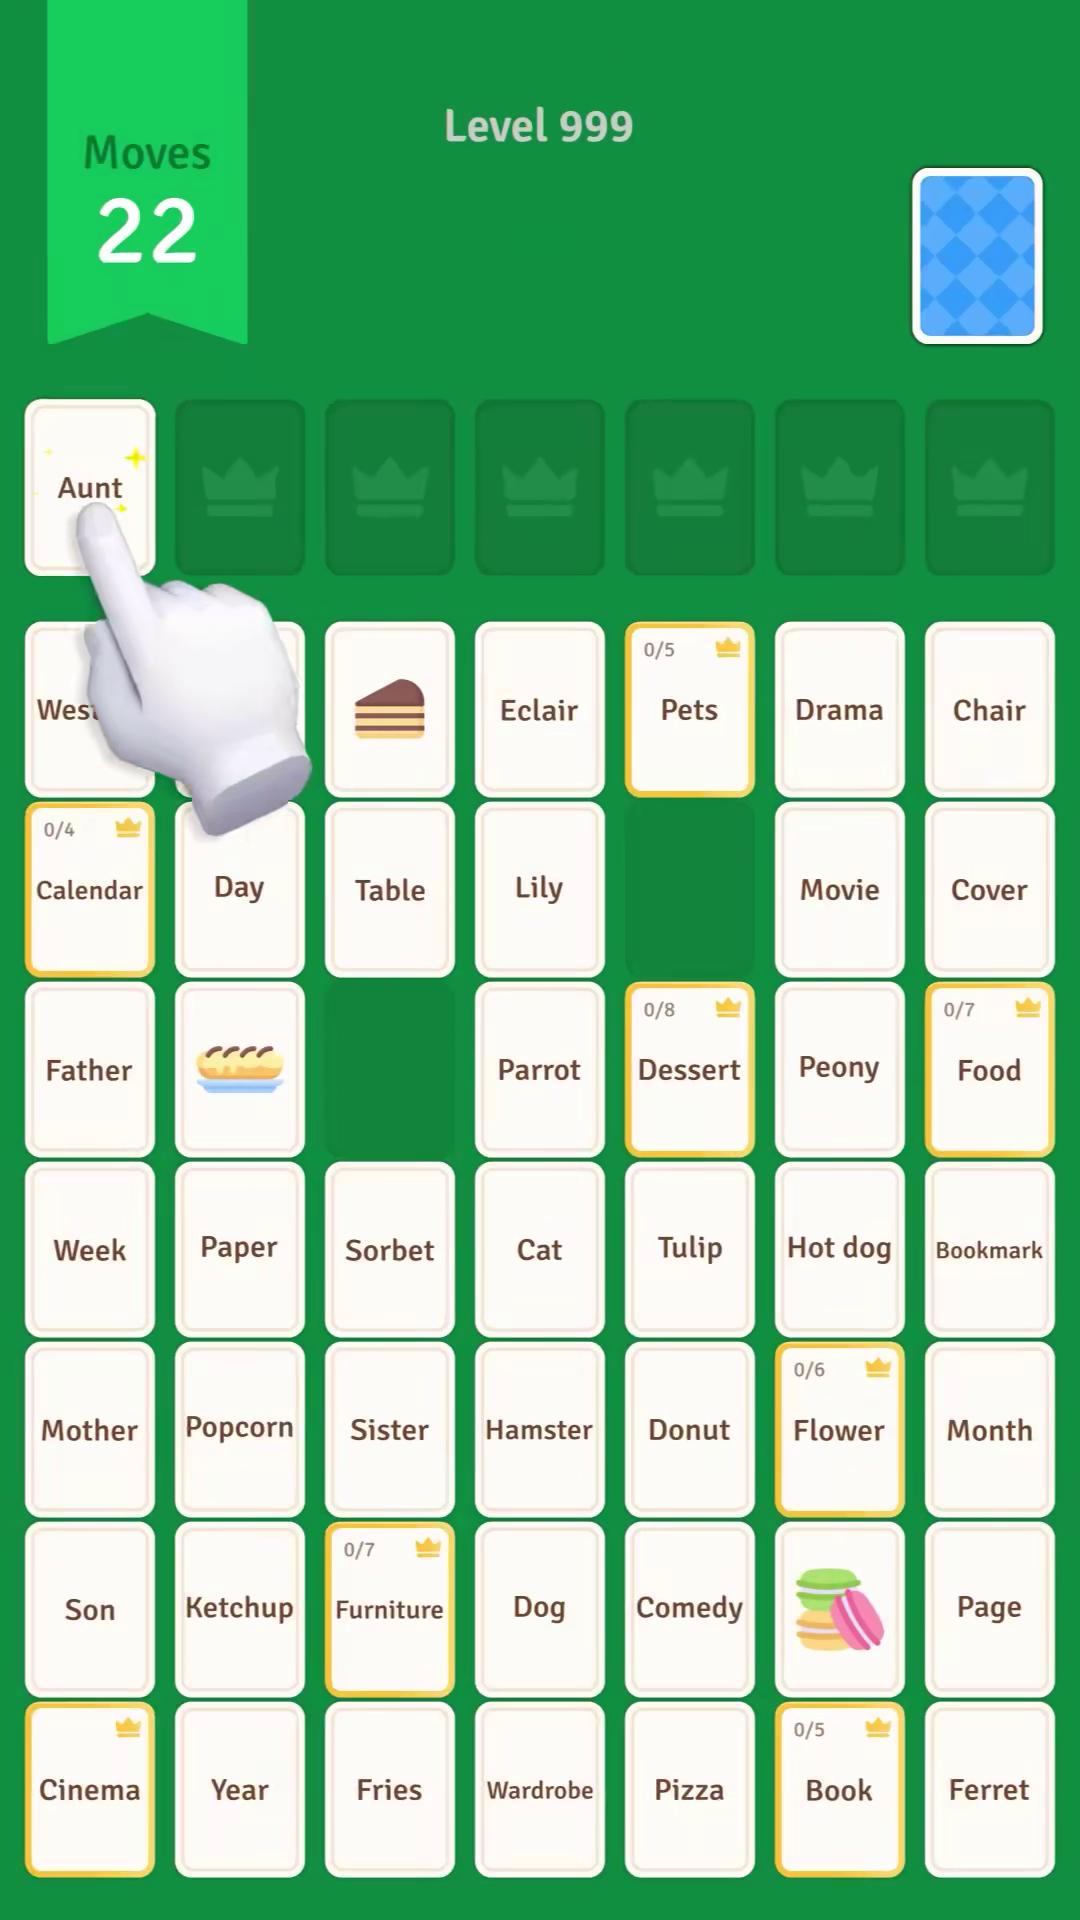 Creative #14 — 29 seconds, iOS, first seen 2026-06-13 and live 67 days. 1,171,117 impressions across 10,639 placements at 110.1 per placement, the second-highest rate in the top fifteen and the only 29-second asset in the account.
Runtime: 59 seconds and nothing else, basically
Twenty-eight of the thirty-three videos in the sample run 59 seconds. The other five run 15, 29, 55, 60 and 119 seconds — one creative each.
| Duration | Creatives | Share of videos | Impressions | Share of video impressions |
|---|---|---|---|---|
| 59s | 28 | 84.8% | 55,519,383 | 95.1% |
| 119s | 1 | 3.0% | 302,767 | 0.5% |
| 29s | 1 | 3.0% | 1,171,117 | 2.0% |
| 55s | 1 | 3.0% | 574,476 | 1.0% |
| 15s | 1 | 3.0% | 430,028 | 0.7% |
| 60s | 1 | 3.0% | 411,021 | 0.7% |
This is a single-runtime video operation with five experiments attached. The five non-59-second creatives collectively carry 4.9% of video impressions.
The experiments are informative in what they did not produce. The 15-second cut delivers at 108.8; the 119-second cut at 113.8; the 59-second modal runtime at 100.4. Across a 7.9x runtime range the spread is 13 percentage points, and the longest asset performs slightly above the average — which is exactly the outcome that gives a creative team no reason to change anything.
The 119-second creative is also the only asset in the entire 45-creative sample that had stopped running by the pull date. It was last observed 2026-08-18, one day before. Whether that is a genuine retirement after 31 days or a one-day gap in observation is not something a single pull can distinguish, and we flag it as ambiguous.
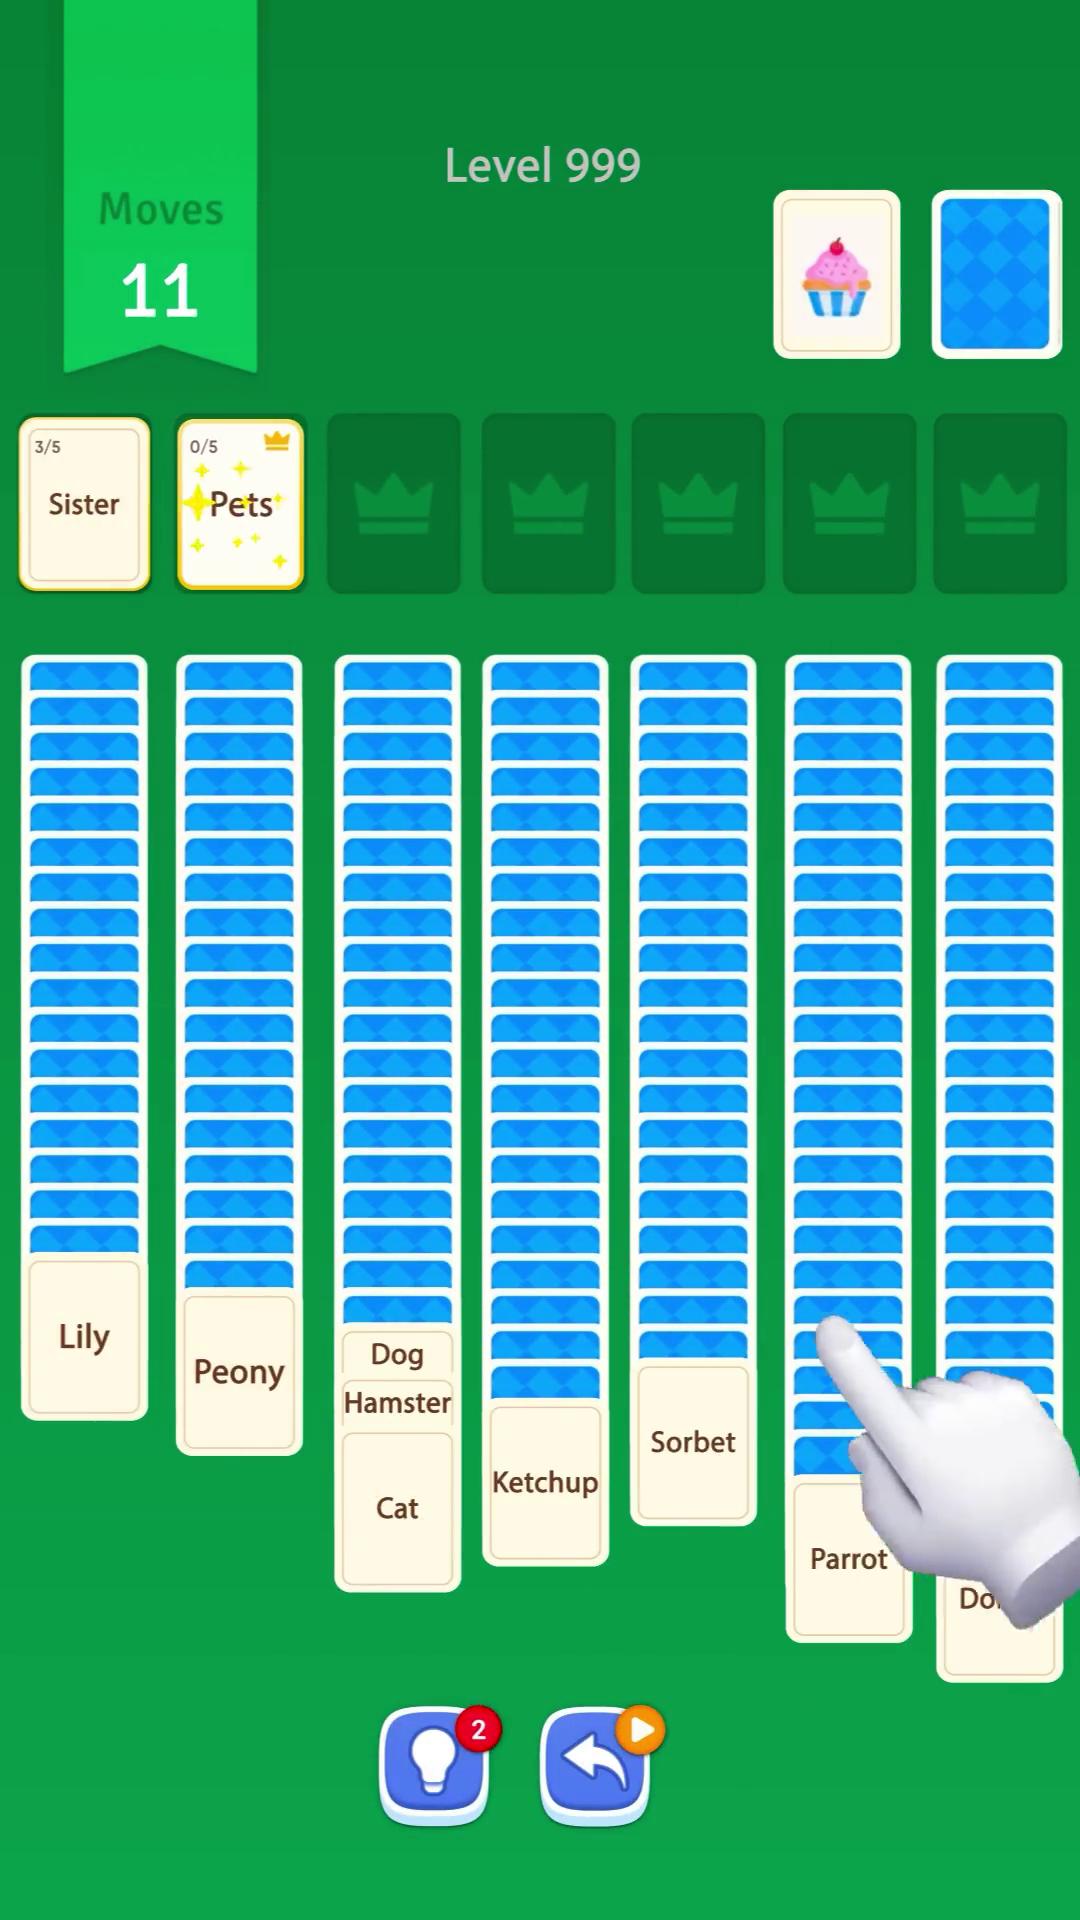 The 119-second creative — the longest asset in the account and the only one of forty-five not observed on the pull date. First seen 2026-07-19, last seen 2026-08-18. 302,767 impressions across 2,660 placements at 113.8 per placement, the third-highest rate in the sample despite being twice the length of the modal creative.
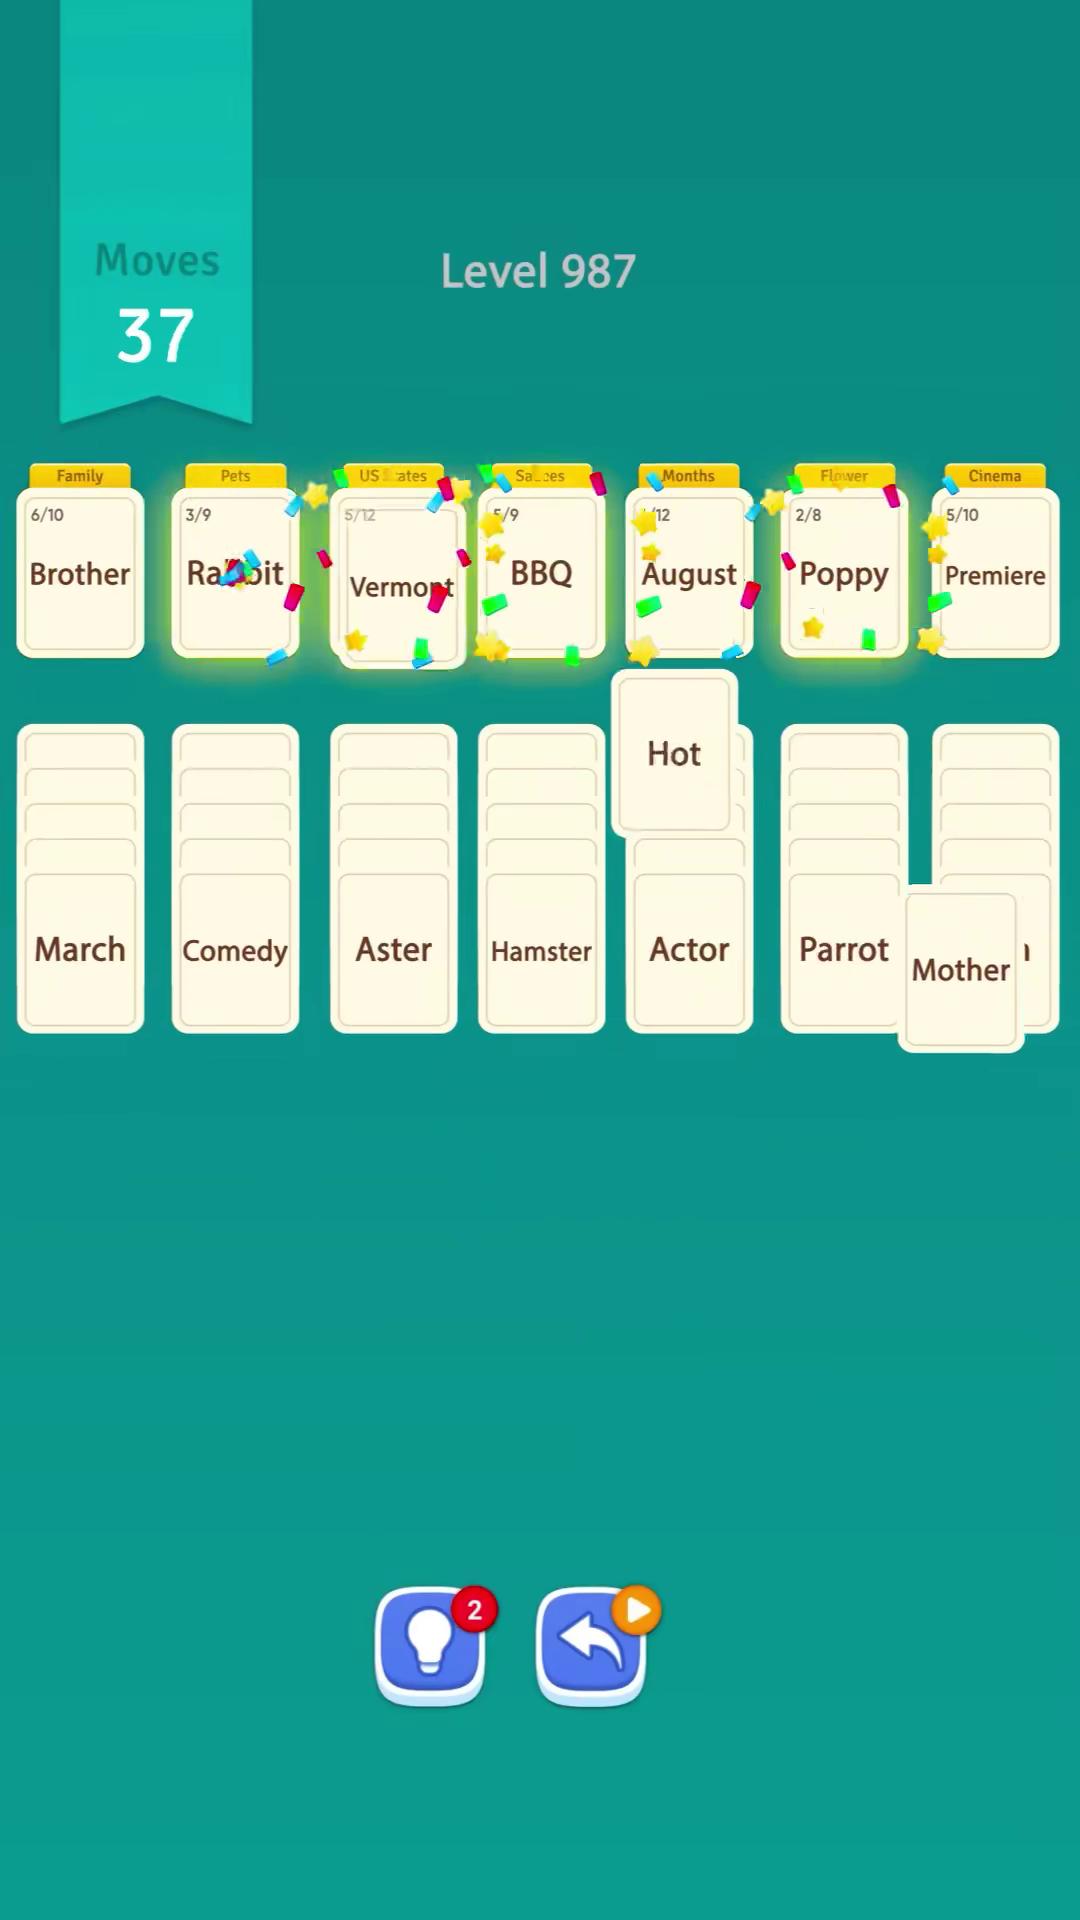 The 15-second cut — the shortest creative in the account, first seen 2026-05-09 and live 102 days. 430,028 impressions across 3,954 placements at 108.8 per placement. At one-eighth the runtime of the 119-second asset it delivers within 4.6% of the same rate.
Same-genre benchmark: four solitaire fleets
Comparing US fleets pulled the same day, top ten each:
| Fleet | Publisher | Impressions | Placements | Impr/placement | Top-1 share | Avg age | Live | Playable attach |
|---|---|---|---|---|---|---|---|---|
| Solitaire Cash | Papaya Gaming | 700,319,972 | 342,646 | 2,043.9 | 19.8% | 154d | 9/10 | 2/10 |
| Solitaire Associations Journey | Hitapps Games | 126,205,614 | 1,268,457 | 99.5 | 47.9% | 117d | 10/10 | 10/10 |
| Solitaire Grand Harvest | Supertreat | 21,416,542 | 35,094 | 610.3 | 19.3% | 156d | 10/10 | 1/10 |
| Solitaire Clash: Win Real Cash | Aviagames | 16,867,168 | 42,020 | 401.4 | 21.9% | 113d | 9/10 | 5/10 |
Two things jump out.
Placement count. Hitapps' top ten recorded 1,268,457 placements. The next-highest, Solitaire Cash, recorded 342,646 — 3.7x fewer. Grand Harvest recorded 35,094, or 36x fewer. Hitapps runs the broadest placement footprint in the solitaire set by a wide margin, and the low impressions-per-placement figure is the arithmetic consequence of that breadth, not a sign of weak delivery.
Concentration. At 47.9%, Hitapps' top-1 share is more than double every competitor's. The other three fleets sit at 19.3%, 19.8% and 21.9% — remarkably close to one another. Hitapps is the outlier: one asset carries nearly half its volume while its rivals spread evenly.
Note on resolution: the Solitaire Cash pull returned ten creatives spanning two product IDs (1446254576 and 6752648623) and three display names — Solitaire Bounty: Win Real Cash, PAPAYA Solitaire and Solitaire Cash™. Eight of the ten resolve to the unified Solitaire Cash product. We include the row with that caveat attached and would not build a precise claim on it. The Grand Harvest, Clash and Hitapps rows each resolve cleanly to a single unified product.
Production intensity across the wider set
Lifetime, global, all-time figures from unified product records:
| Product | Publisher | Unique materials | Lifetime impressions | Impressions per material | Spend index |
|---|---|---|---|---|---|
| Solitaire Grand Harvest | Supertreat | 9,120 | 20,454,429,991 | 2,242,810 | 81,462,616 |
| Solitaire Clash | Aviagames | 9,904 | 71,590,087,985 | 7,228,401 | 124,013,416 |
| Solitaire Associations Journey | Hitapps Games | 13,277 | 44,338,063,108 | 3,339,464 | 184,827,318 |
| Pixel Flow! | Loom Games | 16,562 | 213,359,297,665 | 12,882,460 | 228,925,990 |
| Solitaire Cash | Papaya Gaming | 25,638 | 195,664,457,157 | 7,631,814 | 168,493,663 |
| Block Blast! | Hungry Studio | 111,749 | 337,340,323,446 | 3,018,732 | 3,673,174,286 |
Within the solitaire set, Hitapps sits in the middle on library size (13,277 materials) and highest on the spend index (184,827,318) — above Solitaire Cash's 168,493,663 despite having roughly half the material count and a quarter of the lifetime impressions.
Its impressions-per-material figure of 3,339,464 is the lowest of the four solitaire titles, at 44% of Solitaire Clash's 7,228,401 and 46% of Solitaire Cash's 7,631,814. Hitapps produces a lot of creatives and gets comparatively little out of each.
That pairing — high spend index, low output per material — is consistent with everything else in this teardown. This is a volume operation: place a very large number of assets across a very large number of placements, accept ~100 impressions from each, and never turn anything off.
What transfers to your UA program
If you run creative production: the first thing to establish about any account is whether its delivery rate is a property of your creatives or of your inventory. Hitapps' is inventory. Format, platform, runtime and 205 days of age spread move impressions-per-placement by less than 6%. In an account like that, iterating on creative to improve delivery is spending money on a number that will not move — and the only meaningful test is the one that changes where the ad runs.
If you run media buying: find your outliers before you optimise your average. Six of Hitapps' forty-five creatives sit outside the 80–120 band, and two of them land on the identical value of 24.3 while their same-day, same-runtime, same-package siblings hit 108.5–108.9. Those two are worth more analyst hours than the thirty-nine well-behaved ones combined, because they are the only evidence in the account that a different placement class exists.
If you run competitive intelligence: the name check here is a two-parter and most tools do one of them. The chart title is Solitaire Associations Journey; the iOS creative records display Word Solitaire: Associations; the Android records display the chart title. Resolve through the unified product record and collect both constituent product IDs, or you will attribute three-quarters of this fleet to the wrong game.
If you compete in solitaire or word puzzle: Hitapps' distinguishing move is playable attachment at 88.9%, against 10% for Grand Harvest and 20% for Solitaire Cash. That is the widest strategic gap in the category. Whether it is working is not answerable from impression data — it does not change delivery rate — but it is a deliberate, expensive and near-universal choice by the one publisher in the set running the broadest placement footprint.
If you are benchmarking against this fleet: use the placement count, not the per-placement rate. 1,268,457 top-ten placements is the number that describes what Hitapps is doing. The 99.5 impressions-per-placement figure describes the inventory it bought.
A falsifiable prediction
Prediction: at the next pull, at least 90% of Solitaire Associations Journey's top fifteen US creatives will still be live, and no creative in the top fifteen will record a delivery rate outside 70–130 impressions per placement. Separately, creative #1 will still be the largest asset in the fleet by window impressions at the next pull, and no new Android creative will appear on com.hitappsgames.wordsolitaire before 2026-10-01.
The basis: on liveness, 44 of 45 creatives were live on the pull date and the fleet's oldest asset has run 230 days without retirement — this publisher does not turn things off. On the delivery band, 39 of 45 sampled creatives sit inside 80–120 and all fifteen top creatives inside 82.5–110.2; the 70–130 band allows generous room and would only break if the inventory mix changed. On creative #1, it leads the fleet by 2.4x on window impressions and has held the top position across a full window while every other asset was equally exposed; displacing it requires a new asset to out-deliver it outright, which nothing in the current fleet is close to doing. On Android, all ten Android creatives launched inside a sixteen-day window in April and nothing has shipped on that package in the 120 days since.
The informative failure is the Android clause. If a new Android creative appears, it means Hitapps has reopened a channel it has left dormant for four months, and given that the Android side is 25.1% of measured impressions on 22.2% of the creative count, reopening it would be a material change in the account's shape.
How to reproduce this teardown
- Resolve through the unified product record and check the display name on the creatives. Here the chart name appears on the Android build and a different store title on the iOS build. Name-matching misattributes 74.9% of the fleet.
- Compute impressions-per-placement separately for each format, each platform and each runtime before you report a fleet average. In most accounts these diverge sharply. In this one they do not, and that non-divergence is the finding — but you only see it if you cut the data first.
- Sort the per-placement column and look at the tails, not the middle. Six of forty-five creatives sit outside the main band, and two of those land on an identical value. Fleet averages hide that completely.
- Cross-tabulate launch date with platform. The Android build's entire history is one sixteen-day window in April. Sorting by impressions alone puts two Android creatives at ranks #2 and #3 and gives no hint that the rest of that platform's fleet is four months old and frozen.
- Count playable attachment on videos, not just standalone playables. Twelve creatives here are pure playables; twenty-eight more are videos with a playable attached. Counting only the former reports 26.7% interactive when the real figure is 88.9%.
- Check every last-observed date and treat a one-day gap as ambiguous. The only non-live creative here was last seen 2026-08-18. That may be a retirement or an observation gap, and a single pull cannot tell you which.
Methodology and data notes
- Measurement window (read this first): creative-level
impressionandshowCntfrom this API are window metrics, not lifetime totals. With no explicit date parameters the endpoint returns a rolling 30-day window; for this pull that window is 2026-07-20 to 2026-08-19 (30.6 days), verified by reproducing the default response exactly withstart_date=2026-07-20&end_date=2026-08-19and by confirming that no adjacent start date reproduces it. Every creative-level impression and placement figure in this article is a within-window total. Requesting a different window returns different values, and those values are not consistent across windows — we observed cases where a 7-day window reports a higher figure than a 30-day window covering it — so these numbers should be compared only against other figures from the same window. All fifteen top creatives here were live for the entire window, which is why cross-creative comparisons in this article need no age adjustment. By contrast,globalFirstTime/globalLastTimeare true lifetime dates, and the unified-productimpression,showCostandmaterialUvCntfields are window-invariant lifetime totals, verified against four different window settings. - Source: AdMapix creative search, unified product search and download/revenue ranking APIs, all queried 2026-08-19, country filter
US, creatives sorted by impressions descending. - Primary sample: the top 15 US creatives by impressions for unified product Solitaire Associations Journey, ID
6748950306, publisher Hitapps Games LTD, AdMapix company ID1049188906. - Extended sample: format splits, platform splits, runtime distribution, playable attachment, launch cadence and outlier analysis use the top 45 US creative records by impressions (three pages of fifteen). The API reports 7,000 total US creative records for this keyword.
- Identity resolution: 35 of 45 creatives resolve to product ID
6748950306(AdMapix company1049188906, publisher string "Hitapps Games LTD") and display the store title Word Solitaire: Associations. Ten resolve tocom.hitappsgames.wordsolitaire(AdMapix company1253203597, publisher string "Hitapps Games") and display the chart title Solitaire Associations Journey. Both product IDs are listed in the unified product record. No same-name competing product entered the sample. - "Days since first seen" is the span between first-observed and the pull date, and is a lifetime quantity — it is not the denominator for the window impressions in the same table. "Days live in window" is the overlap between a creative's observed life and the 2026-07-20 → 2026-08-19 window; it is 30.6 for all fifteen top creatives. "Live" means a last-observed timestamp of 2026-08-19; 15 of 15 top creatives and 44 of 45 in the extended sample qualify. The single exception was last observed 2026-08-18 and is treated as ambiguous rather than confirmed-retired.
- "Placements" (
showCnt) counts recorded creative appearances, not unique users and not unique publishers. Impressions per placement is a distribution-shape indicator, not a frequency metric. - "Format" is derived from recorded video duration: creatives with no duration are classified as pure playable units. "Playable attached" counts creatives carrying a playable URL, which includes both pure playables and videos with an interactive end card. Several playable URLs are shared across multiple creative records.
- The two creatives delivering at 24.3 were verified as distinct records with distinct impression and placement counts (633,385 / 26,103 and 532,152 / 21,877). The identical rate is a genuine coincidence of ratio, not a duplicated record.
- Comparison fleets — Solitaire Grand Harvest (Supertreat,
1223338261), Solitaire Clash: Win Real Cash (Aviagames,1589643727) and Solitaire Cash (Papaya Gaming,1446254576) — were pulled the same day on a top-ten basis. The Solitaire Cash pull spans two product IDs and three display names; eight of ten resolve to the unified Solitaire Cash product, and that row should be treated as approximate. The other comparison rows resolve cleanly. - Cross-format impression comparison carries measurement risk: a playable unit and a 59-second video are not the same object and may not be counted equivalently. In this fleet the two families happen to deliver at nearly identical rates, which is the article's central finding, but that finding is about the observed rates, not a claim that the underlying measurement is format-neutral.
- "Unique materials" (
materialUvCnt) and lifetime impressions come from unified product records and are global, all-time figures — not US-only, not period-limited. - The spend index (
showCost) is a modelled figure with an undisclosed unit, used ordinally for relative comparison only. - Impressions are third-party modelled estimates, not publisher-reported figures and not spend.
- Download and revenue figures are US-region estimates for the current ranking period. Solitaire Associations Journey appeared at download position 151 and did not appear in the revenue top 200.
- Store listings: App Store and Google Play.
- Coverage is limited to creatives observable through third-party ad monitoring.
Frequently Asked Questions
How many ads is Solitaire Associations Journey running in the US? AdMapix records 7,000 US creatives for Solitaire Associations Journey. The top fifteen by impressions carry 132,950,973 impressions across 1,334,049 placements in the 30 days to 2026-08-19, and all fifteen were live on that date. Across a wider 45-creative sample, 44 were still live — the highest persistence rate measured in this teardown series.
What is Solitaire Associations Journey's best-performing ad creative? A playable unit first seen 2026-06-17 on the iOS build, carrying 60,424,325 impressions across 627,405 placements in the 30 days to 2026-08-19 — 45.4% of the top-fifteen fleet, and 2.4x the next-largest asset. Every creative in this fleet was live for the whole measurement window, so that comparison needs no age adjustment.
Does Solitaire Associations Journey use playable ads? Extensively. Forty of forty-five sampled creatives carry a playable URL — twelve as standalone interactive units and twenty-eight as end cards attached to videos, giving an 88.9% interactive attachment rate. That is the highest in the solitaire comparison set, where Solitaire Clash sits at 5 of 10, Solitaire Cash at 2 of 10 and Solitaire Grand Harvest at 1 of 10.
Why do all of Solitaire Associations Journey's ads deliver at the same rate? Pure playables deliver at 95.0 impressions per placement and videos at 99.9; iOS delivers at 96.7 and Android at 97.6; runtimes from 15 to 119 seconds deliver between 94.1 and 113.8. When a rate is invariant to format, platform, runtime and a 205-day age spread, it is describing the inventory being bought rather than the creative being served. In practical terms, creative iteration in this account is not buying delivery variance.
Why do searches for Solitaire Associations Journey return creatives for Word Solitaire: Associations?
Because the iOS build, app ID 6748950306, carries the store title Word Solitaire: Associations, while the Android package com.hitappsgames.wordsolitaire carries the chart title Solitaire Associations Journey. Both are listed as constituent product IDs under the same AdMapix unified product record. Matching creatives to products by app name would misattribute 35 of 45 creatives — 74.9% of measured impressions.
How does Solitaire Associations Journey compare to Solitaire Cash and Solitaire Grand Harvest? On placement footprint it is far larger: 1,268,457 top-ten placements against Solitaire Cash's 342,646 and Solitaire Grand Harvest's 35,094. On impressions it sits in the middle at 126,205,614, behind Solitaire Cash's 700,319,972 and ahead of Grand Harvest's 21,416,542. It is the most concentrated fleet in the set, with 47.9% of volume in one asset against roughly 20% for the other three, and by far the most playable-heavy.
Is Solitaire Associations Journey's advertising working? Its downloads are down 17.41% period-over-period despite a fleet at full strength — 44 of 45 creatives live, a June cohort producing 70.0% of current daily impressions, and ten new creatives shipped in July. It also does not appear in the US revenue top 200. Impression data cannot measure install quality or return on spend, so this observation establishes that ad volume and download growth have decoupled here, not that the creative is at fault.
Want to know whether your delivery rate is a property of your creative or of your inventory? Per-creative impressions, placement counts, exact runtimes, first-seen and last-seen dates and playable attachment are all live in AdMapix, filterable by country, publisher and product ID — with unified product resolution across iOS and Android, so a fleet advertising under a different store title never goes missing. Create a free account to run this teardown on any title in your category, or see plans for full historical access.
Data source: AdMapix third-party ad intelligence estimates, United States, retrieved 2026-08-19. Impression, download and spend-index figures are modelled estimates for comparative analysis and are not publisher-reported. Figures change as new creatives enter rotation.
Related Reading
- Ad strategy teardowns (series index) — every teardown in the series, in publication order
- Mobile game ads guide: formats, examples and research — the format matrix, research workflow and KPI guardrails every teardown in this series applies
- Jewel Coloring — A creative-level teardown of Ta Ta Game Technology's US user acquisition for Jewel Coloring
- Arrows – Puzzle Escape — A creative-level teardown of Lessmore GmbH's US user acquisition for Arrows – Puzzle Escape duri…
- 82-0.com — Vaulty Studios' 82-0
Turn these observations into your next creative study
Open the creative library and select samples for your market, network and research question.
Related Articles
Block Craft 3D Ad Strategy 2026: 168 Videos, 96 Playables, 850 Combinations — and the Biggest Ad in the Name-Space Belongs to Somebody Else
A teardown of Wildlife Studios' Block Craft 3D: Building Games in the US. 850 measured ad instances carry 117 million impressions from only 168 distinct videos and 96 distinct playables — one video is paired with 67 different playable end cards. Meanwhile a different publisher with a near-identical app name runs the single largest creative in the category, 1.8x bigger than Wildlife's best.
MONOPOLY GO! Prediction Check: The Successor Fleet Arrived on Schedule — and the June 18 Cohort Refuses to Die
On August 7 we published a falsifiable prediction about MONOPOLY GO!'s creative rotation: the June 18 cohort would reset by early September, with a successor batch surfacing first. Checked against live AdMapix data, half landed early — three successor waves, then a 100-file August flood with new 59-94s durations — and half is breaking the model: the June 18 creatives are past the 60-67 day ceiling that killed every previous generation, and still running.
Mahjong Blast Ad Strategy 2026: 92.7% Playable, 87.3% From One 16-Day Sprint, and the Opposite of Vita Mahjong
A creative-level teardown of Nebula Studio's US user acquisition for Mahjong Blast. Fifteen creatives account for 95,864,787 impressions, all fifteen still live, and 87.3% of that volume comes from seven assets launched inside a 16-day window in summer 2026. Playables carry 92.7% of impressions, and every one of the six videos delivers at between 14.6 and 15.0 impressions per placement — a hard floor no other fleet we have measured exhibits.