
Mahjong Blast Ad Strategy 2026: 92.7% Playable, 87.3% From One 16-Day Sprint, and the Opposite of Vita Mahjong
A creative-level teardown of Nebula Studio's US user acquisition for Mahjong Blast. Fifteen creatives account for 95,864,787 impressions, all fifteen still live, and 87.3% of that volume comes from seven assets launched inside a 16-day window in summer 2026. Playables carry 92.7% of impressions, and every one of the six videos delivers at between 14.6 and 15.0 impressions per placement — a hard floor no other fleet we have measured exhibits.
Nebula Studio's Mahjong Blast runs the most format-lopsided ad fleet we have measured. Playables carry 92.7% of its 95,864,787 US impressions. Six video creatives carry the other 7.3% — and all six of them deliver at between 14.6 and 15.0 impressions per placement, a floor so tight that a 29-second cut and a 119-second cut are separated by 2%.
All fifteen creatives were live on 2026-08-19. Seven of them entered the fleet inside a 16-day window between 2026-06-19 and 2026-07-04, and those seven carry 87.3% of the fleet's impressions in the 30 days to that date. US downloads are up 13.77%.
This site has already torn down Vita Mahjong, the largest mahjong advertiser in the US. Mahjong Blast is its structural opposite in almost every dimension — and it is the one that is growing.
Executive summary (TL;DR)
- Nine playables, six videos, and the playables are the account. Interactive units carry 88,857,333 impressions (92.7%). Videos carry 7,007,454.
- Every video is pinned to the same rate. The six videos deliver at 14.8, 14.6, 14.6, 14.6, 14.9 and 15.0 impressions per placement — a 1.027x spread across runtimes from 29 to 119 seconds.
- Playables are wildly heterogeneous. The nine interactive units range from 24.2 to 272.3 impressions per placement — an 11.25x spread inside a single format.
- Almost everything is from one sprint. Seven creatives launched 2026-06-19 to 2026-07-04. They hold 87.3% of the fleet's 30-day impressions, averaging 12.0 million each against 0.8 million for the eight that preceded them.
- One asset is 59% of the fleet. Creative #1, a playable first seen 2026-06-25, holds 56,551,902 impressions in 55 days.
- The placement leader is not the impression leader. Creative #2 recorded 663,038 placements — 38.2% of all fleet placements, nearly double creative #1's — but delivered 3.1x fewer impressions.
- A 119-second video exists. Creative #13 is twice as long as anything else in this teardown series. It delivers at 14.9 impressions per placement, statistically identical to the 29-second cut.
- The name is a trap. Searching "Mahjong Blast" returns creatives whose store title is Mahjong Wonders™. They are the correct ones — verified through the unified product record, not the name.
All figures are AdMapix third-party estimates for the United States, pulled 2026-08-19. Comparative Vita Mahjong figures are cited from that title's teardown, pulled the same date. Methodology and identity resolution at the end.
Which Mahjong Blast this is — and why the app name lies
This is the hardest identity resolution in the batch, and it is worth walking through, because a name-based lookup gives you a completely wrong answer.
A product search for "Mahjong Blast" returns four unrelated products:
| Product | Unified product ID | Publisher | Lifetime creatives | Lifetime impressions |
|---|---|---|---|---|
| Mahjong Blast | 6747492600 | Nebula Studio | 41,370 | 50,148,648,448 |
| Mahjong Blast : Tile Match | com.tilemahjong.blast.gameplay | Mr. Glass | 295 | 19,183,533 |
| Lucky Mahjong Blast! | com.lucky.mahjong2 | DongYing SmartEnergy | 42 | 37,384,651 |
| Z188Lantern Mahjong Blast | com.a1tanz.vzdol.gtdodcrg | IBEAS | — | — |
The first row is the title on the US download chart at position 148. Its unified product record lists four constituent product IDs:
com.nebula.mahjongtile · 6747492600 · com.yichao.mahjong · com.yundas.majiong.samsung
Here is the trap. All fifteen of the top US creatives resolve to com.nebula.mahjongtile — and the app name attached to those creative records is not "Mahjong Blast". It is "Mahjong Wonders™", under AdMapix company ID 401431784, with the publisher string "Nebula Studio" (two spaces).
If you were matching creatives to products by name, you would conclude that Mahjong Blast runs no US advertising at all, and that some unrelated game called Mahjong Wonders runs a lot. Both conclusions are wrong. The Android build carries a different store title from the iOS build, and the unified product record is the only thing that connects them.
The same publisher's other titles confirm the pattern: company 506904674 (Nebula Studio, iOS) holds MathCross Master! at 6752387377, GOGO! Blast at 6776522053 and No Wifi Games at 6741705881; company 401431784 holds the Android packages com.nebula.crossmath, com.nebula.nutsort and com.nebula.mahjongtile. Two AdMapix company records, one publisher, split by platform.
Everything in this teardown is locked to unified product 6747492600, Nebula Studio, company 506904674, and to creatives resolving to its constituent package com.nebula.mahjongtile. Store listings: App Store and Google Play.
Where Mahjong Blast sits on the US chart
| Metric | Value |
|---|---|
| US download rank | 148 |
| Downloads (current period) | 616,774 |
| Period-over-period change | +13.77% |
| Publisher | Nebula Studio |
| iOS app ID | 6747492600 |
| AdMapix company ID | 506904674 |
That +13.77% is the strongest growth of any title in this batch. It is also, as the rest of this article shows, being produced by an ad fleet less than one percent the measured size of the market leader's.
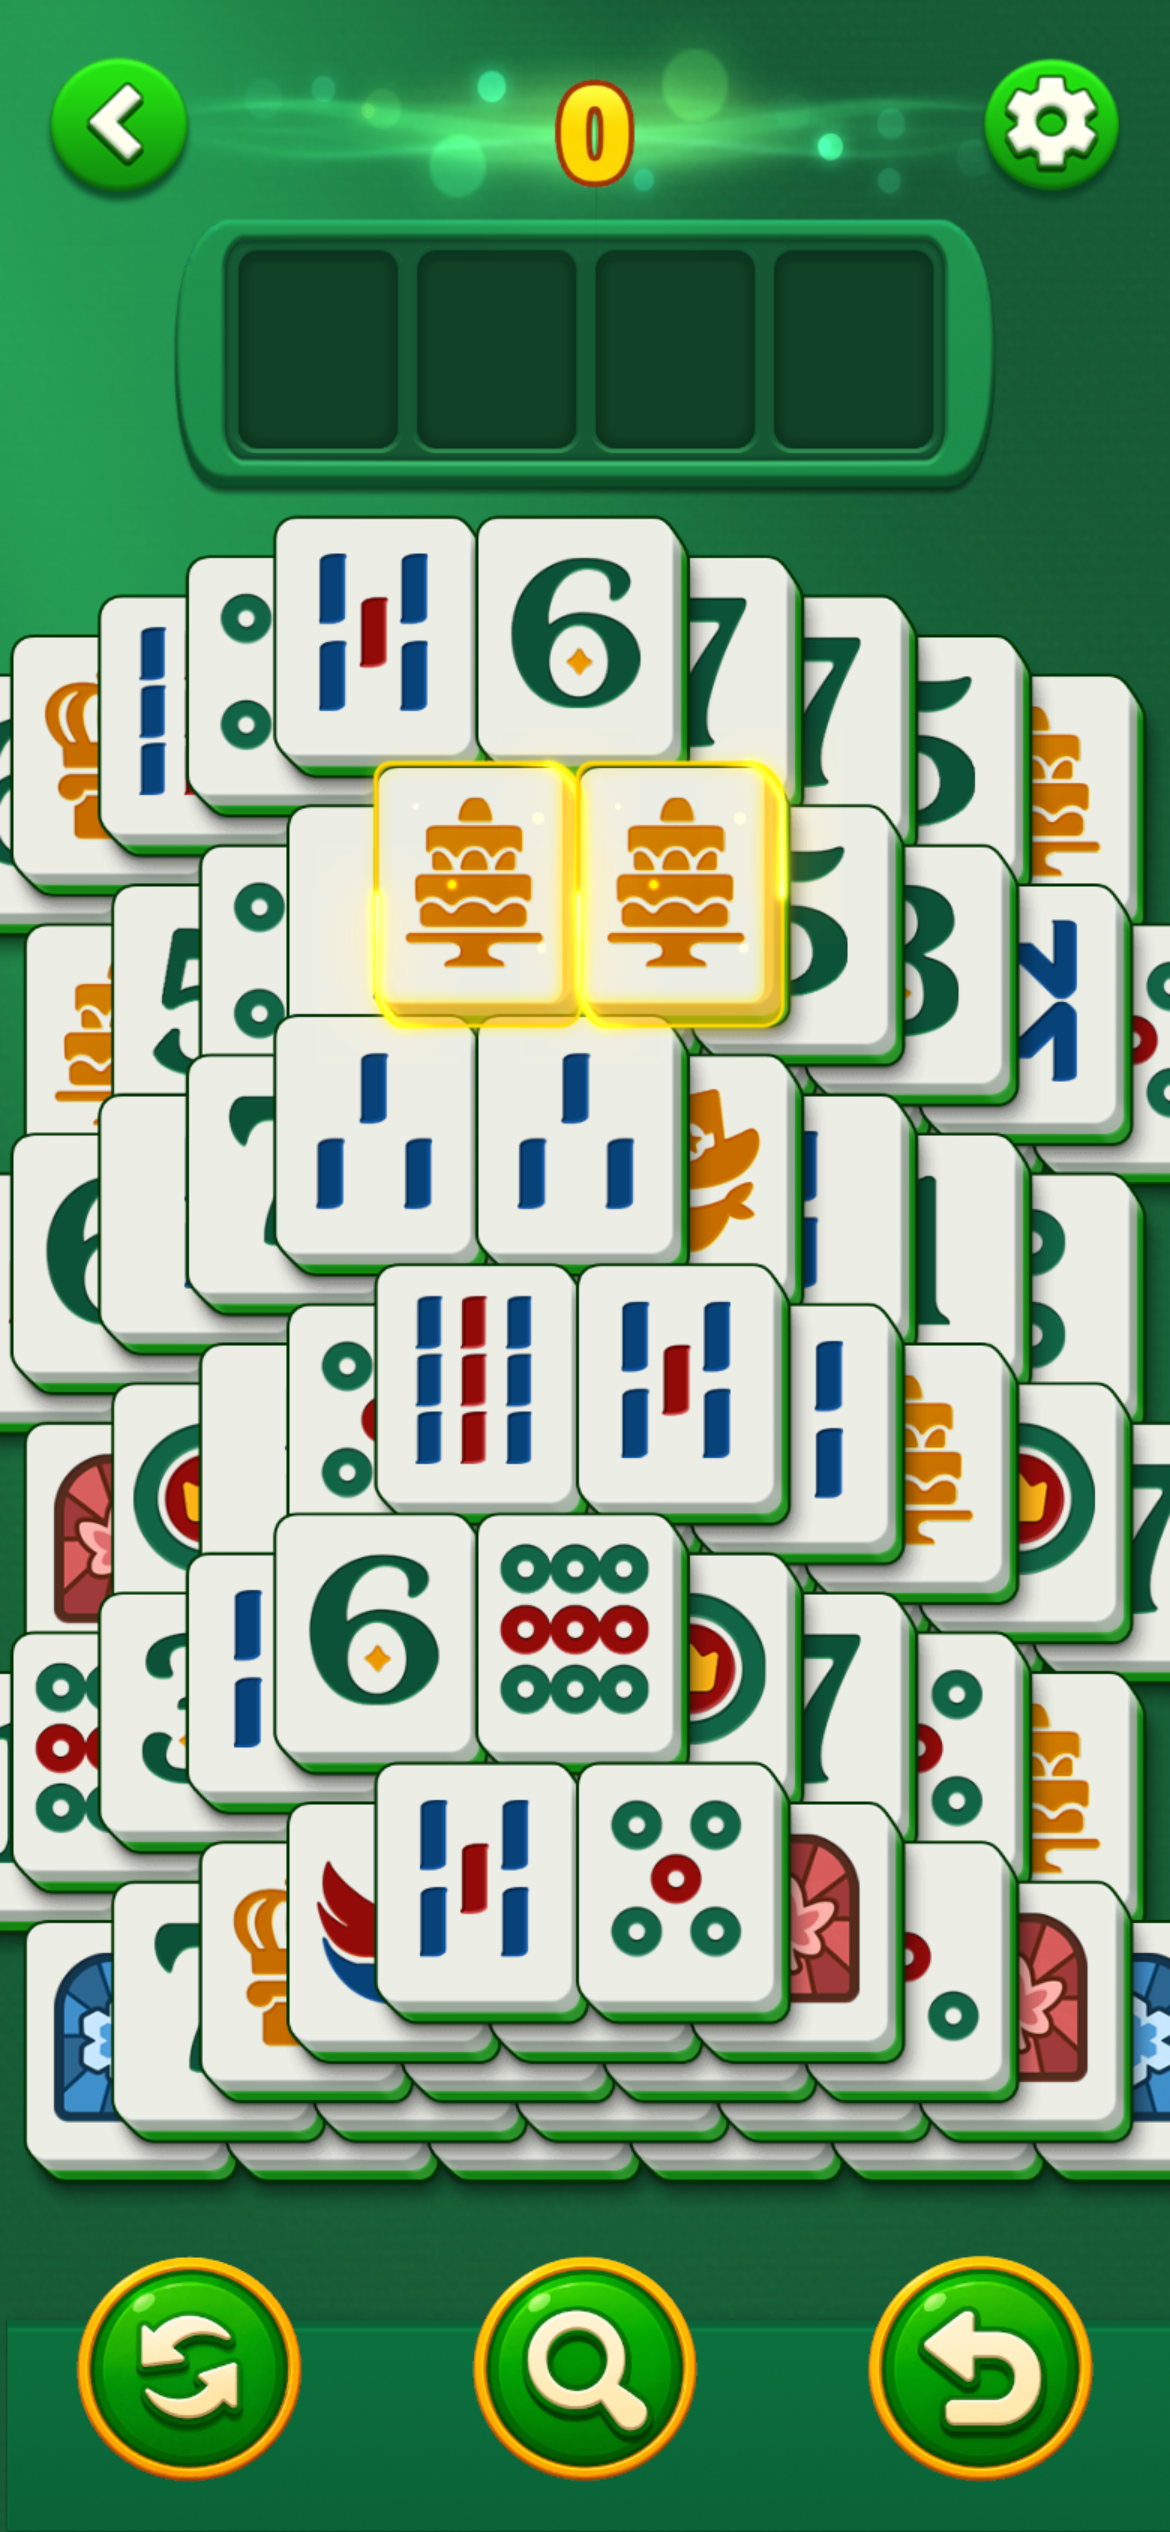 Creative #1 — a playable unit first seen 2026-06-25, live 55 days. 56,551,902 impressions across 339,688 placements at 166.5 per placement in the 30 days to 2026-08-19. It alone is 59.0% of the fleet.
The fleet at a glance: fifteen creatives, fifteen live
| # | Impressions | Share | Placements | Impr/placement | First seen | Days live | Format |
|---|---|---|---|---|---|---|---|
| 1 | 56,551,902 | 59.0% | 339,688 | 166.5 | 2026-06-25 | 55 | playable |
| 2 | 18,030,728 | 18.8% | 663,038 | 27.2 | 2026-06-19 | 61 | playable |
| 3 | 3,133,161 | 3.3% | 56,050 | 55.9 | 2026-07-01 | 49 | playable |
| 4 | 2,803,570 | 2.9% | 70,285 | 39.9 | 2026-07-04 | 46 | playable |
| 5 | 2,329,381 | 2.4% | 13,153 | 177.1 | 2025-10-24 | 299 | playable |
| 6 | 2,182,410 | 2.3% | 8,015 | 272.3 | 2025-10-18 | 305 | playable |
| 7 | 1,876,832 | 2.0% | 126,963 | 14.8 | 2026-06-20 | 60 | 59s |
| 8 | 1,872,120 | 2.0% | 33,546 | 55.8 | 2026-03-27 | 145 | playable |
| 9 | 1,322,518 | 1.4% | 90,504 | 14.6 | 2026-04-07 | 134 | 29s |
| 10 | 1,281,396 | 1.3% | 52,856 | 24.2 | 2025-11-05 | 287 | playable |
| 11 | 1,241,208 | 1.3% | 84,901 | 14.6 | 2026-04-07 | 134 | 59s |
| 12 | 1,090,262 | 1.1% | 74,458 | 14.6 | 2026-04-30 | 111 | 59s |
| 13 | 823,239 | 0.9% | 55,075 | 14.9 | 2026-04-07 | 134 | 119s |
| 14 | 672,665 | 0.7% | 25,410 | 26.5 | 2026-06-19 | 61 | playable |
| 15 | 653,395 | 0.7% | 43,512 | 15.0 | 2026-07-03 | 47 | 59s |
| Total | 95,864,787 | 100% | 1,737,454 | 55.2 | — | 128.5 avg | — |
The impressions-per-placement column has a 18.65x spread, from 14.6 to 272.3. That is by far the widest band in any fleet measured in this series — Vita Mahjong's equivalent range is 967 to 1,117, a 1.15x spread.
But the variance is not random. Read the column alongside the format column and it separates into two completely distinct populations.
The two populations
| Family | Creatives | Impressions | Share | Placements | Impr/placement | Range |
|---|---|---|---|---|---|---|
| Playable | 9 | 88,857,333 | 92.7% | 1,262,041 | 70.4 | 24.2 – 272.3 (11.25x) |
| Video | 6 | 7,007,454 | 7.3% | 475,413 | 14.7 | 14.6 – 15.0 (1.027x) |
The six videos are the striking half. Their individual rates are 14.6, 14.6, 14.6, 14.8, 14.9 and 15.0. That is a 2.7% total spread across assets that differ by:
- 4.1x in runtime — 29 seconds to 119 seconds
- 2.9x in total impressions — 653,395 to 1,876,832
- 87 days in launch date — 2026-04-07 to 2026-07-03
None of that moves the number. Whatever inventory Nebula's video creatives are being placed into, it returns almost exactly 14.7 impressions per recorded appearance regardless of what the video is or how long it runs.
The nine playables behave nothing like that. Creative #6 delivers at 272.3; creative #10 delivers at 24.2. Same format, same publisher, an 11.25x difference.
The practical read: in this account, format determines whether an asset has variance at all. Video is a fixed-yield channel — you can predict what a new video will do before you ship it, and the prediction is "14.7". Playables are where the outcomes live, and they range across an order of magnitude.
That is why 92.7% of the impressions are interactive. It is not a creative preference. It is the only place in this account where upside exists.
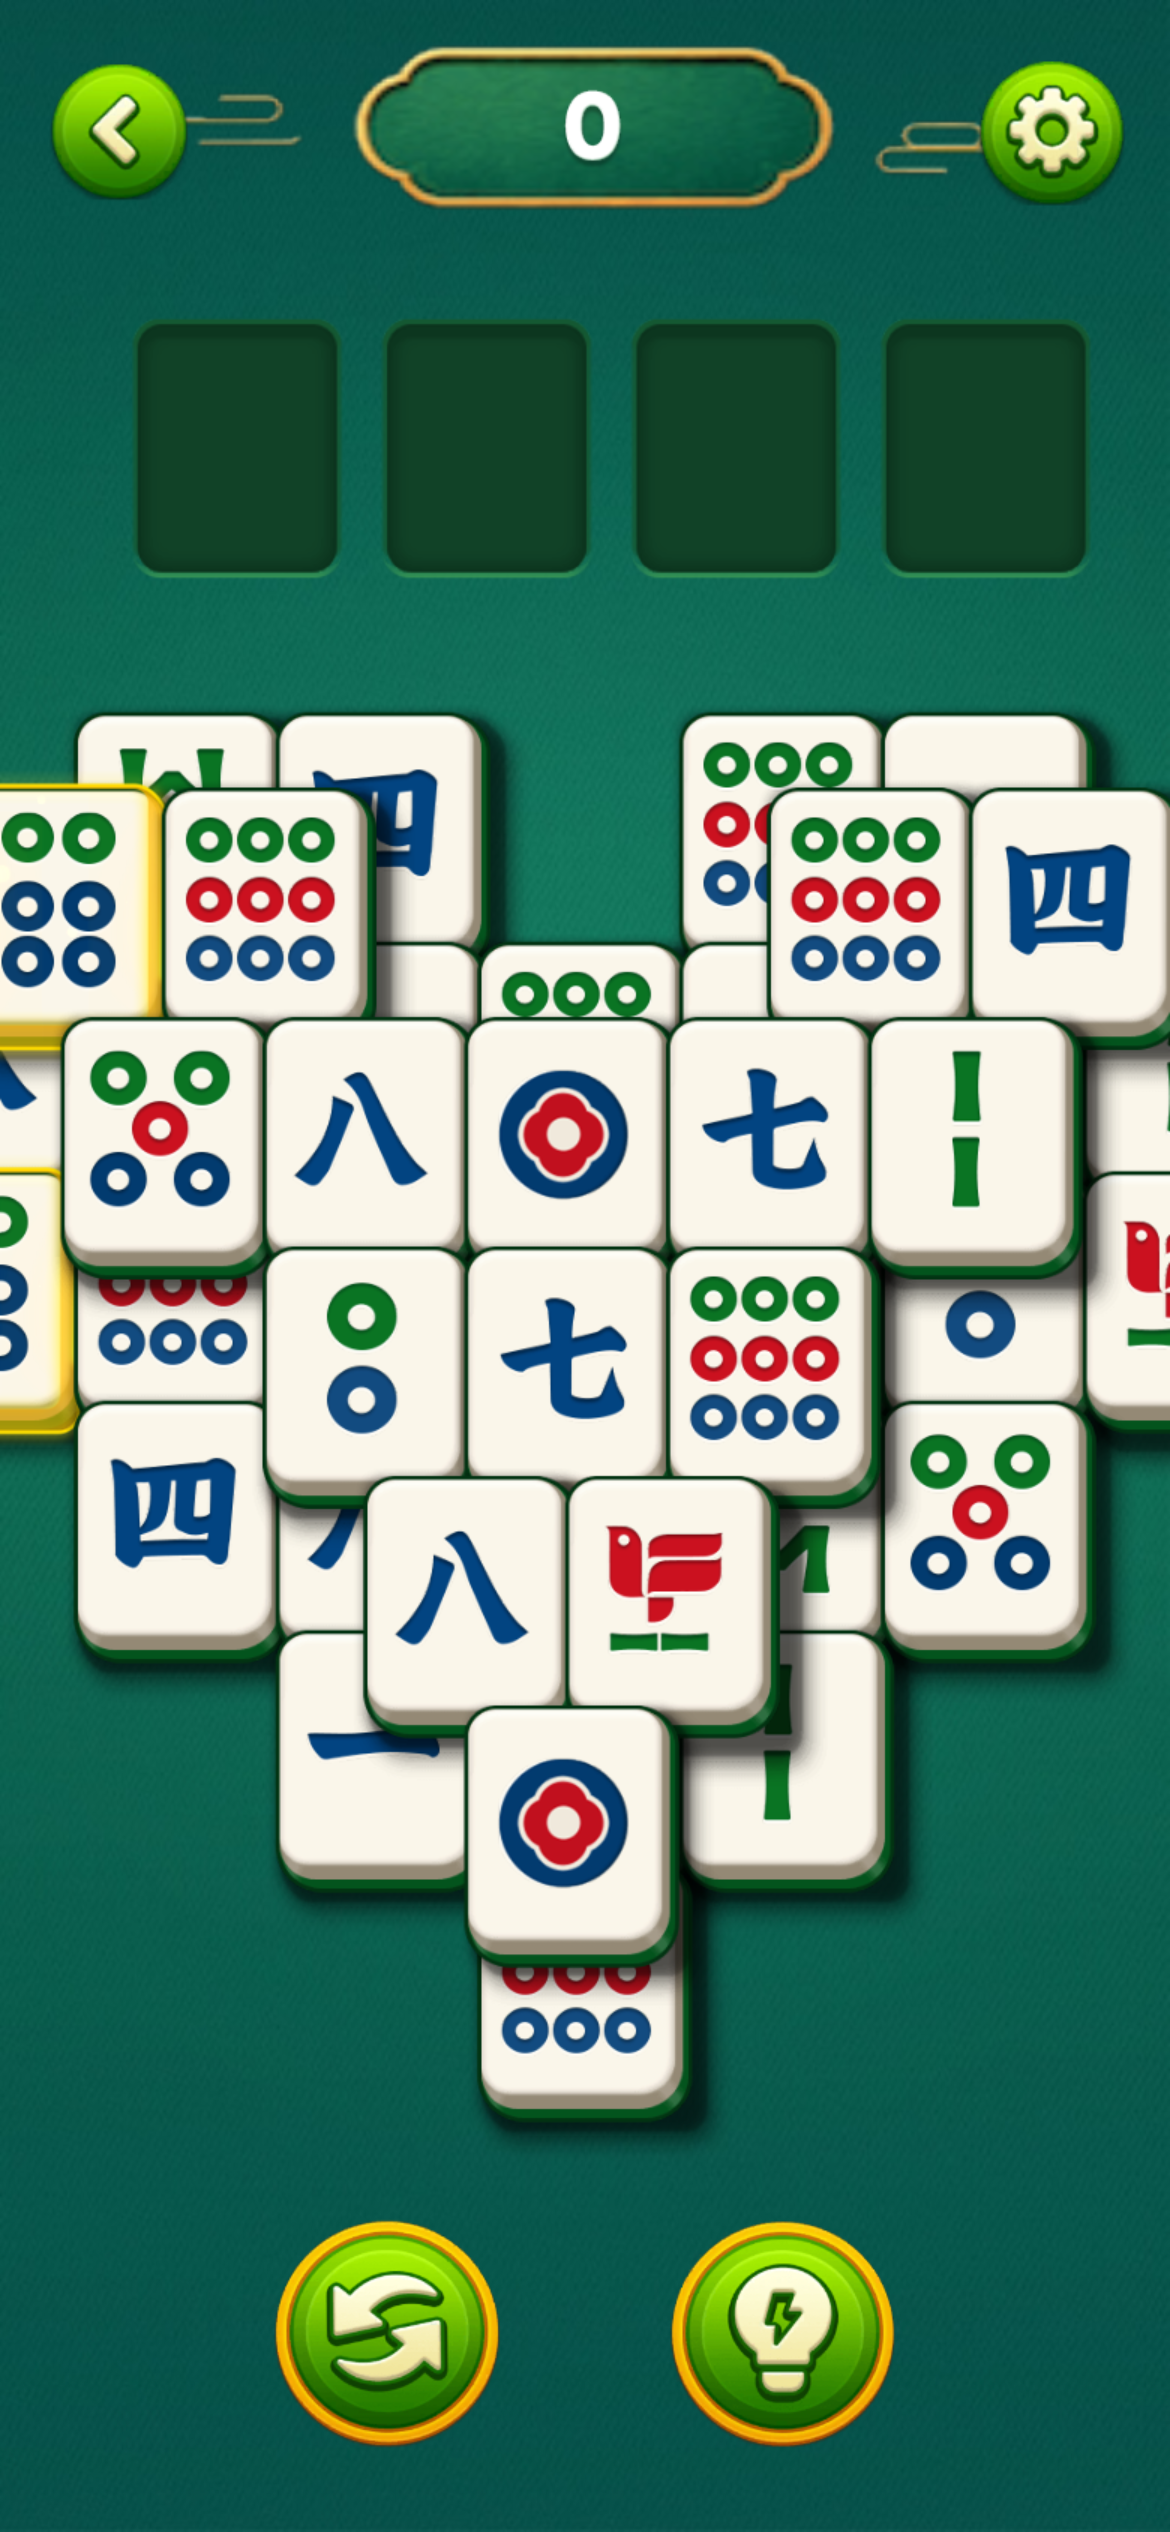 Creative #2 — a playable first seen 2026-06-19, 61 days live. 663,038 placements, 38.2% of the entire fleet's placement count and nearly double creative #1's. But at 27.2 impressions per placement it delivers 18,030,728 impressions, 3.1x fewer than #1. This playable is also attached to creatives #7 and #15.
Creative #1 versus creative #2: six days apart, 6.1x apart on density
The two largest assets launched within a week of each other and behave in opposite ways.
| Creative #1 | Creative #2 | Ratio | |
|---|---|---|---|
| Format | playable | playable | — |
| First seen | 2026-06-25 | 2026-06-19 | 6 days |
| Days live | 55 | 61 | — |
| Placements | 339,688 | 663,038 | 0.51x |
| Impressions | 56,551,902 | 18,030,728 | 3.14x |
| Impr/placement | 166.5 | 27.2 | 6.12x |
| Share of fleet | 59.0% | 18.8% | — |
Creative #2 appears roughly twice as often as creative #1 and produces roughly a third as many impressions. If you ranked this fleet by placement count — which is what a lot of competitive dashboards default to — you would call creative #2 Nebula's biggest bet. It is not. It is the fleet's second-largest asset by volume and its second-least dense playable.
This is the same trap that Vita Mahjong's fleet contains in a more extreme form, and it is worth stating as a general rule: placement count measures presence, not delivery. The two diverge by 6x inside a single format in a single account launched inside a single week.
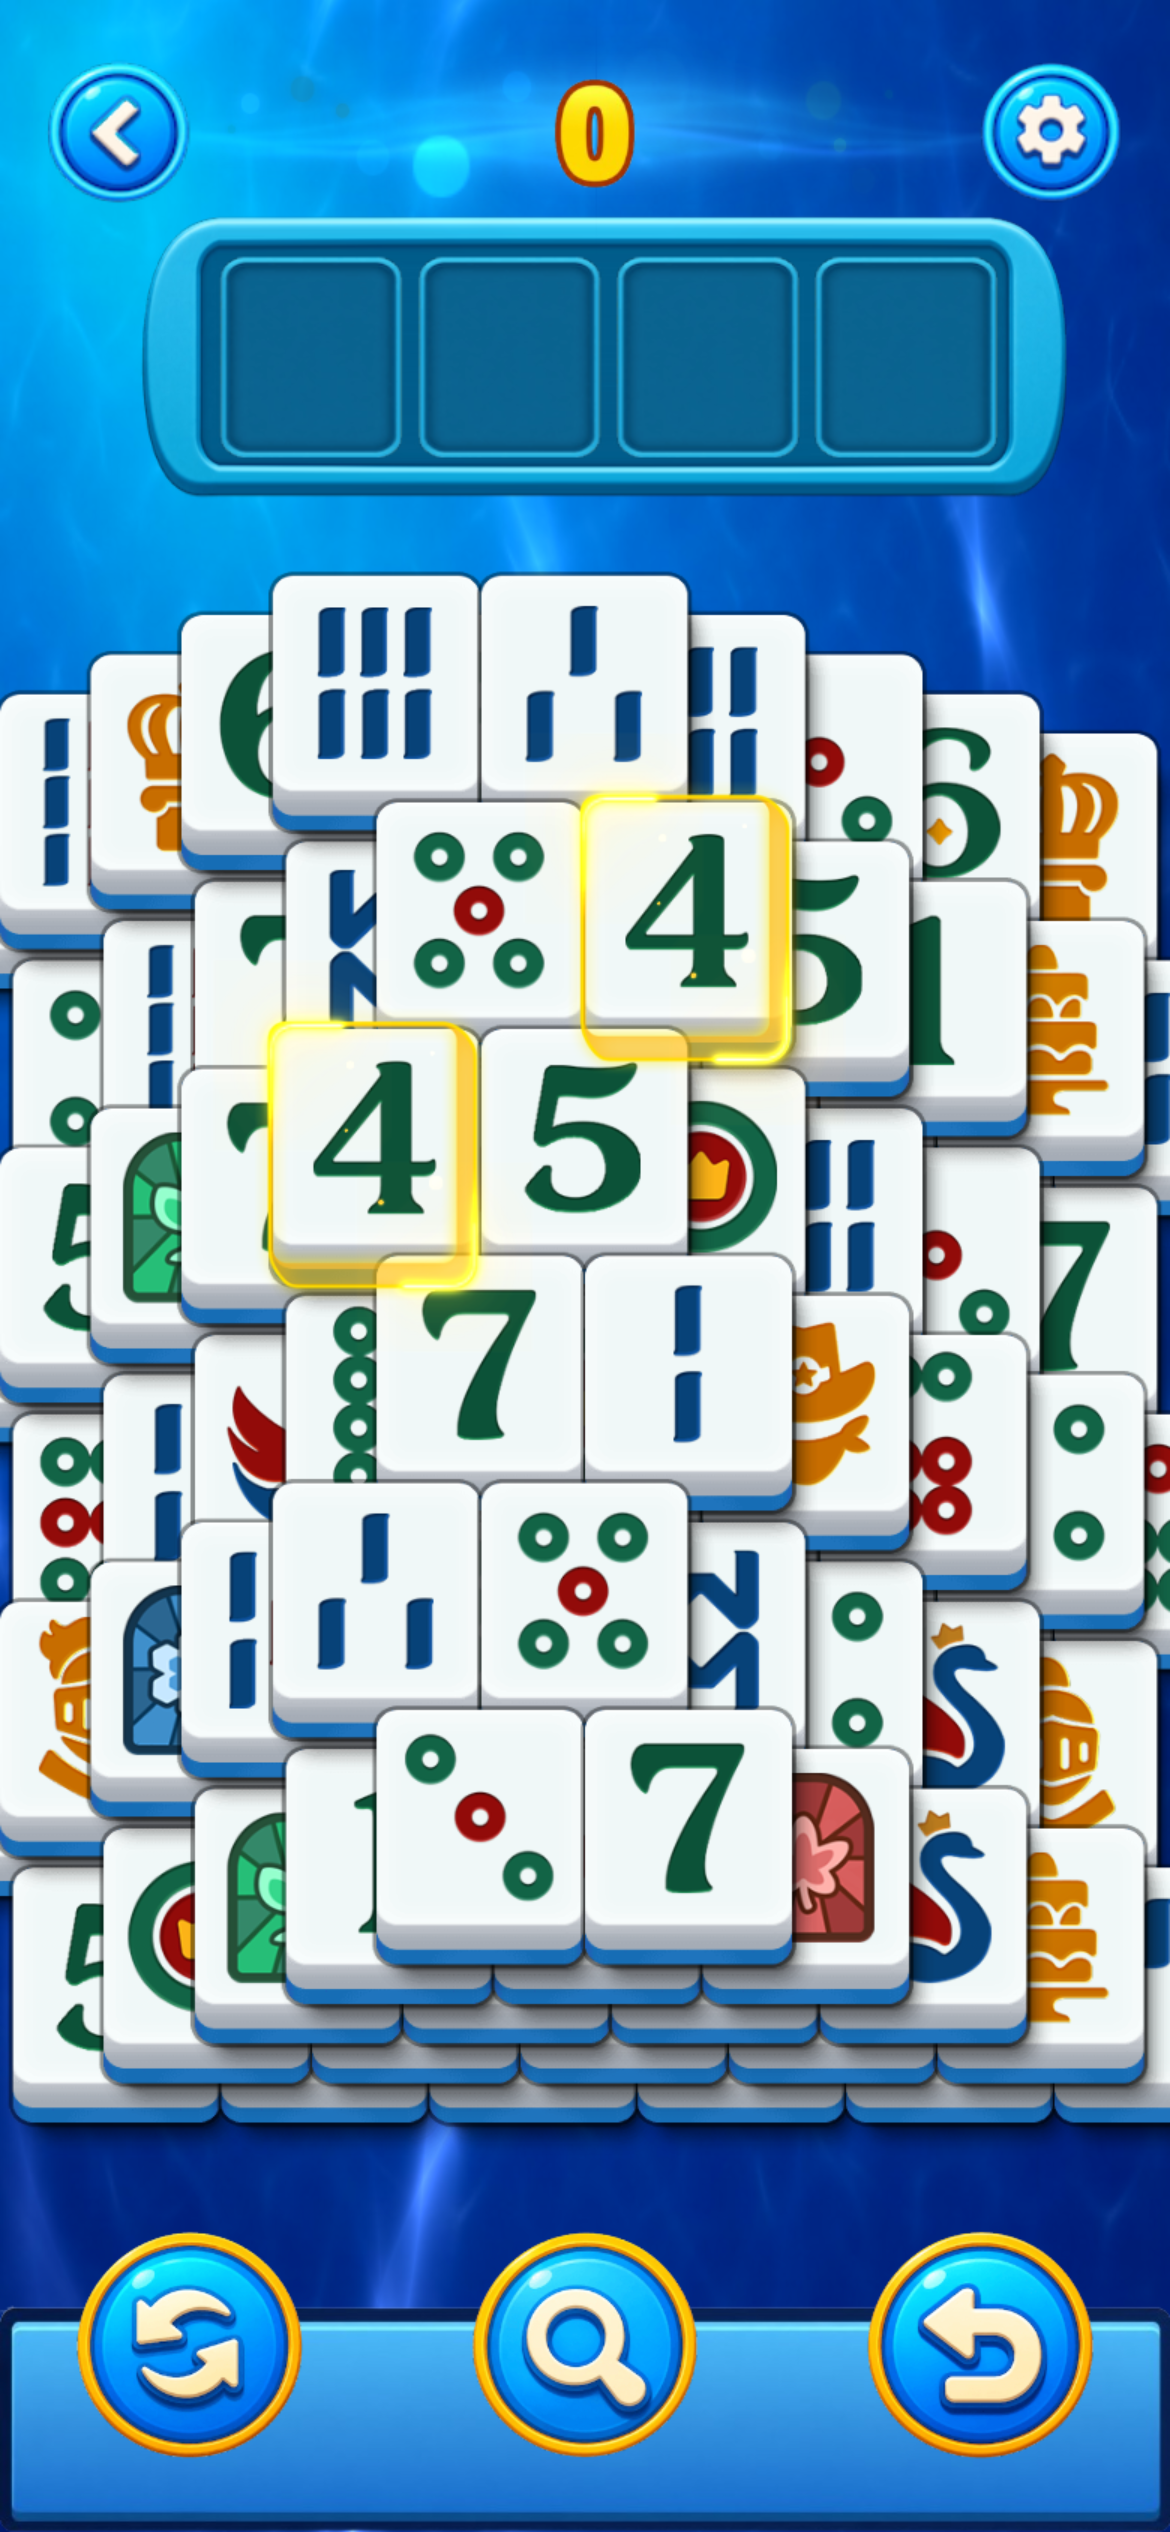 Creative #3 — a playable first seen 2026-07-01, 49 days live, 3,133,161 impressions at 55.9 per placement. The fourth of seven creatives shipped during the June–July sprint.
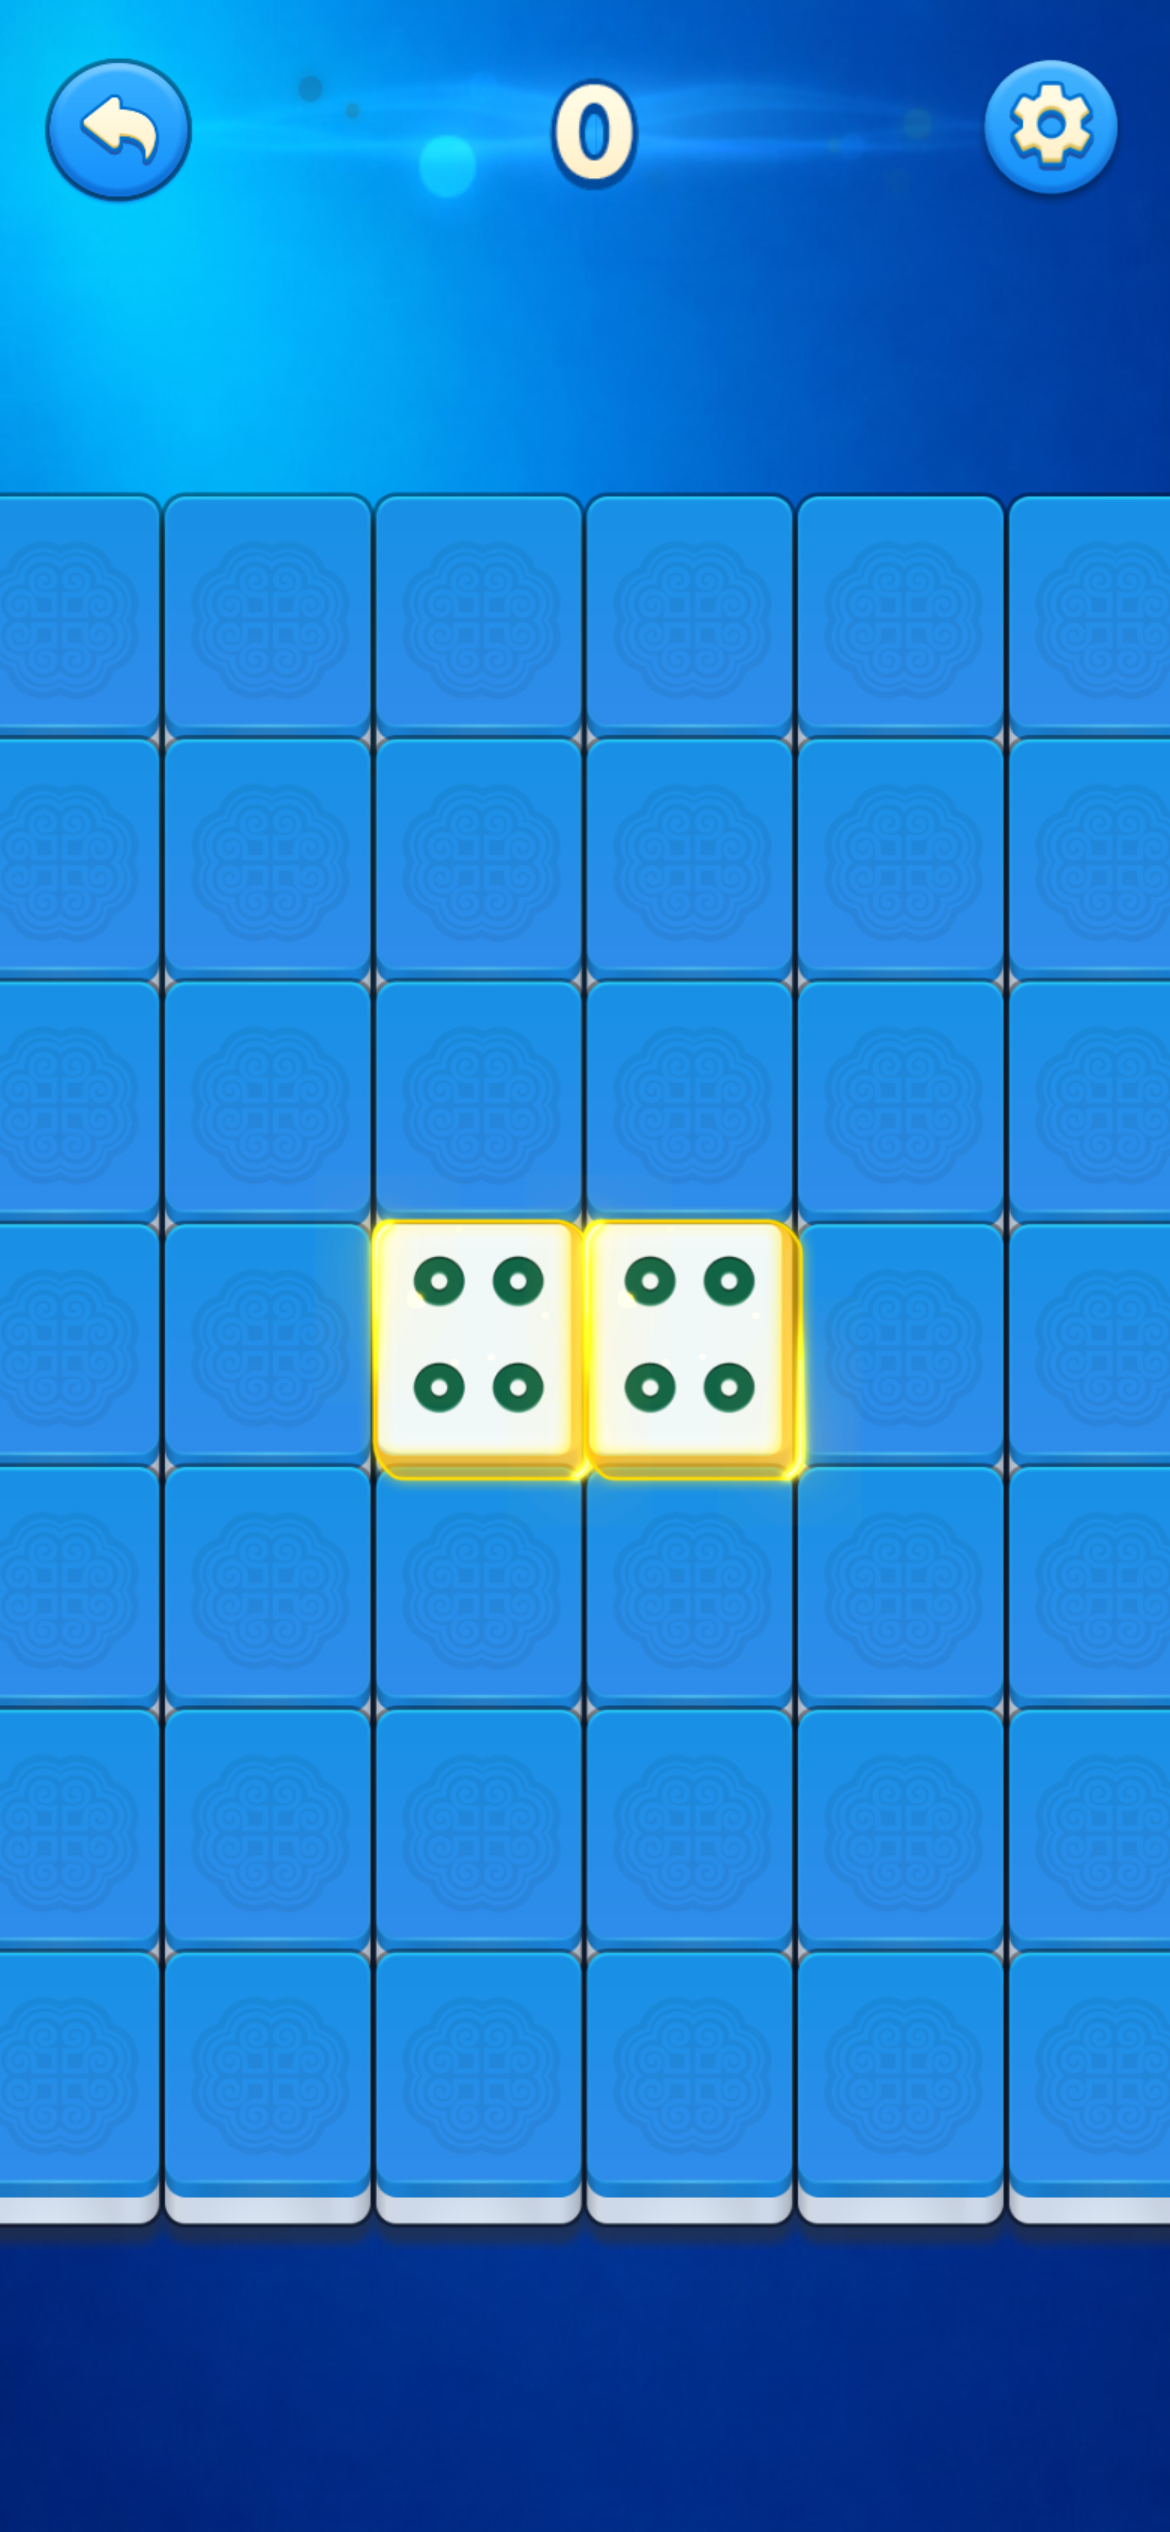 Creative #4 — the newest asset in the fleet, first seen 2026-07-04 and live 46 days. 2,803,570 impressions at 39.9 per placement in the 30-day window.
The 16-day sprint that is the account
Sorted by first-seen date, the fleet has a long thin prehistory and one decisive burst.
| First seen | Creative | Format | Impressions | Gap |
|---|---|---|---|---|
| 2025-10-18 | #6 | playable | 2,182,410 | — |
| 2025-10-24 | #5 | playable | 2,329,381 | +6d |
| 2025-11-05 | #10 | playable | 1,281,396 | +12d |
| 2026-03-27 | #8 | playable | 1,872,120 | +142d |
| 2026-04-07 | #9 | 29s | 1,322,518 | +11d |
| 2026-04-07 | #11 | 59s | 1,241,208 | same day |
| 2026-04-07 | #13 | 119s | 823,239 | same day |
| 2026-04-30 | #12 | 59s | 1,090,262 | +23d |
| 2026-06-19 | #2 | playable | 18,030,728 | +50d |
| 2026-06-19 | #14 | playable | 672,665 | same day |
| 2026-06-20 | #7 | 59s | 1,876,832 | +1d |
| 2026-06-25 | #1 | playable | 56,551,902 | +5d |
| 2026-07-01 | #3 | playable | 3,133,161 | +6d |
| 2026-07-03 | #15 | 59s | 653,395 | +2d |
| 2026-07-04 | #4 | playable | 2,803,570 | +1d |
| 2026-08-19 | (pull date) | — | — | +46d |
By cohort:
| Cohort | Creatives | Impressions | Share | Avg per creative |
|---|---|---|---|---|
| Autumn 2025 (Oct–Nov) | 3 | 5,793,187 | 6.0% | 1,931,062 |
| Spring 2026 (Mar–Apr) | 5 | 6,349,347 | 6.6% | 1,269,869 |
| Summer 2026 (Jun 19 – Jul 4) | 7 | 83,722,253 | 87.3% | 11,960,322 |
Seven creatives, shipped over sixteen days, produce 87.3% of everything this fleet delivered in the 30 days to 2026-08-19. On a per-creative basis they average 11.96 million impressions each, against 1.93 million for the 2025 cohort and 1.27 million for the spring 2026 cohort — a 9.4x gap over the most recent prior batch.
The eight creatives that preceded them — spanning October 2025 to April 2026, and including every video except two — collectively contribute 12.7% of the window's volume. The 2025 cohort in particular is now essentially inert: three assets, 287 to 305 days old, all still live, and delivering 6.0% between them.
A note on what is not here. An earlier version of this section also reported each cohort's share of "current daily output" — 95.7% for the summer cohort. That column has been removed: the impression field is a rolling 30-day value and all fifteen creatives predate the window, so dividing by days-live mixed a 30-day numerator with denominators from 46 to 305 days. Per-creative averages carry the same conclusion without inventing a rate.
Nebula did not build this fleet gradually. It ran a small maintenance operation for eight months and then, in the third week of June 2026, shipped something that worked. Downloads are +13.77%.
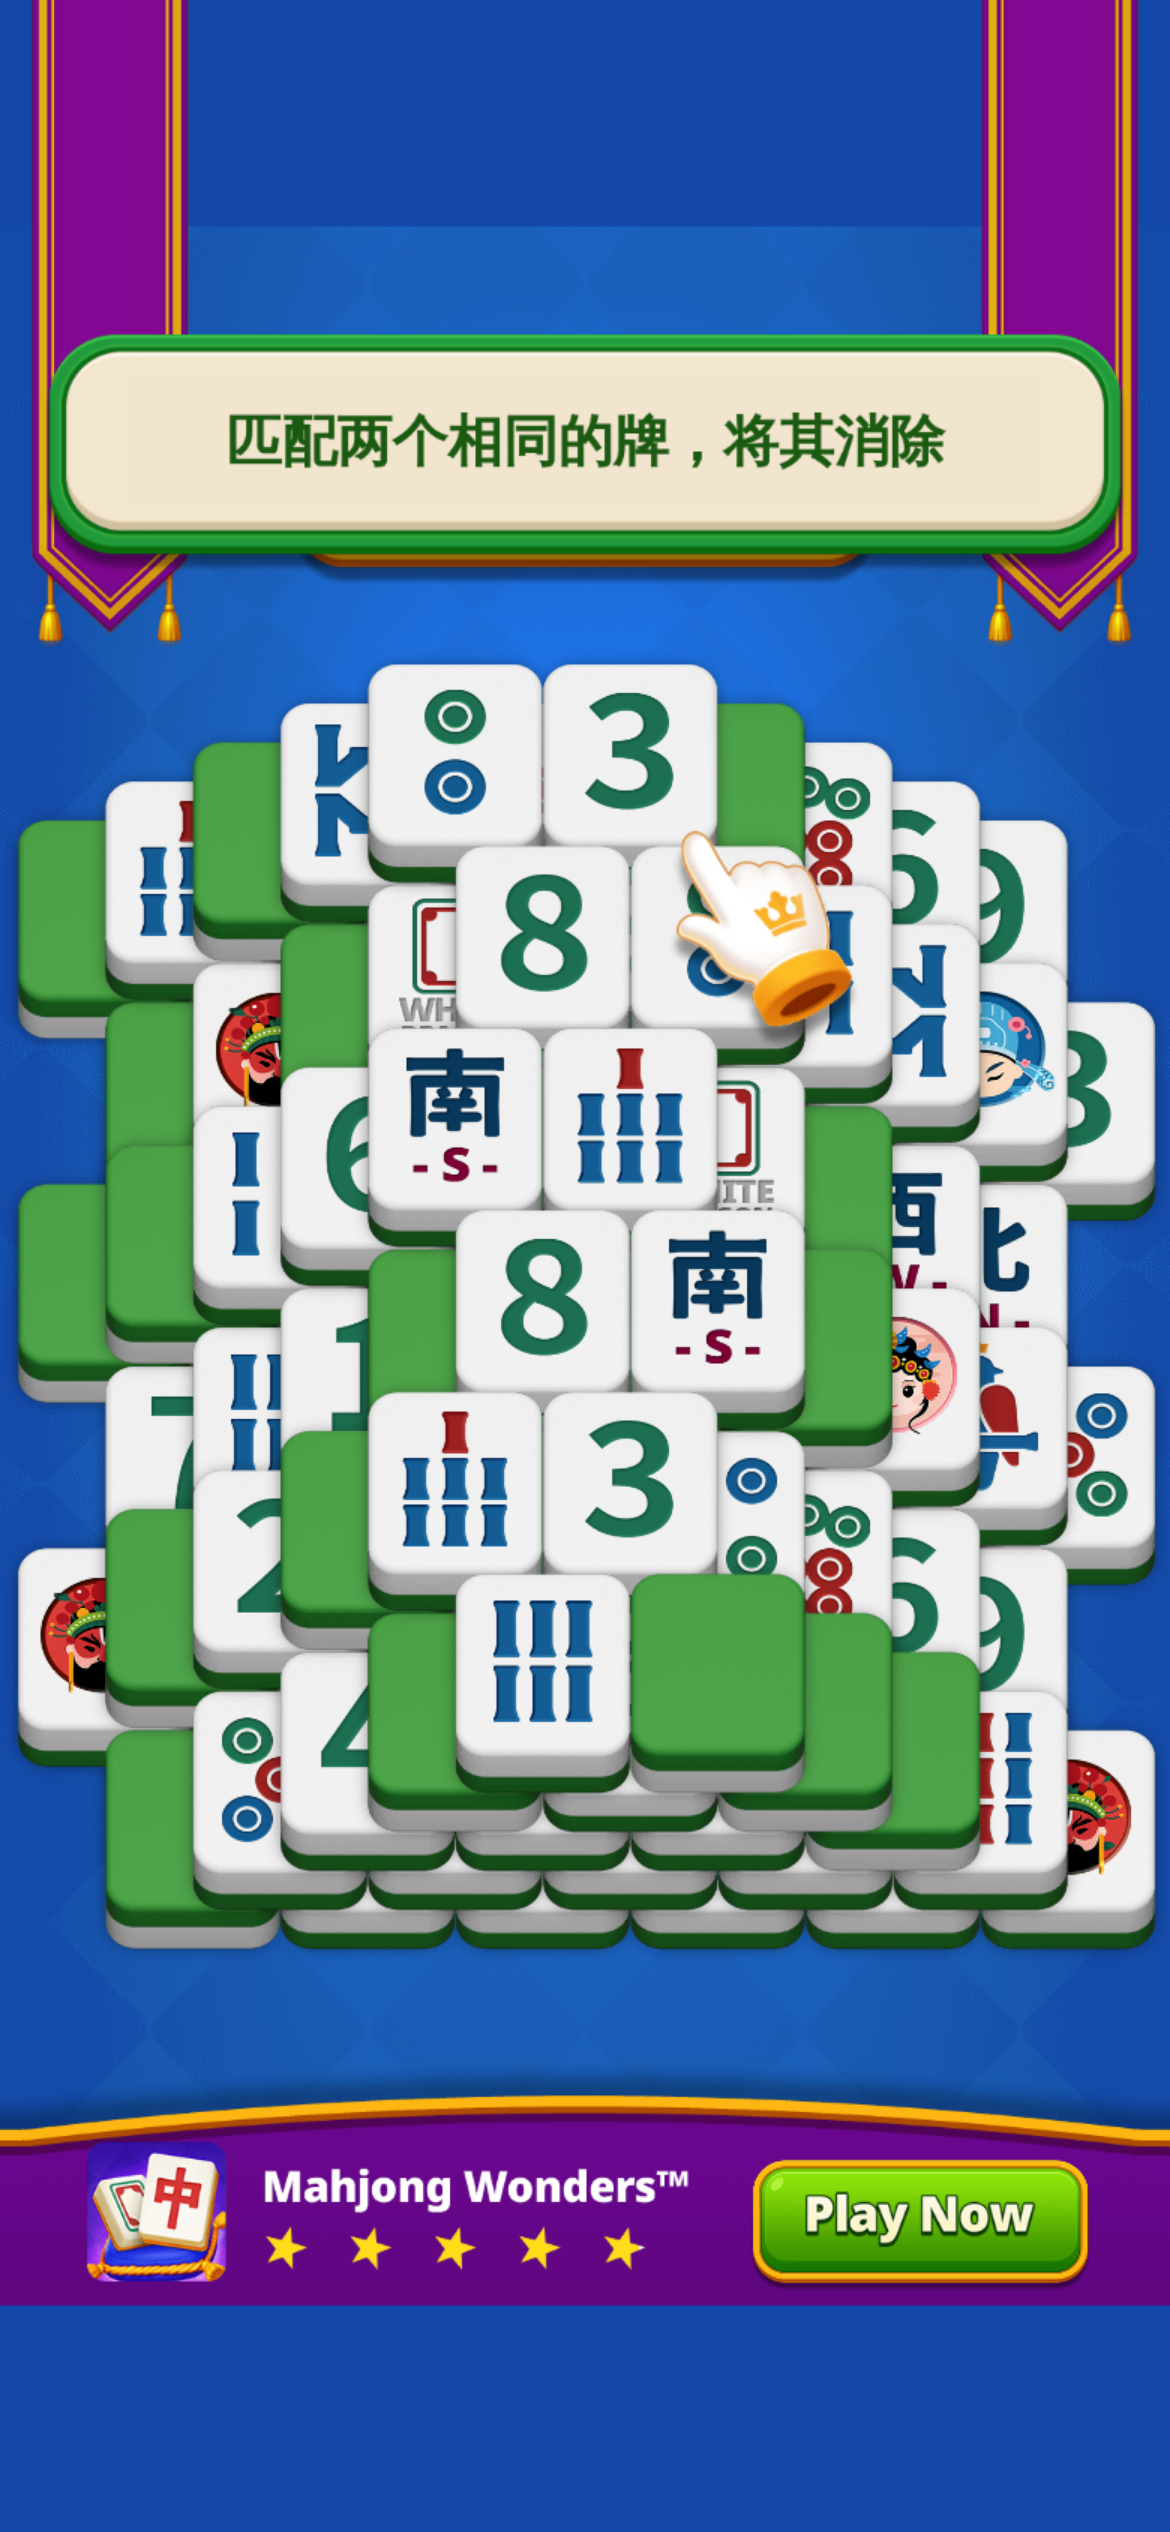 Creative #6 — the fleet's oldest asset, first seen 2025-10-18 and still live after 305 days. At 272.3 impressions per placement it is the densest creative in the account, but with only 8,015 placements it contributes 2.3% of the fleet's 30-day impressions.
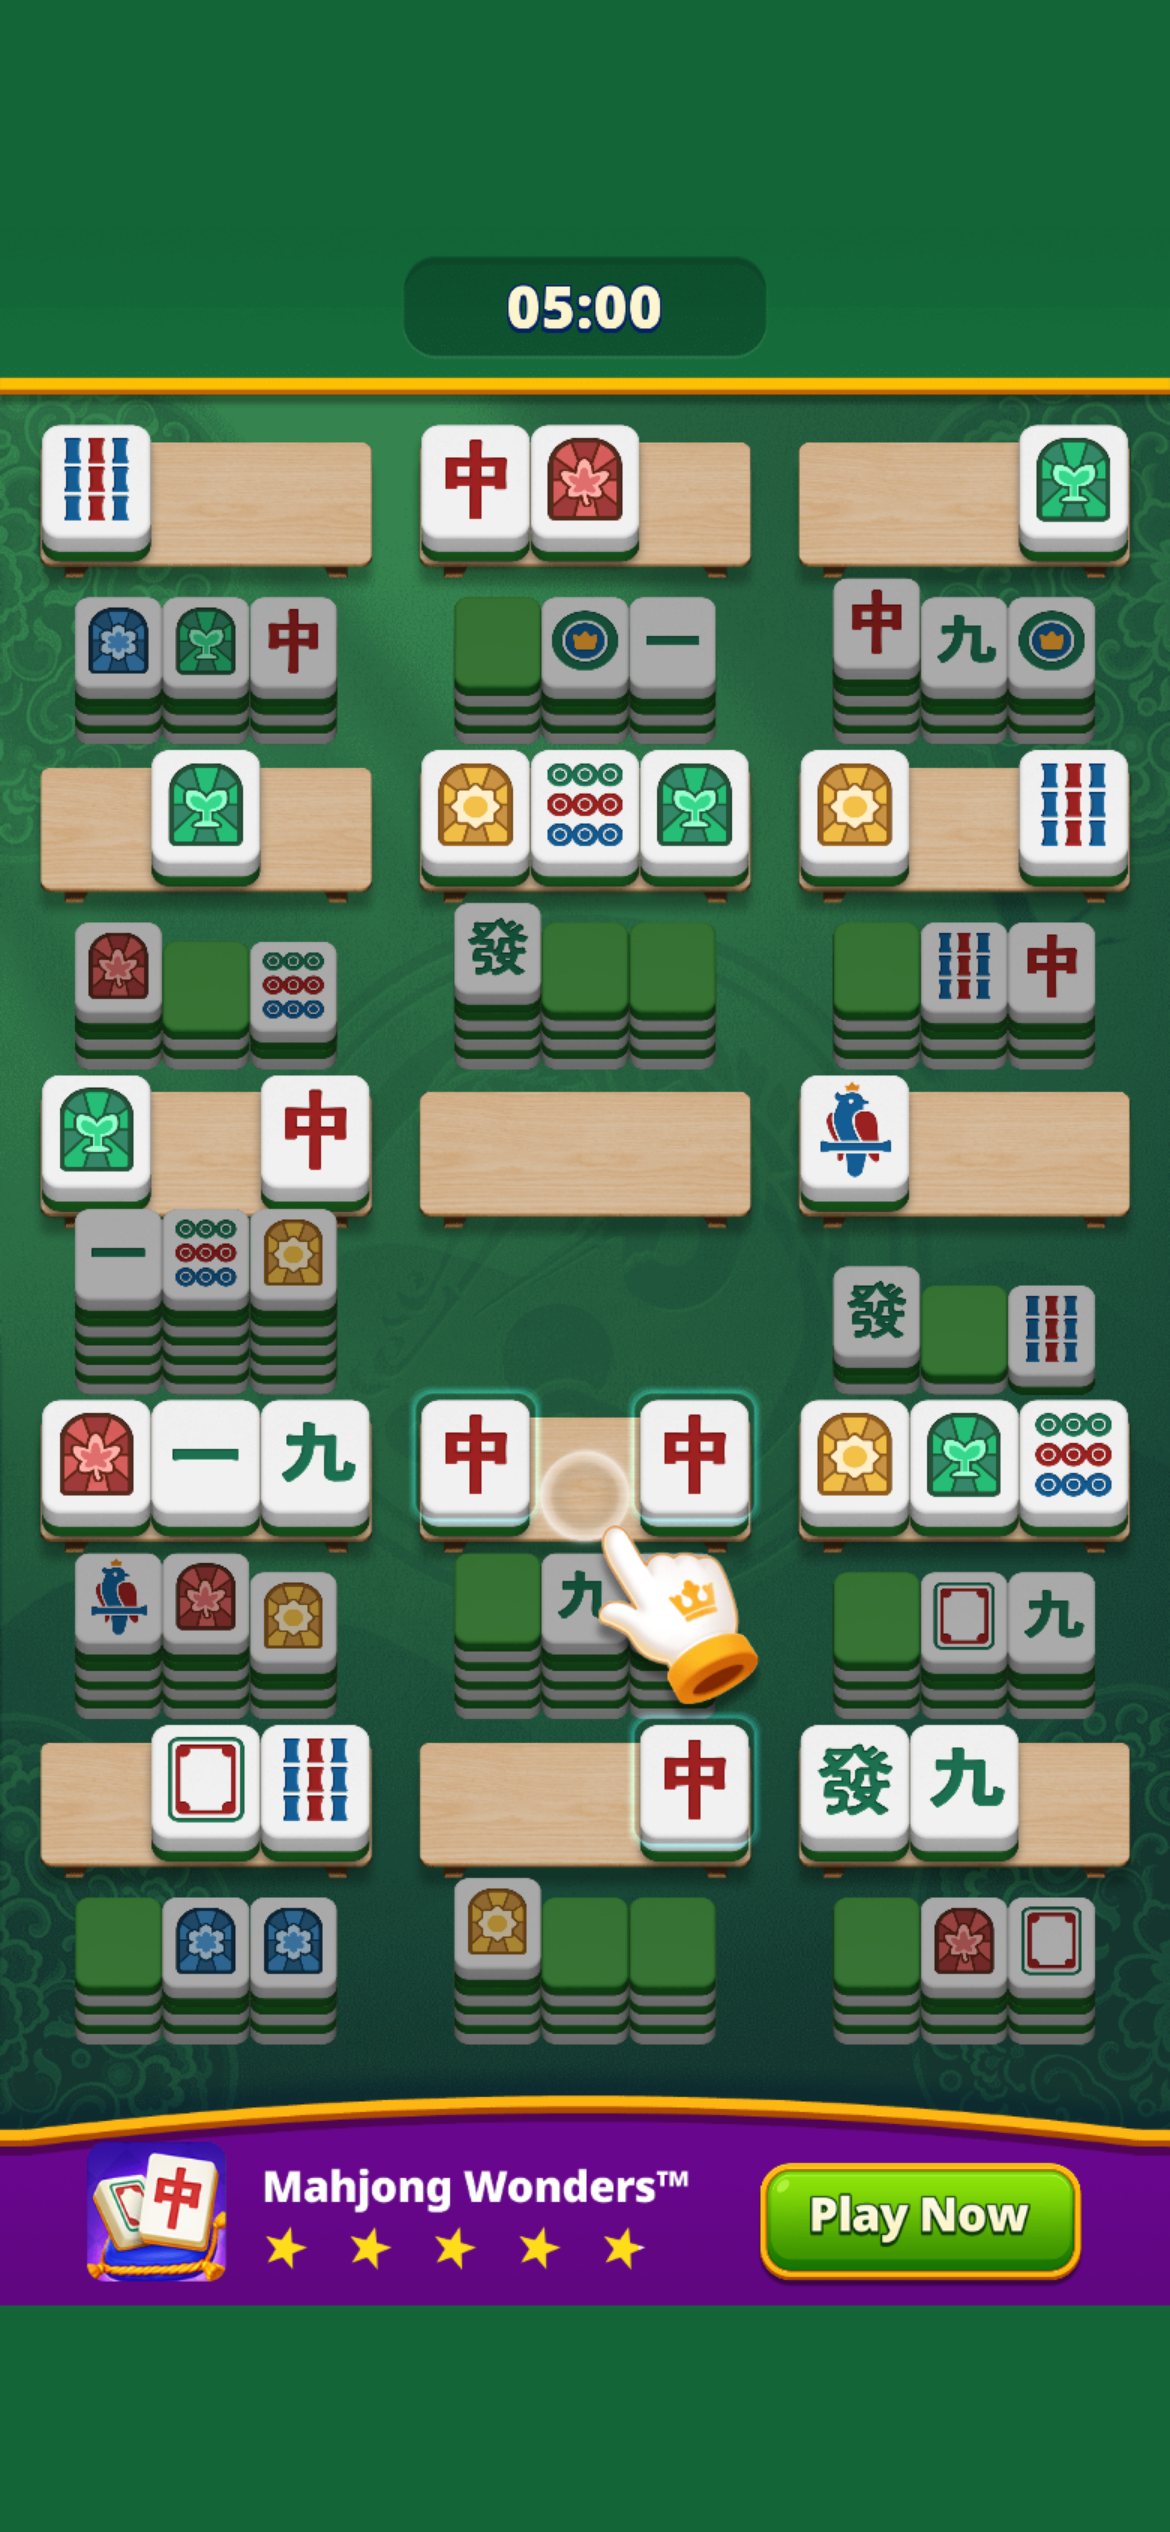 Creative #5 — first seen 2025-10-24, live 299 days, 2,329,381 impressions at 177.1 per placement in the 30-day window. The second-densest asset in the fleet and the second-oldest.
Density and age move together — inversely to volume
There is a genuine inverse relationship in this fleet between how dense an asset is and how much it delivers.
| Creative | Days live | Impr/placement | Impressions | |---|---|---|---|---| | #6 | 305 | 272.3 | 2,182,410 | 7,155 | | #5 | 299 | 177.1 | 2,329,381 | 7,791 | | #1 | 55 | 166.5 | 56,551,902 | 1,028,216 | | #3 | 49 | 55.9 | 3,133,161 | 63,942 | | #8 | 145 | 55.8 | 1,872,120 | 12,911 | | #4 | 46 | 39.9 | 2,803,570 | 60,947 | | #2 | 61 | 27.2 | 18,030,728 | 295,586 | | #14 | 61 | 26.5 | 672,665 | 11,027 | | #10 | 287 | 24.2 | 1,281,396 | 4,465 |
The two densest assets are the two oldest, and they produce almost nothing. The two highest-volume assets are 55 and 61 days old and sit in the middle and bottom of the density ranking. Creative #1 is the only asset that is both dense (166.5) and large (56.6 million) — which is precisely why it is 59% of the account.
The reading: density in this fleet is a signal of narrow, specialised placement, not of quality. Creative #6 has been running for 305 days into a small pocket of high-density inventory. It is a survivor, not a driver. Nebula's growth comes from a creative that found scale and held a reasonable density — a combination that appears exactly once in fifteen assets.
Video: a fixed-yield channel
The six videos deserve one more look, because their uniformity is genuinely unusual.
| Creative | Duration | First seen | Impressions | Placements | Impr/placement |
|---|---|---|---|---|---|
| #9 | 29s | 2026-04-07 | 1,322,518 | 90,504 | 14.6 |
| #11 | 59s | 2026-04-07 | 1,241,208 | 84,901 | 14.6 |
| #13 | 119s | 2026-04-07 | 823,239 | 55,075 | 14.9 |
| #12 | 59s | 2026-04-30 | 1,090,262 | 74,458 | 14.6 |
| #7 | 59s | 2026-06-20 | 1,876,832 | 126,963 | 14.8 |
| #15 | 59s | 2026-07-03 | 653,395 | 43,512 | 15.0 |
| Total | — | — | 7,007,454 | 475,413 | 14.7 |
The 2026-04-07 launch is the cleanest natural experiment in this entire batch of teardowns: three videos, same day, at 29, 59 and 119 seconds. A 4.1x runtime range. The delivery rates came out at 14.6, 14.6 and 14.9.
The 119-second creative is worth flagging on its own. At just under two minutes it is more than twice the length of any other creative measured across this series — Vita Mahjong's longest is 60 seconds, Arrows' is 60, Jewel Coloring's is 54. It is also the smallest of the three same-day launches at 823,239 impressions, and it converts placements at the same rate as the 29-second cut.
Six videos also account for 475,413 placements — 27.4% of the fleet's total placement count — while delivering 7.3% of its impressions. Video in this account occupies a disproportionate share of the fleet's presence and a negligible share of its delivery.
If we take that at face value, Nebula's video production is buying reach into a low-yield surface at a completely predictable rate. There is a defensible reason to keep doing it — predictable low-yield inventory is still inventory, and a fleet that is 100% playable forfeits every placement that will not accept an interactive unit. But there is no version of this data in which video is where Mahjong Blast's growth is coming from.
 Creative #13 — 119 seconds, first seen 2026-04-07, the longest single creative measured anywhere in this teardown series. 823,239 impressions at 14.9 per placement, statistically indistinguishable from the 29-second creative launched the same day.
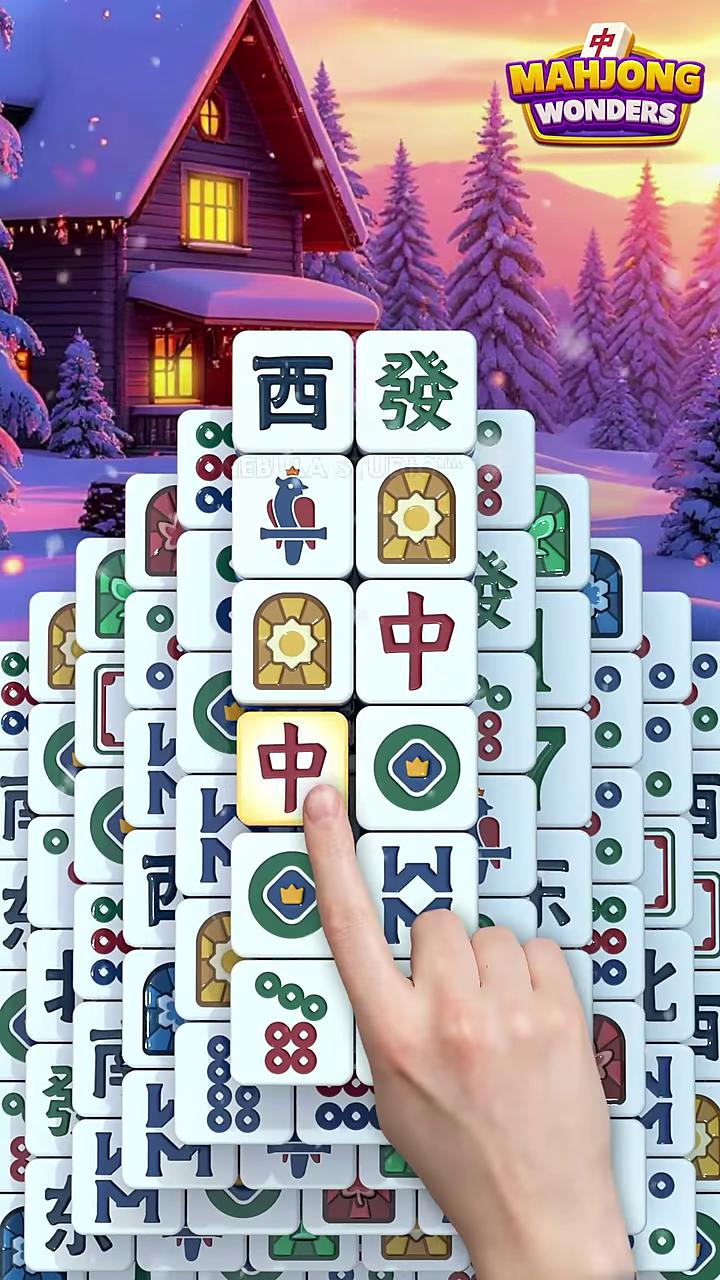 Creative #9 — 29 seconds, first seen 2026-04-07 alongside the 59-second and 119-second cuts. 1,322,518 impressions at 14.6 per placement, the largest of the three same-day videos despite being the shortest.
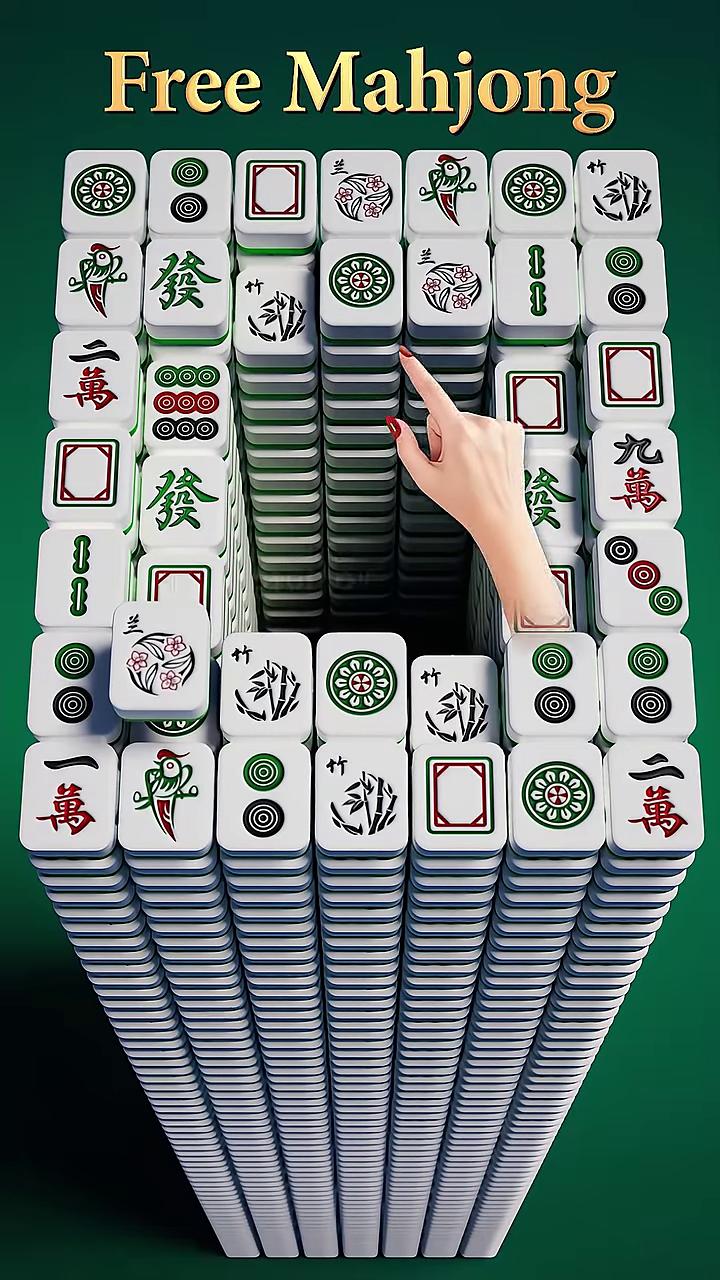 Creative #11 — 59 seconds, the middle length of the three-way same-day test on 2026-04-07. 1,241,208 impressions at 14.6 per placement.
Mahjong Blast versus Vita Mahjong: the same genre, run two opposite ways
This is the comparison that makes both fleets legible. Vita Mahjong is the largest measurable mahjong advertiser in the US market; Mahjong Blast sits 94 places below it on the download chart. Their operating models have almost nothing in common.
Vita Mahjong figures below are cited from that title's teardown, pulled on the same date, 2026-08-19.
| Vita Mahjong (Vita Studio) | Mahjong Blast (Nebula Studio) | |
|---|---|---|
| US download rank | 54 | 148 |
| Downloads | 1,256,369 | 616,774 |
| Download change | -25.41% | +13.77% |
| Top-15 impressions | 10,548,638,193 | 95,864,787 |
| Creatives live | 15 / 15 | 15 / 15 |
| Average age | 263 days | 128.5 days |
| Oldest asset | 467 days | 305 days |
| Newest asset | 77 days | 46 days |
| Impr/placement | 967 – 1,117 (1.15x spread) | 14.6 – 272.3 (18.65x spread) |
| Pure-playable share of impressions | 13.0% | 92.7% |
| Lifetime creatives | 137,819 | 41,370 |
| Lifetime impressions (global) | 1,178,822,561,715 | 50,148,648,448 |
| Impressions per creative | 8,553,411 | 1,212,198 |
Read down that column and the two fleets invert on every axis that matters.
On scale: Mahjong Blast's top fifteen creatives total 95.9 million impressions against Vita Mahjong's 10.55 billion — 110x apart. Across their full lifetimes, Nebula's global impression total is 4.25% of Vita Studio's.
On format: Vita Mahjong is a video machine that attaches playables to almost everything but lets pure interactive units carry 13% of volume. Mahjong Blast is a playable machine where video is a 7.3% side channel with no variance in it.
On uniformity: Vita Mahjong's fourteen normal creatives deliver within a 1.15x band — the tightest we have measured. Mahjong Blast's fifteen span 18.65x — the widest. Vita Studio runs one global setting across everything. Nebula runs formats that behave completely differently and gets a bimodal outcome.
On age: Vita Mahjong's fleet averages 263 days and its oldest asset has run 467. Mahjong Blast averages 128.5 and tops out at 305. Nebula's account is half the age of Vita's.
And on the download line, the small young playable-heavy fleet is the one growing. Nebula produces 49.1% of Vita Studio's US downloads while running an ad operation whose global lifetime impressions are 4.25% of Vita's.
That last comparison needs a caveat and it is an important one. Impression counting is not necessarily equivalent across formats: an interactive unit and a fifty-second video are not the same object, and a fleet that is 92.7% playable may be measured differently from one that is 87% video. The download difference is also period-relative — Vita Mahjong is falling from a much higher base. What the comparison establishes reliably is a structural contrast in how the two publishers operate, not a clean efficiency ratio between them. We would not convert this into a CPI claim, and neither should anyone else.
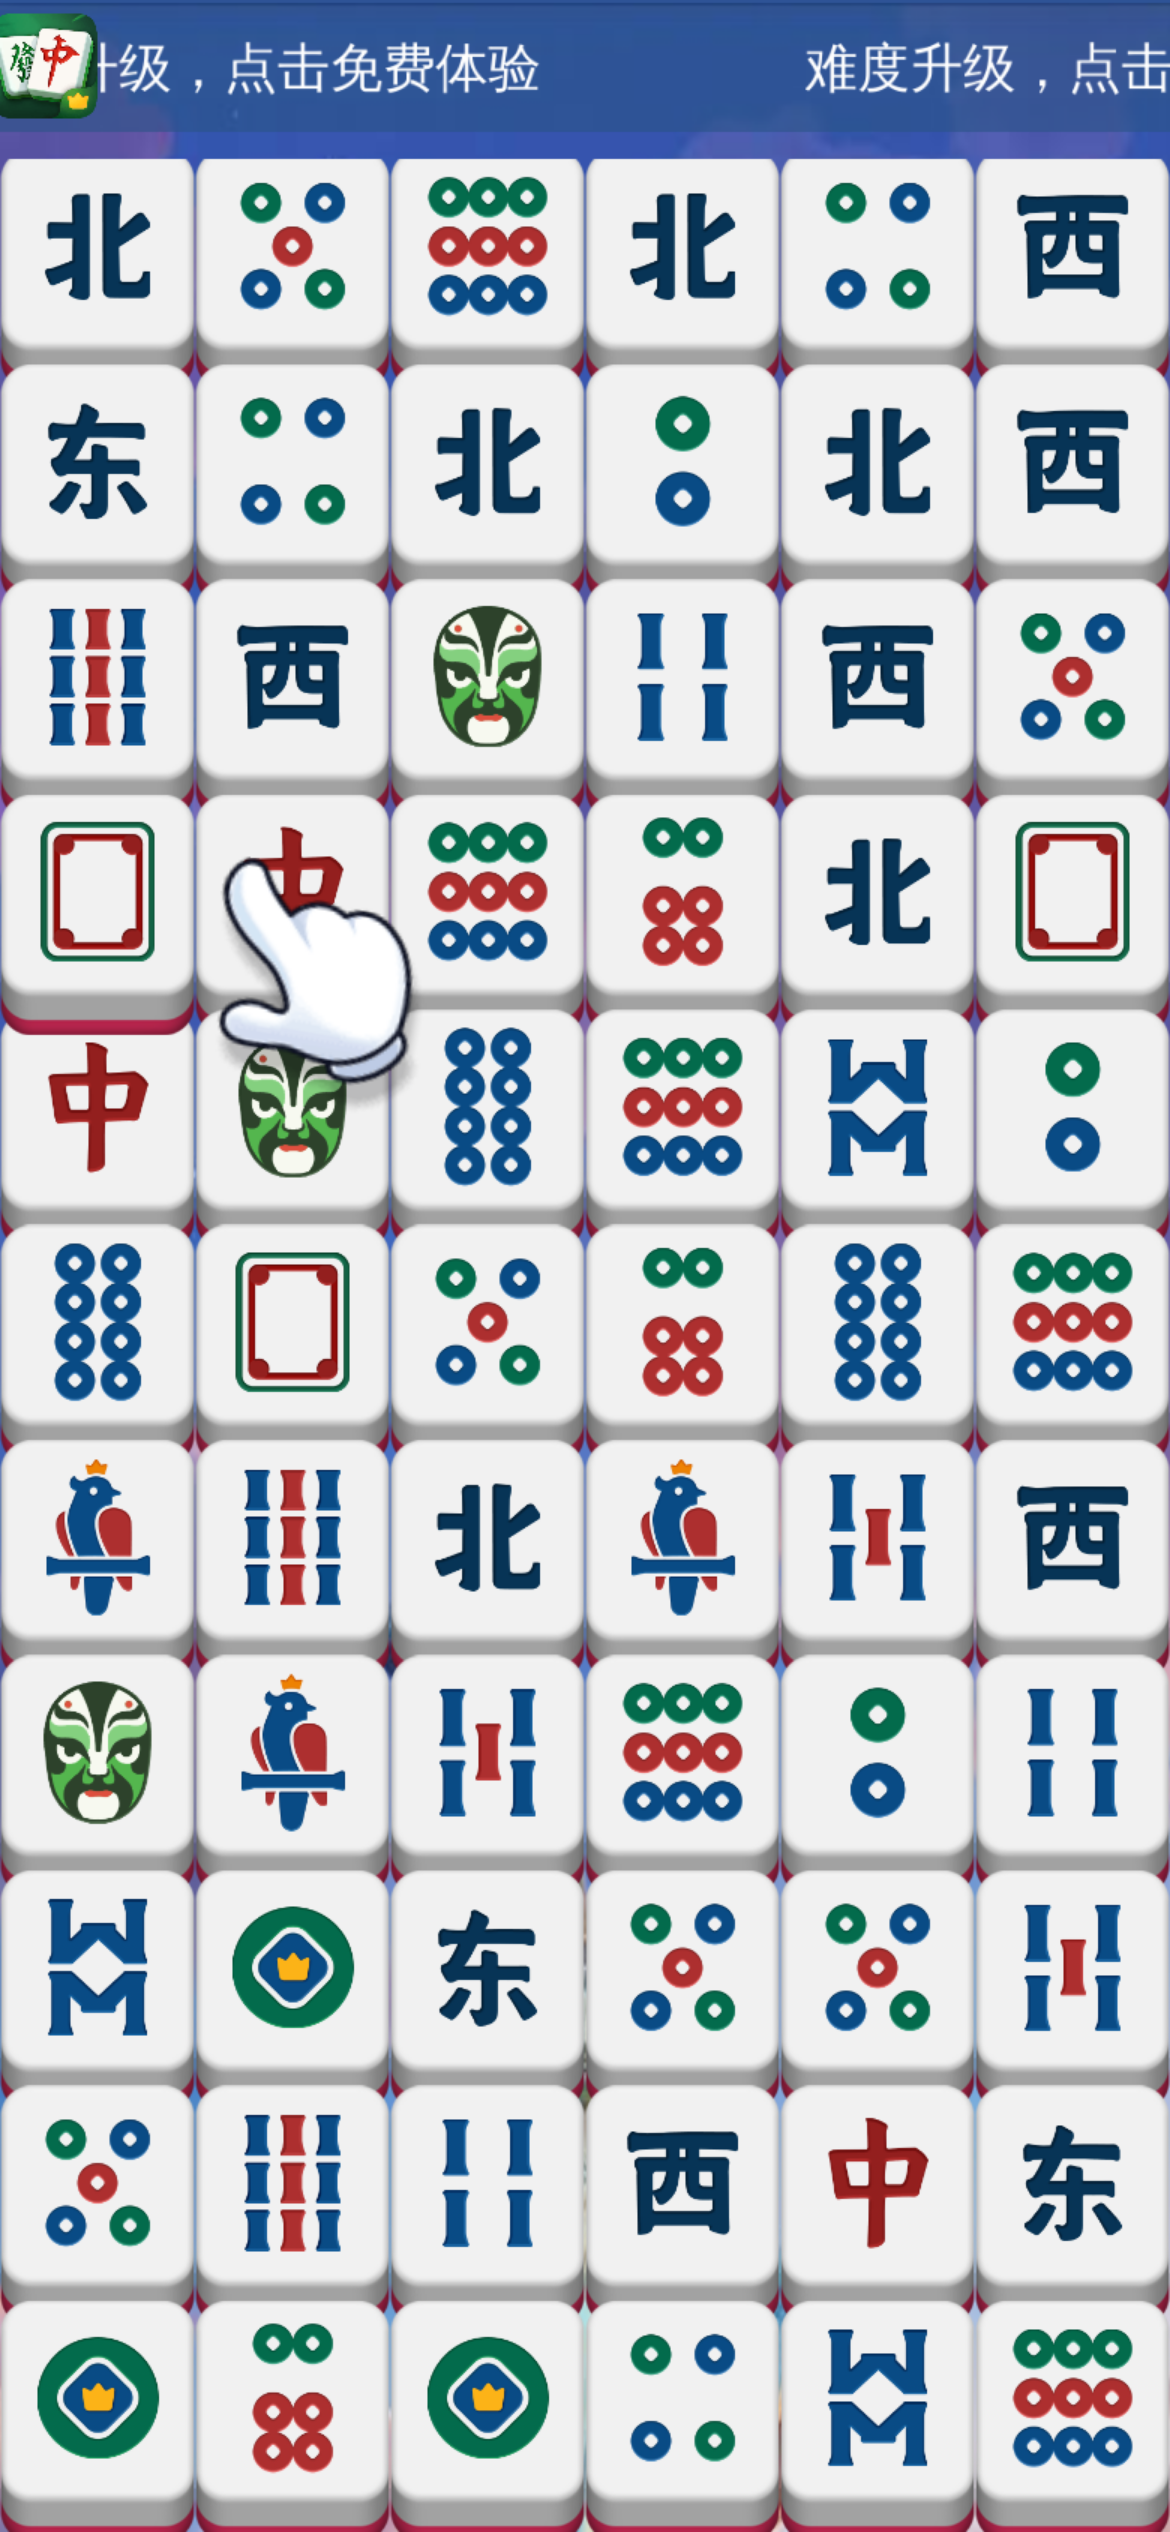 Creative #8 — a playable first seen 2026-03-27, 145 days live, 1,872,120 impressions at 55.8 per placement. It ended a 142-day gap in the fleet's build history, the longest silence Nebula has had on this title.
 Creative #10 — a playable first seen 2025-11-05, still live after 287 days. 1,281,396 impressions at 24.2 per placement, the lowest density of any playable in the fleet and 1.3% of the account.
Same-genre benchmark: four mahjong fleets
Comparing US fleets pulled the same day, on a top-10 basis where the pull resolved cleanly to a single product:
| Fleet | Assets | Impressions | Impr/placement | Top-1 share | Avg age | Live |
|---|---|---|---|---|---|---|
| Mahjong Blast (top 10) | 10 | 91,384,018 | 62.9 | 61.9% | 144.1 | 10/10 |
| Mahjong Rumble: Win Real Cash | 10 | 373,517,706 | 1,351.7 | 49.1% | 30 | 9/10 |
| Mahjong Clash: Win Real Cash | 10 | 76,653,226 | 2,883.3 | 21.9% | 13 | 4/10 |
Both Mahjong Rumble and Mahjong Clash are published by the same company (AdMapix ID 2107284751) and represent a different sub-genre entirely — real-cash mahjong. Their profile is the opposite of Nebula's: extremely young fleets (30 and 13 days average age), extremely high placement density (1,351.7 and 2,883.3), and in Clash's case only four of ten assets still live on the pull date.
That is a churn model. Ship a lot, run it dense and hot, kill most of it inside a month. Nebula's model is the opposite: nine playables including three from autumn 2025 that are still live, delivering at 24 to 272 impressions per placement.
At the product level across the wider set measured on this date:
| Product | Publisher | Lifetime creatives | Lifetime impressions | Impressions per creative |
|---|---|---|---|---|
| Magic Sort! | Grand Games | 4,866 | 172,778,367,616 | 35,507,268 |
| Arrows – Puzzle Escape | Lessmore GmbH | 21,519 | 298,466,673,910 | 13,869,914 |
| Pixel Flow! | Loom Games | 16,562 | 213,359,297,665 | 12,882,460 |
| Vita Mahjong | Vita Studio | 137,819 | 1,178,822,561,715 | 8,553,411 |
| Meowdoku! | Oakever Games | 26,545 | 111,513,773,113 | 4,200,933 |
| Jewel Coloring | Ta Ta Game Technology | 3,358 | 9,343,780,794 | 2,782,543 |
| Paint by Number Coloring Games | Oakever Games | 37,691 | 64,478,630,793 | 1,710,717 |
| Mahjong Blast | Nebula Studio | 41,370 | 50,148,648,448 | 1,212,198 |
Mahjong Blast ranks last of eight on impressions per creative, at 1,212,198. Nebula has produced 41,370 lifetime creatives — the second-largest library in the group — and gets the least out of each one.
Set against the +13.77% download growth, that is not a contradiction so much as a description of the strategy: make an enormous number of cheap interactive variants, accept that almost all of them do nothing, and wait for the one that does. Creative #1 is that one. It arrived on 2026-06-25 and it is 59% of the fleet.
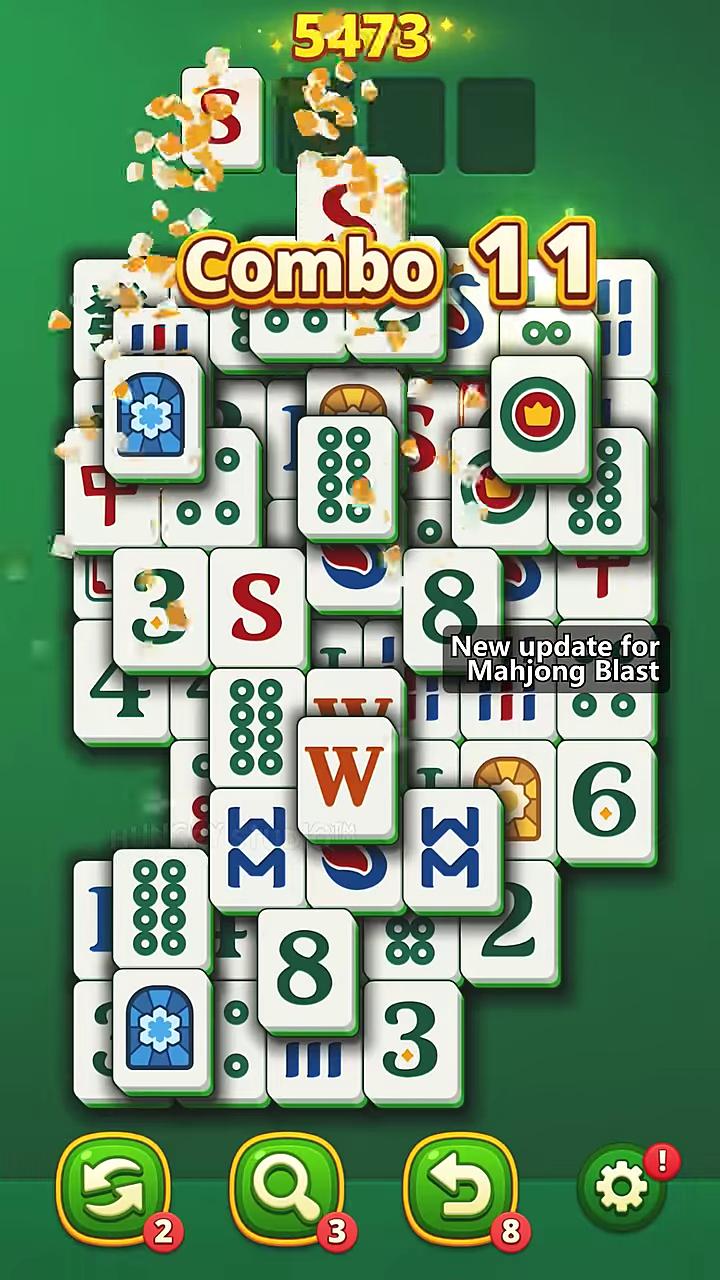 Creative #12 — 59 seconds, first seen 2026-04-30, 1,090,262 impressions at 14.6 per placement. The third of four 59-second videos, all of which land within 0.4 of each other on delivery rate.
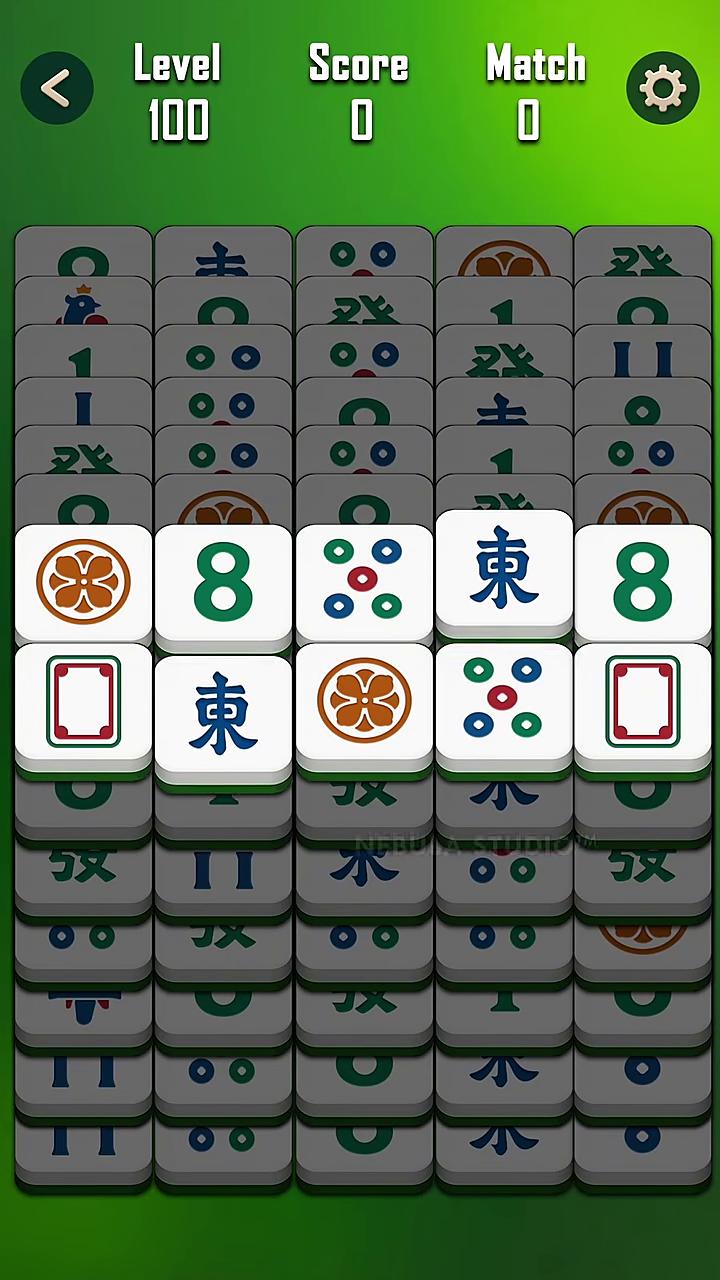 Creative #15 — 59 seconds, first seen 2026-07-03 during the summer sprint. 653,395 impressions at 15.0 per placement, the highest video rate in the fleet and still within 2.7% of the lowest.
What transfers to your UA program
If you run creative production: the most actionable finding here is that Nebula's videos have no variance. Six assets, four runtimes, three months of launch spread, and a 2.7% range in delivery rate. If your own video assets in a given channel are clustering that tightly, you are not testing creative — you are testing nothing, and the production budget going into new video variants is buying a known quantity. Nebula's response to that condition is the right one: it put 92.7% of its volume into the format that still has an outcome distribution.
If you run media buying: stop ranking fleets by placement count. Creative #2 here has 663,038 placements against creative #1's 339,688, and delivers a third as many impressions. Inside one account, one format, and one week of launch dates, presence and delivery diverged by 6.1x.
If you run competitive intelligence: resolve identity through the product record, never the app name. The store title on every one of these fifteen creative records is Mahjong Wonders™, and the product on the download chart is Mahjong Blast. Name-matching would have told you this advertiser has no US fleet. It has a 95.9-million-impression one.
If you are competing in mahjong: the two postures on the board are Vita Studio's uniform video machine at 967–1,117 impressions per placement and Nebula's bimodal playable operation at 14.6–272.3. They do not compete for the same inventory in the same way, and the smaller one is the one gaining downloads. If your creative pipeline can produce interactive units cheaply and at volume, Nebula's model is the one with a live example of upside attached to it this quarter.
A falsifiable prediction
Prediction: creative #1 will pass 120,000,000 cumulative impressions by 2026-11-01, and Nebula will ship at least two new playable creatives into the Mahjong Blast US fleet before 2026-10-01. Separately, no new Mahjong Blast video will record a delivery rate outside 13.5–16.5 impressions per placement in the next pull.
The basis: creative #1 recorded 56,551,902 impressions in the 30 days to 2026-08-19 and is 59.0% of its fleet; sustaining roughly that level across the next two 30-day windows clears 120 million cumulative with room to spare. On cadence, Nebula shipped seven creatives in sixteen days in June–July and its longest observed gap is 142 days, of which 46 have elapsed — two more playables inside six weeks is well within its demonstrated rate. On the video band, six of six current videos sit inside a 0.4-point range around 14.7 across a 4.1x runtime spread, which is the strongest regularity in the dataset.
The informative failure is the third clause. If a new video lands outside that band, it means Nebula has gained access to a different class of video inventory — which would be a bigger strategic event than any impression total in this article.
How to reproduce this teardown
- Resolve identity through the unified product record, not the app name. For this title, every creative's displayed app name differs from the charting product's name. Name-matching returns a wrong answer with high confidence, which is the dangerous kind.
- Split impressions-per-placement by format before you compute a fleet average. The 55.2 fleet figure here describes neither population: playables sit at 70.4 with an 11.25x internal spread, videos at 14.7 with a 1.027x spread.
- Look for a fixed rate. If a format's delivery rate is constant across runtimes and launch dates, that format is a fixed-yield channel and creative iteration inside it is not buying variance.
- Group by launch window and compare impressions per creative across cohorts. Nebula's June–July cohort averages 11.96 million per creative against 1.27 million for the batch before it — the account is effectively sixteen days old. Do not build this on a per-day rate when the impression field is a rolling window and the assets predate it.
- Rank by delivery, then check placement rank separately. The gap between the two is where the misreadings live.
- Check every last-observed date. Fifteen of fifteen live here, including three assets from autumn 2025 that produce 1.2% of output between them. Nothing is being retired.
Methodology and data notes
- Source: AdMapix creative search, unified product search and download ranking APIs, all queried 2026-08-19, country filter
US, creatives sorted by impressions descending. - Sample: the top 15 US creatives by impressions returned for unified product Mahjong Blast,
6747492600, publisher Nebula Studio, AdMapix company ID506904674. All fifteen resolve to product IDcom.nebula.mahjongtile(AdMapix company ID401431784, publisher string "Nebula Studio"), which the unified product record lists as one of four constituent product IDs alongside6747492600,com.yichao.mahjongandcom.yundas.majiong.samsung. The app name displayed on these creative records is Mahjong Wonders™, the Android build's store title. - Identity resolution: three unrelated products carry the same or near-identical names — Mahjong Blast : Tile Match (Mr. Glass), Lucky Mahjong Blast! (DongYing SmartEnergy) and Z188Lantern Mahjong Blast (IBEAS). None of their data appears in this article. A separate check confirmed that searches spanning 150 creative records for the term returned no creatives resolving to iOS app ID
6747492600directly; the measurable US fleet for this unified product runs on the Android package. - Measurement window. The
impressionfield is a rolling 30-day value, not a lifetime total. Verified directly: a default query returns figures identical to a query bounded bystart_date2026-07-20 /end_date2026-08-19, and shifting the start by one day changes every figure. All impression, placement and density figures here describe the 30 days ending 2026-08-19. - Correction: a removed metric. An earlier version carried an impressions-per-day column and reported the summer cohort producing 95.7% of "current daily output". Both have been removed. All fifteen creatives were first seen before 2026-07-20, so each had identical exposure inside the window; dividing by days-since-first-seen mixed a 30-day numerator with denominators of 46 to 305 days, and dividing by the window length instead makes any per-day share arithmetically identical to the impression share. Cohort comparisons now use impressions per creative.
- "Days live" is the span between first-observed and last-observed timestamps, measured to the pull date. All fifteen creatives recorded a last-observed timestamp of 2026-08-19 and are treated as live.
- "Placements" (
showCnt) counts recorded creative appearances, not unique users and not unique publishers. Impressions per placement is a distribution-shape indicator, not a frequency metric, and is not comparable across formats without stating the format — that is the central point of this teardown. - "Format" is derived from recorded video duration. Creatives with no duration and a recorded playable URL are classified as playable units. Several playable URLs are shared across multiple creative records.
- Vita Mahjong comparison figures — 15 creatives, 10,548,638,193 impressions, 15/15 live, 263-day average age, 467-day oldest asset, 967–1,117 impressions per placement across 14 of 15 creatives, and 13.0% pure-playable share — are cited from that title's teardown, pulled the same date. They were not recomputed here.
- Cross-format impression comparison between a 92.7%-playable fleet and an 87%-video fleet carries measurement risk: the two formats are not the same object and may not be counted equivalently. The Vita Mahjong comparison in this article is presented as a structural contrast, not as an efficiency ratio, and should not be converted into CPI or spend claims.
- Lifetime creative counts and lifetime impressions come from unified product records and are global, all-time figures — not US-only, not period-limited. They are used only for cross-product comparison of production intensity.
- Impressions are third-party modelled estimates, not publisher-reported figures and not spend.
- Download figures are US-region estimates for the current ranking period. Mahjong Blast appeared at position 148.
- Store listings: App Store and Google Play.
- Coverage is limited to creatives observable through third-party ad monitoring.
Frequently Asked Questions
How many ads is Mahjong Blast running in the US? Fifteen measurable creatives as of 2026-08-19, totalling 95,864,787 impressions across 1,737,454 placements, and all fifteen were still live on that date. The fleet averages 128.5 days of age, but seven of the fifteen were launched inside a single 16-day window in June and July 2026.
What is Mahjong Blast's best-performing ad creative? A playable unit first seen 2026-06-25, carrying 56,551,902 impressions across 339,688 placements in the 30 days to 2026-08-19 — 59.0% of the entire fleet, from an asset only 55 days old. It delivers 3.1 times the impressions of the next-largest entry.
Does Mahjong Blast use playable ads? Overwhelmingly. Nine playable units carry 88,857,333 impressions, or 92.7% of the fleet, against six videos' 7.3%. This is the highest playable concentration of any fleet measured in this series — Vita Mahjong, by comparison, runs 13.0% of its volume through pure interactive units.
Why are all of Mahjong Blast's video ads delivering at the same rate? The six videos deliver at 14.6, 14.6, 14.6, 14.8, 14.9 and 15.0 impressions per placement — a 2.7% total spread across runtimes from 29 to 119 seconds and launch dates spanning three months. That pattern indicates a fixed-yield inventory channel: whatever the creative is, the placement type returns roughly 14.7 impressions per recorded appearance. Nebula's playables, by contrast, range from 24.2 to 272.3 — an 11.25x spread inside a single format.
How does Mahjong Blast compare to Vita Mahjong? They are structural opposites in the same genre. Vita Mahjong's top fifteen creatives carry 10,548,638,193 impressions against Mahjong Blast's 95,864,787 — 110x apart — and Vita's fleet delivers within a 1.15x density band while Mahjong Blast's spans 18.65x. Vita is video-led with 13.0% pure-playable share; Mahjong Blast is 92.7% playable. Vita Mahjong's downloads are down 25.41%; Mahjong Blast's are up 13.77%. Cross-format impression totals should be compared with caution, since a playable-dominated fleet and a video-dominated one may not be measured equivalently.
Why do searches for Mahjong Blast return creatives for Mahjong Wonders?
Because com.nebula.mahjongtile, whose store title renders as Mahjong Wonders™, is one of four product IDs listed under the AdMapix unified product record for Mahjong Blast (6747492600, Nebula Studio). The Android build carries a different store title from the iOS build. Matching creatives to products by app name would incorrectly conclude that Mahjong Blast runs no measurable US advertising.
Is Mahjong Blast's newest ad creative working? The newest asset, a playable first seen 2026-07-04, delivered 2,803,570 impressions in the 30 days to 2026-08-19 — fourth-largest in the fleet. More broadly, the seven creatives launched between 2026-06-19 and 2026-07-04 hold 87.3% of the window's impressions and average 11.96 million each against 1.27 million for the batch before them, so the recent cohort is doing effectively all of the work.
Want to know whether your video channel has any variance left in it? Per-creative impressions, placement counts, exact runtimes, first-seen and last-seen dates and playable attachment are all live in AdMapix, filterable by country, publisher and product ID — with unified product resolution across iOS and Android, so a fleet hiding behind a different store title never goes missing. Create a free account to run this teardown on any title in your category, or see plans for full historical access.
Data source: AdMapix third-party ad intelligence estimates, United States, retrieved 2026-08-19. Impression and download figures are modelled estimates for comparative analysis and are not publisher-reported. Figures change as new creatives enter rotation.
Related Reading
- Ad strategy teardowns (series index) — every teardown in the series, in publication order
- Mobile game ads guide: formats, examples and research — the format matrix, research workflow and KPI guardrails every teardown in this series applies
- Block Craft 3D — A teardown of Wildlife Studios' Block Craft 3D: Building Games in the US
- Royal Smash! — 10.4B impressions built from zero in 47 days
- Smash Fest! — playable creatives in the observed US launch sample
Turn these observations into your next creative study
Open the creative library and select samples for your market, network and research question.
Related Articles
Century Games UA Playbook 2026: One Publisher, Three Titles, and a Playable-vs-Video Verdict That Reverses Between Them
A publisher-level teardown of Century Games Pte. Ltd. across Whiteout Survival, ملوك البقاء and Tasty Travels: Merge Game in the US. Forty-five ad entries account for 3,165,064,079 impressions in the 30 days to 2026-08-19. The finding is that this publisher has no single doctrine: the playable-versus-video verdict *reverses* between its own three titles, and the portfolio average describes none of them.
Royal Smash! Ad Strategy in 2026: How Cypher Games Built a 1.06-Billion-Impression Fleet From Zero in 47 Days
A creative-level teardown of Cypher Games' US user acquisition for Royal Smash! - Physics Puzzle. Thirty ad instances carry 1,063,337,540 impressions, none existed before 2026-07-03, and thirteen launched on one day. But those thirty instances resolve to only twelve videos and nine playables — one 30-second video appears in five of them. Downloads rose 260.93%, and the Android listing takes 53.8% of placements for 11.7% of impressions.
Magic Tiles 3 Ad Strategy in 2026: Two Store Listings, Two Completely Different Advertising Machines — and an August Fleet Swap That Is Half the Size It Looks
A fingerprint-deduplicated teardown of Amanotes' US user acquisition for Magic Tiles 3. Thirty ad instances carry 197,841,786 impressions in a 30-day window, but resolve to just seventeen videos and four playables — split across two systems sharing nothing: an iOS buy of six videos running up to 443 days at 131 impressions per placement, and an Android lab of eleven videos and four playables at 2,685. The early-August swap retired four assets and launched three, not eight and five.