
Arrows – Puzzle Escape Ad Strategy 2026: Downloads Fell 34.65% and One 214-Day Playable Is Carrying the Account
A creative-level teardown of Lessmore GmbH's US user acquisition for Arrows – Puzzle Escape during a 34.65% download decline. Fifteen measurable creatives account for 295,780,992 impressions in a rolling 30-day window, all fifteen were still live on 2026-08-19, and production has been stopped for 64 days. One playable first seen 2026-01-17 carries 49.5% of current delivery on its own, and a 345-day asset still out-delivers most of the fleet.
Lessmore GmbH's Arrows – Puzzle Escape lost 34.65% of its US downloads in the current ranking period — the steepest decline of any title we have torn down this month. Its advertising did not visibly retreat either. All fifteen measurable US creatives were still live on 2026-08-19 — but nothing new has entered the fleet since 2026-06-16, sixty-four days before this pull, and 49.5% of everything the account delivered in the last thirty days came from a single playable first seen 2026-01-17.
The fleet totals 295,780,992 impressions across 2,473,626 recorded placements — figures that describe a rolling 30-day window, not lifetime accumulation. A single playable unit, first observed 2026-01-17, carries 49.5% of that on its own.
This is what a download collapse looks like in an account that has stopped producing and is living off one old asset.
Executive summary (TL;DR)
- Nothing is switched off. 15 of 15 creatives recorded a last-observed timestamp of 2026-08-19, the pull date. Average age is 145.7 days; the oldest has been running 345 days.
- There is no youth premium. On a common 30-day denominator, creative #4 (64 days old) ranks fourth and creative #5 (70 days) sixth — exactly where their volume places them. The 345-day veteran ranks fifth, within 2.5% of the newest asset's rate.
- One playable is half the account. Creative #1, a playable first seen 2026-01-17, holds 146,499,031 impressions (49.5%) and 51.1% of all placements.
- Interactive beats video on volume, loses on rate. Two playables carry 53.9% of impressions; thirteen videos carry 46.1%. But playables deliver at 116.2 impressions per placement against video's 123.8 — the interactive units are broader and thinner.
- Delivery rate is nearly constant. Across all fifteen assets, impressions per placement ranges only from 115.9 to 133.9 — a 1.16x spread covering formats that differ by 30 seconds of runtime and 25x in volume.
- Production stopped 64 days ago. After shipping six creatives in a fourteen-day sprint in April 2026, Lessmore has added nothing since 2026-06-16. That is the second-longest gap in the fleet's observable history.
- The fleet is nine store packages deep. The AdMapix unified product record for Arrows – Puzzle Escape lists nine distinct product IDs across iOS and Android — a detail that breaks naive single-store tracking.
All figures are AdMapix third-party estimates for the United States, pulled 2026-08-19. Methodology and identity resolution at the end.
Which "Arrows" this is
This series has been burned by name collisions before, and Arrows is exactly the kind of generic title that produces them. A product search for the term returns at least four distinct games with near-identical names, published by four unrelated companies:
| Product | Unified product ID | Publisher | Lifetime creatives | Lifetime impressions |
|---|---|---|---|---|
| Arrows – Puzzle Escape | 6748397500 | Lessmore GmbH | 21,519 | 298,466,673,910 |
| Tap Arrows – Puzzle Escape | com.taparrows.escape.puzzle | Bibi taj | 1,871 | 880,446,326 |
| Twisted Arrows: Puzzle Escape | com.kite.twistedarrows | Kite Games AS | 1,599 | 20,026,427 |
| Dragon Arrows: Puzzle Escape | 6767087806 | Dinh Cong Son | 50 | 5,335,165 |
Everything in this teardown is locked to the first row: unified product 6748397500, publisher Lessmore GmbH, AdMapix company ID 67936039. Fourteen of the fifteen creatives resolve directly to iOS app ID 6748397500; the fifteenth resolves to Android package com.ecffri.arrows, which the same unified product record lists as one of its nine constituent product IDs.
Those nine IDs are worth listing, because they are the reason a single-store view of this advertiser is wrong:
com.ecffri.arrows · 6748397500 · com.arrow.esca.game · com.infinity.arrowspuzzleescape · com.elite.arrowspuzzle · com.tricky.arrowpuzzle.escape.out · com.arrows.puzzle.offlinegame · com.hsh.arrows · com.SinceraGame.Arrows
If you were tracking 6748397500 alone, or com.ecffri.arrows alone, you would be watching a fraction of a nine-package operation. The store listings are the App Store page and the Google Play listing; publisher information is at lessmore.io.
Where Arrows sits on the US download chart
On the US download rankings pulled the same day, Arrows – Puzzle Escape appears at position 81 with 946,669 downloads and a period-over-period change of -34.65%.
| Metric | Value |
|---|---|
| US download rank | 81 |
| Downloads (current period) | 946,669 |
| Period-over-period change | -34.65% |
| Publisher | Lessmore GmbH |
| iOS app ID | 6748397500 |
| AdMapix company ID | 67936039 |
For scale, the titles immediately around it in this teardown series tell you how unusual that number is. Vita Mahjong sits at position 54 with 1,256,369 downloads at -25.41%. Jewel Coloring is at 106 with 768,849 at +5.48%. Mahjong Blast is at 148 with 616,774 at +13.77%. Arrows is falling roughly nine percentage points faster than the worst of them.
The obvious hypothesis when downloads drop by a third is that spend was pulled. The creative data says the opposite happened.
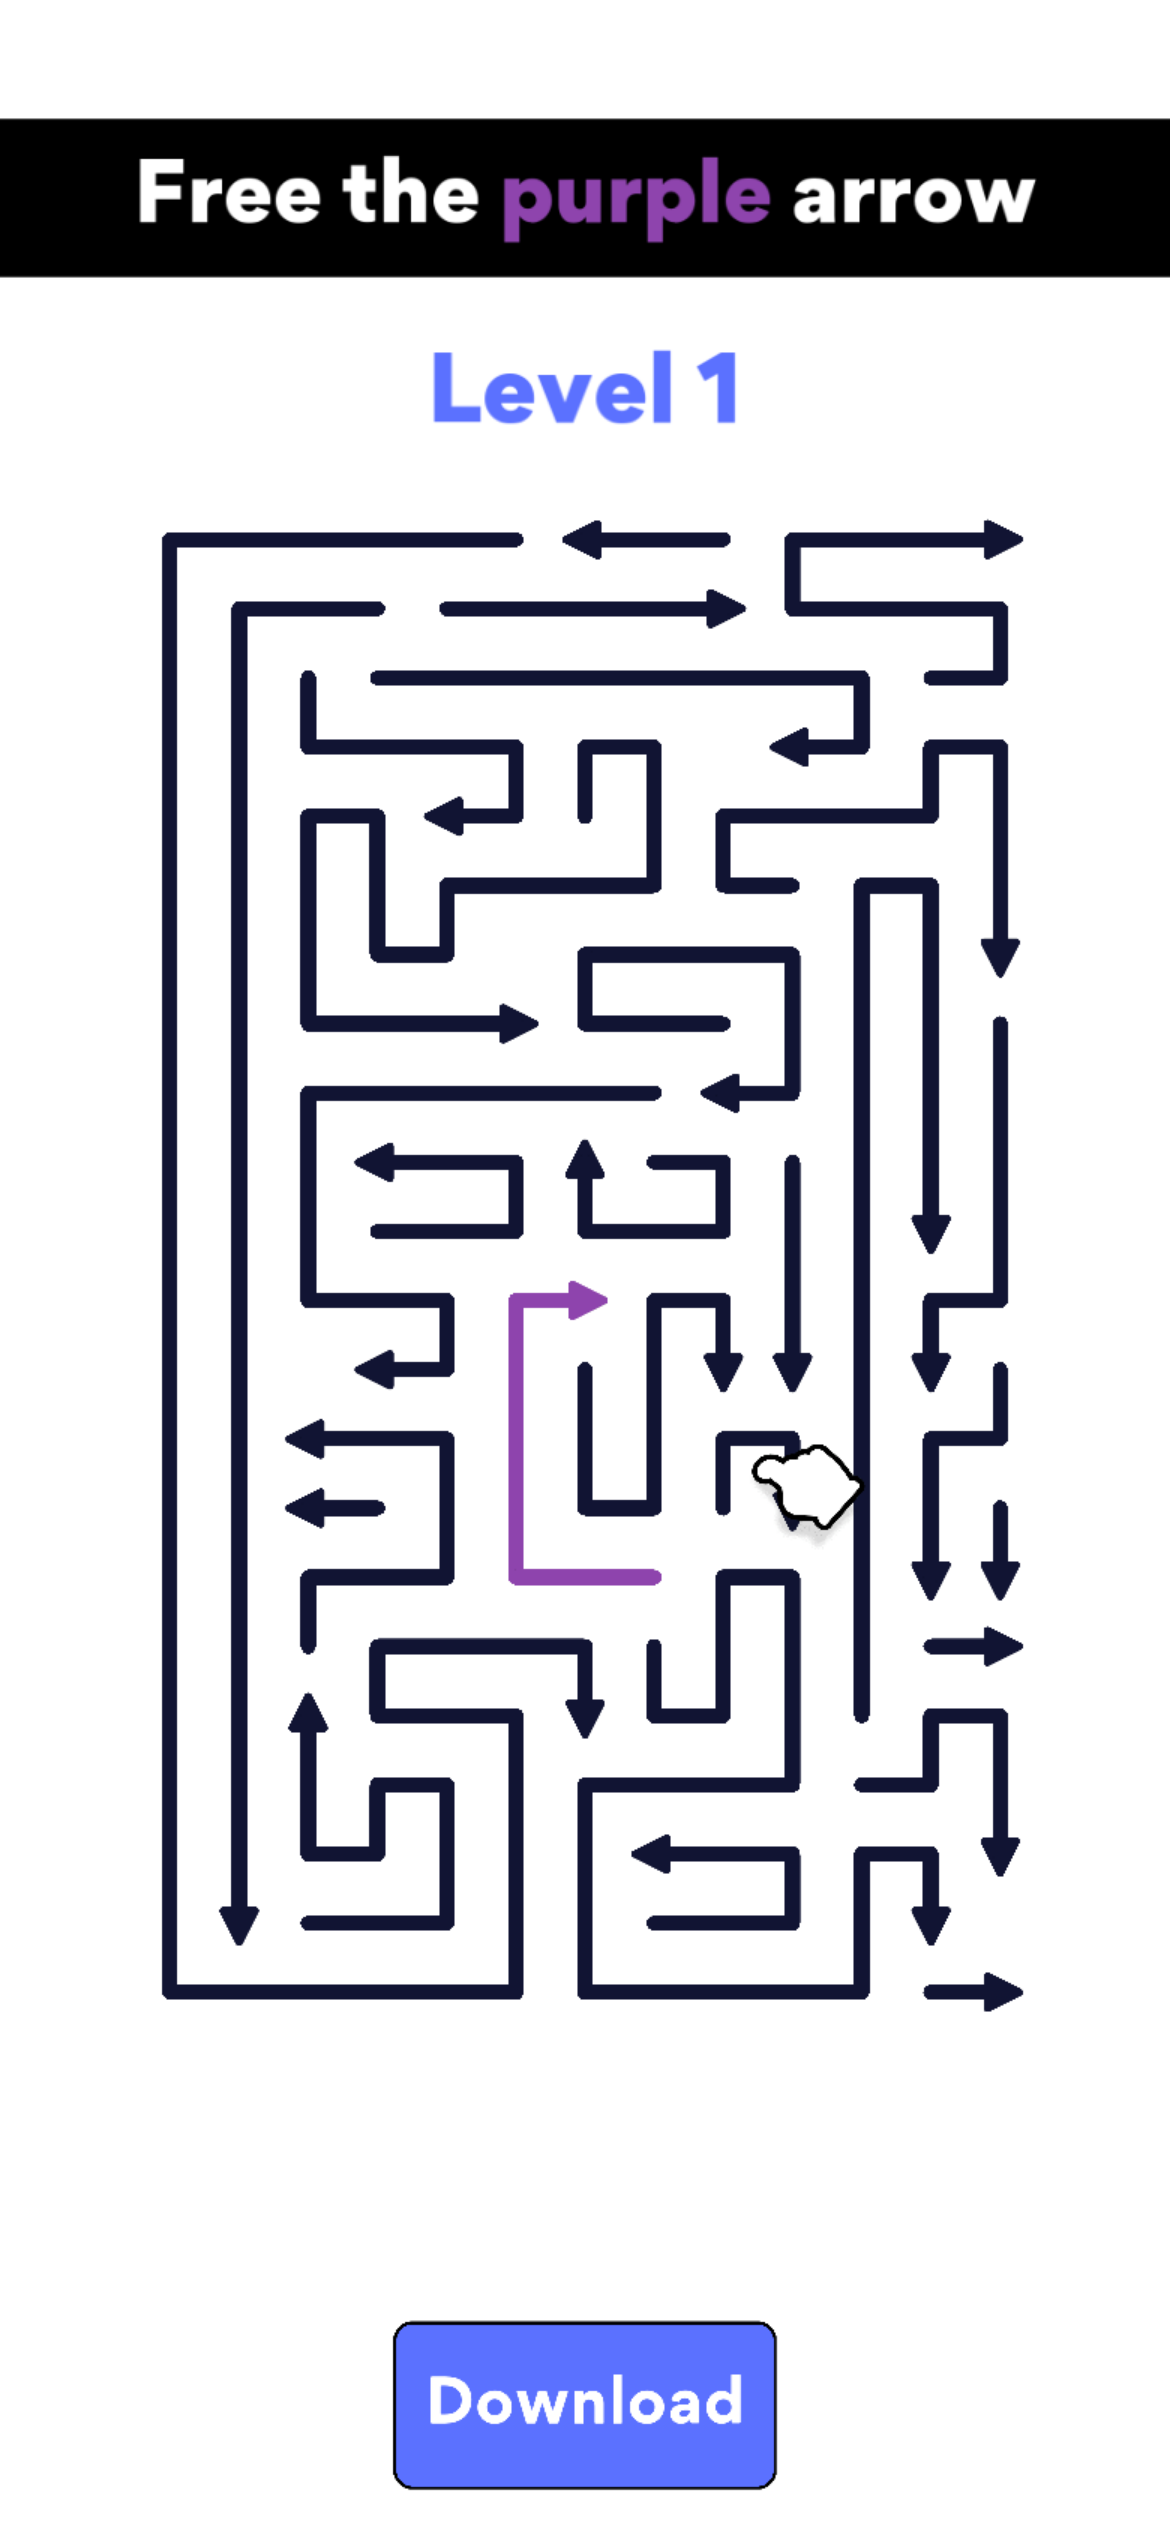 Creative #1 — a playable unit first seen 2026-01-17, still running after 214 days. 146,499,031 impressions across 1,263,589 placements: 49.5% of the fleet's impressions and 51.1% of its placements.
The fleet at a glance: fifteen creatives, fifteen live
| # | Impressions (30d) | Share | Placements | Impr/placement | First seen | Days live | Format |
|---|---|---|---|---|---|---|---|
| 1 | 146,499,031 | 49.5% | 1,263,589 | 115.9 | 2026-01-17 | 214 | playable |
| 2 | 28,453,524 | 9.6% | 237,472 | 119.8 | 2026-03-07 | 165 | 59s |
| 3 | 15,799,748 | 5.3% | 127,593 | 123.8 | 2026-04-19 | 122 | 58s |
| 4 | 13,281,195 | 4.5% | 107,787 | 123.2 | 2026-06-16 | 64 | 58s |
| 5 | 12,935,377 | 4.4% | 102,094 | 126.7 | 2026-06-10 | 70 | 59s |
| 6 | 12,915,156 | 4.4% | 108,566 | 119.0 | 2025-09-08 | 345 | playable |
| 7 | 10,453,800 | 3.5% | 83,146 | 125.7 | 2026-04-07 | 134 | 60s |
| 8 | 8,164,005 | 2.8% | 60,988 | 133.9 | 2026-05-28 | 83 | 30s |
| 9 | 7,676,776 | 2.6% | 60,264 | 127.4 | 2026-04-07 | 134 | 32s |
| 10 | 7,444,417 | 2.5% | 60,047 | 124.0 | 2026-01-17 | 214 | 59s |
| 11 | 6,921,491 | 2.3% | 56,424 | 122.7 | 2026-04-20 | 121 | 58s |
| 12 | 6,807,848 | 2.3% | 57,894 | 117.6 | 2026-04-07 | 134 | 60s |
| 13 | 6,625,652 | 2.2% | 56,529 | 117.2 | 2026-04-16 | 125 | 60s |
| 14 | 5,957,420 | 2.0% | 45,443 | 131.1 | 2026-02-22 | 178 | 30s |
| 15 | 5,845,552 | 2.0% | 45,790 | 127.7 | 2026-05-29 | 82 | 30s |
| Total | 295,780,992 | 100% | 2,473,626 | 119.6 | — | 145.7 avg | — |
Three things fall out of this table immediately.
First, the concentration. Creative #1 alone is 49.5%; the top two are 59.1%; the top five are 73.4%. The bottom ten creatives combined deliver 26.6% — less than the leader by a factor of two.
Second, the uniformity of the impressions-per-placement column. Every value sits between 115.9 and 133.9. That is a 1.16x spread across assets that range from a 30-second video to a playable, and from 5.8 million to 146.5 million impressions.
Third, and most importantly: the two rightmost columns disagree with each other. The impressions column says creative #1 is the account. The impressions-per-day column says creatives #4 and #5 — both under 71 days old — are outrunning everything except #1.
What the impressions column actually measures — and why it kills a tempting finding
Before ranking anything by "rate", one property of this dataset has to be stated, because getting it wrong manufactures a finding out of nothing.
The impression value is a rolling 30-day window, not a lifetime total. Verified by parameter sweep: the default query returns exactly what start_date=2026-07-20&end_date=2026-08-19 returns, and widening the range raises the number. So the 146,499,031 attributed to creative #1 is its delivery in the last thirty days, not since 2026-01-17.
That single fact invalidates the most natural analysis to run here. Dividing a 30-day number by "days live" gives a 214-day asset a denominator seven times too large and a 64-day asset a denominator roughly twice too large, while leaving anything under 30 days untouched. The arithmetic systematically flatters young creatives. Any fleet processed this way will appear to show its newest assets outperforming — including fleets where nothing of the kind is happening.
An earlier version of this teardown ran exactly that calculation and reported that Arrows' two newest creatives ranked second and third in the account by daily delivery. That result does not survive the correction and has been removed.
Every one of Arrows' fifteen creatives was first seen before 2026-07-20, so all fifteen were exposed to exactly the same 30.6-day window. Recomputing per-day figures on that shared denominator simply divides the impressions column by a constant, which reproduces the impressions ranking exactly. This article therefore does not publish a per-day column at all — it would carry no information the impressions column does not already carry.
Two things follow from that, and both are more useful than the finding that was lost.
Creative #4, at 64 days, is the fourth-largest asset — not the second-fastest. It sits precisely where its volume puts it. There is no youth premium in this account.
Creative #6, at 345 days, is the fifth-largest. Under the flawed method it appeared thirteenth of fifteen, which invited the reading that it survives on inertia. It does not: across the same thirty days it delivered 12,915,156 impressions against creative #4's 13,281,195 — a 2.8% gap between a 345-day asset and a 64-day one.
So the honest version of this account's shape is the opposite of the one the bad arithmetic produced. Arrows is not being carried by fresh creative. It is being carried by a 214-day-old playable that supplies 49.5% of current delivery, supported by a 345-day-old asset that is still competitive with the newest thing in the fleet — while production has been stopped for 64 days and downloads have fallen 34.65%.
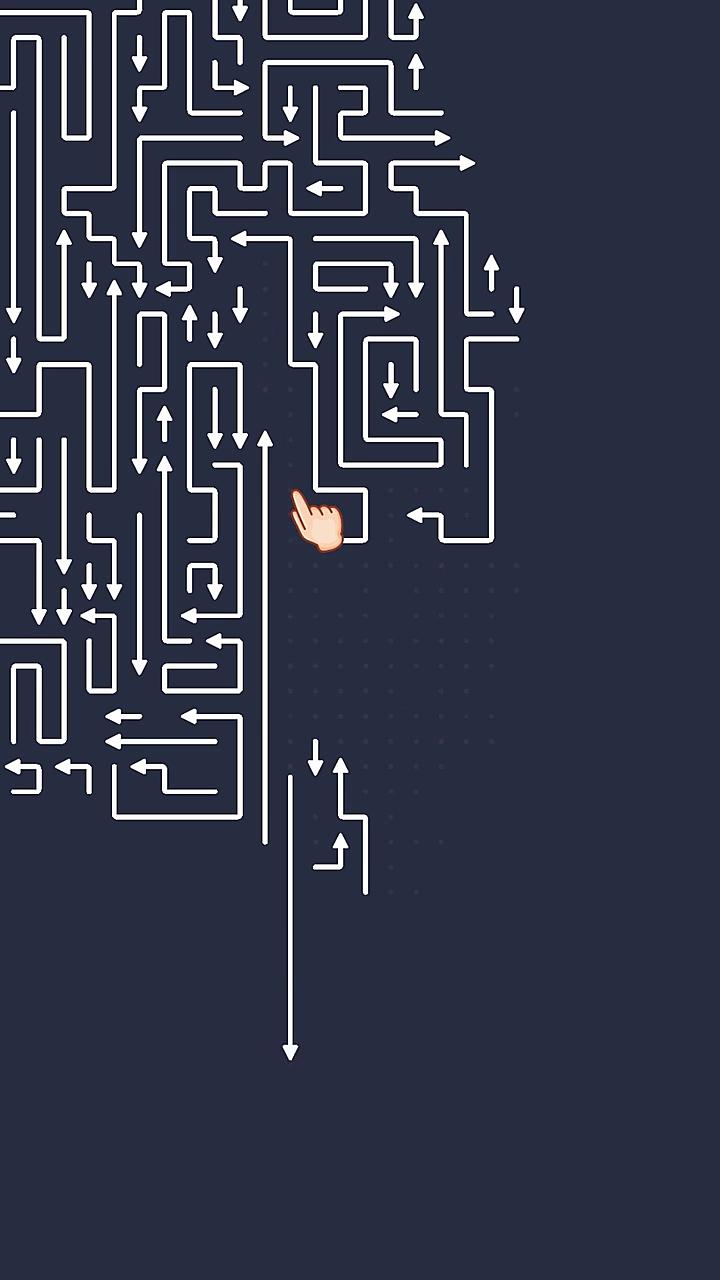 Creative #4 — 58 seconds, first seen 2026-06-16, 64 days live, 13,281,195 impressions in the 30-day window. Fourth-largest in the account — exactly where its volume places it. This is the fleet's single 58-second video master, running under three separate delivery rows (#3, #4 and #11) with a different playable end card on each.
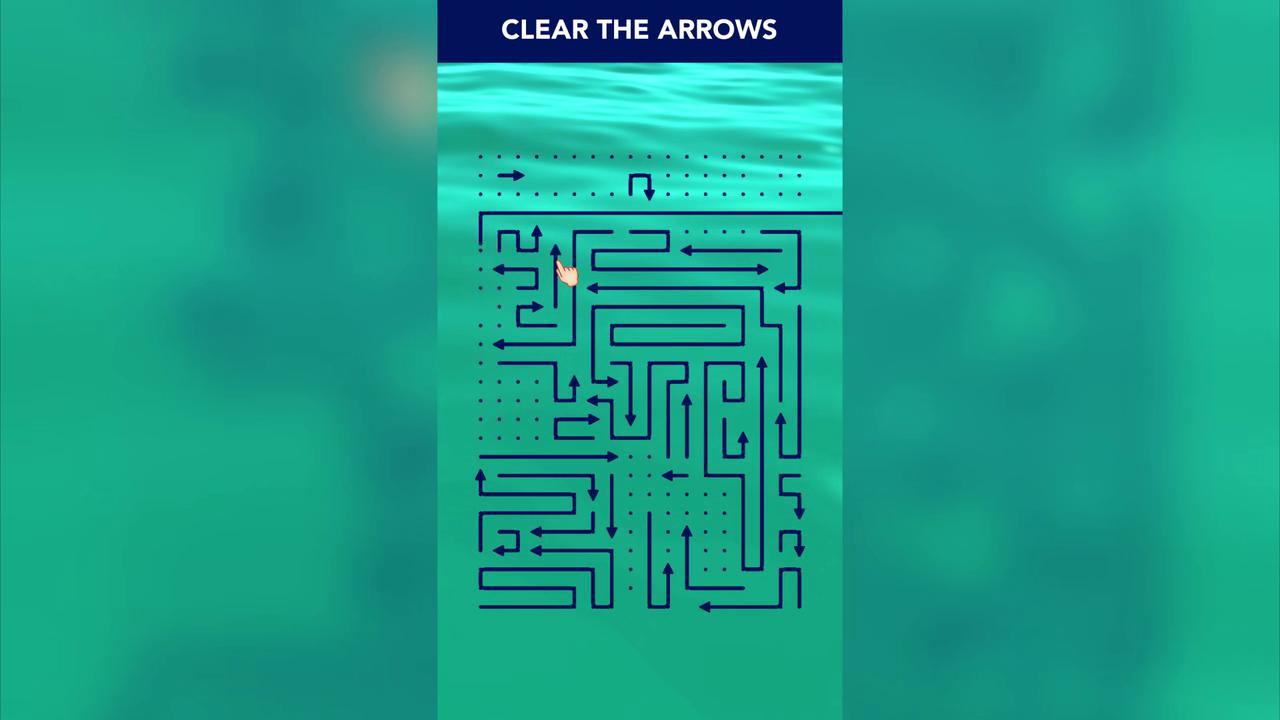 Creative #5 — 59 seconds, first seen 2026-06-10, 70 days live, 12,937,508 impressions in the 30-day window — sixth in the fleet. It is one of only two creatives with no playable attachment recorded.
The half-account playable
Creative #1 deserves its own section because of how lopsided it is. First observed 2026-01-17, it has run continuously for 214 days and accumulated:
- 146,499,031 impressions — 49.5% of the fleet
- 1,263,589 placements — 51.1% of the fleet
- 146,499,031 impressions in the 30-day window — 5.1x the next-largest asset
- 115.9 impressions per placement — the lowest rate in the entire fleet
That last line is the interesting one. The account's biggest asset by a distance is also its least dense per placement. It is not being served harder than anything else; it is being served in more places than everything else combined.
That profile — enormous placement count, floor-level density — is what a genuinely broad-reach unit looks like. Lessmore is not concentrating this creative into premium inventory. It is pushing it everywhere the auction will accept it, and the sheer breadth is producing the volume.
There is a second playable in the fleet, creative #6, and its numbers underline the point by contrast. Same format, 345 days of runtime — 131 days longer than #1 — and 12,915,156 impressions. Creative #1 produced more impressions in its first three weeks than #6 has produced in eleven months.
| Creative #1 | Creative #6 | |
|---|---|---|
| Format | playable | playable |
| First seen | 2026-01-17 | 2025-09-08 |
| Days live | 214 | 345 |
| Impressions | 146,499,031 | 12,915,156 |
| Placements | 1,263,589 | 108,566 |
| Impressions per placement | 115.9 | 119.0 |
| Share of window impressions | 49.5% | 4.4% |
Identical format, near-identical delivery density, 18.3x difference in daily output. Whatever separates these two units, it is not the mechanics of how they are bought. It is the creative itself.
 Creative #6 — the fleet's oldest asset, first seen 2025-09-08 and still recording placements 345 days later. 12,974,766 impressions in the 30-day window — fifth in the fleet, and within 2.5% of the newest asset's rate despite running 281 days longer. This playable is also attached to creatives #7 and #9.
Format: three shapes, one delivery rate
Arrows ships in three clearly separated shapes: long video (58–60 seconds), short video (30–32 seconds), and playable. The volume split is decisive, the rate split is not.
Before reading the table, one counting note. Each row returned by the creative index is a delivery record, not necessarily a distinct video file. Several rows here carry the same videoFp under different playable end cards — so the fifteen rows are not fifteen creatives. They are nine video masters and seven playable masters, recombined. The impression figures are unaffected by this (each row's delivery is its own), but the asset counts are, so both are shown.
| Format band | Rows | Video masters | Impressions | Share | Impr/placement |
|---|---|---|---|---|---|
| Playable | 2 | — | 159,414,187 | 53.9% | 116.2 |
| 59s | 3 | 2 | 48,833,318 | 16.5% | 122.2 |
| 58s | 3 | 1 | 36,002,434 | 12.2% | 123.4 |
| 60s | 3 | 2 | 23,887,300 | 8.1% | 120.9 |
| 30s | 3 | 3 | 19,966,977 | 6.8% | 131.2 |
| 32s | 1 | 1 | 7,676,776 | 2.6% | 127.4 |
The 58-second band is the sharpest case: three delivery rows, one video file. A single video master runs under three different playable end cards, and together those three rows deliver 36,002,434 impressions. Read as "three 58-second creatives," that is a production claim the data does not support. The 30-second band is the opposite — three rows, three genuinely distinct videos.
Collapsing that into the three real families:
| Family | Rows | Video masters | Impressions | Share | Impr/placement |
|---|---|---|---|---|---|
| Playable | 2 | — | 159,414,187 | 53.9% | 116.2 |
| Long video (58–60s) | 9 | 5 | 108,723,052 | 36.8% | 122.2 |
| Short video (30–32s) | 4 | 4 | 27,643,753 | 9.3% | 130.1 |
Nine long-video rows resolve to five video files; four short-video rows resolve to four. Lessmore's long-form output is roughly half as varied as a row count suggests, and its short-form output is exactly as varied as it looks.
Two readings sit on top of each other here.
On volume, the playable wins outright — two playable rows out-deliver nine long-video rows and four short-video rows combined. But that entire result is creative #1. Remove it and the remaining playable is 4.4% of the fleet, comfortably behind the long-video family.
On rate, the ordering reverses and compresses. Short video is the densest format at 130.1 impressions per placement, long video sits at 122.2, and playables sit at the floor with 116.2. The spread from best to worst format is 1.12x. That is smaller than the spread you would get from measurement noise in most panels.
The practical read: Lessmore's format mix determines where its ads can appear, not how hard they get pushed once they are there. Interactive units unlock high-volume inventory. They do not earn a higher density inside it.
 Creative #7 — 60 seconds, first seen 2026-04-07, 10,453,800 impressions at 125.7 per placement. One of three rows launched on the same day in the April sprint. It shares its 60-second video master with row #12.
 Creative #9 — 32 seconds, first seen 2026-04-07, 7,676,776 impressions at 127.4 per placement. Launched the same day as two 60-second creatives, giving a same-day long-versus-short comparison inside the fleet.
The 2026-04-07 experiment: same day, half the runtime
Three creatives entered the fleet on 2026-04-07: two 60-second cuts and one 32-second cut. Because they launched together and have therefore been exposed to the same 134 days of auction conditions, this is a usable natural experiment.
| Creative | Duration | Impressions (30d) | Placements | Impr/placement |
|---|---|---|---|---|
| #7 | 60s | 10,453,800 | 83,146 | 125.7 |
| #9 | 32s | 7,676,776 | 60,264 | 127.4 |
| #12 | 60s | 6,807,848 | 57,894 | 117.6 |
The two 60-second creatives differ from each other by 1.54x on impressions. The 32-second creative lands between them. If runtime were doing meaningful work, you would expect the two same-length cuts to cluster and the odd length to separate. The opposite happened: the two matched-length assets are the two extremes, and the mismatched one sits in the middle.
Nine days later, on 2026-04-16, Lessmore shipped another 60-second cut (#13, 6,625,652 impressions). Three days after that, a 58-second cut (#3, 15,799,748). One day after that, another 58-second cut (#11, 6,921,491).
Six creatives in fourteen days, spanning 32 to 60 seconds, producing a 2.3x spread in outcomes with no relationship to length. Within this account, the variance lives in the creative, not the timeline.
 Creative #13 — 60 seconds, first seen 2026-04-16, 6,625,652 impressions at 117.2 per placement. The fourth of six creatives shipped during the fourteen-day April sprint.
The launch calendar: one long silence, one sprint, and 64 days of nothing
Sorted by first-seen date, the fleet's build order is uneven in a way the impressions table completely hides.
| First seen | Creative | Format | Impressions | Gap since previous |
|---|---|---|---|---|
| 2025-09-08 | #6 | playable | 12,915,156 | — |
| 2026-01-17 | #1 | playable | 146,499,031 | +131d |
| 2026-01-17 | #10 | 59s | 7,444,417 | same day |
| 2026-02-22 | #14 | 30s | 5,957,420 | +36d |
| 2026-03-07 | #2 | 59s | 28,453,524 | +13d |
| 2026-04-07 | #7 | 60s | 10,453,800 | +31d |
| 2026-04-07 | #9 | 32s | 7,676,776 | same day |
| 2026-04-07 | #12 | 60s | 6,807,848 | same day |
| 2026-04-16 | #13 | 60s | 6,625,652 | +9d |
| 2026-04-19 | #3 | 58s | 15,799,748 | +3d |
| 2026-04-20 | #11 | 58s | 6,921,491 | +1d |
| 2026-05-28 | #8 | 30s | 8,164,005 | +38d |
| 2026-05-29 | #15 | 30s | 5,845,552 | +1d |
| 2026-06-10 | #5 | 59s | 12,935,377 | +12d |
| 2026-06-16 | #4 | 58s | 13,281,195 | +6d |
| 2026-08-19 | (pull date) | — | — | +64d |
Grouped by month, the picture sharpens:
| Cohort | Creatives | Impressions (30d) | Share of fleet |
|---|---|---|---|
| 2025 (Sep) | 1 | 12,915,156 | 4.4% |
| 2026 Jan | 2 | 153,943,448 | 52.0% |
| 2026 Feb | 1 | 5,957,420 | 2.0% |
| 2026 Mar | 1 | 28,453,524 | 9.6% |
| 2026 Apr | 6 | 54,285,315 | 18.4% |
| 2026 May | 2 | 14,009,557 | 4.7% |
| 2026 Jun | 2 | 26,216,572 | 8.9% |
The June cohort is two creatives. The April cohort is six. The two June assets are already producing 92% of the daily output of the six April assets, having existed for less than half as long.
And then it stops. The most recent creative entered the fleet on 2026-06-16, sixty-four days before this pull. In a fleet whose observable history contains a 131-day silence followed by a five-month burst of fourteen creatives, a 64-day gap is the second-longest quiet period on record.
Two facts now sit next to each other: downloads at -34.65%, and no new creative in 64 days. That combination is the thing to watch, and we come back to it below.
 Creative #2 — 59 seconds, first seen 2026-03-07, 28,453,524 impressions and the largest video asset in the fleet. It shares its 59-second video master with row #10, first seen 2026-01-17, which has delivered 3.8x less over 49 more days — the same video file, two delivery records, two very different outcomes.
The 119.6 constant
Across the whole fleet, impressions per placement averages 123.7 unweighted and 119.6 volume-weighted, with a total range of 115.9 to 133.9.
Set that against the other US fleets pulled on the same date:
| Fleet | Assets | Impr/placement (fleet) | Range | Spread |
|---|---|---|---|---|
| Block Out! (Play Time Games / Grand Games) | 10 | 2,617.1 | — | — |
| Magic Sort! (Grand Games) | 10 | 1,496.3 | — | — |
| Meowdoku! (Oakever Games) | 10 | 1,184.1 | — | — |
| Pixel Flow! (Loom Games) | 10 | 886.0 | — | — |
| Arrows – Puzzle Escape (Lessmore) | 15 | 119.6 | 115.9–133.9 | 1.16x |
Arrows runs at roughly one-tenth the placement density of the Turkish puzzle publishers and one-seventh of Pixel Flow!. That is not a performance judgement — impressions per placement is a distribution-shape indicator, not a quality metric. It says Arrows is being served across a far wider, far thinner set of surfaces than its genre peers.
Combine that with the near-total absence of variance across its own fifteen assets and you get a specific operating picture: one global buying configuration, applied to every creative, aimed at maximum breadth. The auction decides how many placements each asset gets. Nothing in the account decides how densely any of them is served.
For a puzzle title chasing volume at low CPI, that is a coherent strategy. It also means Lessmore has exactly one lever available — which creative to add next — and it has not pulled it in 64 days.
Same-genre benchmark: impressions per creative
The metric that best separates production strategies is lifetime impressions divided by lifetime creative count. It answers a simple question: does this publisher win by making a few things that work, or by making a great many things?
| Product | Publisher | Lifetime creatives | Lifetime impressions | Impressions per creative |
|---|---|---|---|---|
| Magic Sort! | Grand Games | 4,866 | 172,778,367,616 | 35,507,268 |
| Arrows – Puzzle Escape | Lessmore GmbH | 21,519 | 298,466,673,910 | 13,869,914 |
| Pixel Flow! | Loom Games | 16,562 | 213,359,297,665 | 12,882,460 |
| Vita Mahjong | Vita Studio | 137,819 | 1,178,822,561,715 | 8,553,411 |
| Meowdoku! | Oakever Games | 26,545 | 111,513,773,113 | 4,200,933 |
| Jewel Coloring | Ta Ta Game Technology | 3,358 | 9,343,780,794 | 2,782,543 |
| Paint by Number Coloring Games | Oakever Games | 37,691 | 64,478,630,793 | 1,710,717 |
| Mahjong Blast | Nebula Studio | 41,370 | 50,148,648,448 | 1,212,198 |
Arrows ranks second of eight on this measure. Lessmore has produced 21,519 distinct creatives over the product's lifetime — a substantial library, six times Jewel Coloring's — and each one has averaged 13.9 million impressions. Only Grand Games, which runs a deliberately small library at very high intensity, does better.
That is a meaningful counterweight to the download story. A publisher averaging 13.9 million impressions per creative is not struggling to get its assets distributed. Whatever is driving the -34.65% sits downstream of impressions.
 Creative #8 — 30 seconds, first seen 2026-05-28, the only asset in the top fifteen that resolves to the Android package
 com.ecffri.arrows rather than iOS app ID 6748397500. At 133.9 impressions per placement it is also the densest creative in the fleet.
Cross-platform: why fourteen-plus-one matters
Fourteen of the fifteen top creatives resolve to iOS app ID 6748397500 under AdMapix company ID 67936039. One — creative #8 — resolves to Android package com.ecffri.arrows under company ID 165326364.
| Product ID | Company ID | Creatives | Impressions | Share | Impr/placement |
|---|---|---|---|---|---|
| 6748397500 (iOS) | 67936039 | 14 | 287,616,987 | 97.2% | 119.2 |
| com.ecffri.arrows (Android) | 165326364 | 1 | 8,164,005 | 2.8% | 133.9 |
Two different AdMapix company IDs, one publisher name. This is a recurring pattern in the dataset — platform builds of the same title are indexed under separate company records — and it is a trap for anyone building competitive tracking on developer-name matching.
For Arrows the practical impact on this teardown is small: 97.2% of measured impressions sit on one ID. But the unified product record lists nine product IDs, so the top-fifteen view is necessarily partial. What the nine-package structure tells you is that Lessmore, or partners running the title, are distributing across a wide set of store entries — the kind of footprint you build when you are optimising for reach across storefronts and channels rather than defending a single canonical listing.
The rule for competitive analysts: resolve to the unified product before you count anything. Matching on the app name, the developer name, or a single store ID will each give you a different and wrong answer.
 Creative #15 — 30 seconds, first seen 2026-05-29, one day after creative #8. 5,845,552 window impressions at 127.7 per placement. Part of the short-video family that delivers at the highest density in the fleet.
 A static image asset attached to creative #15. Arrows is one of the few titles in this series where a still image appears alongside a short-form video in the same creative record.
Reading the contradiction
The core tension in this dataset is straightforward to state and hard to resolve from creative data alone. Downloads are down 34.65%, and nothing new has entered the fleet in 64 days — yet all fifteen assets were still live on the pull date and the account still moved 295.8 million impressions in the last thirty days, half of them through one 214-day-old playable.
There are three readings that fit the evidence.
Reading one: the funnel broke below the impression. Impressions are being bought and served at a healthy rate; they are converting to installs at a worse rate than they were. Causes could be store-listing changes, price or monetisation changes, an app update that hurt ratings, or simple audience saturation after nine months of broad-reach buying at 119.6 impressions per placement. Nothing in creative data distinguishes between them, but all of them would look exactly like this.
Reading two: the comparison period is the problem. A -34.65% change is a comparison against a prior period. If that prior period contained a spike — a featuring, a viral moment, a seasonal peak — then the current number is a return to baseline rather than a decline. The fleet's own history is suggestive here: creative #1 launched 2026-01-17 and still supplies 49.5% of everything the account delivers. A single asset of that scale entering the market in January could easily have produced a Q1 peak that Q3 is now being measured against.
Reading three: the 64-day gap is the leading indicator. Lessmore shipped fourteen creatives between January and June 2026, then nothing. If the pause reflects a decision to stop investing, the download decline is the early consequence and the delivery rate will follow it down over the autumn. The counter-evidence is that the last two creatives shipped before the pause are the fastest new assets in the fleet — that is not what a team disengaging usually leaves behind.
The three readings make different predictions, which is what makes them testable. Reading one predicts delivery holds and downloads keep falling. Reading two predicts downloads flatten near the current level. Reading three predicts delivery falls to meet the downloads.
What transfers to your UA program
If you run media buying: before computing any rate, confirm what period your impression figures cover. Arrows' impression table and its rate table disagree on which creatives matter, and the rate table is the one describing the present. Ranking a fleet by cumulative impressions systematically over-weights whatever launched first.
If you run competitive intelligence: check what window your impression numbers cover before you compute a rate from them. Here the figure is a rolling 30 days, so dividing it by lifetime days manufactures a youth premium that does not exist — it turned a fleet living off a 214-day playable into one that looked like it was accelerating on fresh creative. The correct read of this account is that fifteen of fifteen creatives are live, nothing new has shipped in 64 days, and half of current delivery rests on a single old asset.
If you run creative production: the six creatives Lessmore shipped in fourteen days in April span 32 to 60 seconds and produced a 2.3x spread in outcomes with no relationship to runtime. Meanwhile creative #1 and creative #6 are the same format with an 18.3x difference in daily output. The variance in this account lives entirely in what is inside the creative, not in its specifications. Spend your review cycles accordingly.
If you are competing with Lessmore in puzzle: the exploitable structure is the density. At 119.6 impressions per placement against a genre peer group running 886 to 2,617, Arrows is buying breadth rather than depth. That means it is present in a great deal of low-density inventory and comparatively thin in the places where a competitor concentrating spend can dominate share of voice.
A falsifiable prediction
Prediction: creative #1 (the 2026-01-17 playable) will still be live on 2026-12-01, and at least one new creative will enter the Arrows US fleet before 2026-10-15. Additionally, creative #4's 30-day window impressions will still exceed 10,000,000 on 2026-10-31.
The basis: Lessmore has retired nothing in the eleven months of observable history — all fifteen assets, including a 345-day playable, were live on the pull date. A 64-day production gap is long for this account but shorter than the 131-day gap it already survived once, so a resumption inside eight more weeks is the conservative call. And creative #4 currently records 13,281,195 impressions per 30-day window, so a threshold of 10 million leaves room for a 25% decline before the prediction fails.
The informative failure mode is the middle clause. If no new creative appears by 2026-10-15, that pushes the gap past 120 days and makes reading three — genuine disengagement — much more likely than the other two. We will re-pull and report either way.
How to reproduce this teardown
- Resolve the entity before you count anything. Search the product name, read the unified product record, and note every constituent product ID. For Arrows that is nine IDs across two platforms, and three unrelated games with confusingly similar names.
- Pull placement counts alongside impressions. The uniform 1.16x delivery-rate band — the single clearest structural feature of this account — is invisible in an impressions-only view.
- Do not re-rank by impressions per day unless the assets differ in window exposure. Where every asset predates the window, that division only re-sorts by age. It takes one division and it changes the conclusion.
- Establish what window the impression field covers before computing any rate. Sweep
start_date/end_dateand compare against the default response. If the default is a fixed rolling window — 30 days here — then dividing by lifetime days is invalid, and the only sound per-day comparison uses that same window as the denominator for every asset. - Check the last-observed date on every asset individually. "Still running" and "ran once" look identical in a total. Here all fifteen were live, which is itself the finding.
- Measure the gap since the newest creative. Time since last launch is a leading indicator that no impression metric contains.
Methodology and data notes
- Source: AdMapix creative search, unified product search and download ranking APIs, all queried 2026-08-19, country filter
US, creatives sorted by impressions descending. - Sample: the top 15 US creatives by impressions for unified product Arrows – Puzzle Escape,
6748397500, publisher Lessmore GmbH, AdMapix company ID67936039. Fourteen resolve to iOS app ID6748397500(company67936039); one resolves to Android packagecom.ecffri.arrows(company165326364). The unified product record lists nine constituent product IDs in total, so this sample is a top-of-fleet view rather than a complete inventory. - Identity resolution: at least three unrelated products carry near-identical names — Tap Arrows – Puzzle Escape (Bibi taj), Twisted Arrows: Puzzle Escape (Kite Games AS) and Dragon Arrows: Puzzle Escape (Dinh Cong Son). None of their data appears anywhere in this article. Every figure was checked against product ID and company ID, not app name.
- "Days live" is the span between the first-observed and last-observed timestamps, measured to the pull date. All fifteen creatives recorded a last-observed timestamp of 2026-08-19 and are treated as live.
- "Placements" (
showCnt) counts recorded creative appearances, not unique users and not unique publishers. Impressions per placement is a distribution-shape indicator; the absolute value is only meaningful when compared across creatives measured the same way. - "Format" is derived from the recorded video duration. Creatives with no duration and a recorded playable URL are classified as playable units. Two creatives (#5 and #15, plus #14) recorded no playable attachment.
- Lifetime creative counts and lifetime impressions in the benchmark tables come from unified product records and are global, all-time figures — not US-only and not period-limited. They are used only for cross-product comparison of production intensity, never mixed with the US period figures elsewhere in this article.
- Impressions are third-party modelled estimates, not publisher-reported figures and not spend. They support relative comparison and should not be converted to dollar values.
- Download figures are US-region estimates for the current ranking period, from the same-day download ranking pull. Arrows appeared at position 81.
- Store listings: App Store and Google Play. Publisher: lessmore.io.
- Coverage is limited to creatives observable through third-party ad monitoring. Assets running exclusively on channels outside that coverage do not appear.
Frequently Asked Questions
How many ads is Arrows – Puzzle Escape running in the US? Fifteen measurable creatives as of 2026-08-19, totalling 295,780,992 impressions across 2,473,626 placements, and all fifteen were still live on that date. The fleet averages 145.7 days of age, with the oldest asset running 345 days and the newest 64.
What is Arrows – Puzzle Escape's best-performing ad creative? A playable unit first seen 2026-01-17, carrying 146,499,031 impressions across 1,263,589 placements — 49.5% of all fleet impressions and 51.1% of all placements. That is 5.1 times the next-largest asset in the same window.
Did Arrows – Puzzle Escape cut its ad spend when downloads fell 34.65%? No retirement appears in the creative data — all fifteen measurable creatives were live on the pull date. But no addition appears either: nothing new has entered the fleet since 2026-06-16, sixty-four days before the pull, and 49.5% of the last thirty days of delivery came from a single 214-day-old playable. An earlier version of this article claimed the newest assets were outrunning the fleet; that rested on dividing a 30-day impression figure by lifetime days and has been withdrawn. This is not the profile of an accelerating fleet, not a contracting one.
Why do all of Arrows' creatives deliver at almost the same rate? Impressions per placement across the fifteen assets ranges only from 115.9 to 133.9, a 1.16x spread. That pattern indicates a single global buying configuration applied across the fleet: the auction determines how many placements each creative receives, but nothing in the account varies how densely any individual asset is served.
Does Arrows use playable ads? Yes, and they carry the majority of volume. Two playable units account for 53.9% of fleet impressions, though 49.5 of those 53.9 percentage points come from a single asset. Playables also deliver at the lowest density in the fleet — 116.2 impressions per placement against 130.1 for short video — meaning they unlock broad inventory rather than intense inventory.
Has Lessmore stopped making new creatives for Arrows? It has paused. Fourteen creatives entered the fleet between 2026-01-17 and 2026-06-16, including six in a fourteen-day sprint in April, and nothing has been added in the 64 days since. That is the second-longest gap in the fleet's observable history, after a 131-day silence between September 2025 and January 2026 — so a pause of this length has precedent and does not by itself indicate abandonment.
How does Arrows compare to other puzzle titles on creative efficiency? It ranks second of eight measured products at 13,869,914 lifetime impressions per creative, behind Grand Games' Magic Sort! at 35,507,268 and ahead of Pixel Flow! at 12,882,460 and Vita Mahjong at 8,553,411. On placement density, however, Arrows runs at 119.6 impressions per placement against 886 to 2,617 for its genre peers — it buys far more breadth and far less depth than comparable puzzle advertisers.
Want to check whether your own newest creatives are outrunning your oldest ones? Per-creative impressions, placement counts, first-seen and last-seen dates, format and playable attachment are all live in AdMapix, filterable by country, publisher and product ID — with unified product resolution so name collisions like the four different Arrows games never contaminate your numbers. Create a free account to run this teardown on any title in your category, or see plans for full historical access.
Data source: AdMapix third-party ad intelligence estimates, United States, retrieved 2026-08-19. Impression and download figures are modelled estimates for comparative analysis and are not publisher-reported. Figures change as new creatives enter rotation.
Related Reading
- Ad strategy teardowns (series index) — every teardown in the series, in publication order
- Mobile game ads guide: formats, examples and research — the format matrix, research workflow and KPI guardrails every teardown in this series applies
- 82-0.com — Vaulty Studios' 82-0
- Royal Kingdom — Royal Kingdom's US Top 10 pairs long-form video with playable end cards
- Whiteout Survival — Whiteout Survival's US Top 10 combines two billion-impression playables with one 85-second video…
Continue researching Arrows Puzzle Escape
Find matching apps, verify the developer and store, then inspect recent creatives.
Related Articles
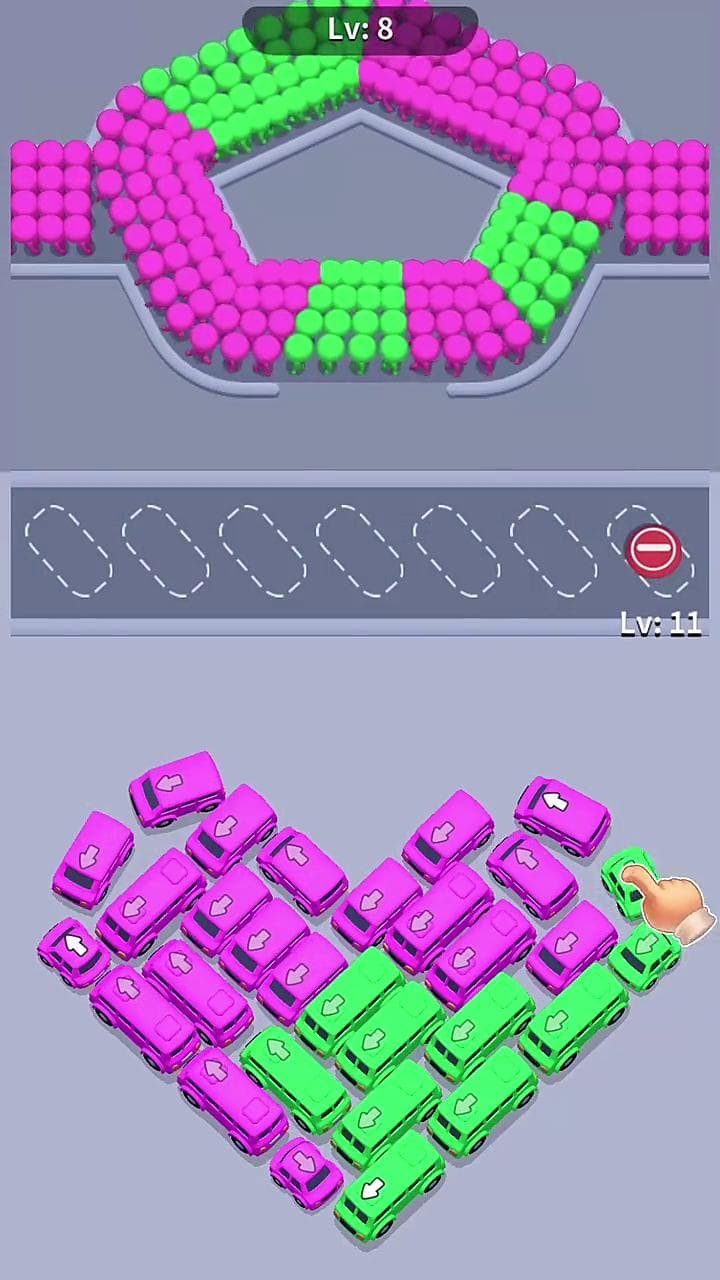
Playable Ads vs Video Ads: How to Choose and Test
Choose a format for the same game promise, inspect a reproducible AdMapix sample, and compare activation, retention, and production costs with a matched test brief.
Jewel Coloring Ad Strategy 2026: One 54-Second Video, Four End Cards, and a Fleet Built in 57 Days
A creative-level teardown of Ta Ta Game Technology's US user acquisition for Jewel Coloring. Fifteen ad entries account for 615,015,856 impressions — but they resolve to only twelve distinct assets: seven video masters and five playable masters, recombined. One 54-second video runs under four different end cards and carries 28.1% of the fleet on its own. Every video master was made inside a 17-day window, and none has been made since.
Solitaire Associations Journey Ad Strategy 2026: Everything Delivers at 100 Impressions per Placement — Playables, Videos, iOS and Android Alike
Hitapps Games' US fleet for Solitaire Associations Journey runs 132,950,973 impressions across fifteen creatives in the 30 days to 2026-08-19, and 44 of 45 sampled creatives were still live on that date. The remarkable thing is the uniformity: pure playables deliver at 95.0 impressions per placement, videos at 99.9, iOS at 96.7, Android at 97.6. Format, platform and a 230-day age spread move the number by less than 6%. Downloads are down 17.41% anyway.