KaloData vs FastMoss in 2026: Which TikTok Shop Tool Is Better? (Full Comparison)
A decision-first KaloData vs FastMoss comparison for 2026: GMV estimation, creator data, market coverage, pricing, shared blind spots, who each tool fits, and where cross-network ad intelligence like AdMapix fills the gap.
By the AdMapix Research Desk — Updated June 21, 2026
KaloData vs FastMoss in 2026: Which TikTok Shop Tool Is Better?

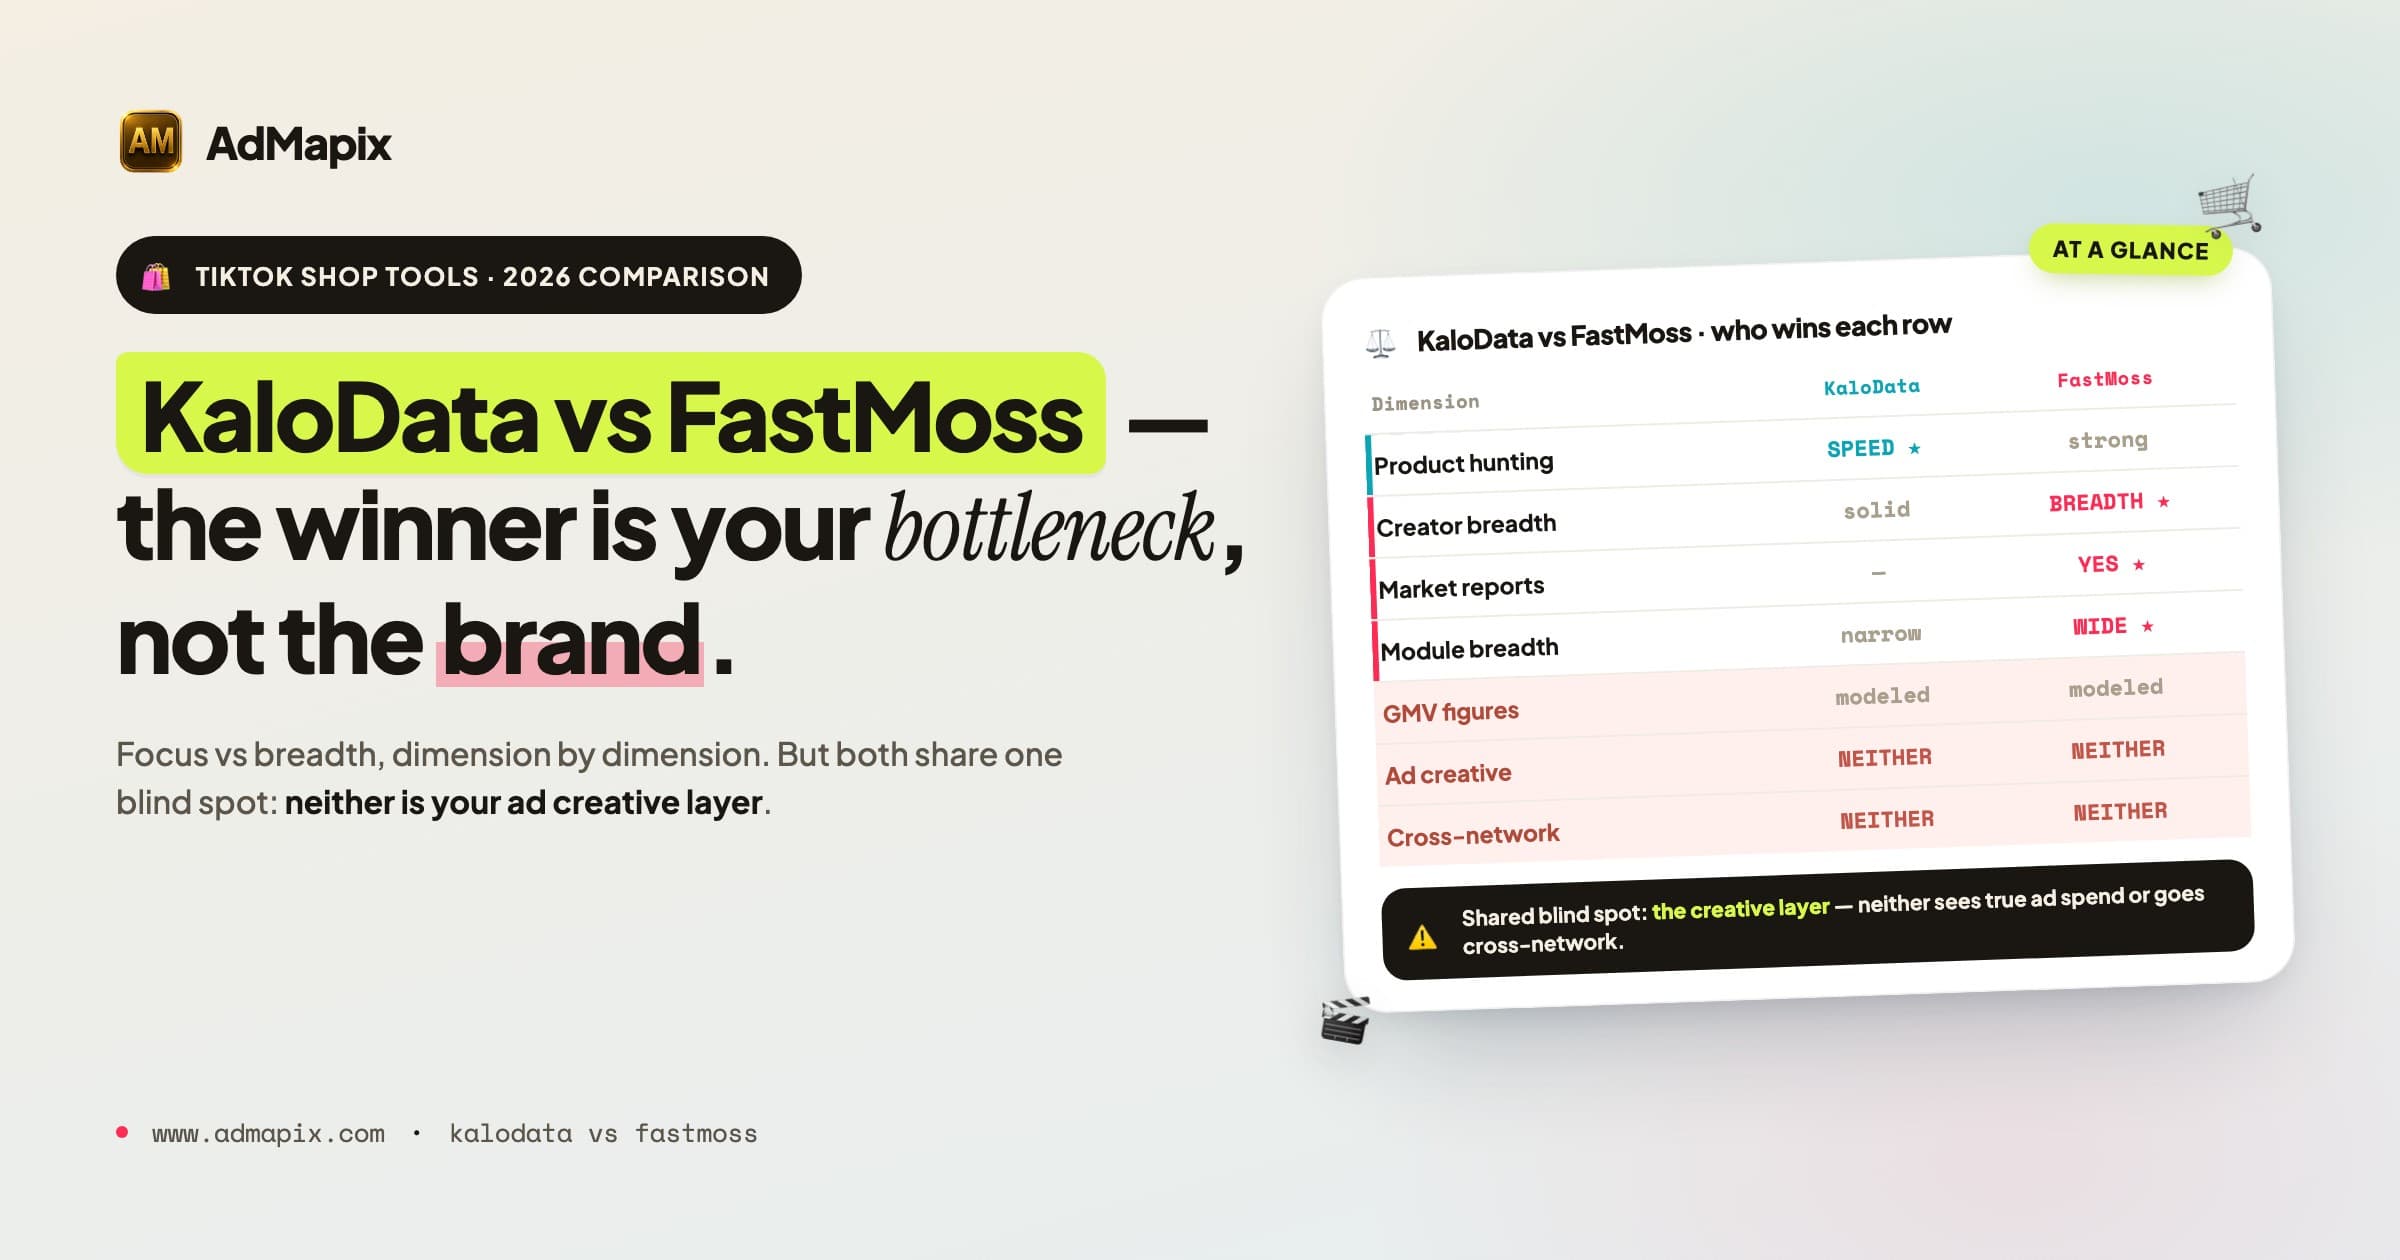
KaloData vs FastMoss is the comparison TikTok Shop sellers reach for the moment product hunting becomes a real budget line — and the honest answer is that the "winner" depends entirely on which job is your bottleneck. Pick KaloData when your main job is focused TikTok Shop product, creator, livestream, and short-video analytics in one fast dashboard. Pick FastMoss when you need broader TikTok commerce coverage spanning shops, ads, LIVE, hashtags, and recurring market reports across more markets. And know up front that neither is built to be your ad creative library — so if the missing piece is competitor ad evidence and video breakdowns, that's a separate layer (where cross-network tools like AdMapix fit).
This guide is for TikTok Shop sellers, cross-border ecommerce operators, creators, affiliates, and agencies deciding which platform to buy first. It does what most "X vs Y" posts skip: it compares the two tools dimension by dimension (GMV estimation, creator data, market coverage, data freshness, pricing, and exports), tells you exactly who each one fits, names the blind spots they share — and shows where a creative-intelligence layer fills the gap the commerce tools structurally can't. We'll be honest about where AdMapix belongs (the ad-creative-evidence job) and where it doesn't (product hunting and GMV estimation), because recommending the wrong category is the most expensive mistake in this space.
If you're earlier in the funnel and not yet committed to either tool, our broader KaloData alternatives guide and FastMoss alternatives guide map the full landscape of options.
TL;DR — KaloData vs FastMoss in 2026
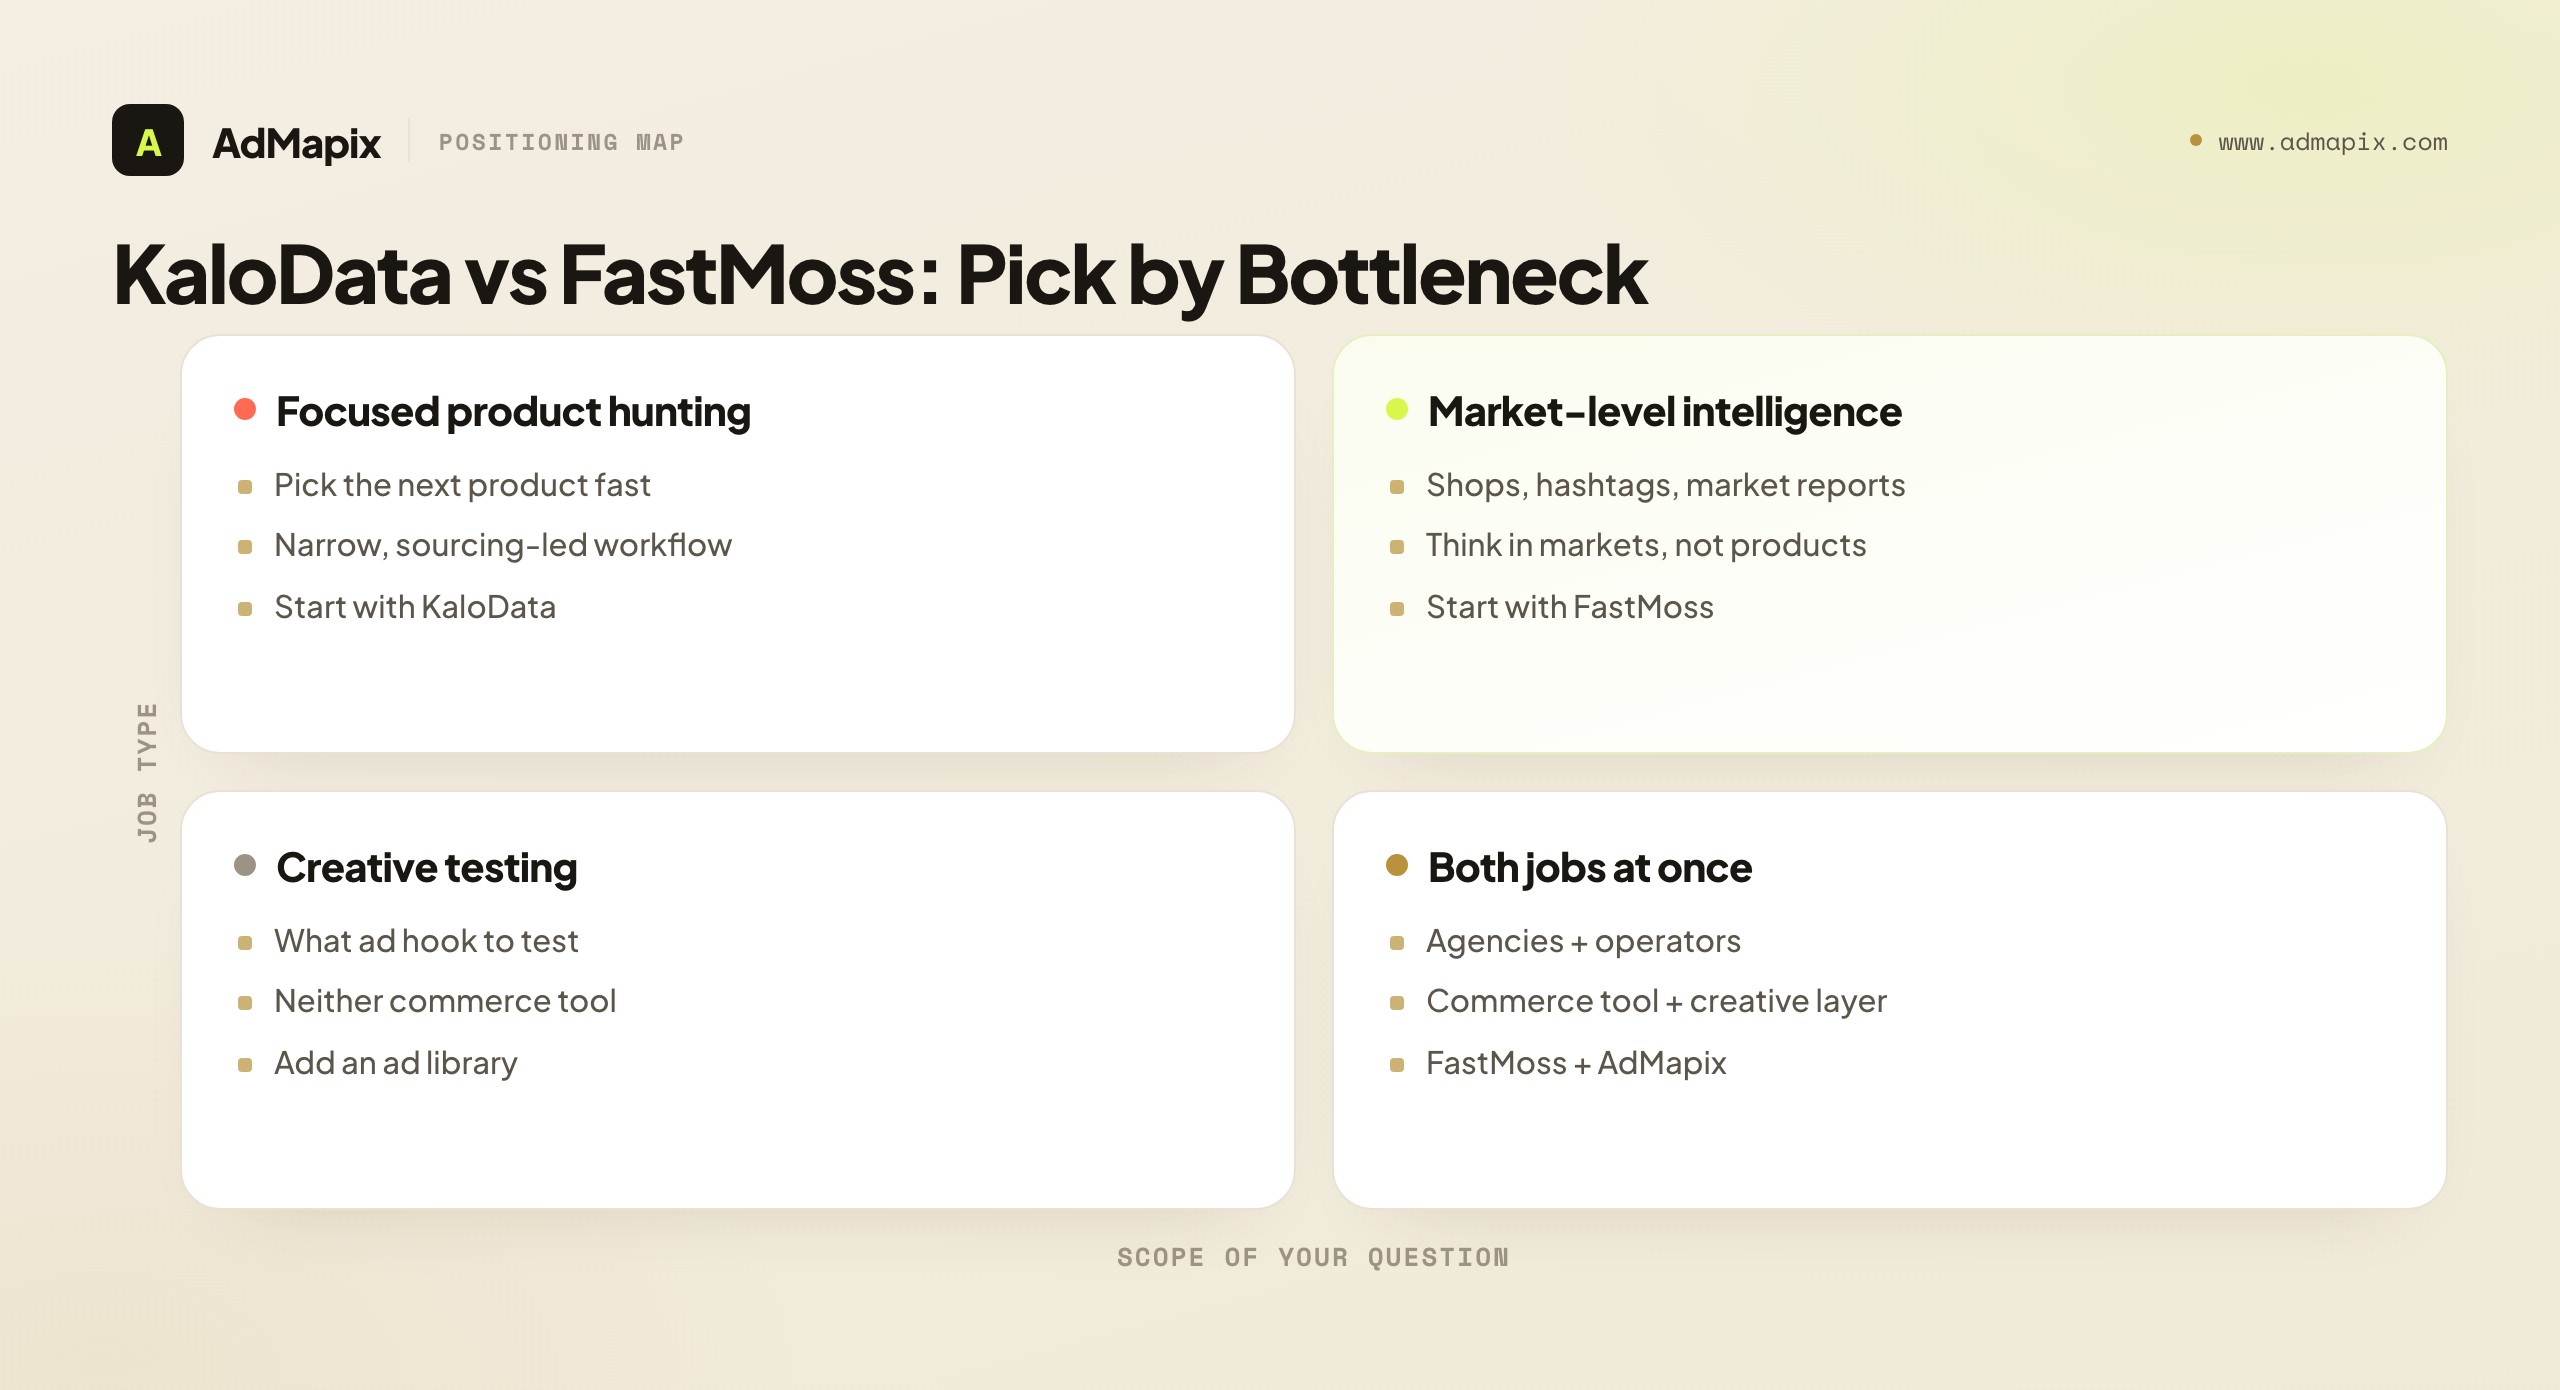
- Choose KaloData for focused TikTok Shop product hunting, creator discovery, and livestream/short-video analytics in a single fast workflow. Its narrower scope is often a speed advantage.
- Choose FastMoss when you want broader TikTok commerce intelligence: products, shops, creators, ads, LIVE, hashtags, and recurring market reports across more markets.
- They share the same DNA — and the same limits. Both are commerce-analytics tools that estimate from public signals, not paid-social creative libraries. Both tell you what is selling, not why a specific ad converted.
- The decider is your bottleneck, not the brand. Product selection → either (KaloData often faster). Market-level visibility → FastMoss. Creative testing → neither; you need an ad library.
- Their shared blind spot is the creative layer. Neither connects to a competitor's true ad spend, and neither breaks an ad into hook, pacing, and offer. That "why" is where cross-network ad intelligence comes in.
- Test before you buy. Load the same category, creators, and time window into both, then score time-to-decision and coverage in your markets — not the marketing demo.
What TikTok Shop Teams Are Actually Deciding
The real choice is never "which brand sounds bigger." It's "which tool shortens my next decision." TikTok Shop teams searching this comparison are almost always blocked on one of four concrete questions, and the right tool depends on which one is the bottleneck.
| Your decision | What you need to see | Better-fit tool |
|---|---|---|
| Which products should I sell or sample? | Product sales velocity, category trends, price bands | KaloData (focused) or FastMoss |
| Which creators should I partner with? | Creator GMV, audience, content fit | Either; FastMoss covers more creator/shop breadth |
| How is a whole market or category moving? | Shop rankings, hashtag trends, market reports | FastMoss |
| What creative angle should I test in ads? | Hooks, video formats, competitor ad evidence | Neither commerce tool — an ad library does this |
If your blocker is product selection, both tools work and KaloData's narrower focus is often faster to a shortlist. If your blocker is market-level visibility, FastMoss's broader scope earns its place. If your blocker is creative testing, no commerce-analytics tool — KaloData, FastMoss, or any peer — replaces an ad creative library. Naming your bottleneck first is what makes the rest of this comparison easy.
Side-by-Side: KaloData vs FastMoss at a Glance
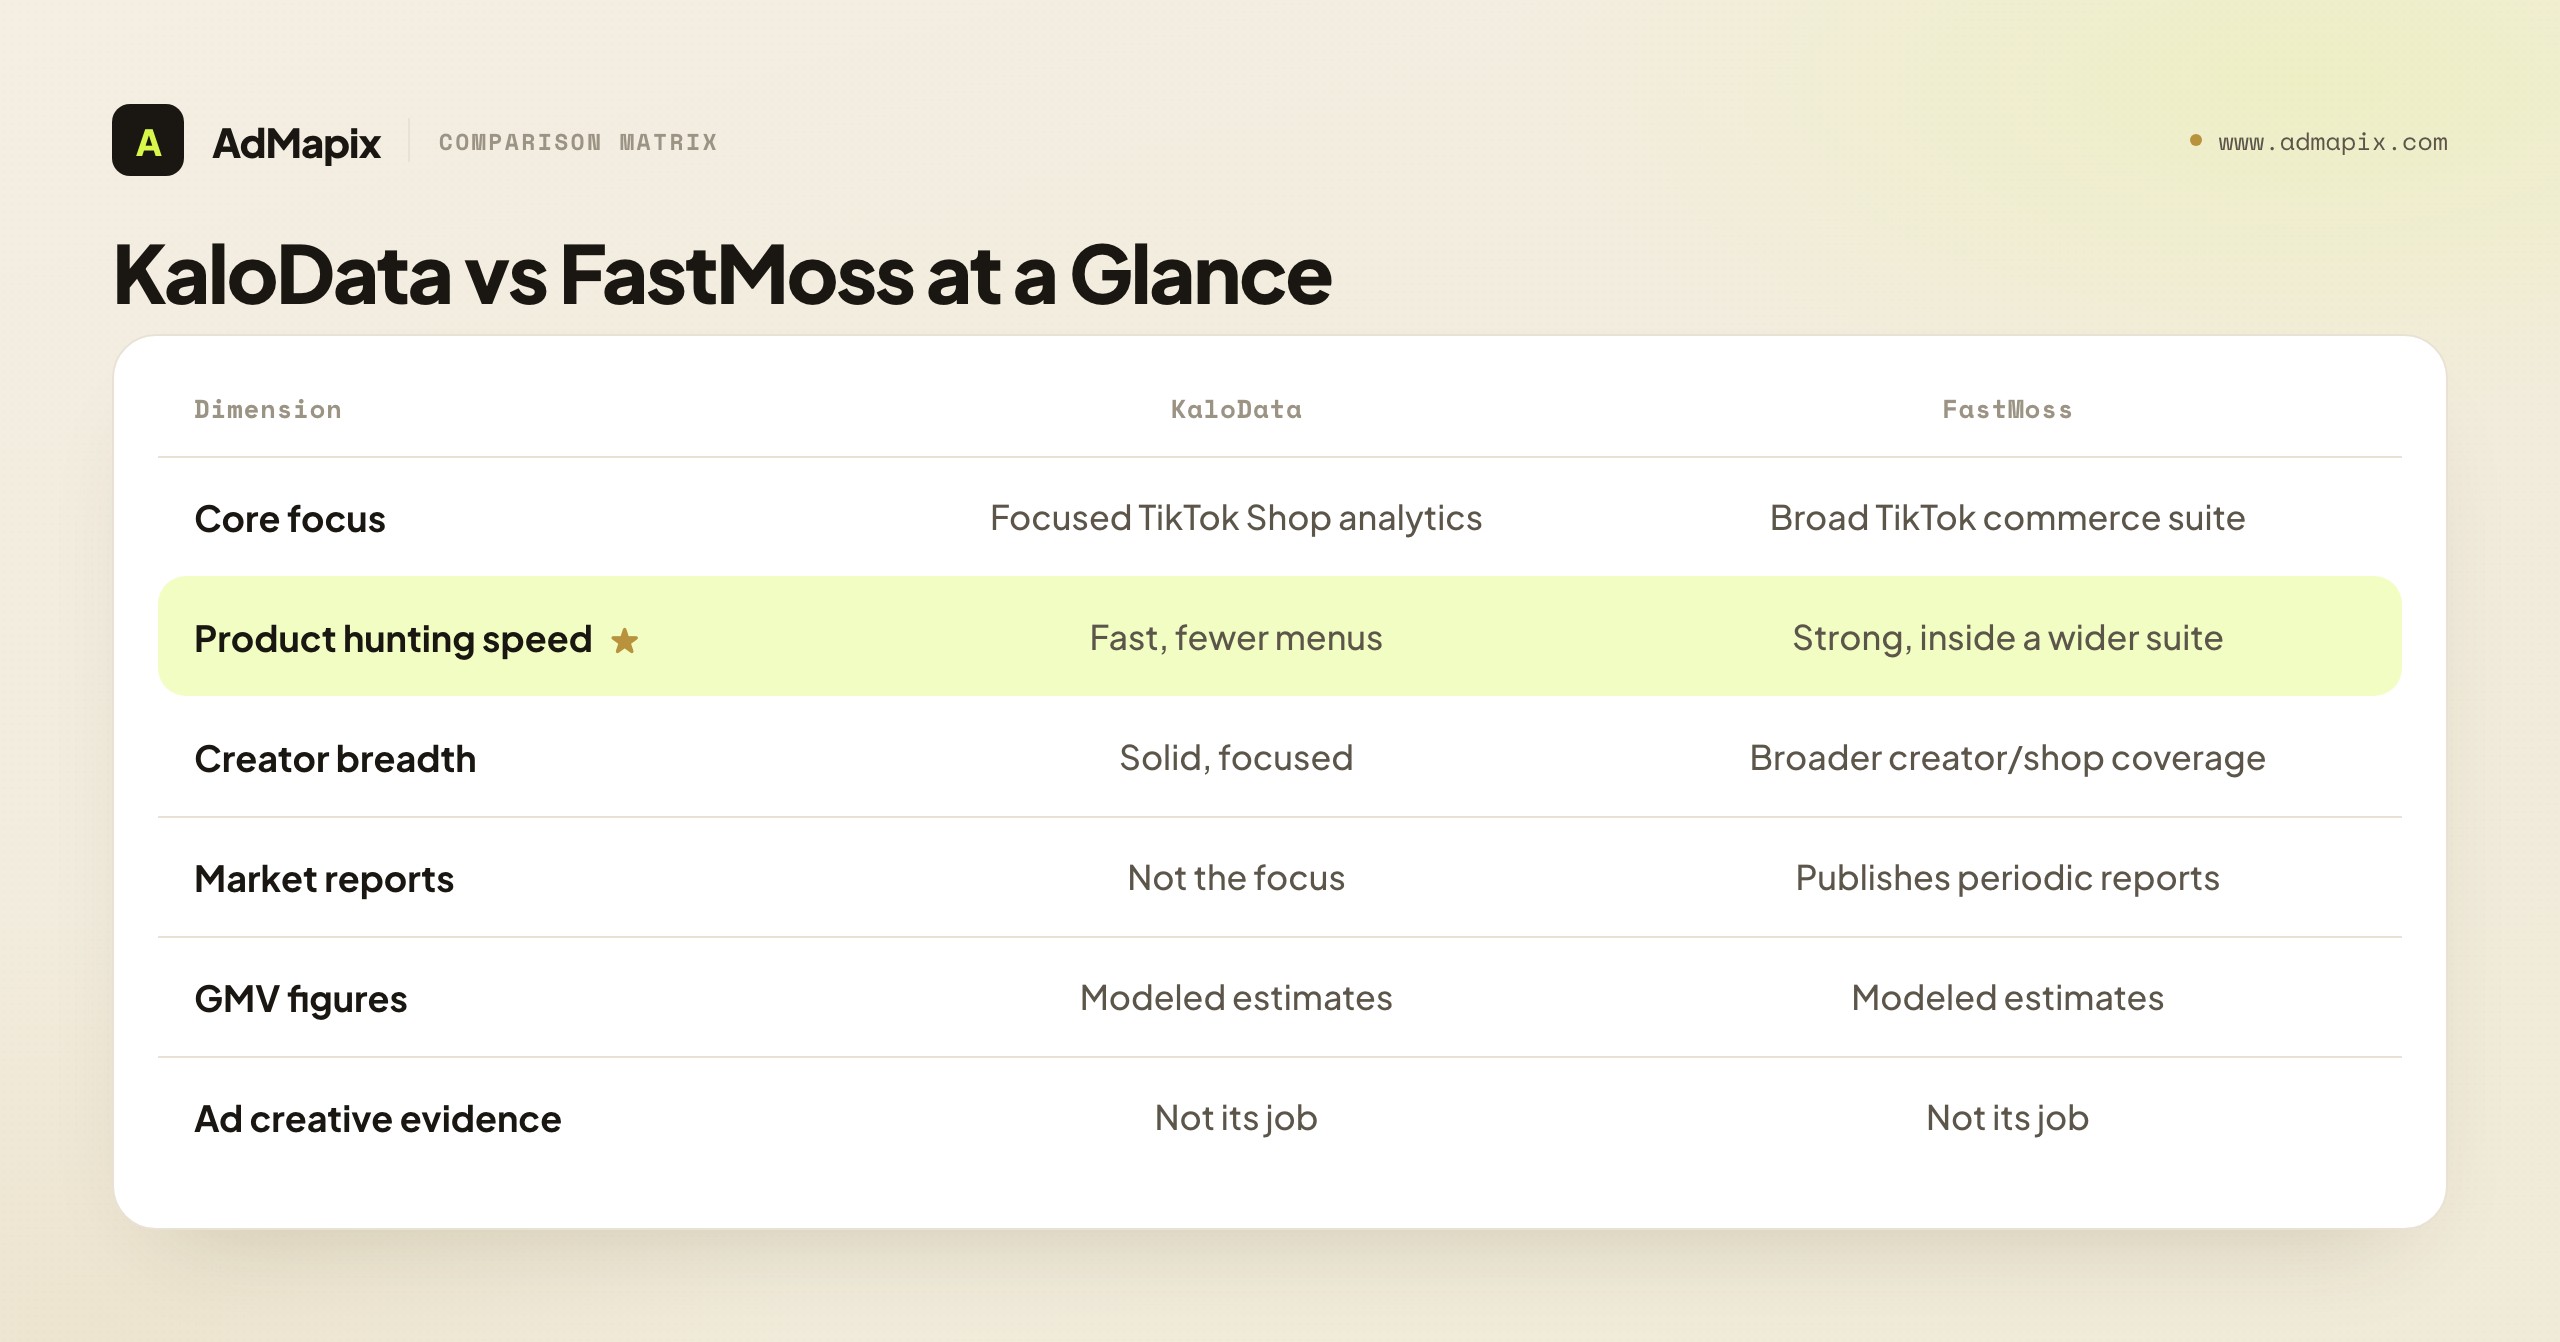
Here is the head-to-head across the dimensions that actually decide the purchase. Read the "edge" column as directional, not absolute — both tools update fast, and coverage quality in your specific market matters more than any single row.
| Dimension | KaloData | FastMoss | Edge |
|---|---|---|---|
| Core focus | Focused TikTok Shop product/creator/livestream analytics | Broad TikTok commerce: products, shops, creators, ads, LIVE, hashtags | Depends on job |
| Product hunting | Fast, fewer menus to a shortlist | Strong, inside a wider suite | KaloData on speed |
| Creator discovery | Solid creator + GMV signals | Broader creator/shop breadth | FastMoss on breadth |
| Market reports | Not its focus | Publishes periodic market reports | FastMoss |
| Breadth of modules | Narrow by design | Wide (ads, LIVE, hashtags, video) | FastMoss |
| Speed to decision | High for a single job | High once learned, more surface area | KaloData for focus |
| GMV / sales figures | Modeled estimates | Modeled estimates | Tie (both directional) |
| Ad creative evidence | Not its job | Not its job | Neither |
| True competitor ad spend | Not available | Not available | Neither |
| Cross-network (Meta/Google) | TikTok commerce focus | TikTok commerce focus | Neither |
Two things to read out of this table immediately. First, the top rows split by job — KaloData wins on focused speed, FastMoss wins on breadth and market-level views. Second, the bottom four rows are identical: both are TikTok-commerce tools that model GMV, neither sees true ad spend, neither is an ad creative library, and neither goes cross-network. Those shared blind spots are the real story, and we'll return to them.
KaloData: Focused TikTok Shop & Ecommerce Analytics
KaloData is at its best when your job is TikTok Shop product, creator, livestream, and short-video analytics and you want a single focused surface rather than a broad suite. Its public positioning frames it as a data tool for TikTok ecommerce (and adjacent marketplaces like Amazon and Shopee), aimed at creators and sellers who need to find winning products, evaluate creators, and read livestream and short-video performance.
Where KaloData shines:
- Speed to a product shortlist. Fewer menus between you and a decision. For a seller whose weekly job is "find the next product to sample," that focus is a genuine time advantage.
- Clear product-to-creator path. It moves cleanly from "what is selling" to "who should I sample to," which is the exact loop a sourcing-led seller runs.
- Livestream and short-video signals. For categories where LIVE and short-video drive the sales, KaloData reads those surfaces well.
Where KaloData's focus becomes a limit:
- Breadth. If you later need market reports, ad-level signals, or wider shop coverage, a focused tool can feel constraining. You may outgrow it as your questions widen from "what product" to "how is the whole market moving."
- Single-platform commerce lens. Like FastMoss, it's centered on TikTok commerce, so it won't help with cross-network ad research.
The practical summary: KaloData rewards a narrow, fast, sourcing-led workflow. If product hunting is your bottleneck and you value speed over surface area, its focus is a feature, not a gap.
FastMoss: Broader TikTok Commerce Intelligence
FastMoss is at its best when you want broader TikTok commerce intelligence across influencers, products, shops, ads, LIVE, video, and hashtags, plus periodic market reports. Its public materials describe a TikTok data analytics platform spanning those workflows, and it publishes TikTok Shop market analytics through its own channels.
Where FastMoss shines:
- Coverage and chaining. You can move from a product trend → the shops selling it → the creators promoting it → a hashtag or market-level view, without switching tools. That chaining is powerful for operators who think in markets, not just products.
- Market reports. Periodic TikTok Shop market analytics give agencies and operators a macro view that a pure product-hunting tool doesn't.
- More modules. Ads, LIVE, hashtags, and video views in one suite mean fewer tools to stitch together for a broad commerce picture.
Where FastMoss's breadth becomes a cost:
- Learning curve. More surface area means more to learn. For a single narrow job (just product hunting), it can be more tool than you need.
- Still TikTok-commerce, not ad-creative. Its "ads" module is about TikTok commerce ad signals, not a cross-network creative library with video breakdowns — an important distinction we cover below.
The practical summary: FastMoss rewards operators and agencies who need a market-level, multi-module view. If your questions span products, shops, creators, and whole-market trends, its breadth earns the extra surface area.
Dimension-by-Dimension Deep Dive
The glance table is the summary; here's the detail that actually decides a purchase. Each dimension below is where buyers most often discover, too late, that they optimized for the wrong thing.
GMV and Sales Estimation
This is the single most misunderstood dimension, and it's a tie for an important reason: both tools model GMV from observable public signals rather than reading official TikTok sales data. Neither has a feed of audited revenue. They infer sales from visible order counts, review velocity, video and livestream engagement, listed prices, and category conversion patterns — then apply estimation logic to produce a number.
The practical consequences are identical for both:
- Rankings are reliable; absolute numbers are not. Both are good at telling you product A outsells product B in a category. Both are far less reliable at telling you product A did exactly $84,000 last week.
- The same product can show different GMV in each tool because they weight signals differently. That's not a bug in one of them; it's the nature of modeling. Don't assume the higher number is the "right" one.
- Use them to shortlist and prioritize, never to model a competitor's profit. Margin, COGS, and ad spend are invisible to both.
The right way to compare them here is not "which number is bigger" but "which tool's ranking matches your real-world sense of your category." Run a product you already know through both and see which ranks it more sensibly.
Creator and Influencer Data
Both surface creator GMV signals and content-fit data, but breadth differs. FastMoss generally covers more creator and shop surface area as part of its wider suite, which helps if creator partnerships are central to your model and you want to chain from creator to shop to product. KaloData's creator data is solid and fast for the focused job of "who should I sample to for this product." If you partner with creators at scale across many categories, test FastMoss's breadth directly; if you need quick creator shortlists tied to specific products, KaloData's focus may be faster.
Market and Category Coverage
Coverage quality is the most under-tested dimension and the one most likely to disappoint after purchase. Both tools' estimates are only as good as the signals they capture in your market. A tool strong in the US can be thin in Southeast Asia, the UK, or Latin America. FastMoss's broader scope and market reports give it an edge for whole-market visibility; KaloData's focus is about product-level depth rather than market-level breadth. The non-negotiable rule: run your exact category in your exact target country during a trial, because a tool that looks comprehensive in a US demo can be sparse in your real niche.
Data Freshness
TikTok Shop trends move fast, so update cadence matters for trend-spotting. A tool that refreshes daily catches a rising product earlier than one that updates weekly — and being early to a trend is often the entire edge in product hunting. Neither tool publishes a universal refresh SLA for every data point, so test freshness on a product you can independently watch: note when a clearly rising product appears in each tool relative to when you saw it move on TikTok itself.
Pricing and Plans
Both price and package differently, and plans change often, so the only reliable approach is to verify the exact plan you'd buy on each vendor's own page — not the marketing tier. The more useful framing than "cheapest" is cost per decision made. A tool that's $20/month cheaper but sparse in your market, slow to refresh, or unable to export the data your team uses costs far more in wasted time than it saves. Decide which job is your bottleneck, then price the plan that actually solves that job.
Exports and Workflow Fit
Can you get the data out in a format your team actually uses? This is mundane and decisive. A tool with great data trapped behind a clumsy export is a tool your team will quietly stop using. Check, during the trial, whether you can export product lists, creator lists, and trend data into the spreadsheet or BI layer your workflow runs on. For agencies especially, clean export is what turns research into a client deliverable.
How Both Tools Estimate GMV — and Why It Matters for Your Choice
Because GMV estimation is a tie on paper, it's worth understanding why — it changes how you read every number in both tools and how you compare them fairly.
Neither KaloData nor FastMoss receives official per-product or per-creator sales data from TikTok. So both model sales from the public signals they can observe: visible order counts and review velocity, video view and engagement metrics, livestream viewer and interaction data, listed prices, and historical patterns of how those signals convert to sales within a category. Each then applies its own estimation logic to turn those signals into a GMV figure. Because they weight the inputs differently, the same product can show a different estimated GMV in each tool — and neither is "wrong"; they're two models of the same unobservable truth.
This has three direct consequences for a KaloData vs FastMoss decision:
- Don't pick the tool with the bigger number. A higher estimate isn't a more accurate one — it's a different weighting. Comparing raw GMV figures between the tools tells you about their models, not about the product.
- Compare rankings, not absolutes. The fair test is whether each tool's ordering of a category matches your real-world sense of it. Run a product you already know through both; the tool whose ranking feels right in your market is the better fit, regardless of the exact figures.
- Both break down the same way on profit. Margin, COGS, returns, and ad spend are invisible to both. A high estimated GMV with thin margins and heavy ad spend can be a worse opportunity than a modest one — and neither tool can see that. Your own data closes that gap.
The takeaway for choosing: GMV estimation shouldn't be your deciding dimension, because it's a wash. Decide on scope (focus vs breadth), coverage in your markets, speed, and export — the dimensions where the tools genuinely differ — and treat both tools' GMV as the directional signal it is.
Calibrating Each Tool's Estimates Against Reality
Since both tools model rather than measure, the smartest thing you can do during a trial is calibrate — figure out how far off each tool's estimates run in your specific category, so you know how much to trust them later. Most buyers skip this and end up either over-trusting a polished dashboard or dismissing a tool that was actually fine. A 30-minute calibration pass settles it with evidence instead of vibes.
Three calibration techniques, in order of how much ground truth you have. First, calibrate against your own products. If you already sell on TikTok Shop, run your own listings through both tools and compare their estimated GMV to your actual sales. You know the real number, so this is the cleanest possible accuracy check — and it instantly tells you whether a tool runs high, low, or roughly right in your category, plus by how much. A tool that estimates your own product within a sensible band is one you can trust on your competitors' products too. Second, calibrate against products you can independently watch. Pick a clearly rising product you have no inside data on, then track it in both tools over two to three weeks while you separately watch its review-count growth, video views, and "sold" badges on TikTok itself. You're not checking absolute dollars here — you're checking whether each tool's trend line moves when the product's real signals move, and how quickly. A tool whose curve lags reality by a week is one you'll always be late acting on. Third, calibrate the ranking, not the number. Take five products in a category you know well and check whether each tool orders them the way your real-world experience says they should be ordered. Ranking accuracy is what you actually buy these tools for; a tool can be wrong on every absolute figure yet still rank a category perfectly, and that's the version that's still useful.
Write the results down as a one-line trust note per tool — something like "FastMoss ran ~20% high on my own products but ranked the category correctly and tracked trends within a few days; KaloData ran closer on absolutes but covered fewer of my SEA listings." That note is worth more than any feature page, because it's accuracy measured on your data, in your market, on the exact decision you're about to make repeatedly. Re-run a quick version of it each quarter, since both tools' models and coverage shift over time and a tool that was accurate in your niche last year may have drifted.
Building a Weekly Research Workflow With Either Tool
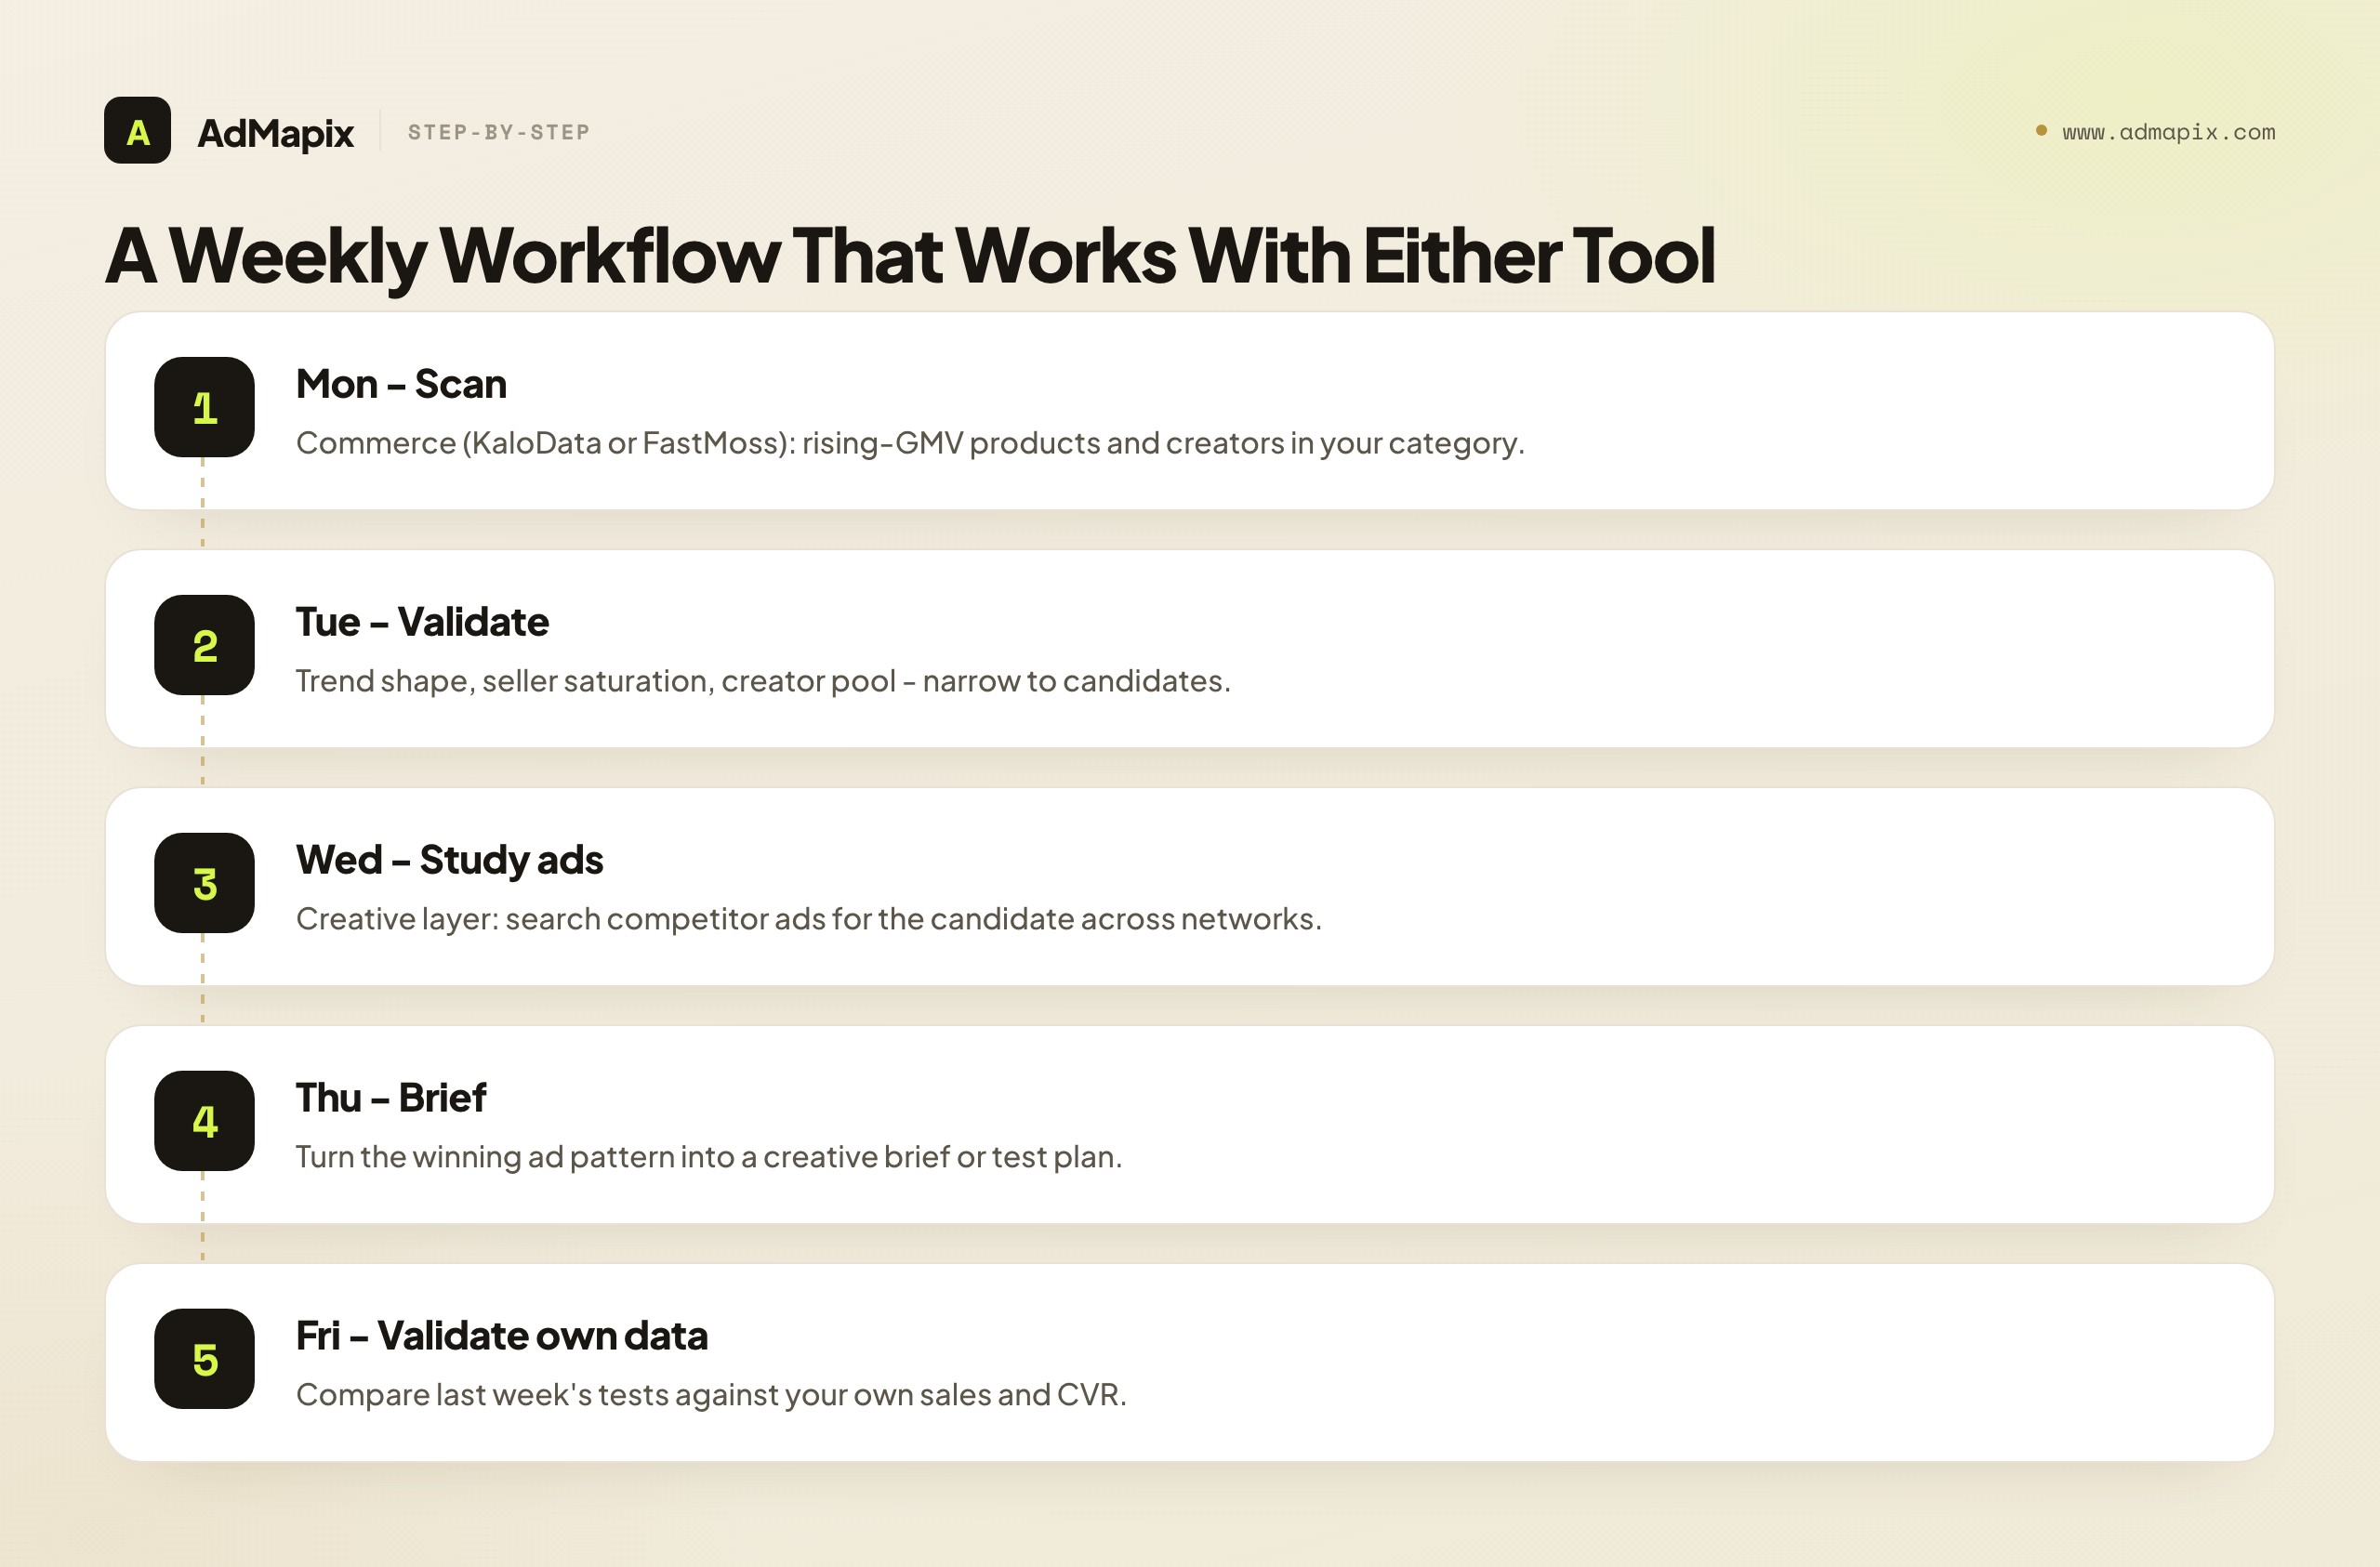
Whichever you pick, the tool only pays off inside a repeatable routine. Here's a lightweight weekly workflow that works with KaloData or FastMoss as the commerce layer, plus a creative layer for when you run ads. The whole loop takes under an hour and compounds into a real edge over sellers who research in sporadic bursts.
| Day / step | Job | Action (KaloData or FastMoss) |
|---|---|---|
| Monday — scan | Commerce | Check rising-GMV products and creators in your category |
| Tuesday — validate | Commerce | Trend shape, seller saturation, creator pool per candidate |
| Wednesday — study ads | Creative | Search competitor ads for the candidate across networks |
| Thursday — brief | Creative | Turn the winning ad pattern into a brief or test plan |
| Friday — validate own data | First-party | Compare last week's tests against your own sales and CVR |
Three rules keep it honest. First, the commerce tool feeds the creative step, not replaces it — Monday's product scan (in KaloData or FastMoss) tells you what to study ads for on Wednesday. Second, log evidence, don't just look at it. A winning competitor ad you save and tag becomes a reusable brief; one you glance at and forget is wasted research. Third, always end on your own data — the commerce and creative signals generate hypotheses; your sales numbers are the only thing that confirms them. A team running this loop for a quarter builds a history of what trended, what they tested, and what actually converted — the asset that makes next quarter's decisions faster, no matter which commerce tool they chose.
Notice that the workflow is identical whether you picked KaloData or FastMoss — the commerce tool is interchangeable in the loop. What's not interchangeable is the creative layer on Wednesday and Thursday, because neither commerce tool covers it. That's the structural gap we turn to next.
The Blind Spot They Share: The Creative Layer
Here's the part most KaloData vs FastMoss comparisons miss entirely. The two tools differ on breadth, but they're identical on a more important axis: neither answers the "why" behind a winning product. And the "why" is where paid-social performance is actually won or lost.
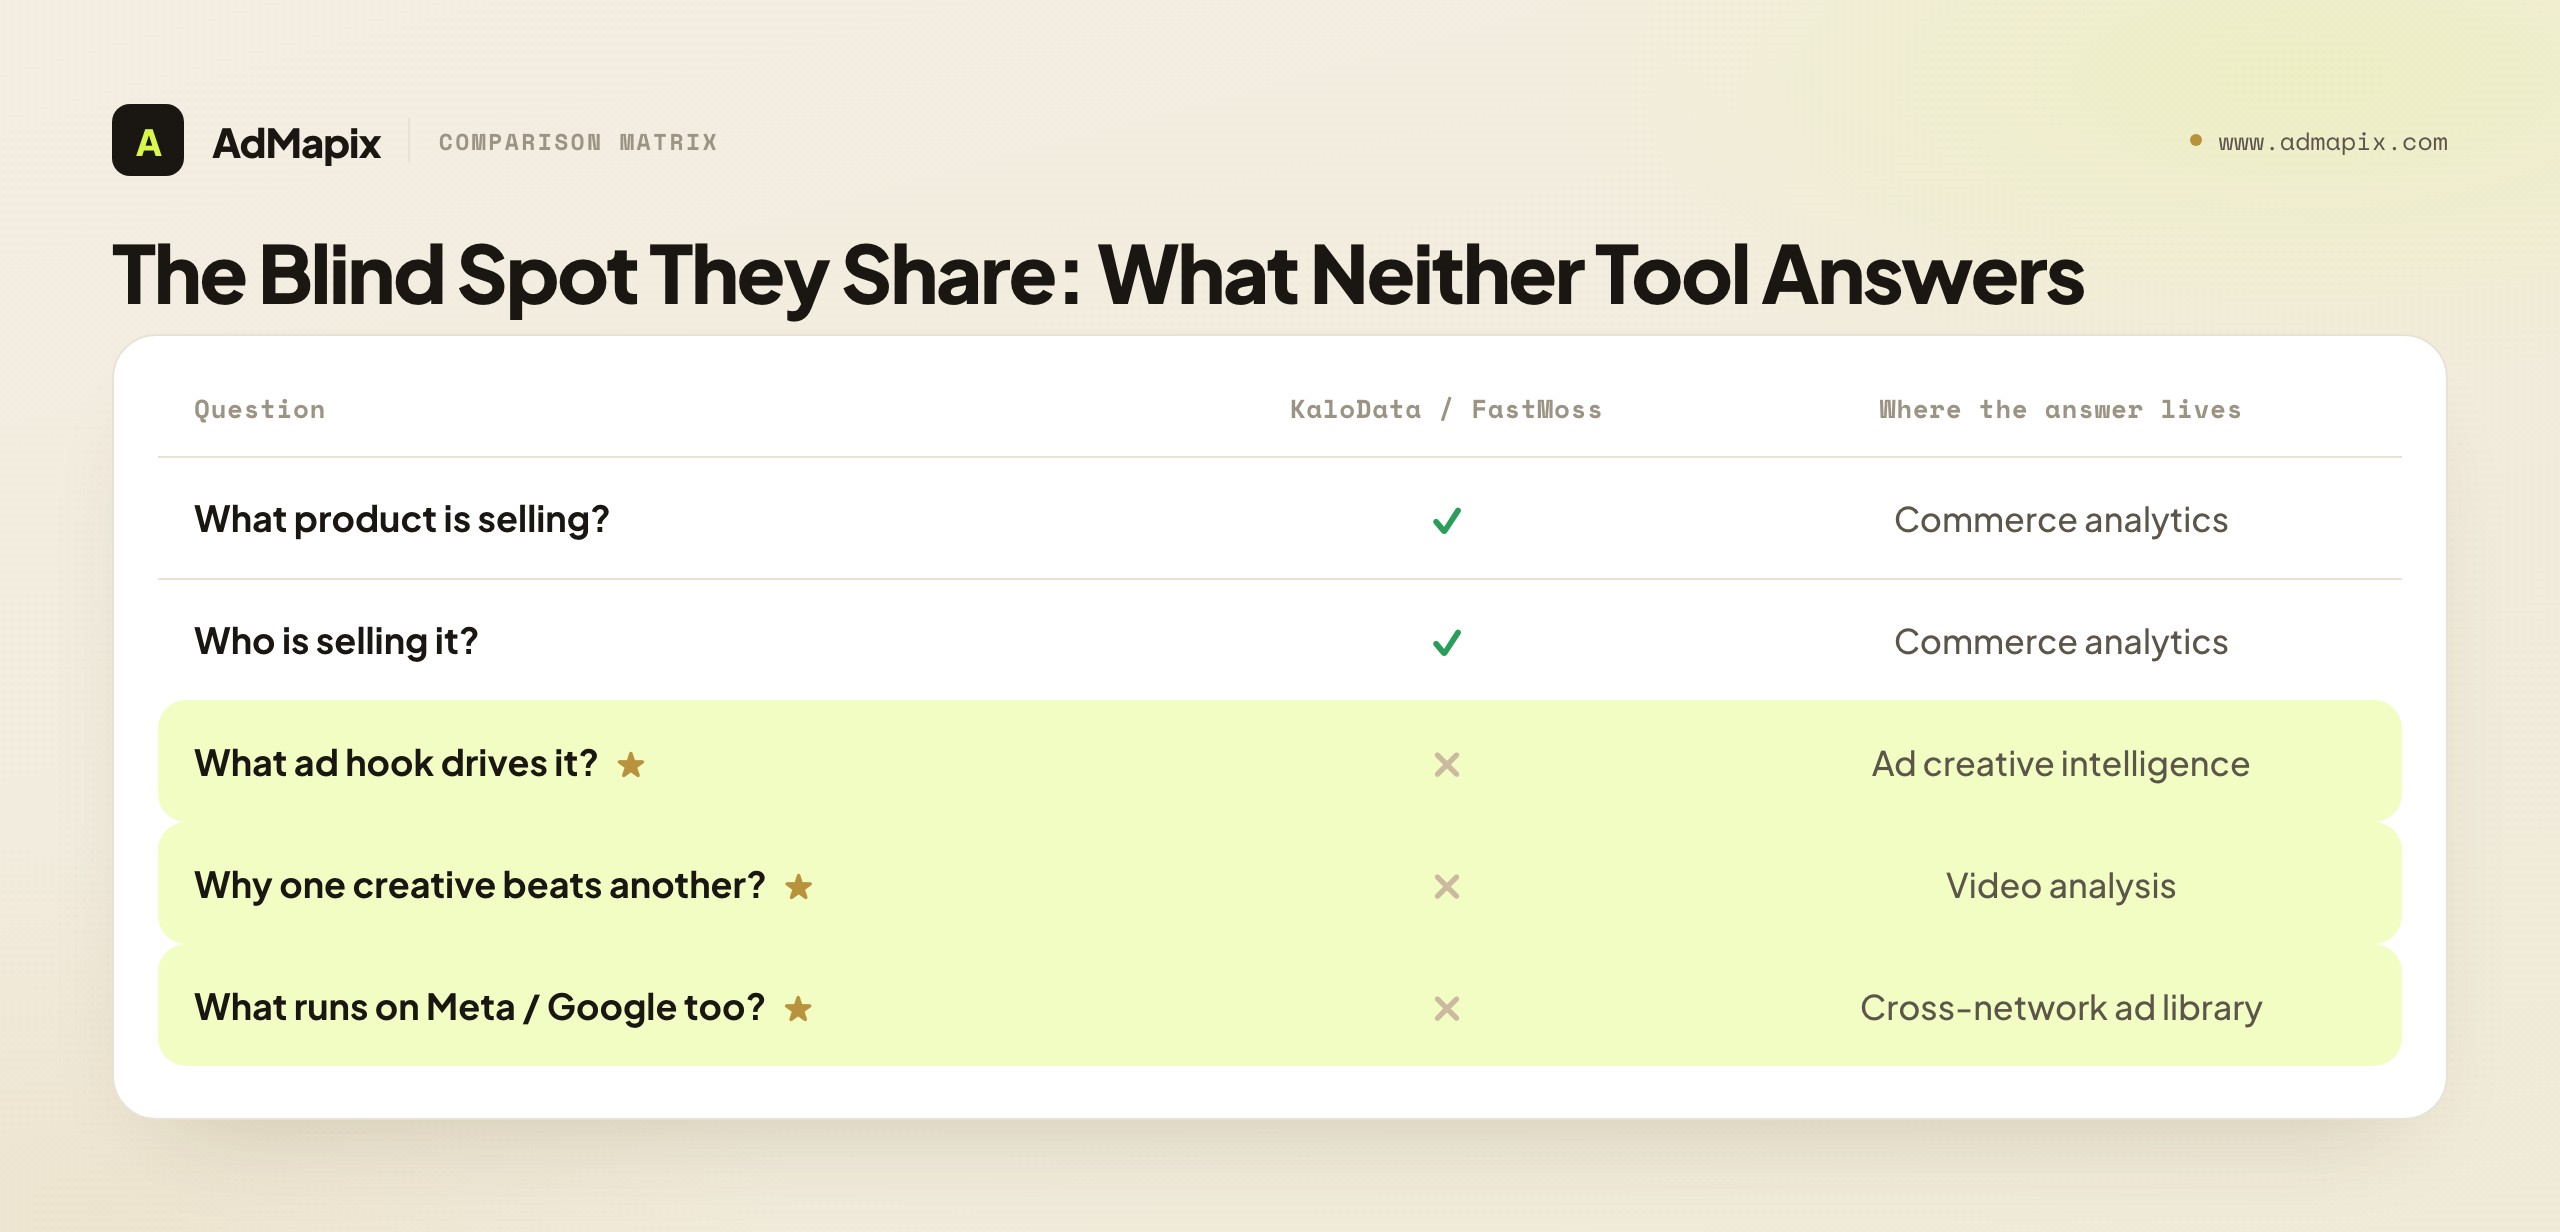
Sales velocity tells you a product moves. It does not tell you:
- The hook in the first three seconds of the ads driving those sales.
- The offer framing (bundle, discount, urgency, social proof) behind the conversion.
- The video structure and pacing that makes one creative outperform another for the same product.
- What competitors across other networks (Meta, Google) are doing with the same product.
| Question | KaloData / FastMoss answer | Where the answer lives |
|---|---|---|
| What product is selling? | Yes — product velocity, trends | Commerce analytics |
| Who is selling it? | Yes — creators, shops | Commerce analytics |
| What ad hook is driving it? | No | Ad creative intelligence |
| Why does one creative beat another? | No | Video analysis |
| What's running on Meta / Google too? | No | Cross-network ad library |
This isn't a knock on either tool — it's a category boundary. Commerce-analytics tools are built to answer what and who. The why and how of the ad creative is a different category: an ad creative library plus video analysis. A serious TikTok Shop operation usually needs both — a commerce tool (KaloData or FastMoss) to pick the product, and a creative-intelligence tool to figure out how to advertise it. For the broader competitor workflow this feeds, see paid ads competitor research.
Why cross-network matters even for TikTok-first sellers
It's tempting to assume a TikTok-commerce tool covers everything because the selling happens on TikTok. But winning ad angles migrate across platforms: a hook crushing on Meta this month often lands on TikTok next month, and the same product is frequently advertised with different angles on different networks. If you only see TikTok, you get a fraction of the proven creative playbook for your own product — and you see each angle after it has already saturated your platform. Cross-network visibility is what lets you assemble the full set of proven angles and adapt the strongest one. For more, see spy on ads across all platforms.
A Worked Example: Choosing Between Them on a Real Decision
Frameworks land better with a concrete walk-through. Here's how two different sellers make the KaloData vs FastMoss call on the same product category, and arrive at different right answers — which is exactly the point.
Seller A — a solo operator hunting products. Her weekly job is simple and narrow: find the next product to sample in the home-fitness niche and ship it fast. She trials both tools on the same category. In KaloData, she reaches a clean product shortlist in minutes — the focused interface puts a sortable list of rising home-fitness products in front of her with minimal navigation. In FastMoss, she gets to the same shortlist, but past more modules and surface area she doesn't currently need. For her bottleneck — speed to a product decision — KaloData's focus wins. She picks KaloData, and notes that when she eventually starts running ads, she'll add a creative-intelligence layer rather than expecting either commerce tool to cover it.
Seller B — a cross-border agency operator. Her job is broader: she advises three ecommerce clients and needs to brief them on whole markets, not just single products. She trials the same home-fitness category, but her real questions are "how is this category moving across shops?", "which creators dominate the GMV?", and "can I export a market view into a client report?" Here FastMoss's breadth and market reports earn their place — she can chain from product trend to shops to creators to a hashtag-level view, and pull a market report her client will actually read. For her bottleneck — market-level visibility and reporting — FastMoss wins. She picks FastMoss, and adds a creative-intelligence tool so her client briefs include the ad angles behind the winning products, which neither commerce tool provides.
Same category, opposite conclusions. That's the whole lesson of a KaloData vs FastMoss decision: the tools aren't ranked on an absolute scale, they're matched to a bottleneck. Seller A optimized for speed-to-product and chose the focused tool; Seller B optimized for market breadth and reporting and chose the broad suite. Both were right for their job. And both reached the same conclusion about the creative layer — that it's a separate purchase neither commerce tool replaces.
Can You Switch Between Them — or Run Both?
Two practical questions come up once a team realizes the choice isn't permanent.
Switching between them is genuinely low-friction, because they solve the same core job. Your workflow of "find a product, validate it, find creators" transfers directly from one to the other — the muscle memory is the same, only the interface and coverage change. If you start on KaloData for speed and later need FastMoss's market reports, moving over costs little beyond relearning the UI. The honest advice: don't agonize over a permanent decision. Trial whichever fits your current bottleneck, and switch if your bottleneck changes from product-level to market-level (or vice versa). Keep the existing tool until the replacement proves stronger coverage in your exact markets.
Running both is rarer but real for some teams. An agency juggling many clients across many categories sometimes keeps both — KaloData for fast per-product checks and FastMoss for market reporting — though most teams find one suffices and the second is redundant overlap. The more common "run two tools" pattern isn't KaloData and FastMoss; it's one commerce tool plus one creative-intelligence tool, because those genuinely solve different jobs. Paying for KaloData and FastMoss together often buys overlapping commerce data; paying for one commerce tool plus an ad library buys two complementary capabilities. If your budget allows only one second tool, the higher-leverage second tool is almost always the creative layer, not the other commerce suite.
The rule of thumb: switch commerce tools when your bottleneck moves; add a creative tool when you start running ads. Those are different decisions, and conflating them is how teams end up paying twice for the same commerce data while still missing the creative evidence they actually need.
A useful way to pressure-test this is to ask, for any tool you're about to add: what specific decision will this improve that my current stack can't? If the honest answer for a second commerce tool is "it would give me slightly different GMV estimates for the same products," that's redundancy, not capability — you're buying a second opinion on data you already have. If the honest answer for a creative tool is "it would show me the ad hooks and offers behind my winning products, which I currently can't see at all," that's a genuine new capability filling a real gap. The first purchase rarely pays back; the second routinely does, because it covers a job nothing else in your stack touches. Run that test before every tool addition and you'll avoid the most common budgeting mistake in TikTok Shop tooling: stacking overlapping commerce suites while the creative layer stays empty. The teams that get the most out of their tool budget aren't the ones with the most tools — they're the ones whose tools each cover a distinct, non-overlapping job, with no gap left in the part of the funnel that actually decides paid-social performance.
Who Should Pick Which
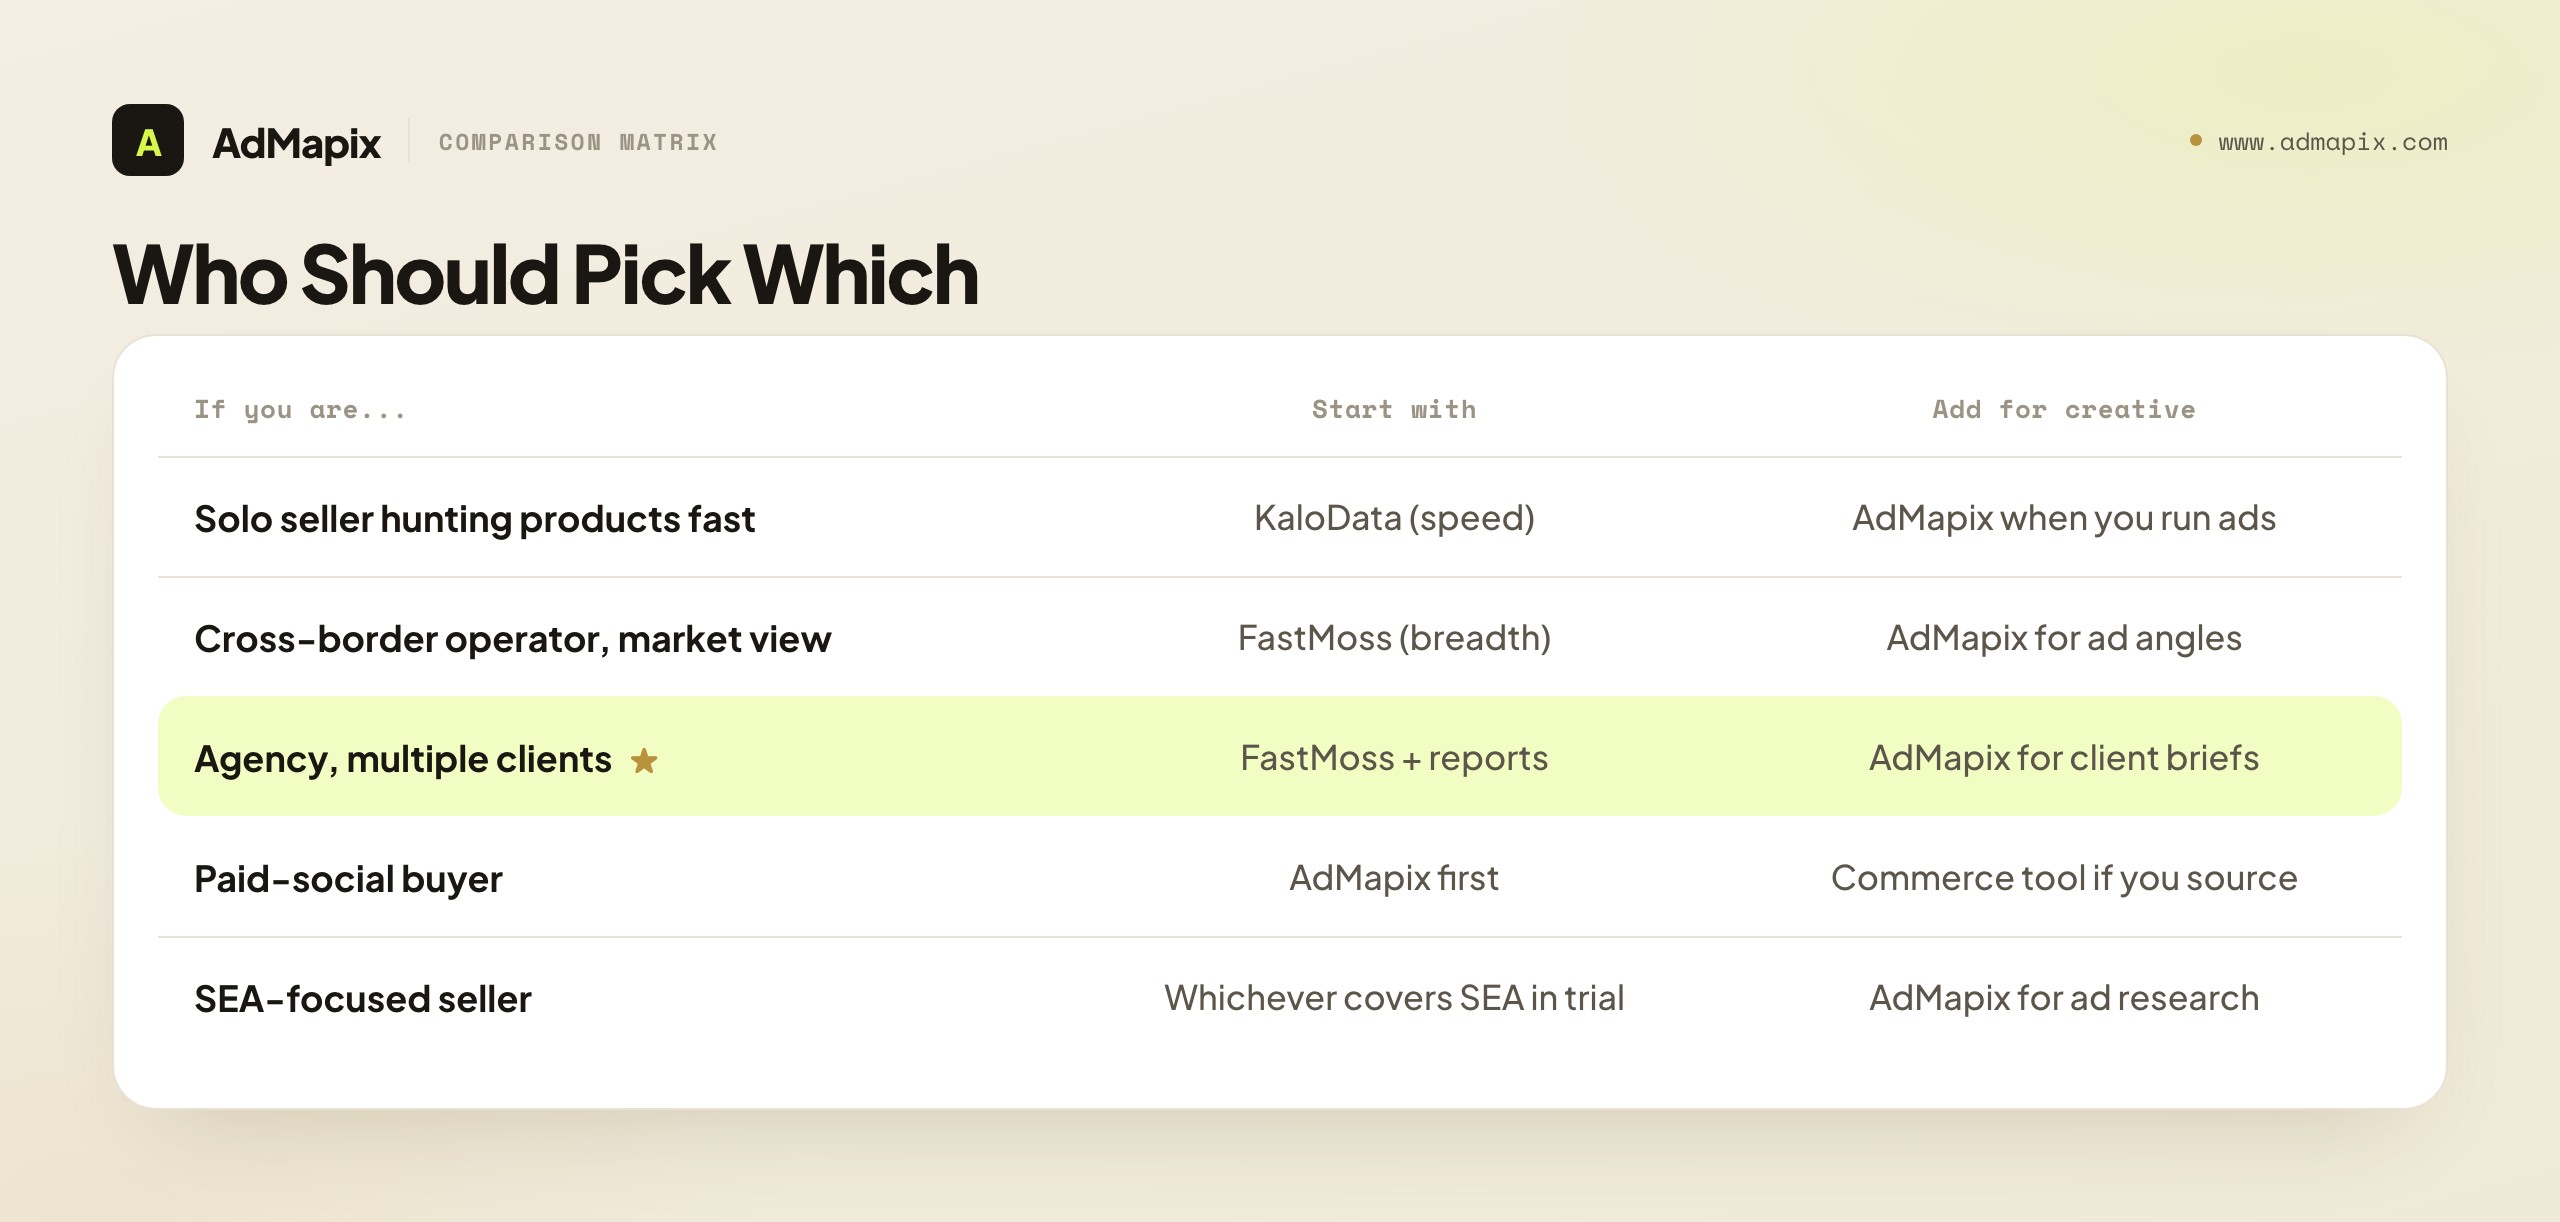
Map yourself to the row that fits, then start there.
| If you are... | Your bottleneck | Start with | Add for the creative layer |
|---|---|---|---|
| A solo seller hunting products fast | Product selection | KaloData (speed) | AdMapix when you start running ads |
| A cross-border operator thinking in markets | Market visibility | FastMoss (breadth) | AdMapix for competitor ad angles |
| An agency serving multiple ecommerce clients | Both + reporting | FastMoss + reports | AdMapix for client creative briefs |
| An affiliate picking products + creators | Creator + product fit | KaloData or FastMoss | TikTok Creative Center + AdMapix |
| A paid-social buyer | Creative testing | AdMapix first | A commerce tool only if you also source |
| An SEA-focused seller | Regional coverage | Whichever covers SEA in trial | AdMapix for ad research |
The pattern repeats from the earlier framing: if your next decision is what to sell or which market to chase, lead with a commerce tool — KaloData for focus, FastMoss for breadth. If your next decision is what ad to make and test, no commerce tool serves it; you need creative intelligence. Most rows end in "add a creative layer," because the two jobs genuinely complement each other.
How to Test Them Before You Buy
Don't decide from feature pages — decide from a parallel trial on your evidence. Run both tools on the same inputs and score time-to-decision.
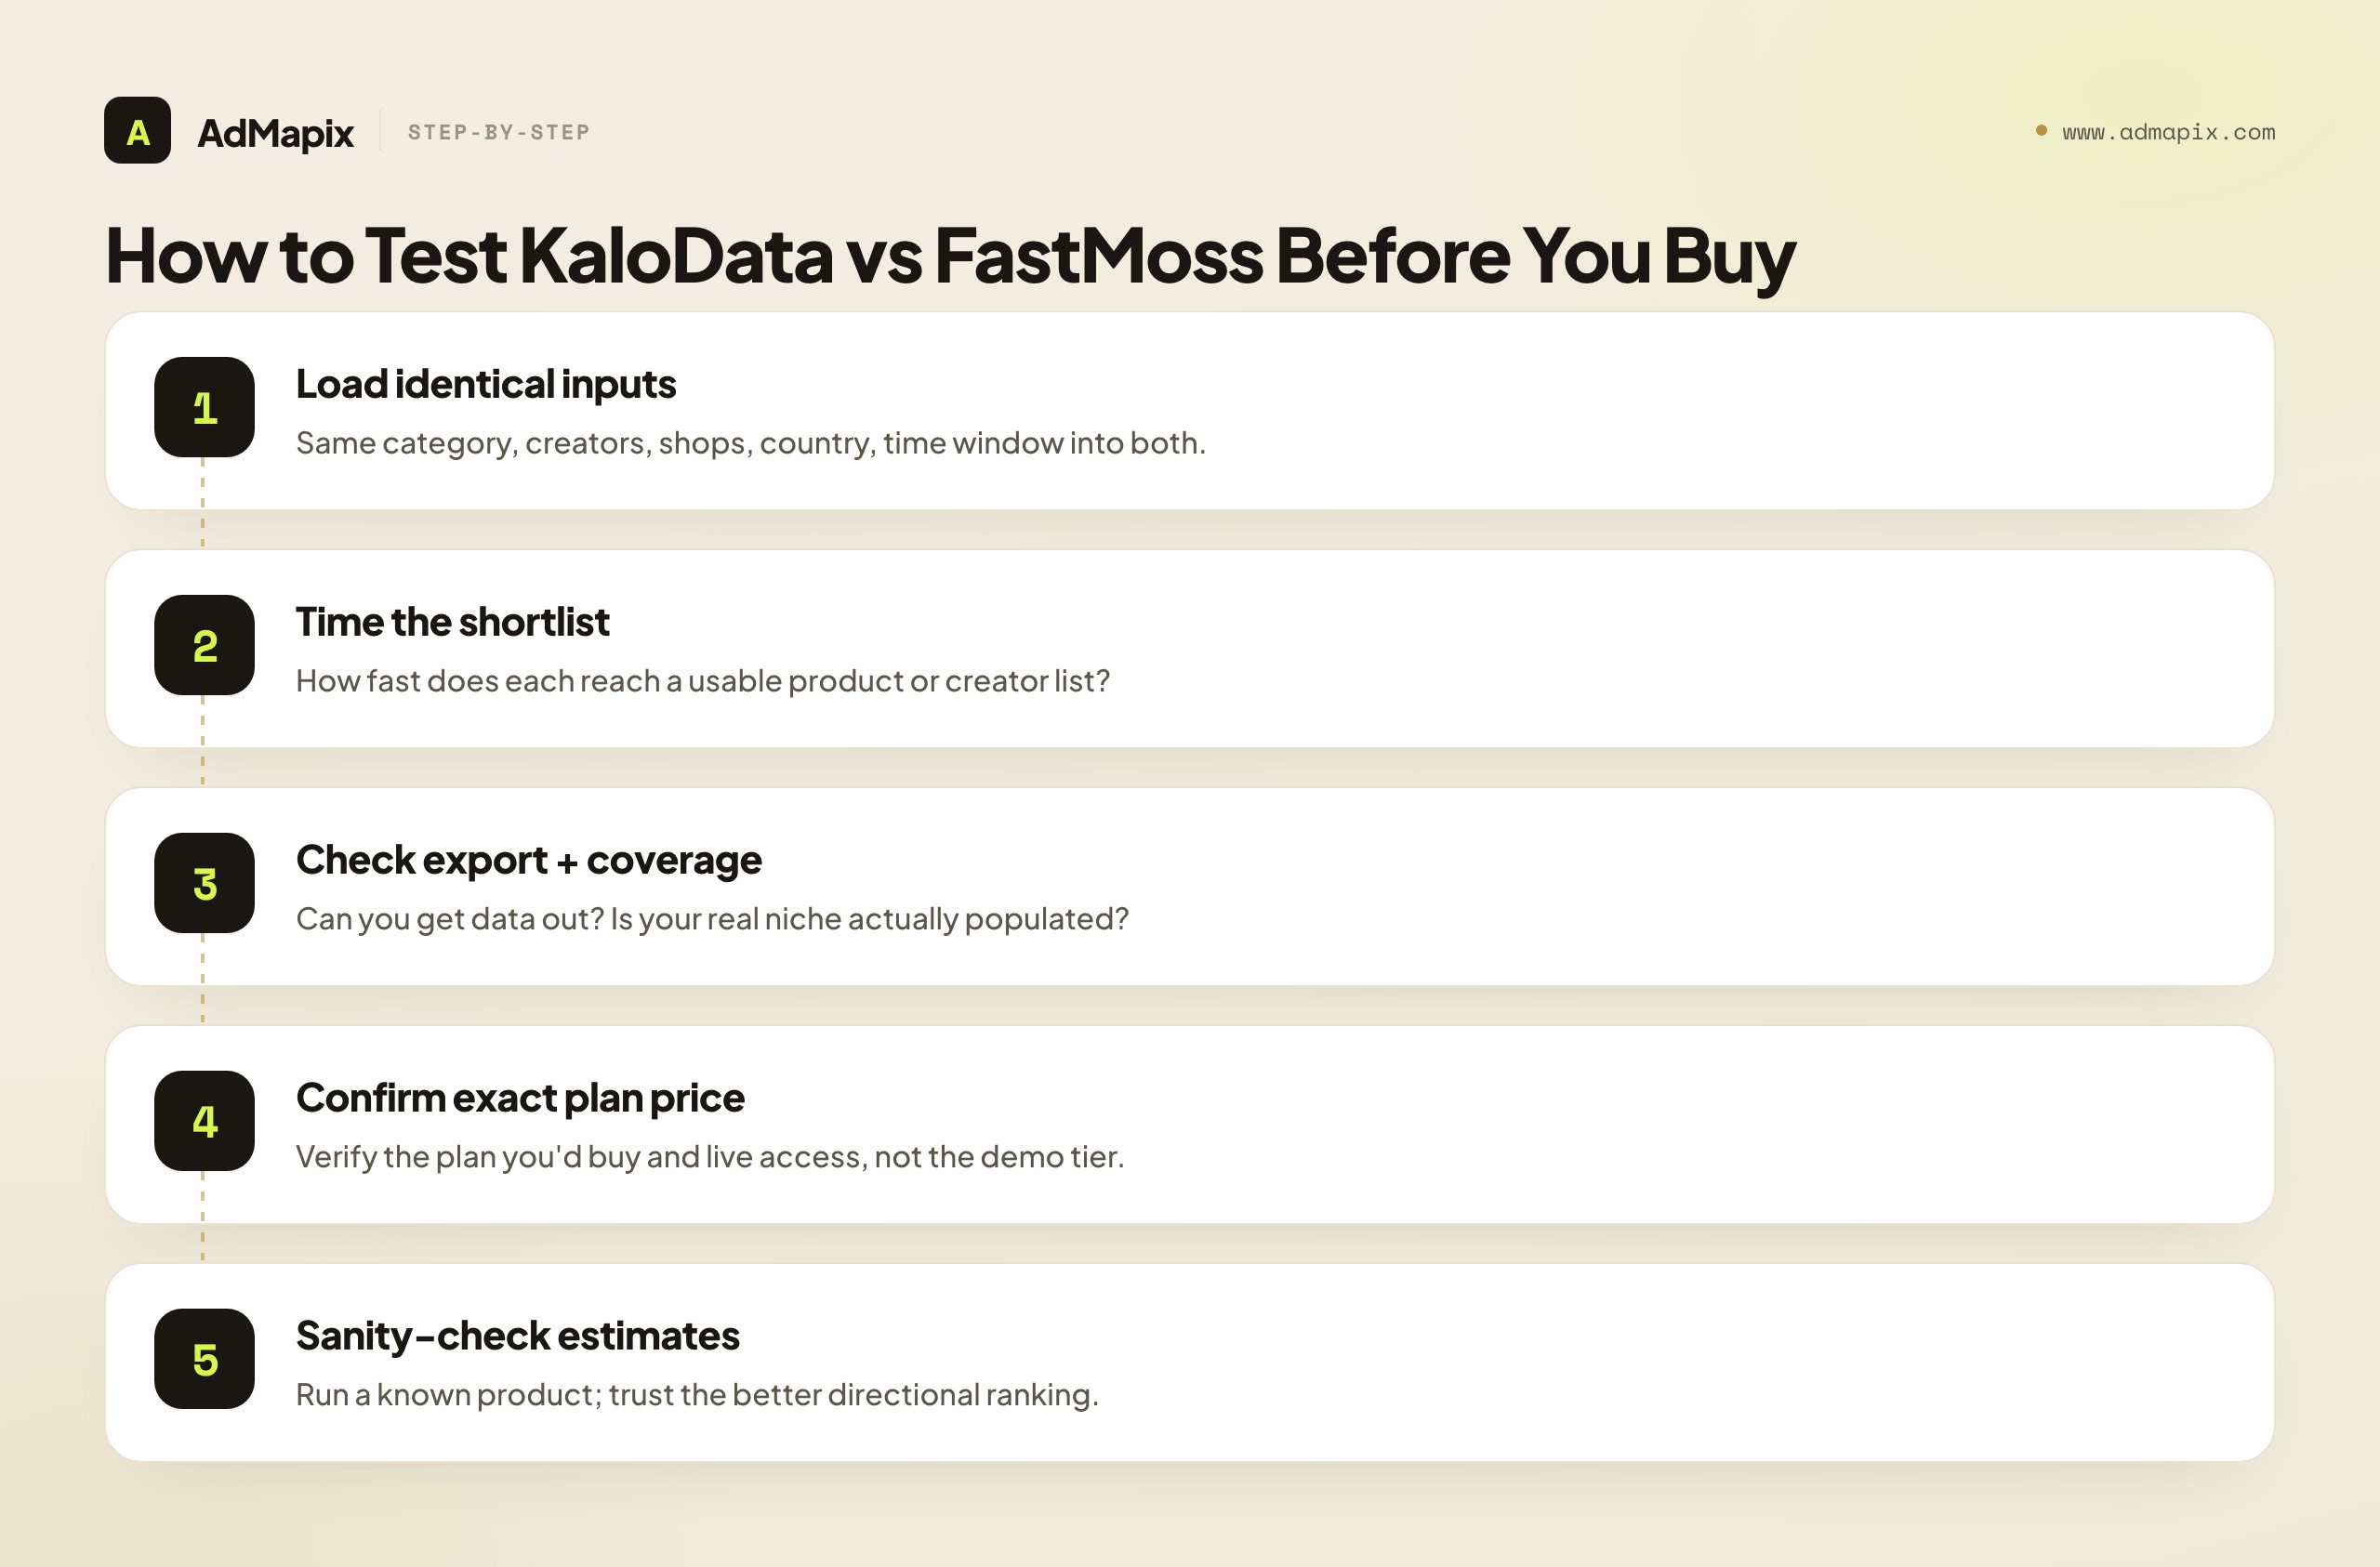
- Load identical inputs. Same product category, same two-to-three target creators, same competitor shops, same country and time window, into both tools.
- Time the shortlist. How long does each take to produce a usable product shortlist or creator list? Speed-to-decision is the real differentiator for a sourcing-led workflow.
- Check export. Can you get the data out in a format your team actually uses? Trapped data is unused data.
- Check coverage. Are your target markets and categories actually populated, or sparse? This is where demos mislead — verify on your real niche.
- Confirm live access and the exact plan price you'd buy, not the marketing tier. Plans and access rules change; verify before committing.
- Sanity-check the estimates. Run a product you already know through both and see whose ranking matches reality. The tool whose directional ranking you trust most in your market is the better buy, regardless of dashboard polish.
Decision Scenarios: Common KaloData vs FastMoss Situations
Most real decisions are variations on a handful of recurring situations. Find the one closest to yours for a direct answer.
"I'm a brand-new seller with one product idea and a small budget." Start with KaloData. Your bottleneck is validating a single product fast, and a focused tool gets you to a yes/no quicker than a broad suite you'll mostly ignore. Don't pay for breadth you won't use yet. When the idea validates and you start advertising, add a creative-intelligence layer — not the other commerce tool.
"I run an agency and need to brief clients on whole categories." Start with FastMoss. Your bottleneck is market-level visibility and reportable output, which is exactly where FastMoss's breadth and market reports earn their keep. Pair it with a creative-intelligence tool so your client briefs include the ad angles behind winning products, because a market report without creative direction is half a deliverable.
"I already use one of them and wonder if I'm missing out on the other." Probably not, if your bottleneck hasn't changed. Switching from KaloData to FastMoss (or back) only makes sense when your questions shift from product-level to market-level, or vice versa. If your real gap is creative — you're picking products fine but your ads underperform — the missing tool isn't the other commerce suite, it's an ad library. Diagnose the bottleneck before buying a second commerce tool.
"I sell across multiple markets including Southeast Asia." Let the trial decide, not the brand. Regional coverage varies, and the tool that's strongest in the US may be thin in SEA or vice versa. Run your exact category in your exact markets in both trials and pick the one whose data is genuinely populated where you operate. Coverage in your market beats any feature list.
"I mostly partner with creators rather than hunting products." Lean toward FastMoss for its broader creator and shop coverage, but test KaloData's creator data too if your partnerships are tightly tied to specific products. The deciding factor is whether you think in "which creators for this product" (KaloData's focus may suffice) or "which creators dominate this whole category" (FastMoss's breadth helps).
"I run paid ads and barely source at all." You may not need either tool as your primary spend. If you already know what to sell and your real job is creative testing, lead with an ad-intelligence tool and add a commerce tool only if and when sourcing becomes a bottleneck. Don't buy a product-hunting suite to solve a creative problem.
The thread through every scenario: name the bottleneck, buy for that, and treat the creative layer as a separate decision from the commerce-tool choice. Almost every wrong purchase in this space comes from buying for a job that isn't actually your constraint.
Common Mistakes in a KaloData vs FastMoss Decision
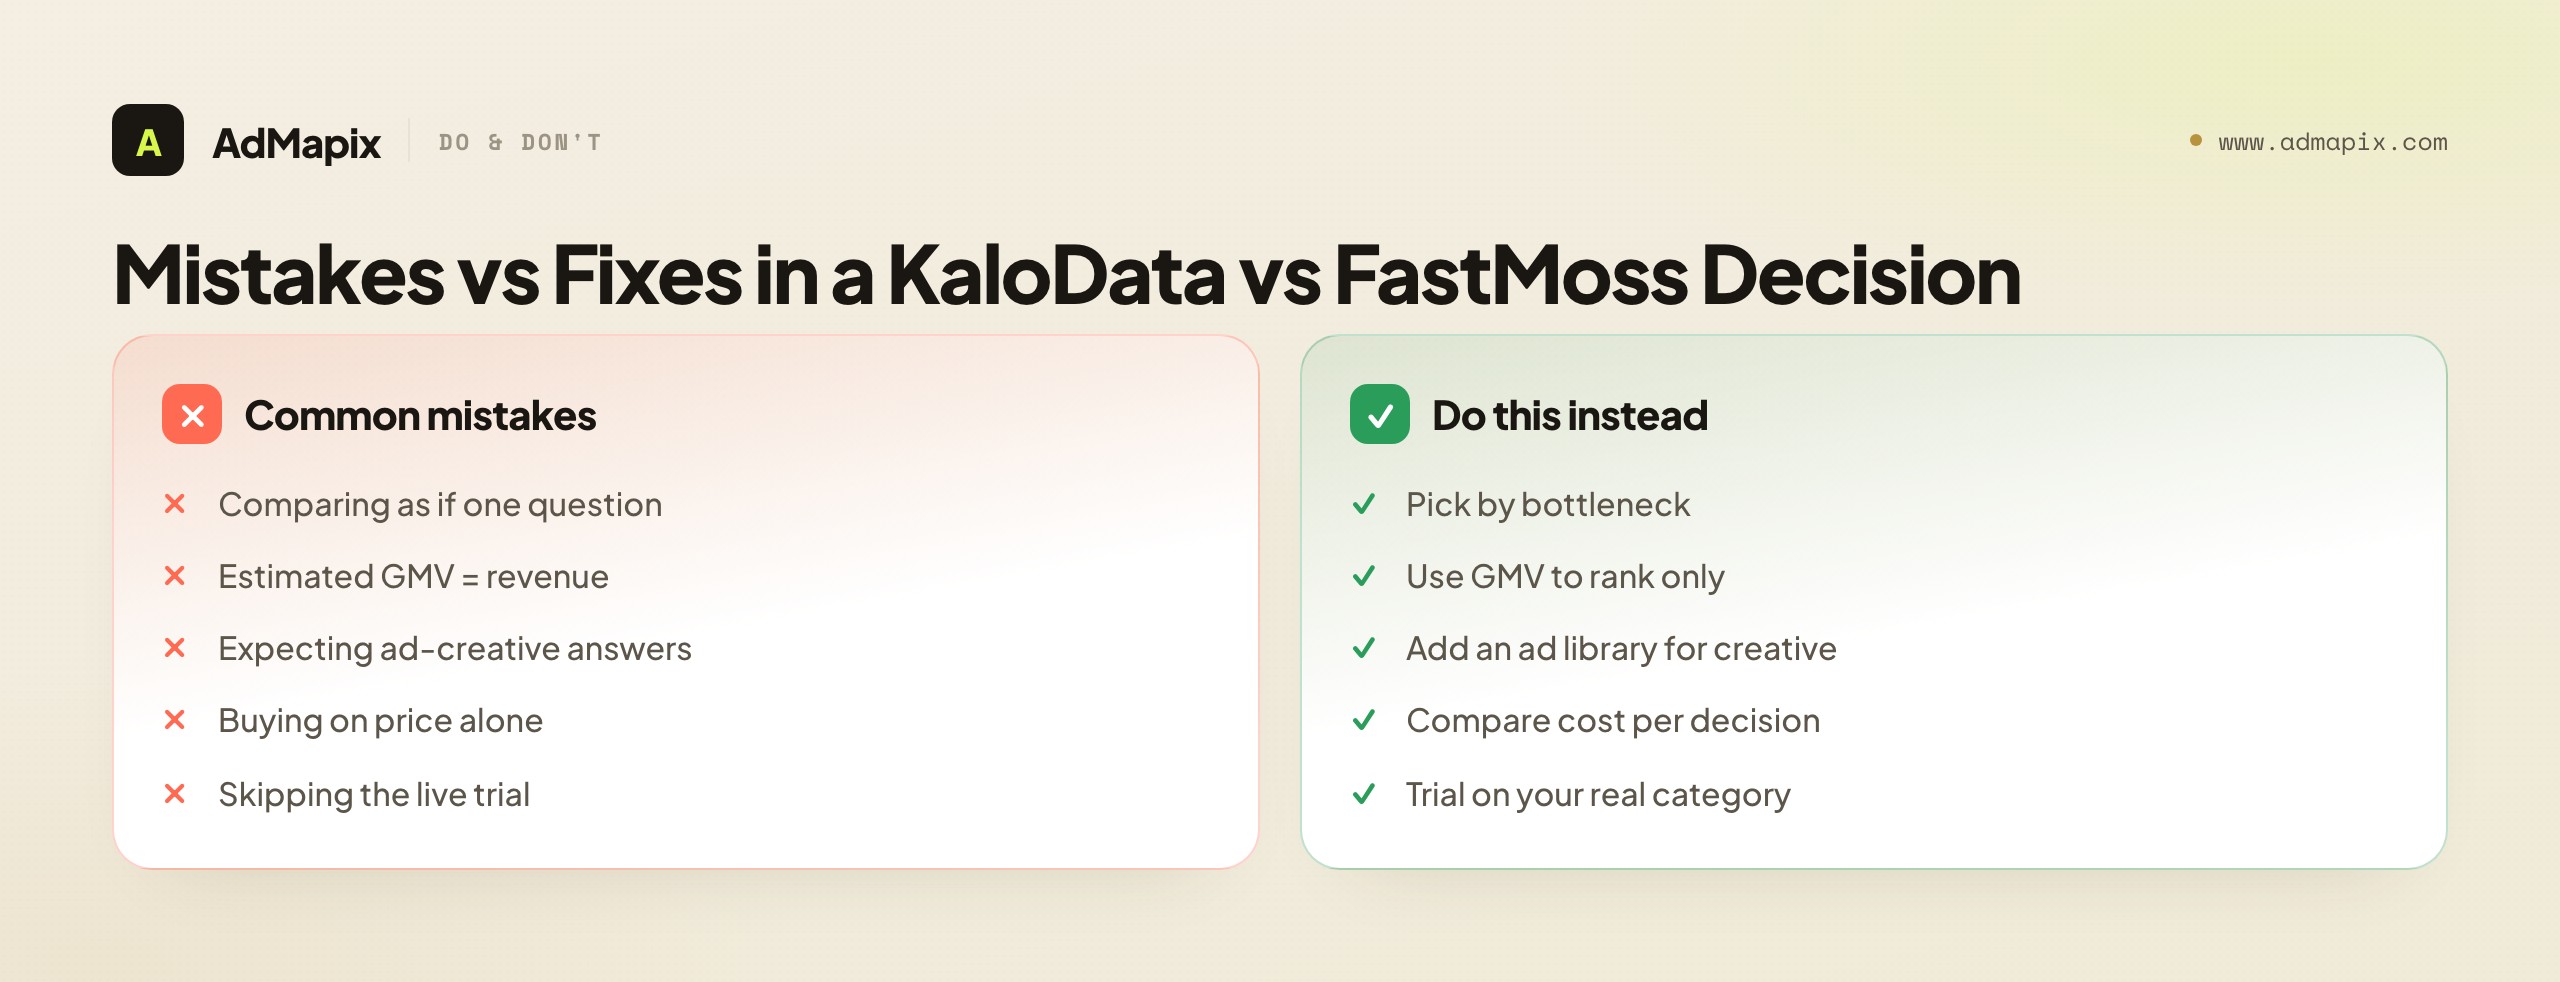
- Comparing them as if they answer one question. Product hunting, creator discovery, and market reporting are different jobs; the "winner" depends entirely on which one you need. There is no universal better tool.
- Treating estimated GMV as audited revenue. Both produce signals, not financial statements. Use them to rank opportunities, never to model a competitor's profit or your own forecast.
- Expecting either tool to explain ad creative. Sales velocity is not a hook. For paid social you still need to study the actual ads — a job neither commerce tool does.
- Buying on price alone. Coverage in your specific markets, data freshness, and export usually matter far more than the list price difference.
- Skipping the live trial on your own category. A tool can look broad and polished in the demo and be sparse in your exact niche. Always trial on real inputs.
- Forgetting the creative layer entirely. Picking the product is half the job; figuring out how to advertise it is the other half — and that needs a different category of tool.
When to Use AdMapix (Honest Positioning)
Use AdMapix when the gap is creative evidence, not commerce data — that is, when you already know what's selling and now need to see and break down the ads behind it. We'll say plainly what it is and isn't, because recommending it for the wrong job would waste your money.
AdMapix is a cross-network ad creative tool for paid-social teams, agencies, and sellers who run ads on TikTok Shop products and want to turn winning products into testable creative briefs. AdMapix is not a TikTok Shop product-hunting or GMV-estimation tool, so it does not replace KaloData or FastMoss for product selection or creator GMV. The two categories are complements, not substitutes.
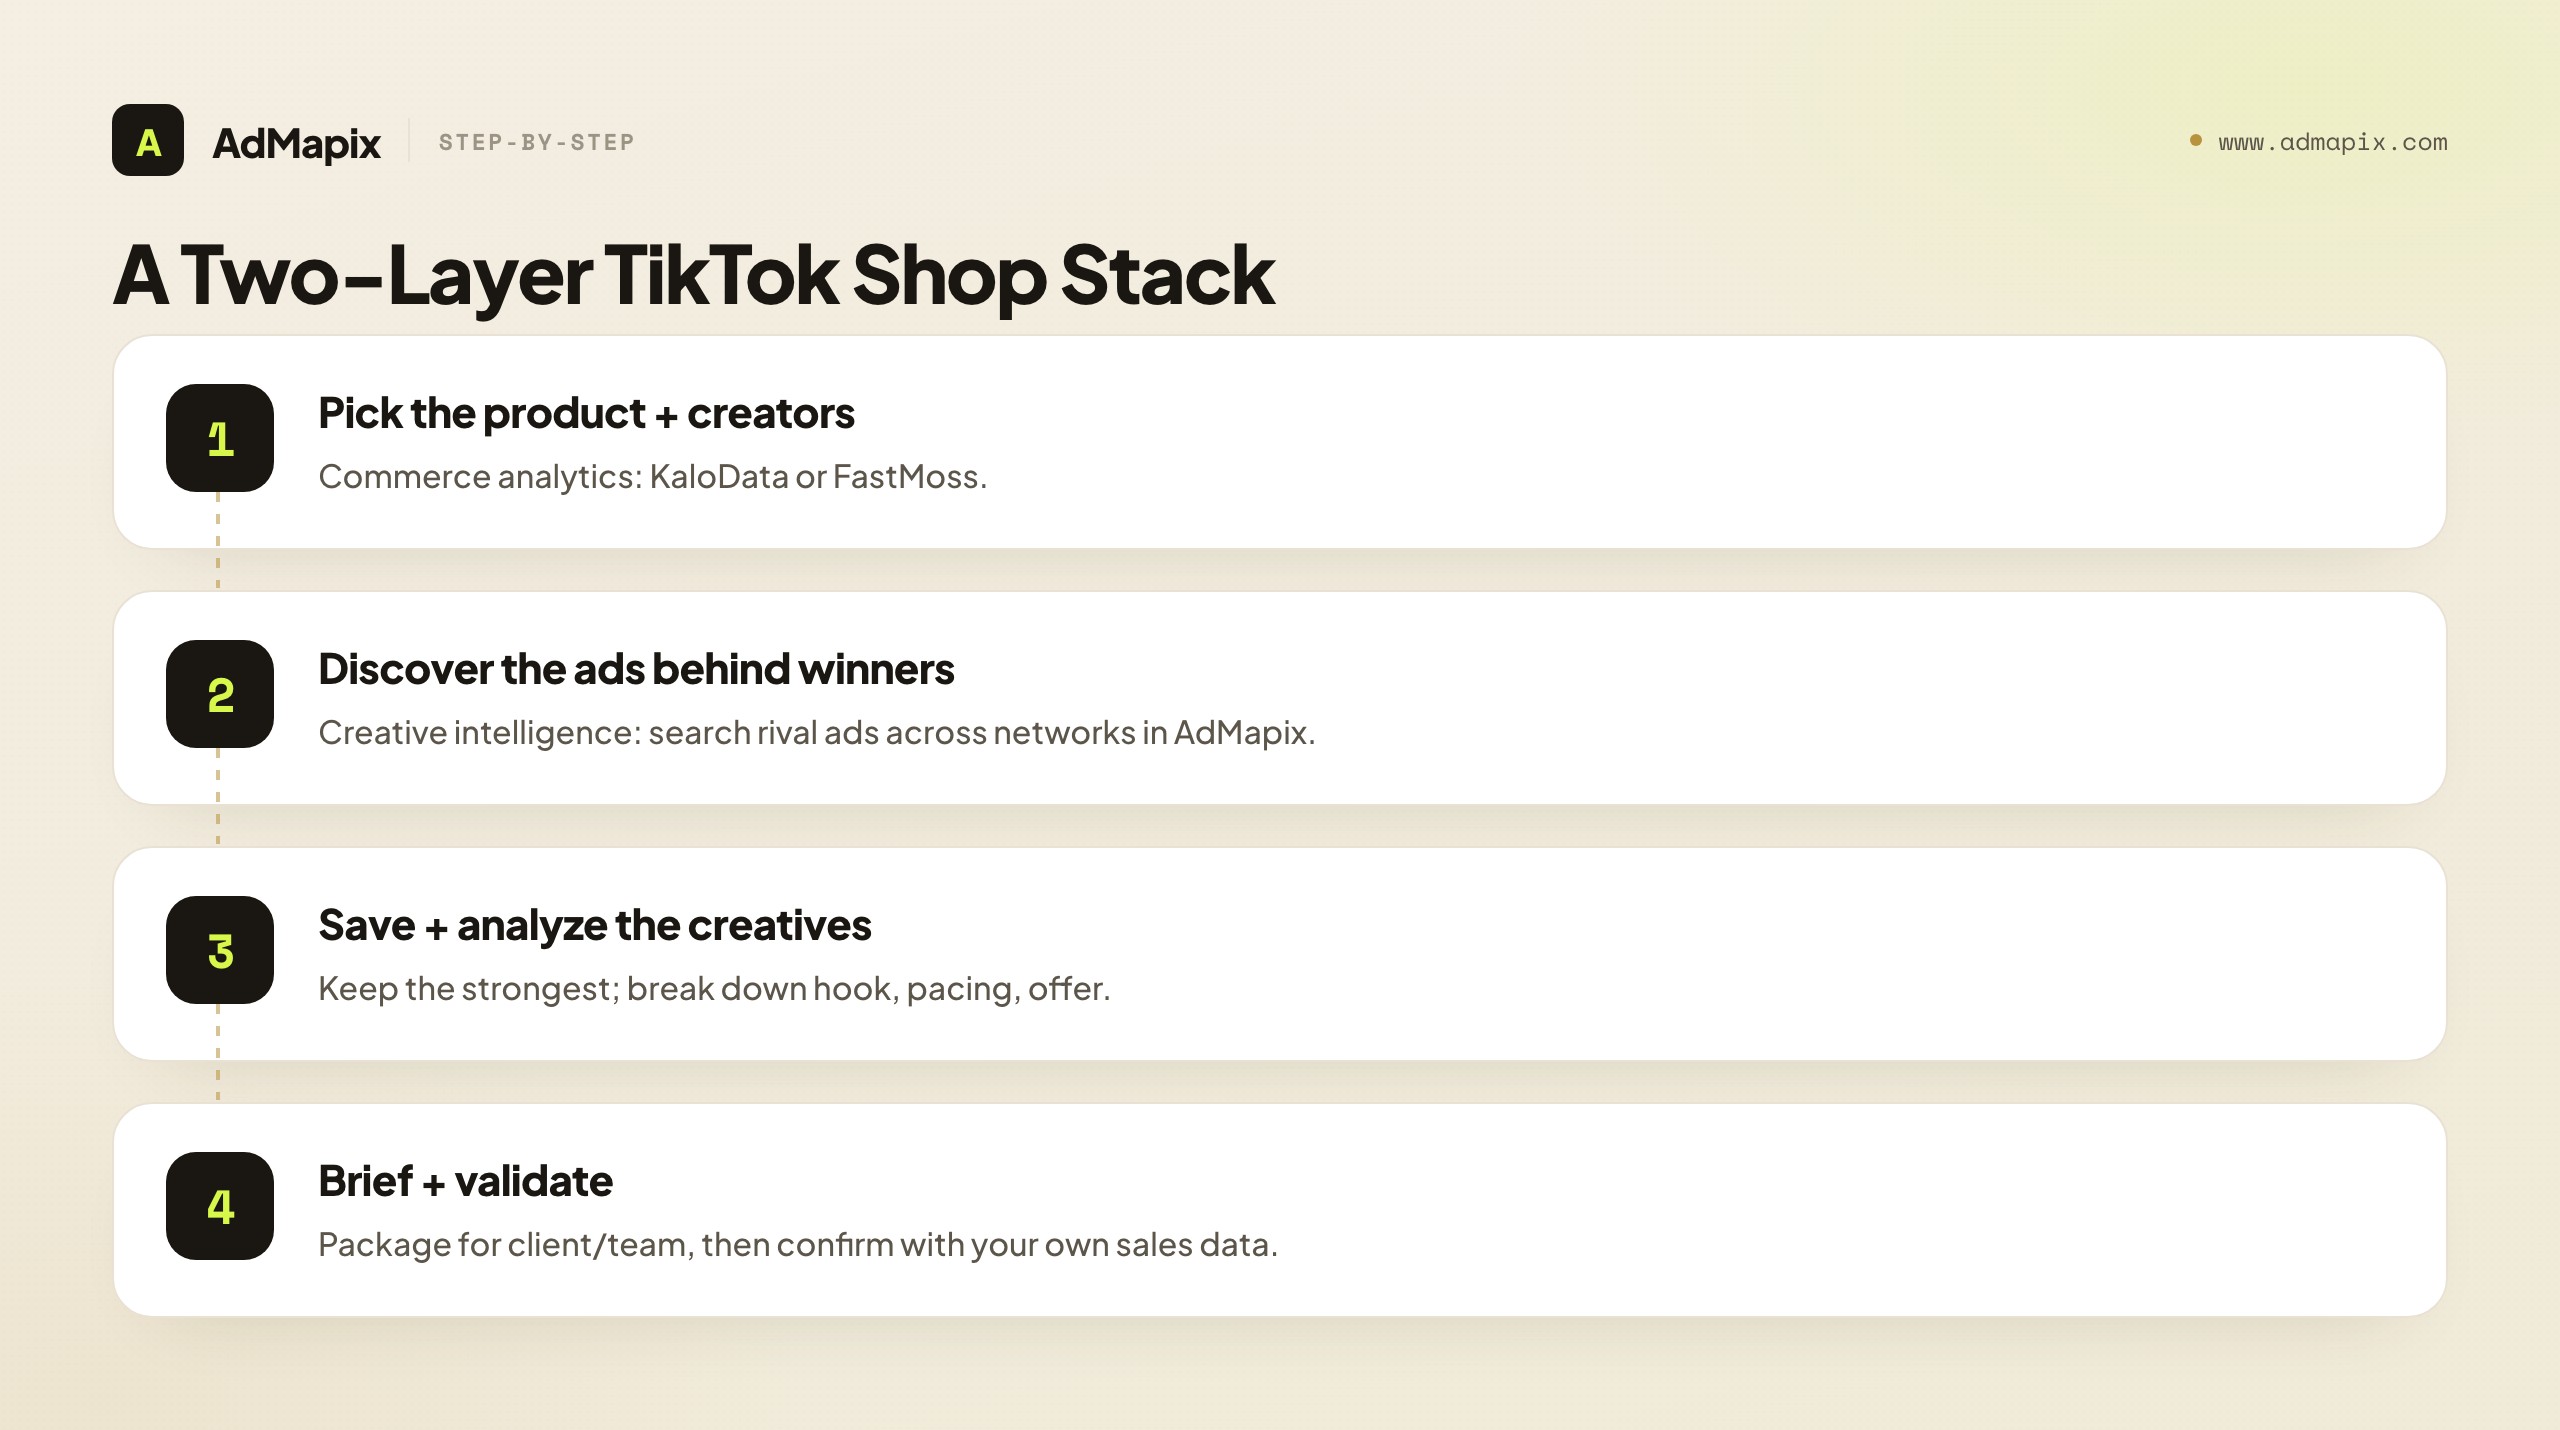
A practical stack keeps the commerce tool for product and creator signals, then adds AdMapix for the creative layer:
| Step | Job | Tool |
|---|---|---|
| Pick the product + creators | Commerce analytics | KaloData or FastMoss |
| Discover the ads behind winners | Creative intelligence | Search AdMapix |
| Save the strongest creatives | Creative intelligence | Media |
| Break down hook, pacing, offer | Creative intelligence | Video Analysis |
| Package briefs for client/team | Creative intelligence | Reports |
If one competitor set needs a weekly review, run it once in Search AdMapix, keep the best examples in Media, and when that saves real briefing time, create an account from Login or compare seats on Pricing. For the full landscape of creative-intelligence tools, see best ad spy tools 2026 and marketing intelligence tools.
FAQ
Is KaloData or FastMoss better in 2026?
Neither is universally better — it depends on your bottleneck. KaloData is the faster pick for focused TikTok Shop product hunting, creator discovery, and livestream/short-video analytics in one dashboard. FastMoss is the better pick when you need broader coverage across shops, ads, LIVE, hashtags, and market reports. If product selection is your blocker, KaloData's focus is often quicker; if market-level visibility is your blocker, FastMoss's breadth earns its place. Test both on your own category before committing.
What is the main difference between KaloData and FastMoss?
The core difference is scope. KaloData is a focused TikTok Shop analytics tool optimized for fast product and creator decisions in a narrow workflow. FastMoss is a broader TikTok commerce suite spanning products, shops, creators, ads, LIVE, hashtags, and market reports. KaloData trades breadth for speed; FastMoss trades simplicity for coverage. Their GMV figures are both modeled estimates, and neither is an ad creative library.
Can AdMapix replace KaloData or FastMoss?
No. AdMapix doesn't estimate TikTok Shop GMV or hunt products — that's not its job. It covers the creative layer those tools lack: cross-network ad creative search, saved media, video analysis, and reports. Use AdMapix alongside a commerce tool to turn the products you find into testable ad briefs, not instead of one for product selection.
Which tool should I trial first?
Start with the tool that matches your immediate decision. If you need to pick products this week, trial KaloData first for speed. If you need market-level visibility or report output, trial FastMoss. Load the same category, creators, and competitors into whichever you test so the comparison is apples to apples, and verify coverage in your exact market.
Are KaloData and FastMoss GMV numbers accurate?
They're modeled estimates, not audited financials. Both derive GMV from observable public signals rather than official TikTok reporting, so they're reliable for ranking and direction but not for exact revenue. The same product can show different GMV in each tool because they weight signals differently. Use them to shortlist and prioritize, then validate winners with your own first-party sales data.
Do KaloData or FastMoss show competitor ad creatives?
Not in depth. Both focus on commerce signals — products, creators, shops, GMV — rather than the ad creatives running behind them. FastMoss has an "ads" module, but it's about TikTok commerce ad signals, not a cross-network creative library with video breakdowns. To study competitor hooks, offers, and video structure across networks, use a dedicated ad creative library and video analysis such as AdMapix.
Why shouldn't I just compare the price?
Because coverage, freshness, and export decide whether the tool actually answers your question. A cheaper tool that's sparse in your target market, slow to refresh, or unable to export the data your team uses costs more in wasted time than the price difference saves. Compare cost per decision made, not the headline list price.
Do I need both a commerce tool and AdMapix?
If you run ads on the products you source, usually yes — they solve different jobs. A commerce tool (KaloData or FastMoss) tells you what to sell and who sells it; AdMapix tells you how the market advertises it so you can build a better brief. If you only source and never run ads, a commerce tool alone may be enough; if you only run ads and never source, you may not need a commerce tool at all.
Should I run both KaloData and FastMoss at the same time?
Usually not — they overlap heavily because they solve the same core commerce job, so paying for both often buys redundant data. A few large agencies keep both (KaloData for fast per-product checks, FastMoss for market reports), but most teams find one suffices. If you have budget for a second tool, the higher-leverage choice is almost always a creative-intelligence layer, which is complementary, rather than the other commerce suite, which is redundant. Switch commerce tools when your bottleneck changes; add a creative tool when you start running ads.
How do I switch from KaloData to FastMoss (or back)?
Switching is low-friction because the core workflow — find a product, validate it, find creators — transfers directly between them; only the interface and coverage differ. The practical steps: trial the new tool on your real category in parallel with your current one, confirm its coverage is genuinely stronger in your markets, export anything you want to keep from the old tool, then cancel once the new one proves itself. Don't cancel first — keep the existing tool until the replacement has demonstrably better data for your niche, since coverage quality varies more by market than feature pages suggest.
How accurate are KaloData and FastMoss, and how do I check?
Both are accurate enough for ranking and trend direction but not for exact revenue, because they model GMV from public signals rather than reading official TikTok sales. The fastest way to know how far off each runs in your category is to calibrate: run your own products through both and compare to your real sales, track a product you can independently watch to test trend responsiveness, and check whether each tool orders a category you know well the way reality does. Write down a one-line trust note per tool from that test — it's accuracy measured on your data, which beats any published claim.
Does team size change which tool I should pick?
It can, beyond the bottleneck question. A solo seller usually wants the focused tool (KaloData) because fewer menus means faster solo decisions and there's no one to spread a broad suite's surface area across. A small team can absorb FastMoss's breadth if different people own product, creator, and market views. An agency almost always leans to FastMoss for its market reports and exportable, client-ready output — and is the one team type that occasionally justifies running both commerce tools, though even there a creative-intelligence layer is usually the higher-leverage second purchase. Match the tool to who will actually use it daily, not just to the job.
Which tool is better for Southeast Asia or non-US markets?
There's no fixed winner — regional coverage varies by tool and shifts over time, so a tool that's comprehensive in the US can be thin in SEA, the UK, or Latin America, and vice versa. Never decide non-US coverage from a demo or a feature page. Run your exact category in your exact target country inside both trials and check whether the data is genuinely populated or sparse. Coverage in your market beats every other dimension, because a tool with great features but empty data in your region answers none of your real questions.
Related Reading
- KaloData alternatives — the full landscape if you're not committed to KaloData
- FastMoss alternatives — the full landscape if you're not committed to FastMoss
- Best ad spy tools 2026 — the creative-intelligence tool landscape
- Marketing intelligence tools — the wider tool stack
- Paid ads competitor research — the workflow the creative layer feeds
- TikTok Creative Center tutorial — free TikTok ad research to pair with either tool
Sources
Official pages were checked as of June 21, 2026. Pricing, product names, availability, platform support, and access rules can change, so verify the exact plan before purchase or migration.
- KaloData official X profile — positions KaloData as a data tool for TikTok, Amazon, and Shopee commerce analysis.
- KaloData App Store listing — describes a TikTok ecommerce data analysis platform for creators, products, livestream, and short-video insights.
- FastMoss LinkedIn product page — describes a TikTok data analytics platform for influencer, product, shop, ad, LIVE, video, hashtag, and data insights.
- FastMoss LinkedIn report post — example of FastMoss publishing TikTok Shop analytics and market reports.
Key Takeaways
- Match the tool to your bottleneck, not to the brand name: KaloData for focused, fast product and creator analytics; FastMoss for broader market intelligence, multi-module coverage, and recurring reports.
- Their GMV and sales figures are both modeled estimates — use them to rank opportunities, never as audited financials.
- They share the same critical blind spot: neither explains the ad creative behind a winning product, and neither goes cross-network.
- Test both on the same category, creators, and time window, then score time-to-decision and coverage in your real markets.
- Add a creative-intelligence layer like AdMapix when you run ads — it turns the products you find into testable briefs the commerce tools can't produce.
See what competitors are really running
Search 91M+ creative combinations across 170+ market labels. New accounts include 30 lifetime Free credits.
Related Articles

Ad Optimization Best Practices: The 2026 Performance Playbook
The definitive 2026 guide to ad optimization best practices — a high-output creative production system, statistically honest A/B testing, budget governance and pacing rules, the metrics that matter, structured account hygiene, an optimization cadence, and an FAQ that settles the hard questions performance teams keep arguing about.

Pathmatics Alternative in 2026: Ad Spend Intelligence vs. Creative Workflow
A complete 2026 buyer's guide to choosing a Pathmatics alternative — why teams look past Pathmatics (now Sensor Tower), what it actually measures, a layered comparison of spend-intelligence suites versus creative-workflow tools across coverage, data type, price, and fit, who should choose which, a practical migration plan, the honest limits of estimated spend, and where a lighter cross-network creative tool like AdMapix fits.

Moat Alternative in 2026: Ad Verification vs. Creative Intelligence
A complete 2026 buyer's guide to choosing a Moat alternative — why teams look past Oracle Moat, what Moat actually does (viewability, invalid traffic, brand safety), the critical split between the ad-verification layer and the creative-intelligence layer, a layered comparison across coverage and fit, who should choose which, a practical migration plan, the honest limits of public creative data, and where a creative-research tool like AdMapix fits.