
Polymarket Ads in 2026: 84.6M Modeled Impressions, 23 Videos, Sports-Led Hooks
A dated US iOS analysis of Polymarket ads covering 30 records, 23 videos, sports-led hooks, impression concentration, timing, and the Kalshi ranking caveat.
Polymarket Ads in 2026: 84.6M Modeled Impressions, 23 Videos, Sports-Led Hooks
AdMapix Research — prepared with Codex and checked against the dated source sample.
Last updated: 2026-11-09
Polymarket’s US creative sample for 2026-10-11 to 2026-11-09 contains 30 verified iOS advertising records, 23 distinct videos, and 84,574,583 modeled impressions. The visible pattern is sports-led: fantasy lineup cards, football language, state and team markets, prediction maps, and app screens that foreground prices or cash-out language. UA managers, creative strategists, and growth teams researching Polymarket ads can use this evidence to decide which hooks and visual systems deserve a controlled test. The same sample also shows concentration: the largest record contributes 23.3% of modeled impressions and the top five contribute 64.4%. This article explains what those frames show, how the timing is distributed, what the US app-store rankings say about Polymarket versus Kalshi, and where the evidence stops.
Quick Answer
- In the frozen US sample, Polymarket ads are all video records, with sports and prediction-market visuals appearing repeatedly across the eight supplied contact sheets.
- The 30 records resolve to 23 unique video fingerprints, four image fingerprints, and no playable fingerprints.
- Modeled impressions total 84,574,583 for 2026-10-11 to 2026-11-09; the top record carries 23.3% and the top five carry 64.4%.
- The sample includes both older records first seen on 2026-09-18 and newly observed records first seen on 2026-11-07 or 2026-11-08, so it is a changing index rather than a single launch batch.
- Polymarket’s US iOS listing ranked #91 for modeled app-store revenue (+0.46%) and #145 for downloads (−72.13%) in the separate 2026-09-29 to 2026-10-28 ranking window. Those are listing-level estimates, not company revenue or trading volume.
What Polymarket Ads Show in the Frozen US Sample
Polymarket’s sampled ads use a recognizable visual language: a dark blue or black background, the Polymarket mark, a vertically framed phone or card interface, and short sports or market messages. The contact sheets show fantasy-style lineup cards, percentage prices, football terminology, a US map built from sports words, and mobile screens with balance or cash-out language. These are observations from fixed timestamp frames at 0, 2, 5, and 10 seconds. They do not establish a full narrative, an ending frame, or what happened between sampled timestamps.
The sample is format-consistent. All 30 records have a video fingerprint, and the evidence reports four image fingerprints attached within the records. No playable fingerprint appears. That makes the visible fleet a video-first set in this particular verified iOS listing sample. It does not establish that Polymarket never uses playables or static-only campaigns elsewhere.
The sports emphasis is broad rather than tied to one named person. The frames show football cards, team or state labels, game-week markers, prediction percentages, and market-style prices. One contact sheet shows a map assembled from football terms such as kickoff, overtime, touchdown, and victory. Another shows a phone interface with a football championship listing. The sample does not verify a placement network such as Instagram, TikTok, YouTube, or Reddit, so those channel names should not be attached to these records.
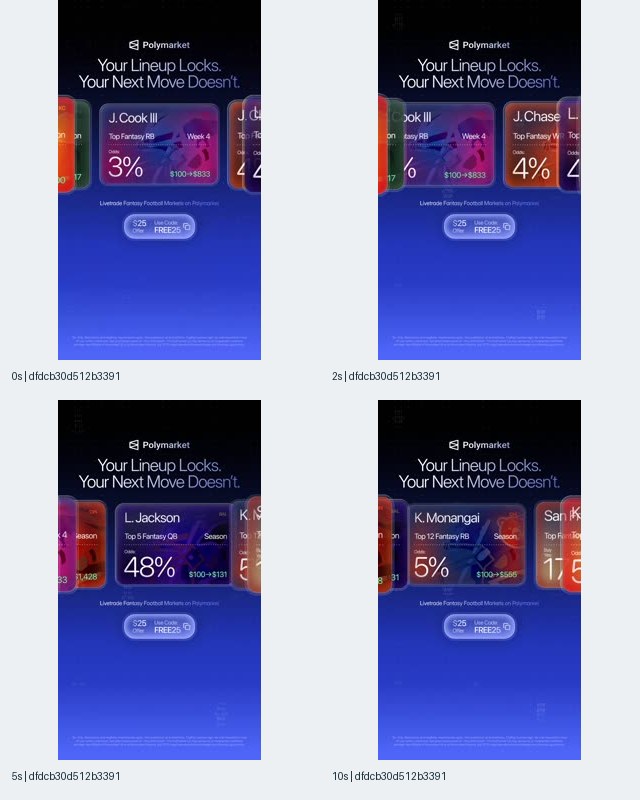
Figure 1. Record dfdcb30d512b33912c7bc2de20b5f377. The sampled frames show lineup cards with percentages and the headline ‘Your Lineup Locks. Your Next Move Doesn’t.’ The sheet contains observations at 0, 2, 5, and 10 seconds only.
Figure 1 is a useful example of the core card system. The central card changes while neighboring cards remain partially visible at the edges, creating a carousel-like sense of choice inside one vertical video. The text presents a decision moment, while the cards carry the concrete sports context. For a creative team, the testable observation is the combination of a stable brand header, a short decision headline, and multiple card variants. The evidence does not show whether this structure improved click-through or installs.
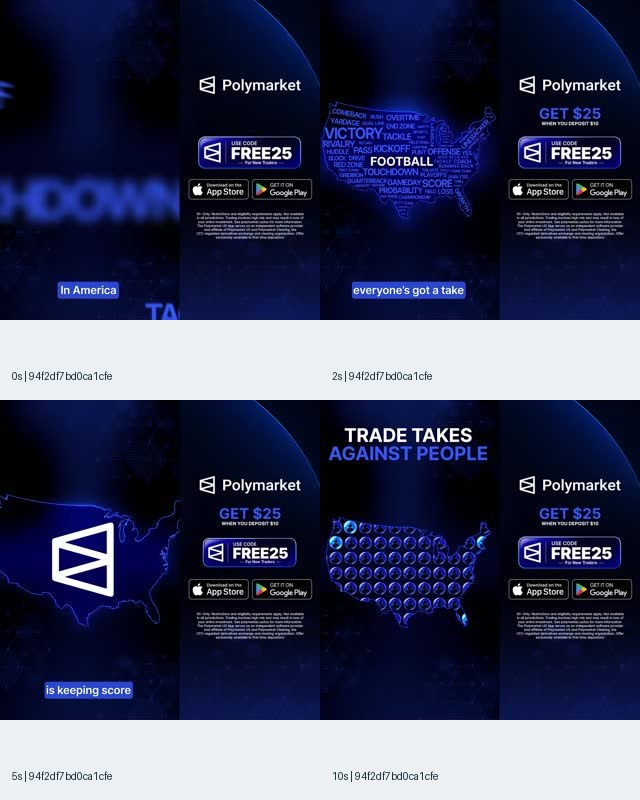
Figure 2. Record 94f2df7bd0ca1cfef023542209c6c276. The frames include Polymarket branding, a US map formed from football words, and visible promotional text. The map and words are visible creative elements; they do not verify a media channel or campaign outcome.
Figure 2 shifts the hook from a single card to a national sports image. The map is surrounded by words connected to football outcomes and game moments. This gives a production team a second angle to test: geographic scale and event vocabulary instead of a lineup interface. The sheet also includes a promotional code and app-store badges. Those are claims or calls to action made in the creative; they are not independent evidence of offer availability, redemption, or conversion.
Methodology and Evidence Limits
The Polymarket sample was fetched on 2026-11-09 for the explicit US measurement window 2026-10-11 to 2026-11-09. The verified entity is the iOS listing Polymarket: Trade Live Sports, track ID 6648798962, seller Blockratize Inc. The search used up to three pages of ten rows, sorted by impression descending. The resulting 30 records are a bounded sample of indexed advertising records, not a complete fleet.
What this sample can and cannot show
- It can show the verified listing attached to each sampled record, the record-level modeled impression estimate, first-seen and last-seen dates, video and image fingerprints, and the visible frames supplied in the contact sheets.
- It can show how the sampled records are distributed across distinct video files and how concentrated the modeled impression estimates are within this bounded pull.
- It cannot show total lifetime delivery, observed delivery, spend, installs, conversion rate, profit, targeting, or return on ad spend.
- It cannot establish that a record ran on a particular social or video network unless the source explicitly verifies that network.
- It cannot establish that the sampled listing represents Android or every Polymarket product identity.
- It cannot prove that a person visible in a frame is a particular celebrity, athlete, creator, or actor.
The impression values are third-party model estimates for the explicit window. They are not observed delivery and should not be described as lifetime totals. Record count is also different from unique asset count: 30 records become 23 unique videos, while four image fingerprints appear in the evidence and no playable fingerprints are present.
The reproducible frozen package, including request parameters, batches, and checksums, is available in the public source snapshot.
Evidence Table: Scale, Concentration, and Timing
The table below copies supplied evidence facts for this one window. It does not add impression values from nested app objects or calculate new ratios.
| Measure | Frozen US iOS sample | Interpretation |
|---|---|---|
| Measurement window | 2026-10-11 to 2026-11-09 | Explicit 30-day window |
| Sampled advertising records | 30 | Bounded records, not a full fleet |
| Unique video fingerprints | 23 | Distinct video files after fingerprint deduplication |
| Unique image fingerprints | 4 | Image files attached within sampled records |
| Records with video | 30 | Every sampled record contains a video fingerprint |
| Records with playable | 0 | No playable fingerprint in this pull |
| Modeled impression total | 84,574,583 | Third-party estimate for the window |
| Top-record share | 23.3% | Share supplied in the evidence facts |
| Top-five share | 64.4% | Share supplied in the evidence facts |
| Top record versus second | 2.0x | Supplied comparison between the first two records |
| Earliest first seen | 2026-09-18 | Earlier than the explicit measurement window |
| Latest first seen | 2026-11-08 | A newly observed record in the pull |
| First seen in the window | 2 records | Records first observed from 2026-10-11 through 2026-11-09 |
| Last seen in final three days | 2 records | Records last observed from 2026-11-07 through 2026-11-09 |
The timing pattern is mixed. Six of the highest-ranked records were last seen between 2026-10-11 and 2026-10-13, while two low-ranked records were first seen and last seen on 2026-11-07 or 2026-11-08. That is an observation of this index pull. It does not prove a deliberate pause, a creative reset, a budget change, or a causal relationship with app-store ranking movement.
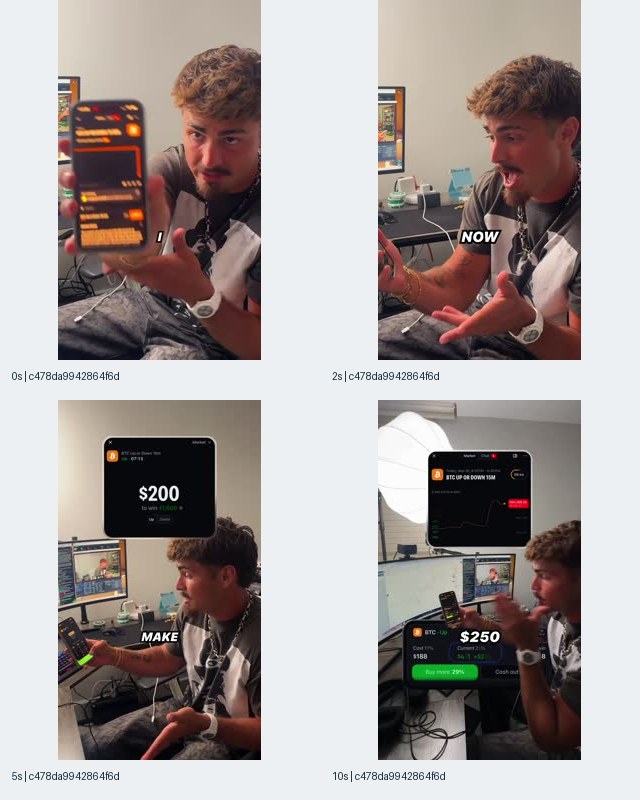
Figure 3. Record c478da9942864f6d8d0f77261ae42d15. A person holds a phone in the sampled frames, followed by screens with visible dollar amounts and market-style interface elements. The person is not identified.
Figure 3 shows a presenter, a phone interface, and visible dollar amounts co-occurring in the sampled frames. The numbers are on-screen claims made by the ad. They should be copied accurately when building a reference library, then checked against the current product and offer before any new production uses them.
The Creative System: Sports Cards, Maps, and App Screens
Polymarket’s sampled creative system has three recurring visual jobs. First, cards turn an abstract prediction market into a concrete sports choice. Second, maps and football vocabulary create a broad event frame. Third, app screens make the message feel operational by showing balances, prices, or market pages. The eight supplied contact sheets let a team compare these jobs without claiming to have watched the complete videos.
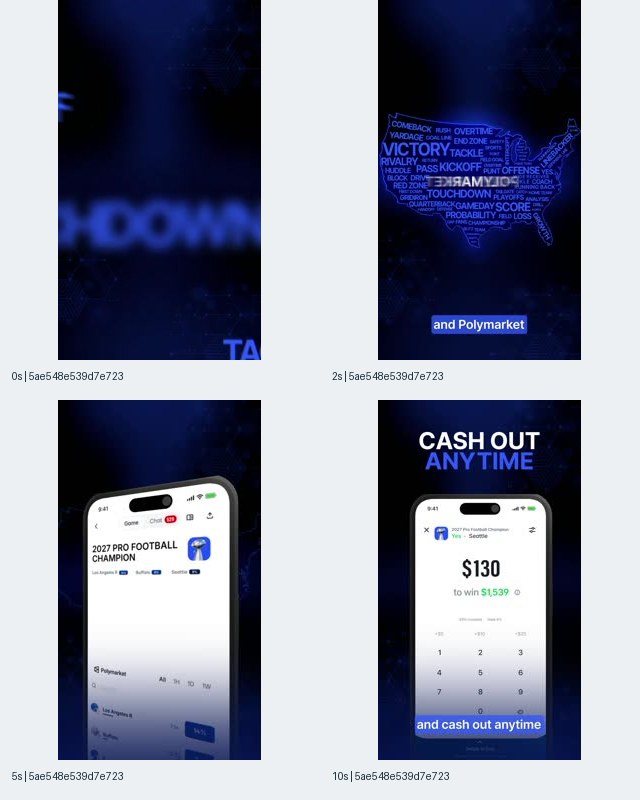
Figure 4. Record 5ae548e539d7e7232dd95094290760c4. The first sampled frame is an abstract blue sports background; later frames show a football map and a phone interface with a visible cash-out message. The contact sheet samples 0, 2, 5, and 10 seconds.
Figure 4 shows how the brand can move from atmosphere to interface. The early frame is mostly blue space and blurred typography, then the map supplies sports context, and the phone supplies a concrete product surface. A brief based on this observation could test whether the map or the phone should appear first. That is a hypothesis for a controlled experiment, not a claim that one order performed better.
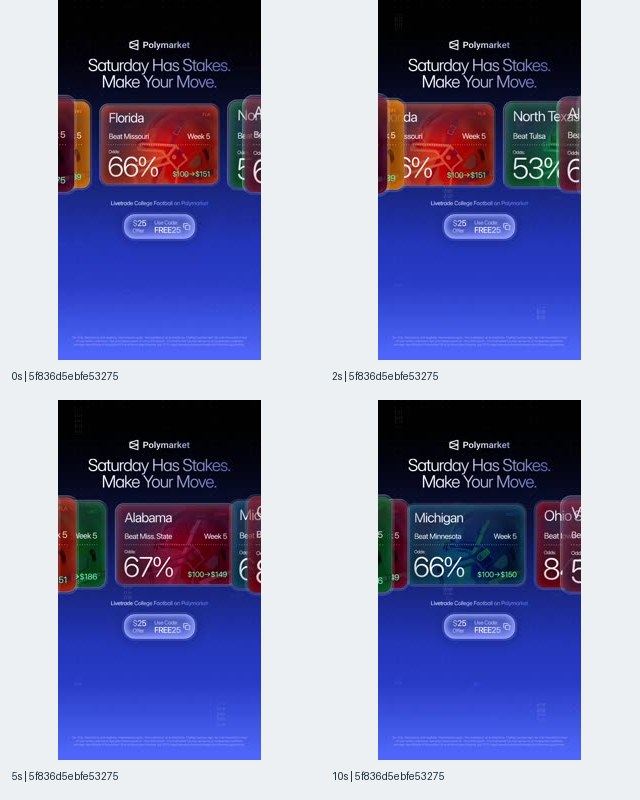
Figure 5. Record 5f836d5ebfe53275e3c9d628579bf599. The frames show state-labelled football cards, percentages, and a promotional button. State and matchup labels are visible in the source; this caption does not identify any person.
Figure 5 makes the card grammar more specific. The cards carry a state or matchup label, a percentage, a week marker, and a price range. The visual hierarchy is compact enough to read on a phone: brand at the top, proposition in the middle, action button below. For a production team, the useful capture fields are card title, sport or event, visible percentage, price language, and timestamp. The sample does not verify whether the cards correspond to a particular league placement or a paid social network.
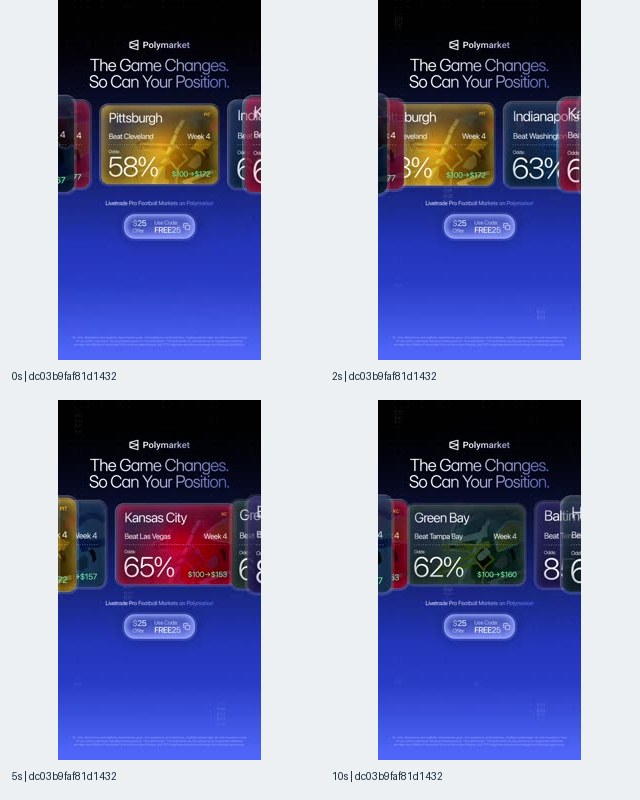
Figure 6. Record dc03b9faf81d1432bbe2d79547049c11. The contact sheet shows multiple football team cards with percentages and week labels against the same blue branded background.
Figure 6 is a close variant of the card-led approach. The repeated background and layout suggest a reusable template, while the central card changes the event or team text. Reuse is visible at the design level, but the evidence does not establish how many impressions each template received outside the supplied records. A creative team can treat the template as a production hypothesis and vary one element at a time: headline, card order, percentage emphasis, or phone-screen transition.
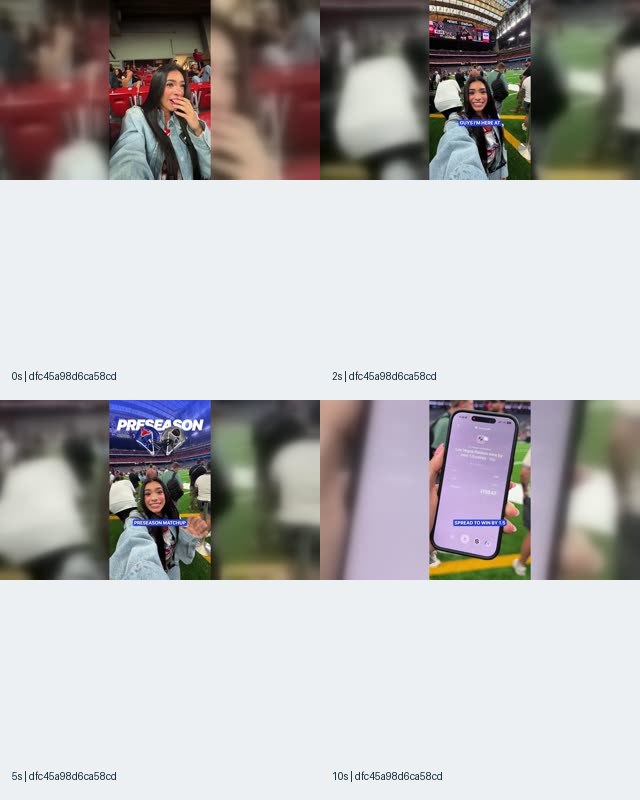
Figure 7. Record dfc45a98d6ca58cda014742bf998ea44. A person appears in a stadium setting, followed by a phone screen with a visible promotional message. No identity is established by the sampled frames.
Figure 7 adds an in-person sports setting to the otherwise graphic-heavy fleet. The stadium context is visible, but the sample does not identify the venue, event, or person. The safe creative takeaway is the contrast between environmental footage and interface footage. Teams researching Polymarket ads can tag this as a presenter or event-context variant while leaving the person and placement fields unresolved.
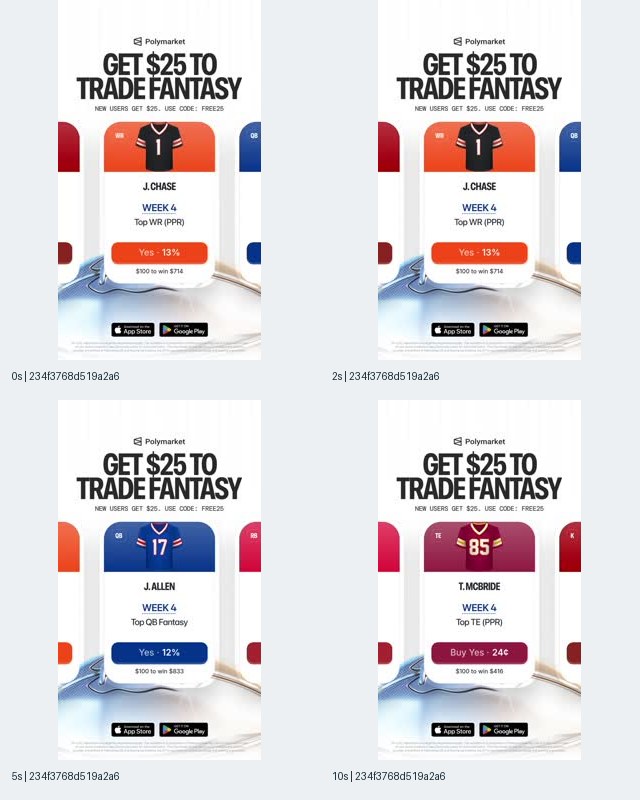
Figure 8. Record 234f3768d519a2a678d2a323b1bc82ab. The frames show a white layout, a fantasy football card with jersey artwork, a percentage price, and app-store badges. Names printed on the card are not used to identify a person.
Figure 8 is the cleanest example of a light-background card treatment. The large headline sits above a single central card, while app-store badges anchor the lower portion. This variant can be compared with the dark blue cards in Figures 1, 5, and 6 to test whether background contrast changes comprehension. The evidence shows the design difference; it does not show a conversion difference.
Timing: What the Dates Actually Show
The frozen sample does not support a single statement that every Polymarket creative disappeared before the end of the window. Instead, the dates show two layers. Several high-impression records were first seen in early October and last seen between 2026-10-11 and 2026-10-13. Two records were first seen on 2026-11-07 and 2026-11-08, and the evidence reports two records last seen in the final three days of the window.
The earliest first-seen date in the sample is 2026-09-18, attached to a record that remained visible into October. The latest first-seen date is 2026-11-08. This spread means the pull contains both historical records that remained indexed and newly observed records. It does not tell us whether the older records were still being delivered continuously, whether they were paused and resumed, or whether index collection changed.
The top record, with 19,670,437 modeled impressions and a 23.3% share, was first seen on 2026-10-03 and last seen on 2026-10-12. The second record was first seen on 2026-10-06 and last seen on 2026-10-12. The third, fourth, and fifth records were first seen between 2026-10-03 and 2026-10-07 and last seen on 2026-10-13. These are record-level dates, not proof of campaign start or stop decisions.
Why Polymarket Can Feel Everywhere in a Bounded Sample
A bounded sample can feel broad when a small set of records carries a large share of the modeled volume. In this pull, the top record contributes 23.3% and the top five contribute 64.4%. The top record is listed at 2.0 times the second record. Those supplied facts describe concentration inside the sampled records; they do not estimate total market reach or prove that Polymarket ads were delivered across every channel.
The 23 unique video fingerprints also matter. Thirty records do not mean thirty wholly different videos. A creative team auditing the fleet should deduplicate by fingerprint before describing variety, then retain the record-level impression estimates for delivery analysis. The evidence reports four image fingerprints and zero playables, so the visible sample is diversified mainly through video files and their card, map, presenter, and app-screen treatments.
The phrase Polymarket ads everywhere is therefore best answered with a scoped statement: the frozen US iOS sample carries 84,574,583 modeled impressions across 30 records, with delivery concentrated in the top five and 23 distinct videos represented. The data does not reveal the number of people reached, frequency, spend, or channel-by-channel distribution.
Polymarket Revenue vs Kalshi: Read the Ranking Carefully
In the separate US app-store ranking snapshot, Polymarket: Trade Live Sports ranked #91 for modeled revenue, up 0.46% versus the previous 30-day period, and #145 for downloads, with downloads down 72.13%. Kalshi ranked #139 for modeled revenue, up 235.89%, and #12 for downloads, with 2,118,376 downloads and a 14.19% decline versus the previous period. The same snapshot reports Polymarket’s revenue estimate at 1.4 times Kalshi’s and Kalshi’s downloads at 3.3 times Polymarket’s.
That comparison uses store-listing-level estimates for the US App Store and Google Play rankings combined, captured in the top 300, for 2026-09-29 to 2026-10-28 versus the previous 30 days. It is separate from the creative window of 2026-10-11 to 2026-11-09 and should not be merged with the 84,574,583 modeled ad impressions.
The revenue ranking is a weak proxy for company revenue because trading can happen outside app-store billing for both products. The ranking does not show deposits, trading volume, gross merchandise value, profit, or total company revenue. It also does not explain why downloads moved. Use it as a directional store-listing estimate, with the rank and period change attached every time.
The Prediction-Market Bracket: Three Fleet Shapes
A separate AdMapix pull captured the top 30 US creatives for Polymarket’s comparison set on 2026-10-30. That bracket uses a 30-day window ending 2026-10-29, from 2026-09-30 to 2026-10-29, and must remain separate from the frozen Polymarket sample above.
| App | Top-30 modeled impressions | Top-creative share | Oldest first seen | First seen in last 30 days | Unique videos |
|---|---|---|---|---|---|
| Kalshi | 4,727,948,715 | 17.3% | 2026-09-04 | 12 of 30 | 28 |
| Novig | 526,278,187 | 19.7% | 2026-08-06 | 9 of 30 | 30 |
The three fleet shapes are useful as separate dated examples. The frozen Polymarket sample is a 30-record verified iOS pull with 23 unique videos, a 23.3% top-record share, and two records first seen inside its 2026-10-11 to 2026-11-09 window. The Kalshi bracket shows 28 unique videos in its own top-30 pull, with 12 records first seen during that bracket window and a 17.3% top-creative share. The Novig bracket shows 30 unique videos, nine first-seen records during its window, and a 19.7% top-creative share.
These are different dated snapshots and different verified listings. They support a qualitative planning point: prediction-market advertisers can present a concentrated center with many variants around it, a broad set of distinct video files, or a mix of older and newly discovered records. They do not support a single league-wide ranking of fleet size, delivery efficiency, or creative quality.
A Practical Workflow for UA and Creative Teams
Use the Polymarket sample as a research worksheet rather than a performance verdict. A repeatable workflow looks like this:
- Lock the entity first. Save the verified iOS listing ID 6648798962 and seller Blockratize Inc. Keep Android or similarly named products in separate records unless identity is verified.
- Lock the window. Write 2026-10-11 to 2026-11-09 at the top of the report. Do not combine it with the 2026-09-30 to 2026-10-29 Kalshi and Novig bracket.
- Deduplicate assets. Record 30 ad instances, 23 unique videos, four image fingerprints, and zero playables as separate fields.
- Build a hook taxonomy. Tag card-led, map-led, presenter-led, app-screen-led, and cash-out or price language. Keep visible text exact, including truncated copy.
- Capture frames by timestamp. Store the 0, 2, 5, and 10 second observations as a contact sheet. Do not call the last sampled frame an end card.
- Separate observation from hypothesis. Observation: a card displays a percentage. Hypothesis: percentage-first framing may improve comprehension. The second statement requires a test.
- Create matched variants. Keep the same offer and audience while changing one variable, such as dark versus light background, card versus map opening, or presenter versus interface opening.
- Measure with first-party data. Use your own impression, click, install, retention, and revenue data to judge the variants. The public sample cannot supply those outcomes.
- Refresh the index. A later pull may add or remove records. Preserve the fetch date, request scope, and source snapshot hash so changes can be explained.
Want to inspect current Polymarket-indexed creatives for your own brief? Search Polymarket in AdMapix, then save the records that match your market and format question. If you want to track new records as they appear, log in to AdMapix and keep the query in your recurring research workflow.
Common Mistakes When Reading Polymarket Ads
The most damaging errors are scope errors rather than arithmetic errors.
- Calling modeled impressions reach. The 84,574,583 figure is a third-party model estimate for the specified window. It is not observed people reached or spend.
- Calling 30 records 30 assets. Fingerprint deduplication leaves 23 distinct videos. Keep records and files in separate columns.
- Treating the sample as the entire fleet. Three pages of ten rows are a bounded, impression-sorted sample. They cannot establish total creative volume.
- Inferring a channel from a frame. A phone interface, app-store badge, or stadium scene does not identify Instagram, TikTok, YouTube, Reddit, or another placement network.
- Identifying people from a frame. The supplied images show people, but the evidence does not establish who they are.
- Completing truncated copy. If an indexed description ends with ellipses, preserve it exactly. Do not fill in missing text.
- Dividing impressions by asset age. Window impressions and first-seen dates do not produce a valid daily delivery rate for these records.
- Combining ranking and ad windows. The revenue and download snapshot uses 2026-09-29 to 2026-10-28; the frozen creative sample uses 2026-10-11 to 2026-11-09.
- Treating store ranking as company revenue. App-store revenue estimates exclude activity outside store billing and do not show trading volume or profit.
- Assuming a visible cash-out or bonus claim is a verified offer. It is an on-screen claim made by the ad and needs current offer verification before reuse.
When AdMapix Fits the Handoff
AdMapix fits teams that need a searchable, dated record of competitor creative evidence: verified product identity, record-level modeled impressions, fingerprints, first-seen dates, and saved visual references. It is useful when a UA manager wants to move from a search query to a tagged test backlog, or when a creative team needs a reproducible contact sheet rather than an unlabelled screenshot folder.
AdMapix does not replace your own campaign analytics, attribution, legal review, or offer verification. It cannot turn a public frame into proof of conversion, targeting, spend, or profitability. Use the live methodology page for the current evidence model and pricing page for current commercial terms; those terms can change while an article is in a publishing queue.
Disclosure: AdMapix is our product, so this article includes it as the handoff for live creative research while keeping the Polymarket observations tied to the dated public sample. If this workflow matches your next competitor brief, log in to AdMapix to save a live search and compare later pulls.
About AdMapix Research: AdMapix Research is the research byline of AdMapix, an ad-intelligence platform. Its articles are built from AdMapix data (creative records, modelled impression estimates and US app-store rankings), prepared with Codex from a dated frozen sample and checked by automated evidence review.
FAQ
Are these official Polymarket ads from every platform?
No. The frozen evidence is a US sample tied to the verified iOS listing Polymarket: Trade Live Sports, track ID 6648798962. It does not verify a placement network and does not establish Android or all-platform coverage. The contact sheets show creative frames associated with the sampled records.
How many Polymarket ad creatives were in the sample?
The pull contains 30 advertising records. After fingerprint deduplication, those records map to 23 distinct videos. Four image fingerprints are also present, and no playable fingerprints appear. Record count and unique asset count should be reported separately.
How many impressions did the sampled Polymarket ads receive?
The sample contains 84,574,583 modeled impressions for 2026-10-11 to 2026-11-09. This is a third-party model estimate for the explicit window, not observed delivery, unique reach, spend, installs, profit, or a lifetime total.
Why do people search for Polymarket ads everywhere?
The sample can explain the perception through concentration and recognizable creative repetition: the top record contributes 23.3% of modeled impressions, the top five contribute 64.4%, and the 30 records resolve to 23 videos. Those facts describe this bounded sample, not total exposure across the internet.
Does the sample show World Cup, Super Bowl, or a specific celebrity?
The supplied frames show football language, team or state cards, and sports-market interfaces. They do not establish a specific World Cup or Super Bowl campaign, and they do not identify any person shown in a frame. A searched-for event or person should be reported only when the frozen evidence visibly supports it.
What does Polymarket revenue versus Kalshi mean here?
In the separate US app-store snapshot, Polymarket ranked #91 for modeled revenue with a 0.46% increase, while Kalshi ranked #139 with a 235.89% increase. Polymarket’s estimate was 1.4 times Kalshi’s in that ranking. These are listing-level estimates, not company revenue, deposits, trading volume, or profit.
Were the sampled Polymarket ads still running at the end of the window?
The timing is mixed. The evidence reports two records last seen in the final three days, including records first seen on 2026-11-07 and 2026-11-08. Several high-ranked records were last seen on 2026-10-11 to 2026-10-13. These dates describe index observations and do not prove delivery continuity or campaign decisions.
How should a creative team use the contact sheets?
Treat each sheet as a timestamped reference at 0, 2, 5, and 10 seconds. Tag the visible hook, interface, text, sport context, and format. Then write a hypothesis and produce a matched variant for your own account. Do not call the last sampled frame an end card or assume the visible claim is current.
Key Takeaways
- The frozen US iOS sample contains 30 records, 23 unique videos, four image fingerprints, and no playables.
- Sports cards, maps, football vocabulary, presenters, and app screens are the main visible creative systems.
- Modeled impressions total 84,574,583 for 2026-10-11 to 2026-11-09, with 23.3% in the top record and 64.4% in the top five.
- Timing is mixed: older October records coexist with records first seen on 2026-11-07 and 2026-11-08.
- Polymarket’s #91 modeled revenue rank (+0.46%) and #145 download rank (−72.13%) are store-listing estimates from a separate window and cannot stand in for company revenue.
- Use the images to form testable creative hypotheses, then validate them with first-party campaign data.
Sources
- Public frozen source snapshot, fetched 2026-11-09, US, 2026-10-11 to 2026-11-09, verified iOS listing 6648798962.
- AdMapix methodology, consulted for the evidence scope and modeled-impression boundaries.
- AdMapix Polymarket search workflow, for live indexed creative research after the dated sample.
- Ad strategy teardown hub, for related dated fleet analyses.
- Kalshi Ads in 2026, a separately dated comparison article.
- Novig Ads and Commercials, a separately dated prediction-market comparison article.
- Rips by Triumph Ad Strategy, a related fleet teardown with its own measurement window.
- AdMapix pricing, for current commercial terms; prices and quotas are intentionally not enumerated here.
Turn these observations into your next creative study
Open the creative library and select samples for your market, network and research question.
Related Articles
Freecash Ads in 2026: 2.77B Estimated Impressions and 16 Videos
A dated US analysis of Freecash ads: 30 verified iOS records, 2.77B modelled window impressions, 16 videos, 12 playables, visible earning claims, revenue-rank limits, and a separate Fetch–Cash Giraffe bracket.
ReelShort Ads & Revenue Rank 2026: Hooks, Reuse, and US Evidence
A dated analysis of 30 US ReelShort advertising records and eight visual examples, covering serial hooks, video reuse, playable associations, sample concentration, and separately scoped revenue rankings.
Kalshi Ads in 2026: What 30 US Records Reveal
A dated analysis of 30 verified US Kalshi advertising records and eight visual examples, covering creative variety, modelled exposure, discovery dates, revenue-ranking limits, and a separately dated Polymarket–Novig comparison.