
Kalshi Ads in 2026: What 30 US Records Reveal
A dated analysis of 30 verified US Kalshi advertising records and eight visual examples, covering creative variety, modelled exposure, discovery dates, revenue-ranking limits, and a separately dated Polymarket–Novig comparison.
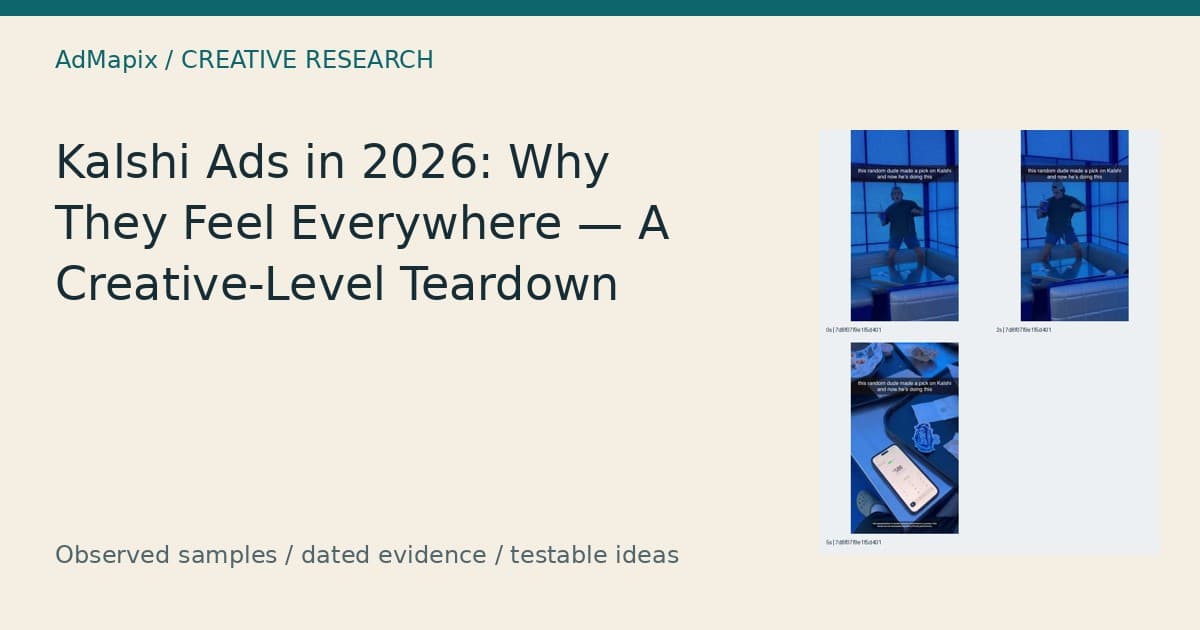
Kalshi Ads in 2026: What 30 US Records Reveal
Last updated: 2026-11-01
AdMapix Research — prepared with Codex and checked against the dated source sample.
Editorial ownership: Brad at AdMapix. This identifies the accountable editorial owner and does not imply personal human review.
Kalshi ads can feel ubiquitous because the sampled advertising combines substantial modelled exposure with many different videos and recognizably different creative approaches. In the US measurement window 2026-10-03 to 2026-11-01, 30 advertising records associated with Kalshi’s verified iOS listing carried 4,682,111,994 third-party modelled impressions and contained 28 distinct video files. The leading record represented 15.9% of that sample; the leading five represented 45.5%. Those figures describe a bounded research sample, not verified delivery or an individual viewer’s advertising frequency. For marketers, creative teams, and operators researching Kalshi, the useful finding is the combination of reaction memes, everyday encounters, event references, and product-screen imagery. The evidence supports a creative breakdown, while leaving spending, conversion, personal targeting, and company revenue unresolved.
Quick Answer
Kalshi’s sampled ads distribute their message across different situations and video files rather than relying exclusively on a single commercial.
- Sampled scale: 4,682,111,994 modelled impressions across 30 US advertising records for 2026-10-03 to 2026-11-01.
- Asset breadth: 28 distinct video files; record count and video count are different measures.
- Concentration: the leading record accounts for 15.9%, and the leading five account for 45.5%, of the sample’s modelled impressions.
- Freshness: 13 records were first seen within the measurement window. The earliest first-seen date is 2026-09-04, so the earlier preview’s “no older than 55 days” description should not be carried forward.
- Creative finding: the eight illustrated examples use celebration, curiosity, memes, regional references, dialogue, interviews, and sports commentary.
- Limits: this sample cannot establish TikTok placement, identify performers, explain anyone’s personal ad frequency, or measure Kalshi’s company revenue.
Why “Kalshi Ads Everywhere” Needs More Than an Impression Total
The evidence supports a substantial, varied sampled advertising presence, but it cannot explain why a particular person repeatedly encounters Kalshi ads. That distinction matters because “everywhere” can refer to different experiences: seeing the same video repeatedly, recognizing the brand in unrelated-looking videos, or encountering several kinds of event messaging. The supplied records describe advertising instances and estimated exposure within a specified window. They do not contain a viewer-level exposure history.
The creative variety is directly visible. A person standing on a table under blue lighting, a stranger in a driveway, a cat meme, and a presenter discussing Texas look like different pieces of entertainment. Yet their records all connect to the same verified iOS listing. A reasonable hypothesis is that varied situations can create repeated brand recognition without requiring viewers to see an identical opening every time. The sample does not measure that effect.
For an operator, this changes the research question. Instead of asking only which commercial has the biggest estimate, ask how the sampled advertising introduces the brand through different kinds of attention. Does the viewer first receive a joke, a question, a familiar location, an argument, or a screen? How quickly does that opening connect to the advertised subject? What information is still missing when the sampled frames stop?
For a creative team, the output should be a set of distinct communication problems. Celebration requires a credible connection between reaction and subject. A driveway encounter requires curiosity to resolve into a relevant explanation. A screen-led example requires readable information. These are different production tasks, even when the records point to the same product.
This article belongs to the AdMapix ad strategy teardown series. Its contribution is a dated account of this particular sample, with observations and proposed tests kept separate.
Methodology: Verified iOS Identity, Exact Dates, and Bounded Sampling
This analysis uses a frozen US sample fetched on 2026-11-01 at 18:44:16 UTC, with the explicit measurement window 2026-10-03 to 2026-11-01. The research query was Kalshi, but inclusion depended on the verified iOS product ID 1632713844, not a name match. The verified store listing is Kalshi: Trade Sports & Events, with seller KALSHI INC. The advertising sample is limited to that iOS listing and must not be extrapolated to Android or every platform.
The collection requested up to three pages of ten records, sorted by descending modelled impressions. It returned 30 records. This is a bounded top-record sample, not a census of Kalshi’s advertising. Ads outside those pages, ads absent from the index, and activity outside the selected country and dates are not represented by the totals below.
The public frozen source package makes the captured batches, request parameters, and checksums publicly inspectable and reproducible. Reproducibility here means that readers can inspect how this dated package supports the analysis. A later live query may return different records or estimates and should be treated as a new observation.
Counting units. An advertising record is an instance in the returned data. A video fingerprint identifies a video file represented in those records. The sample contains 30 records with video, 28 distinct video fingerprints, two distinct image fingerprints, and no playable fingerprints. The image files are reported separately; they are not added to the video count to invent a combined asset total. A record can contain more than one media type.
Impression definitions. All advertising impression figures are third-party model estimates for the explicit window. They are not observed delivery, unique people reached, spending, installs, profit, or lifetime totals. Record-level figures come from each record’s own impression value. Product-search aggregates and impression values nested within associated-app information are excluded. The sample totals and concentration figures are supplied calculations, not newly constructed ratios.
Visual scope. The eight images are timestamped contact sheets from the eight leading records. Figures 1, 3, and 4 show frames at 0, 2, and 5 seconds. Figures 2, 5, 6, 7, and 8 show frames at 0, 2, 5, and 10 seconds. These are selected frames, not complete playback. They do not establish audio, everything said between frames, the complete narrative, or the final call to action.
Attribution scope. A verified listing association does not identify who purchased an ad. The supplied source code has no verified network-name mapping in this package, so it is not translated into TikTok, Instagram, YouTube, or another placement. Visual style is analyzed independently of distribution.
Other dated evidence. The app-ranking discussion uses a separate US snapshot for 2026-09-29 to 2026-10-28, captured in the editorial research dated 2026-10-30. The Polymarket–Novig advertising bracket uses 2026-09-30 to 2026-10-29, pulled on 2026-10-30. Those figures remain separate from the newer Kalshi sample. No cross-window ratios or attention rankings are constructed.
Evidence Table: What the Kalshi Sample Actually Measures
The central finding is a sample with many distinct video files and a measurable leading group of records, rather than a sample dominated entirely by one advertising instance. The table below records the supplied aggregate facts. Each value belongs to the same verified iOS scope and the same US measurement window, 2026-10-03 to 2026-11-01.
| Measure | Frozen sample value | Appropriate interpretation |
|---|---|---|
| Advertising records | 30 | Returned instances, not unique videos |
| Records containing video | 30 | Every sampled record has an associated video |
| Distinct video files | 28 | Fingerprint-deduplicated video files |
| Distinct image files | 2 | Separate image fingerprints associated with records |
| Distinct playable files | 0 | No playable fingerprints in this sample |
| Modelled impression total | 4,682,111,994 | Third-party estimate for the selected window |
| Leading record share | 15.9% | Share of sampled modelled impressions |
| Leading five records’ share | 45.5% | Record-level concentration within the sample |
| Leading record versus second record | 1.5× | Supplied ratio of record-level estimates |
| Earliest first-seen date | 2026-09-04 | Earliest discovery among sampled records |
| Latest first-seen date | 2026-10-26 | Latest discovery among sampled records |
| Records first seen within the window | 13 | Discovery recency, not verified production dates |
| Records last seen in the final three days | 20 | Recent indexed observations, not continuous-delivery proof |
The absence of playable files describes this sample only. It does not establish that Kalshi never uses interactive advertising elsewhere. Similarly, 28 distinct files do not establish 28 original concepts: different edits can have different fingerprints while sharing an idea, performer, or filming session.
The practical value of this table is that it separates questions that are often collapsed. Record count describes returned instances. File count describes media duplication. Concentration describes the distribution of modelled impressions across records. Discovery dates describe what the index observed over time. None of those measures substitutes for conversion data.
Concentration: A Leading Group Without a Single-Record Majority
The leading Kalshi record carries 746,705,332 modelled impressions, or 15.9% of the sampled total, while the leading five carry 45.5%. The supplied leading-to-second-record ratio is 1.5×. These measures make the leading group worth examining, but they do not justify calling any record the highest-converting ad, the most profitable commercial, or the creative receiving the largest verified budget.
The distinction between record concentration and video concentration matters here. The driveway video illustrated in Figure 2 appears in another sampled advertising record with the same video fingerprint. Its displayed record estimate therefore describes one instance, not every instance associated with that video. A separate pair elsewhere in the sample also shares a video fingerprint. The aggregate count of 28 distinct videos already accounts for file reuse.
This article does not combine those records into a new video-level impression total. Doing so would require a clearly labelled aggregation and a supplied calculation. Instead, the analysis uses the available record-level concentration facts and the independently supplied file count. That preserves the distinction between “the leading record” and “the most exposed underlying video.”
For creative planning, the leading records are useful reference points because they show different communication structures within the same bounded selection. The first example foregrounds a reaction. The second opens with a strange situation. The third uses a meme to carry a comparative statement. The fifth places market imagery above a presenter. Their coexistence supports studying multiple approaches; it does not reveal the advertiser’s testing allocation.
A team deciding what to produce next should therefore avoid copying only the first row. The more defensible task is to identify which opening structures address its own communication problem, then design an original test. Modelled exposure helps prioritize inspection. It does not supply the result of that test.
Freshness: September Carryover Alongside October Discoveries
The frozen sample combines records first seen before the measurement window with records first seen during it. The earliest first-seen date is 2026-09-04, the latest is 2026-10-26, and 13 records were first seen within 2026-10-03 to 2026-11-01. That supports a description of September carryover alongside October discoveries. It does not establish a production calendar, launch cadence, or a complete history of the advertiser’s creative library.
The earlier preview’s statement that no top-30 creative was older than 55 days should not be repeated as a current finding. The frozen evidence includes a record first seen on 2026-09-04 and last seen on 2026-10-30. Reporting those dates is more precise than retaining an age ceiling from a different observation date.
First seen also needs careful interpretation. It is the first observation reported by the source, not a filming date, editing date, approval date, or guaranteed campaign launch. A creative could exist before the source discovers it. Likewise, a record first seen during October could use an older production concept. Discovery recency and creative originality are separate questions.
The supplied fact that 20 records were last seen in the final three days of the window indicates recent indexed observations. It does not establish uninterrupted activity between first and last discovery. Nor does an earlier last-seen date prove that a campaign stopped permanently. A monitoring report should preserve the date and leave the reason unresolved.
The operational lesson is to inspect both established and newly observed examples. Figure 1 comes from a record first seen on 2026-09-09; Figure 8 comes from one first seen on 2026-10-23. Each offers a different reference for production, but the dates do not prove that one approach replaced the other.
The Rips by Triumph teardown offers another context for asking how far a bounded sample’s discovery history extends. Its figures belong to its own dated research. They are not used as a numerical benchmark for Kalshi here, and a short observed history should never be rewritten as proof that a product has no older advertising.
Example 1: Celebration Before the Phone Screen
The leading sampled record introduces Kalshi through an exaggerated reaction before showing a phone. The visible structure connects an unusual social scene to a brand reference in the overlay, then places an interface in view. That makes it a useful example of reaction-led storytelling, while leaving the actual cause of the reaction and any financial outcome unverified.
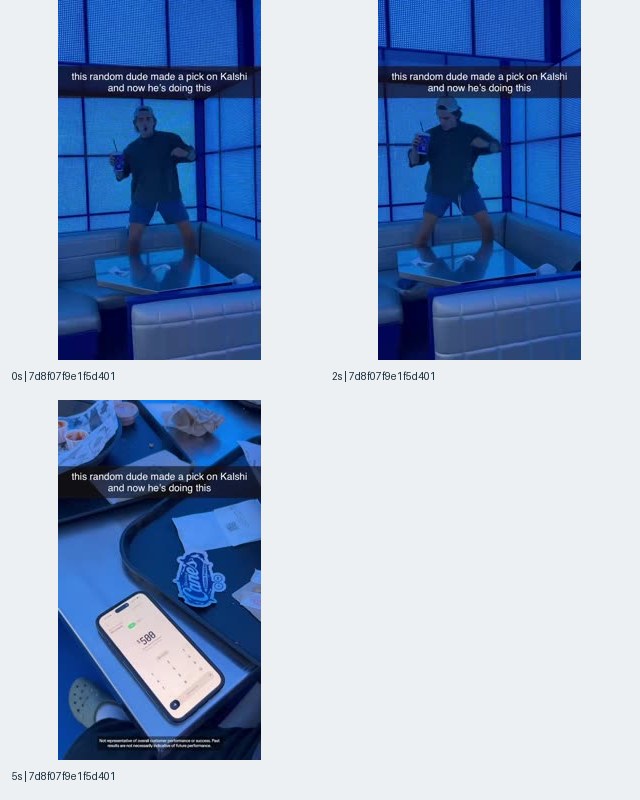
Figure 1. Contact sheet for record 7d8f07f9e1f5d401891bc0c523ad6479, associated with Kalshi’s verified iOS listing. Observed timestamps: 0, 2, and 5 seconds. The record carries 746,705,332 modelled impressions for 2026-10-03 to 2026-11-01; the images are creative evidence, not performance proof.
At 0 and 2 seconds, a person stands on a table inside a booth under blue lighting, holding a cup. The overlay reads, “this random dude made a pick on Kalshi and now he’s doing this.” At 5 seconds, the view changes to a phone lying on a table near a tray and paper items. The sheet does not establish that the person owns the phone or that its display records the cause of the reaction.
The opening asks viewers to interpret behavior. The brand name supplies context before the interface appears. A hypothesis for an original test is that placing the product reference inside the opening situation can preserve brand association even when the visual begins as entertainment. That hypothesis requires audience testing; the modelled impression estimate does not validate it.
For a production brief, separate the emotional beat from the evidence beat. Specify the reaction the performer should communicate, the exact product statement that is supportable, and the screen detail the audience needs to recognize. If the reaction implies a financial result, the brief needs a factual basis for that implication rather than a borrowed screenshot.
The visible phone should be treated as an object in the ad. Its presence does not establish an account balance, realized earnings, or a typical user experience. Small disclosure text is visible near the bottom of the later sampled frame, but this reproduction should not be used to reconstruct wording that cannot be read confidently.
An acceptance check for a new version would ask whether viewers can explain what the reaction relates to without inventing a result. That is a more useful production question than whether the clip “looks like a winner.”
Example 2: A Driveway Encounter Creates a Question
The second record frames its opening as an unexpected person parked in a driveway. Its sampled progression moves from a distant view through blinds to a close view of the driver, creating a visible question before the fragment “to sign up” appears. The frames support a curiosity-based encounter format, but not a complete explanation of the conversation.
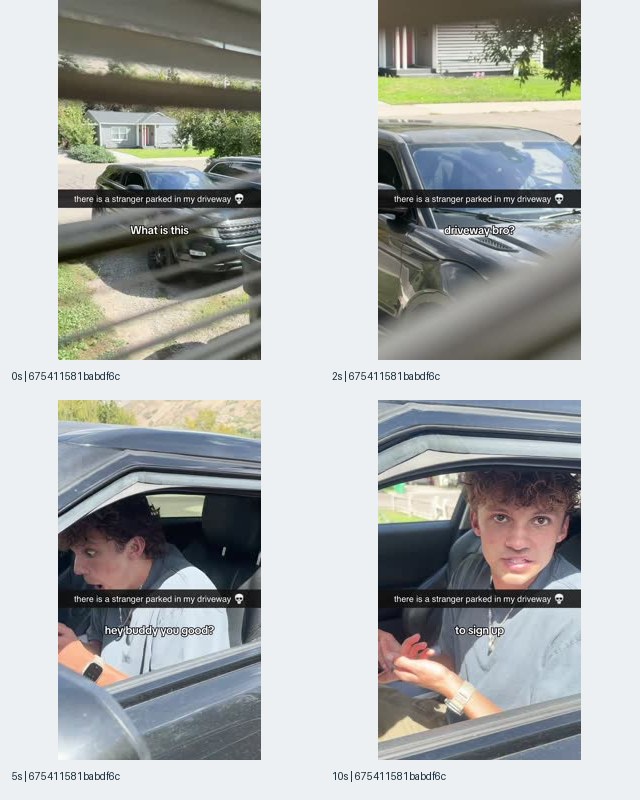
Figure 2. Contact sheet for record 675411581babdf6cd354c44743f1727b, associated with Kalshi’s verified iOS listing. Observed timestamps: 0, 2, 5, and 10 seconds. The record carries 511,204,488 modelled impressions in the Kalshi measurement window.
The persistent overlay says, “there is a stranger parked in my driveway,” followed by a skull symbol. At 0 seconds, the image looks through horizontal blinds toward a dark car. At 2 seconds, the car is closer in view. At 5 and 10 seconds, a person is visible through the open driver-side window. The sampled subtitles include “hey buddy you good?” and “to sign up.”
The scene’s factual status remains unknown. It may be staged, spontaneous, or assembled from a longer interaction; the contact sheet cannot establish which. It also cannot establish the identity or professional role of the person shown. Describing the visual as an encounter format is sufficient for creative analysis.
The useful structural distinction is between situation curiosity and product curiosity. The opening supplies the former: why is this person here? The later subtitle suggests a move toward an action, but the sampled frames do not preserve the complete bridge. A researcher should mark that bridge as unobserved rather than filling it with an assumed pitch.
For an original production, write the bridge explicitly. The unusual situation should lead to a question the product can answer accurately. Otherwise, the opening risks becoming a detachable joke that viewers remember without understanding the subject. That is a proposed creative concern, not a measured outcome from this record.
The shared video fingerprint elsewhere in the sample also makes this example useful for asset management. Preserve the underlying video reference while retaining each advertising record’s separate dates and estimate. Treating every row as a newly produced driveway video would inflate the apparent production count and obscure reuse.
Example 3: A Cat Meme Carries a Comparative Claim
The third example puts a product comparison into text surrounding a cat meme. Its visible argument is stronger than its visual demonstration: the text asserts advantages, while the central image supplies a humorous scene. The analytical task is to distinguish what the ad says from what the evidence establishes about Kalshi.
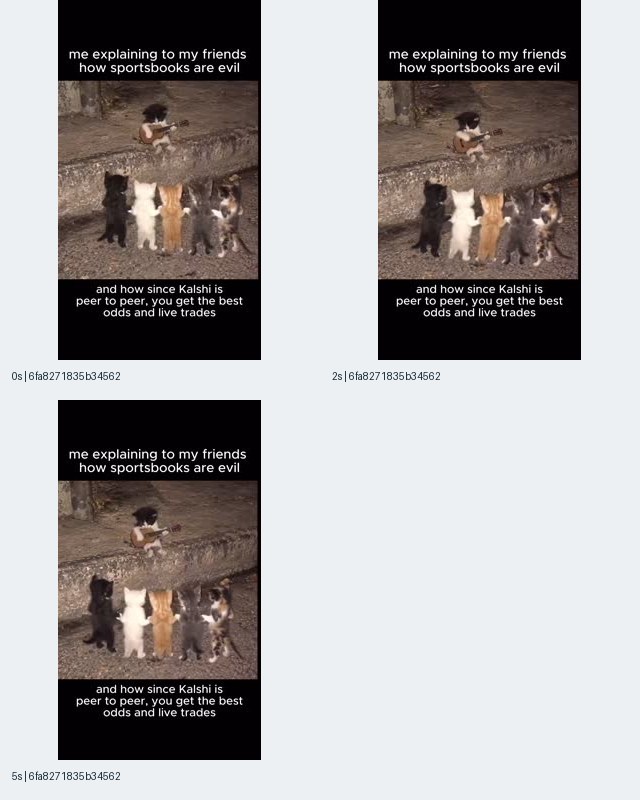
Figure 3. Contact sheet for record 6fa8271835b34562062753febde9adb9, associated with Kalshi’s verified iOS listing. Observed timestamps: 0, 2, and 5 seconds. The record carries 316,172,172 modelled impressions in the Kalshi measurement window.
The upper text reads, “me explaining to my friends how sportsbooks are evil.” The lower text says, “and how since Kalshi is peer to peer, you get the best odds and live trades.” Between those statements is an image of a cat holding a small guitar above a row of cats. The same broad composition appears across the sampled timestamps.
Those statements are advertising claims. This analysis does not endorse the moral characterization of sportsbooks, validate “best odds,” or establish a product capability from the phrase “live trades.” The image does not supply a comparison method, competing prices, transaction conditions, or an independent demonstration.
The transferable creative structure is an explanation presented as a familiar social joke: someone enthusiastically explaining a subject to friends. The audience in the image gives the text a conversational setting without requiring an on-camera presenter. A hypothesis is that this wrapper could make an explanation feel less formal. The sample contains no comprehension or persuasion measurement.
For a new brief, preserve the distinction between the wrapper and the claim. A team can create an original visual about explaining a product to friends while replacing comparative language with a statement supported by its own product evidence. Humor does not reduce the need to substantiate the sentence carrying the commercial message.
A useful review question is whether the text remains accurate when removed from the meme. If the sentence becomes indefensible in plain prose, the visual has not solved that problem. Another question is whether the audience can read both text blocks at the intended display size. The contact sheet reveals the layout, but it does not establish comfortable reading time during actual playback.
Inspect the Indexed Creatives Before Building a Brief
The useful next step is to inspect the relationship between the opening, the visible claim, and the associated product record. The first examples already show why a folder labelled “Kalshi UGC” would be too coarse: a reaction scene, a driveway encounter, and a text-led meme solve different communication tasks. They should remain distinguishable in a research report.
You can inspect Kalshi-related indexed creatives in AdMapix and use this article’s evidence fields as a checklist. Start with the listing identity, then record the observation date, selected window, media file, visible wording, and unresolved questions. A live search is a discovery surface; it is not guaranteed to reproduce the frozen selection automatically.
When reviewing a new result, avoid assigning a format solely from its first thumbnail. A person holding a phone might appear in a testimonial, a scripted scene, a product explanation, or a joke. Preserve what the sampled frames actually show before choosing a strategic label. That makes the eventual brief more specific and reduces the temptation to copy a surface style without understanding its information structure.
Example 4: A Fisheye Gym Scene Gives a Caption Its Meaning
The fourth example relies on a relationship caption to connect a gym image to Kalshi. The circular fisheye view is visually distinctive, but the text supplies the commercial meaning. Without that text, the sampled frames would establish only a person in a gym-like setting, not a product outcome.
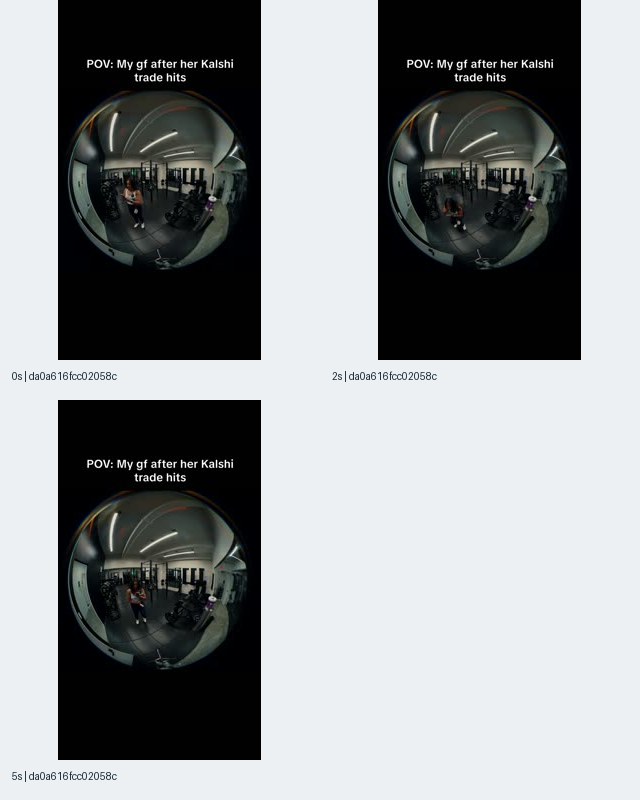
Figure 4. Contact sheet for record da0a616fcc02058cd58e254833d2c409, associated with Kalshi’s verified iOS listing. Observed timestamps: 0, 2, and 5 seconds. The record carries 279,398,365 modelled impressions in the Kalshi measurement window.
The caption reads, “POV: My gf after her Kalshi trade hits.” A circular, distorted view shows gym equipment, overhead lights, and a person whose pose differs across the sampled frames. The surrounding black area gives the caption and circular image a simple visual hierarchy. The sheet does not establish the person’s relationship to anyone or document a completed trade.
This is an example of caption-dependent interpretation. The image and wording need each other to produce the intended joke. The picture supplies an unusual reaction setting; the caption names the supposed reason. That connection is an observation about the creative, not evidence that the depicted event occurred.
For production teams, the lesson is to test the relationship between text and image deliberately. If the image can support many unrelated captions, the brand meaning may depend heavily on whether viewers read the overlay. A proposed test could compare a caption-led opening with an opening that also includes a clear, supportable product reference in the scene. The present evidence does not tell us which version would work better.
The phrase “trade hits” also illustrates why research notes should preserve original wording. Rewriting it as a verified win, a guaranteed result, or a typical earnings experience would add claims the frames do not establish. The appropriate note is that the ad frames the scene as a reaction to a successful outcome.
The 5-second image is the last sampled frame in this sheet. It is not labelled an end card, and it should not be described as the conclusion of the ad. Any later explanation or call to action remains outside the visual evidence used here.
Example 5: Texas References Connect a Presenter to Market Imagery
The fifth example uses explicit Texas references and a split-screen arrangement to connect a presenter with several kinds of event imagery. The visible sequence moves from a weather-related headline to a Dallas–New York sports display and then a Texas gas-price question. It shows how the ad packages topics, without establishing current product availability or the accuracy of the displayed values.
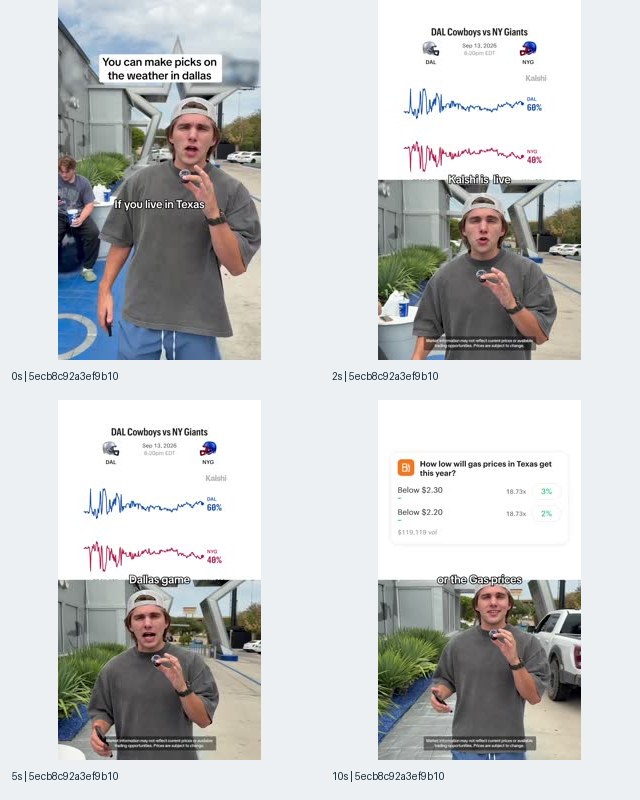
Figure 5. Contact sheet for record 5ecb8c92a3ef9b1027f910b37232ee83, associated with Kalshi’s verified iOS listing. Observed timestamps: 0, 2, 5, and 10 seconds. The record carries 275,427,657 modelled impressions in the Kalshi measurement window.
At 0 seconds, a presenter outdoors holds a small microphone beneath the text, “You can make picks on the weather in dallas.” A subtitle says, “If you live in Texas.” At 2 and 5 seconds, a chart headed “DAL Cowboys vs NY Giants” occupies the upper part of the frame while the presenter remains below. At 10 seconds, the upper display asks, “How low will gas prices in Texas get this year?”
The geographical references are visible messaging choices. They do not prove that the advertising was targeted specifically to Texas residents. Country-level sampling establishes the US research scope; it does not reveal campaign location settings. Similarly, a market screen in an ad is not a current product test.
The creative question is how to explain breadth without losing a coherent audience reference. Here, Texas provides that reference across different topics. A hypothesis is that a shared geographical context could help viewers understand why several examples belong together. The sheet supplies no evidence about whether viewers recognized that connection.
For an original brief, choose a common organizing idea before collecting interface examples. That idea might be a place, a recurring decision, or a clearly defined user task. Each screen should contribute to the explanation rather than merely increasing the apparent number of features.
The split-screen design creates a practical production requirement: the screen must remain legible while the presenter remains expressive. Ask reviewers to identify the displayed topic without pausing or enlarging the video. Also check that spoken claims, overlay text, and the destination page describe the same current offer. These are proposed acceptance checks, not tests performed on this ad.
Example 6: Dialogue Framing Places a Screen Inside a Scene
The sixth example places a branded phone screen between close views of people in an indoor scene. The sampled images support a dialogue-oriented commercial format with a product insert, but they do not establish the full exchange, the performers’ identities, or a particular event beyond the text visible on the phone.
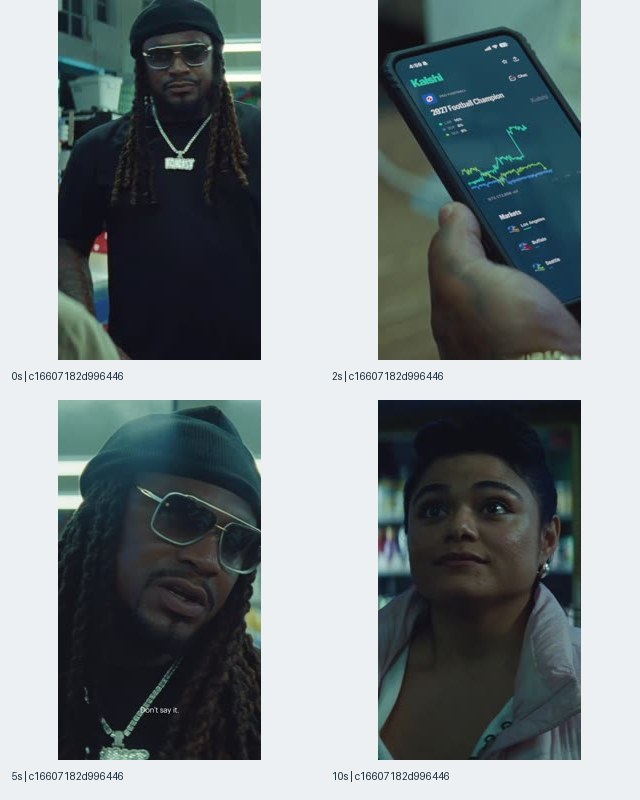
Figure 6. Contact sheet for record c16607182d99644685b9ca367c32a1d7, associated with Kalshi’s verified iOS listing. Observed timestamps: 0, 2, 5, and 10 seconds. The record carries 251,928,927 modelled impressions in the Kalshi measurement window.
At 0 seconds, a person wearing glasses, a dark hat, and necklaces appears indoors. At 2 seconds, a phone shows the Kalshi name, a line chart, and the heading “2027 Football Champion.” At 5 seconds, the first person appears in a closer view with the subtitle “Don’t say it.” At 10 seconds, another person is shown looking upward.
The visual ordering suggests an exchange involving the phone, but the contact sheet does not preserve the complete dialogue. “Don’t say it” is a visible subtitle fragment, not a transcript of the commercial. The analysis cannot explain the full joke or claim that the later person supplies a particular response.
This matters for searches about “Kalshi commercial meaning.” The most reliable explanation identifies the visible devices: a scene with people, a product-screen insert, and a line that withholds or anticipates information. Any account of an unseen punchline would be speculation. The phone heading also does not establish a World Cup connection.
For a creative team, this example raises the question of whether the product screen participates in the story or merely interrupts it. A production brief should specify what the viewer must learn from the insert and how that knowledge changes the interpretation of the surrounding scene. A screen shot without a clear narrative job can become decorative.
A proposed comprehension check would ask viewers to describe the relationship between the people and the displayed topic. If they remember only the personalities or the subtitle, the team would have evidence to revise its own edit. This article has not performed that check and does not infer its result from the record’s exposure estimate.
Example 7: Question Graphics Lead Into an Interview Setup
The seventh example presents questions directly, first through large text and question-mark graphics and then through an interview beside a vehicle. The visible midterms reference supports describing an election-related topic in this particular record. It does not establish a political viewpoint, an audience segment, or the content of the complete interview.
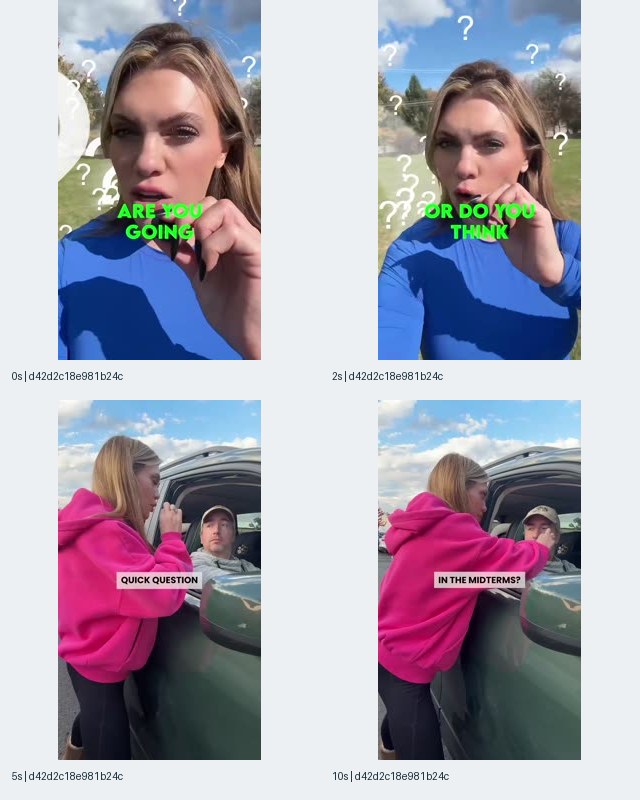
Figure 7. Contact sheet for record d42d2c18e981b24cf37b8221445169e1, associated with Kalshi’s verified iOS listing. Observed timestamps: 0, 2, 5, and 10 seconds. The record carries 227,493,585 modelled impressions in the Kalshi measurement window.
At 0 and 2 seconds, a presenter wearing blue appears outdoors with white question marks over the image. Bright green text reads “ARE YOU GOING” and then “OR DO YOU THINK.” At 5 and 10 seconds, a presenter wearing pink stands beside a vehicle and holds a microphone toward a person inside. The visible subtitles include “QUICK QUESTION” and “IN THE MIDTERMS?”
These fragments do not make a complete question. They should not be stitched together into a sentence that the evidence does not provide. Nor should the interview be described as a representative survey. The frames show a presentation format, not a documented sampling method for public opinion.
The record’s supplied video duration is 88 seconds, while the illustrated observations stop at 10 seconds. That difference makes restraint particularly important. The sheet captures the opening portion only; later arguments, explanations, product demonstrations, and calls to action remain unobserved here.
For an original concept, the transferable element is a question that gives the viewer a clear reason to consider an answer. The brief should define the complete question, explain its relevance to the product, and specify how the response will be represented accurately. Question marks alone are a visual treatment, not a strategy.
A useful proposed test would distinguish participation from comprehension. Viewers may feel invited to answer while still failing to understand the advertised subject. A team can check those separately before committing to a longer interview edit. The sample does not reveal either response, and its modelled exposure should not be used to claim that the question format improved engagement.
Example 8: Sports Commentary Uses a Personal Point of View
The eighth example places an individual presenter’s sports commentary at the center of the frame. The visible subtitles refer to MVP discussion and the NBA, while the presenter uses hand gestures and holds a phone in one sampled image. Those observations support a commentary format, without identifying the person or reconstructing the complete sports argument.
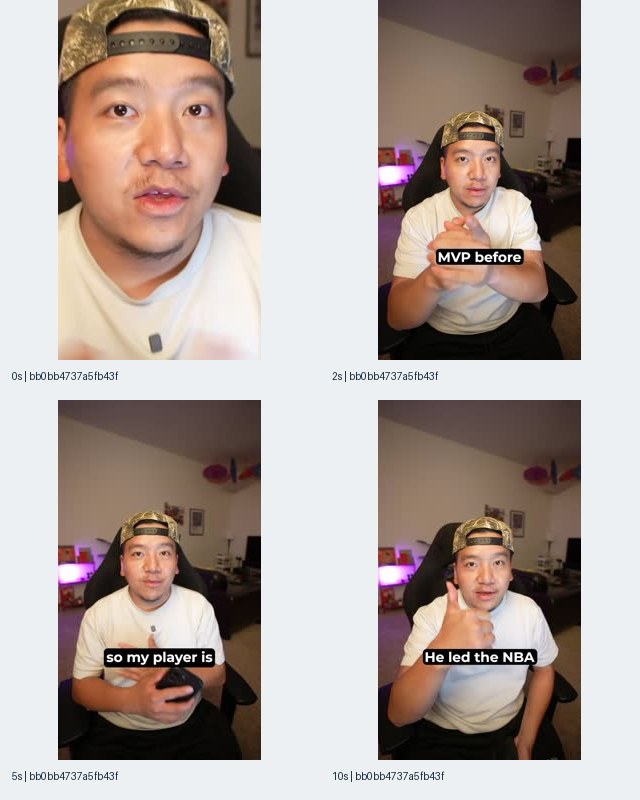
Figure 8. Contact sheet for record bb0bb4737a5fb43f44b750a0be34f7b5, associated with Kalshi’s verified iOS listing. Observed timestamps: 0, 2, 5, and 10 seconds. The record carries 209,751,824 modelled impressions in the Kalshi measurement window.
The 0-second frame is a close view of the presenter. Later frames show the person seated in a room, speaking toward the camera and gesturing. The sampled subtitles are “MVP before,” “so my player is,” and “He led the NBA.” These are fragments of a longer argument. They do not establish which player is discussed or what conclusion the ad reaches.
The creative differs from the reaction memes because it appears to organize attention around a person’s reasoning. That is a structural interpretation, not a judgment about the presenter’s expertise. Clothing, setting, and delivery do not establish credentials, and the supplied evidence does not identify the individual.
The record was first seen on 2026-10-23. That date places its discovery within the selected window, but it does not show when it was filmed or whether similar commentary existed earlier. The supplied duration is 46 seconds; the contact sheet does not show the entire argument or its final call to action.
For a team planning an original commentary ad, the useful production task is to make the reasoning legible. Define the proposition, the evidence supporting it, the distinction between fact and opinion, and the product connection. A presenter’s confidence should not carry claims that the script cannot support.
One proposed comparison would keep the topic and factual basis constant while varying whether the presenter states the conclusion first or introduces the supporting observation first. The question is whether viewers understand and remember the intended proposition. No such experiment was supplied for this article, so neither ordering is presented as a proven winner.
What the Eight Examples Reveal About Creative Structure
The illustrated examples offer several different entry points into the same associated product, but they do not reveal a verified funnel map or audience segmentation plan. Their value lies in the observable communication tasks: interpret a reaction, resolve an encounter, read a claim, recognize a regional topic, follow dialogue, answer a question, or consider an opinion. Those tasks can guide original briefs without pretending to expose campaign settings.
| Visible approach | Example | What the opening asks the viewer to do | What a new brief should specify |
|---|---|---|---|
| Reaction scene | Figure 1 | Interpret unusual behavior | The supportable link between reaction and product |
| Unexpected encounter | Figure 2 | Resolve a situational question | The complete bridge from curiosity to explanation |
| Text-led meme | Figure 3 | Read and understand an argument | Claim support and readable text hierarchy |
| Caption-dependent scene | Figure 4 | Connect a caption to a reaction | Whether the meaning survives brief exposure |
| Regional explainer | Figure 5 | Recognize a familiar place and topic | A coherent connection among screen examples |
| Dialogue with screen insert | Figure 6 | Follow a scene and interpret an interface | The narrative job of the product screen |
| Question and interview | Figure 7 | Consider or supply an answer | The complete question and accurate response context |
| Personal commentary | Figure 8 | Follow an individual argument | The proposition, supporting evidence, and product connection |
These categories are editorial descriptions of the shown examples. They are not supplied audience labels, campaign objectives, or measured performance segments. A team should also resist converting the table into a claim about format prevalence across all 28 video files. Only the eight attached contact sheets were visually analyzed here.
The practical implication is that creative diversity involves more than changing backgrounds or performers. Each opening can establish a different relationship with the viewer. A useful production backlog records that relationship and the information it must deliver. That creates a clearer basis for testing than a broad request to make another “creator-style” ad.
TikTok, Actors, and World Cup Searches: What Remains Unverified
The supplied sample does not verify TikTok placement, identify the people appearing in the ads, or show a clearly established World Cup commercial. These are reasonable search questions, but a search phrase is not evidence. The answer must come from the records and visible frames, even when that leaves the requested detail unresolved.
Kalshi ads on TikTok. Vertical video, large subtitles, memes, and handheld presentation can be described as creative features. They do not prove where an ad ran. The records contain a source code, but the frozen context does not supply a verified mapping from that code to a named network. Consequently, this article makes no TikTok-specific coverage or impression claim.
Kalshi commercial actors. The frames show people in presenter, interview, reaction, and dialogue contexts. They do not establish names, employment relationships, casting credits, or whether the people are actors. No identity is assigned here. Even if a viewer believes a face is familiar, that is outside the evidence used in this analysis.
Kalshi World Cup ads. Figure 6 shows “2027 Football Champion,” Figure 5 shows “DAL Cowboys vs NY Giants,” and Figure 8 includes an NBA subtitle. None of those observations establishes the requested World Cup commercial. The correct statement is that the attached sample does not show a verified World Cup example, not that no such ad exists.
Kalshi ads being annoying. The package contains no sentiment study, complaint sample, viewer-frequency data, or creative-fatigue experiment. It cannot establish how widespread annoyance is or which format causes it. For an advertiser evaluating its own repetition, the relevant evidence would come from its own audience responses and delivery measurements, not from a competitor’s modelled impression total.
These limits help readers distinguish creative research from distribution research, identity research, and audience research. Each requires different evidence. Combining them because the same brand name appears in a query produces a more confident story than the source can support.
Kalshi Revenue: What the App Ranking Shows
Kalshi’s iOS listing ranked #139 in AdMapix’s US app-store revenue ranking, with the modelled value up 235.89% against the previous period, for 2026-09-29 to 2026-10-28. The supplied comparison describes the current-period estimate as 3.4× the previous one. This is a third-party model estimate of app-store revenue for a store listing, and it is a weak proxy for Kalshi’s company revenue because Kalshi earns from trading outside app-store billing.
The source does not state the unit of the revenue-ranking value. Accordingly, this article quotes rank, period change, and supplied same-ranking ratios, without converting the underlying value into dollars. It does not label the estimate company revenue, trading volume, deposits, gross merchandise value, or profit.
The separate ranking snapshot was captured in research dated 2026-10-30. Its rankings combine App Store and Google Play listings at the store-listing level, with the top 300 captured. Kalshi’s entry in the table below is its verified iOS listing; the combined ranking universe does not turn its figure into an all-platform company total.
| Store listing | US revenue rank | Change in modelled value versus previous 30 days | Supplied comparison |
|---|---|---|---|
| Kalshi: Trade Sports & Events, iOS 1632713844 | #139 | +235.89% | Current-period estimate is 3.4× the previous period |
| Polymarket: Trade Live Sports, iOS 6648798962 | #91 | +0.46% | Estimate is 1.4× Kalshi’s on this same ranking |
| DraftKings, iOS 1375031369 | #70 | −6.75% | No additional ratio supplied |
Ranking window: 2026-09-29 to 2026-10-28; research capture dated 2026-10-30. Percentage changes describe modelled values, not percentage changes in rank positions. These figures are not company-revenue measurements.
The download snapshot gives another view of listing-level activity. Kalshi ranked #12, with 2,118,376 estimated downloads and a 14.19% decrease against the previous period. Polymarket ranked #145, with 632,792 estimated downloads and a 72.13% decrease. Those are the supplied ranking figures for the same ranking window; no ad-to-install ratio is calculated.
The different directions of Kalshi’s download estimate and app-store revenue estimate are not an explanation of its business model. They do not prove better monetization, a change in customer quality, or an advertising effect. Those questions require business and acquisition data that this package does not contain.
For readers searching “Kalshi revenue growth,” the defensible answer is therefore narrow but concrete: the dated ranking shows a sharply increased modelled app-store revenue value for the iOS listing, with the rank and comparison above. It does not measure total company revenue growth. The advertising sample cannot fill that gap, and its later measurement window makes a causal comparison particularly inappropriate.
Polymarket and Novig: A Separate Advertising Bracket
The earlier Polymarket–Novig bracket shows different sampled exposure and file-reuse patterns within its own shared window, but it cannot establish who spends the most across all three brands now. That bracket covers the US period 2026-09-30 to 2026-10-29, was pulled on 2026-10-30, and contains the leading 30 advertising records attributable to each verified iOS listing. Kalshi’s newer figures are deliberately excluded from this table.
| Measure | Polymarket | Novig |
|---|---|---|
| Sampled advertising records | 30 | 30 |
| Modelled impression total | 2,517,234,302 | 526,278,187 |
| Leading record share | 12.7% | 19.7% |
| Distinct video files | 19 | 30 |
| Records first seen within that window | 24 of 30 | 9 of 30 |
| Earliest first-seen date | 2026-07-26 | 2026-08-06 |
Separate bracket window: 2026-09-30 to 2026-10-29. Pulled 2026-10-30. Impression figures are third-party model estimates for these bounded samples, not spending or observed delivery.
Within this same-window bracket, Polymarket has the larger sampled modelled impression total. That is the supported answer to the exposure comparison between these two samples. “Buying the most attention” would go further: it would imply a verified spending or delivery conclusion that the package cannot establish.
The asset counts describe different patterns. Polymarket’s 30 records correspond to 19 distinct video files, so its sample includes file reuse across records. Novig’s 30 records correspond to 30 distinct video files. That does not prove Novig produced more original concepts, spent more on production, or avoided thematic repetition. Fingerprints distinguish files, not ideas.
The discovery figures also belong to this earlier window. They describe when sampled records entered the source’s observed history, not when the companies commissioned or launched creative. Neither count establishes a production rate. The Novig advertising teardown provides additional creative context, but any figures in that article retain their own dated scope.
One observation from the Polymarket preview requires explicit preservation: no sampled creative in that pull was last seen after 2026-10-13. This article does not infer a reason, announce a campaign shutdown, or describe the sample as verified current delivery on the pull date.
A valid three-brand decision would require aligned dates, matching listing scopes, and the same selection procedure for all three. Until those inputs exist together, the useful comparison is qualitative: examine how records reuse files, how openings communicate the subject, and which discovery dates are present. There is no defensible current spending winner in the supplied evidence.
A Practical Workflow for Turning This Research Into a Brief
A useful Kalshi-inspired research workflow produces a traceable creative question and an original test brief. It should preserve the product identity, dates, and visible evidence before adding strategic interpretation. That allows a buyer, editor, and producer to discuss the same observation without accidentally turning an estimated exposure figure into a performance result.
-
Define the decision. Write the production question before collecting more examples. A useful question is, “Should our opening introduce the subject through an everyday situation or through a clear screen?” A less useful question is, “What is Kalshi’s winning formula?” The first can lead to a controlled comparison; the second assumes a result the evidence cannot supply.
-
Lock the product and scope. Record the verified listing ID, country, measurement-window bounds, capture date, sort order, and sample limit. For this article, those fields identify the US iOS sample for 2026-10-03 to 2026-11-01. If another researcher uses a name search or a different store listing, keep that work separate until its attribution is checked.
-
Keep records and files in separate columns. Preserve the advertising record identifier and the underlying video identifier. This prevents a reused video from being counted as several productions. Keep the record’s own estimate attached to that record. Do not replace it with a similarly named value from associated product information.
-
Describe the observed frames literally. For Figure 2, a useful note is: “Car viewed through blinds; later frames show a person at the driver-side window; subtitle fragment says ‘to sign up.’” “A stranger explains why Kalshi is better” would invent dialogue and a conclusion. Literal notes give the team a stable evidence base.
-
Separate the claim from the visual. Figure 3 contains a claim about “best odds.” The cat image is the visual wrapper, not proof. Figure 4 links a reaction to a trade through its caption. The reaction does not validate the implied event. This separation helps writers identify which parts need their own substantiation.
-
Name the missing information. Record unknown audio, unseen transitions, incomplete subtitles, unidentified placement, and unobserved calls to action. An explicit unknown is useful because it prevents the next person from treating an assumption as a source fact. It also tells the team what further evidence would change the brief.
-
Write a hypothesis with an observable outcome. For example: “Introducing a familiar situation before the interface may improve recognition of the intended use case.” Then specify how the team would measure recognition in its own research. Avoid “this will increase conversion,” unless the team actually tests conversion under suitable conditions.
-
Produce an original treatment. Borrow the communication problem, not the performer, footage, claim, or exact joke. If the reference uses an unexpected encounter, create a different setting and a product connection supported by your own offer. The brief should be understandable without requiring the producer to imitate the source clip.
A compact handoff can use the following fields:
| Brief field | Example entry based on this research |
|---|---|
| Reference observation | Figure 5 places topic imagery above a presenter |
| Communication problem | Viewers need to understand how several examples relate |
| Proposed hypothesis | A shared context may make the examples easier to connect |
| Original execution | Use the team’s own setting, presenter, and verified screen content |
| Required evidence | Current product facts for every spoken and displayed claim |
| Acceptance check | Viewers can name the common topic without assistance |
| Remaining unknown | Whether the execution improves downstream acquisition results |
The final handoff should include the source image, its record reference, the exact observed wording, and the hypothesis. That creates a usable production document while retaining the boundary between competitor observation and your own future experiment.
Test Ideas That Follow From the Frames
The sample supports testable creative questions, not completed experiments. A responsible test plan starts with a visible difference between approaches, holds the underlying product proposition steady, and defines what the team wants to learn. It should also specify what would count as an inconclusive result, so an attractive edit does not become a “winner” simply because the team prefers it.
Situation first versus screen first. Figures 1 and 2 provide references for openings built around a situation; Figure 5 provides a reference for prominent screen imagery. An original comparison could use the same verified proposition and presenter, changing only how the subject is introduced. The initial question is whether viewers identify the intended use case. Acquisition outcomes, if measured later, need their own account data and attribution definitions.
Caption-dependent meaning versus meaning visible in the scene. Figure 4 depends on its caption to establish the product connection. A team could compare an original caption-led scene with a version in which the relevant product context is also visible. The purpose would be to test comprehension under ordinary viewing conditions. It would not be a test of whether the source ad was effective.
One coherent example versus several connected examples. Figure 5 shows multiple topics linked by Texas references. An original brief could compare a single clearly explained example with a set connected by one organizing idea. Keep the claim and intended audience interpretation stable. Otherwise, the experiment changes both information volume and proposition, making the result difficult to interpret.
Question first versus conclusion first. Figures 7 and 8 suggest different ways to invite thought: ask a question or present an argument. A team could create original versions about the same supported topic. Evaluate whether viewers can recall the proposition and explain the connection to the product. Do not assume that greater curiosity automatically means better understanding.
Meme wrapper versus plain explanation. Figure 3 raises a useful question about whether a humorous wrapper helps or distracts from a statement. The comparison should use a claim that remains accurate in both versions. If the wording changes, the team may be testing the claim rather than the wrapper. Record that distinction before production begins.
For each experiment, preserve the actual final edits, the audience and placement used, the measurement definition, and the decision rule. If a test never runs, keep it labelled planned. If it runs without sufficient evidence to distinguish the versions, report that uncertainty. Nothing in the frozen competitor sample can substitute for those missing results.
Common Mistakes When Reading Kalshi Advertising Data
The most consequential errors arise when a valid number is assigned the wrong meaning. The supplied figures can support a useful report, but only when the report keeps their unit, window, selection method, and attribution intact. The following mistakes would change the substance of this analysis even if every copied number were accurate.
- Calling 30 records 30 unique videos. The supplied file count is 28. Record-level variation and media production are separate measures.
- Presenting modelled impressions as measured delivery. The source supplies third-party estimates, not an advertiser’s delivery log or a count of unique people.
- Dividing the window total by ad age. A first-seen date does not provide an appropriate denominator for the selected window, and the result would not establish daily delivery.
- Calling a frequently observed ad profitable. Repetition, a large estimate, and an old discovery date do not provide conversion, cost, or margin evidence.
- Putting the newer Kalshi total into the earlier competitor bracket. Different windows must retain separate tables and conclusions. A visually convenient comparison is not a valid one.
- Treating first seen as production or launch. Discovery dates describe the source’s observations. They do not expose the advertiser’s production calendar.
- Inferring TikTok from the edit. Vertical framing, captions, and memes are visual features. Placement needs verified source information.
- Completing subtitle fragments. “To sign up,” “MVP before,” and “Don’t say it” do not establish the surrounding sentence or the full pitch.
- Calling the last sampled image an end card. A contact sheet stops where its sampling stops. It does not necessarily show the video’s ending.
- Turning a screen into a product test. A displayed market, chart, or figure is evidence of advertising content, not independent confirmation of current functionality or results.
A final editorial check should examine the title, summary, table labels, captions, and call to action together. Overstatement often survives in a headline after the body has been corrected. The safest report uses the same scope everywhere: this dated, verified iOS sample, with its specified observations and unknowns.
When AdMapix Fits This Research
AdMapix fits teams that need to find indexed advertising references and organize them into evidence for creative decisions. In this article, the value is the connection between verified listing identity, advertising records, media fingerprints, modelled exposure estimates, and timestamped examples. Those inputs help a team choose what to inspect and what to test; they do not reveal a competitor’s private campaign economics.
Disclosure: AdMapix is our product, so we separate its research workflow from claims the evidence cannot support. AdMapix is an ad-intelligence platform. This article is prepared with Codex from the dated source sample and does not imply personal human review by the editorial owner.
Use this workflow when the next decision concerns an opening, an explanation, a visible claim, or a recurring creative pattern. Use your own analytics when the decision concerns acquisition cost, conversion, retention, or budget allocation. Researching a competitor’s ads can inform the hypothesis stage, but it cannot replace the measurements needed to evaluate your own campaign.
Sign up or log in to AdMapix to research live creatives, then confirm the listing, country, dates, and available source information before creating a new report. Live results may differ from this frozen sample.
Commercial terms can change while an article remains online. Consult the current AdMapix pricing page for current access and plan details. This article makes no paid-trial promise and does not reproduce plan prices or credit quotas.
FAQ
The answers below summarize what this dated research can establish about Kalshi ads and the questions readers commonly bring to them. Each answer preserves the difference between sampled creative evidence, modelled advertising estimates, and business information that is not present in the package.
Why do Kalshi ads seem to be everywhere?
The US sample for 2026-10-03 to 2026-11-01 contains 30 records with 4,682,111,994 modelled impressions and 28 distinct video files. Its illustrated examples use several different openings, including reactions, encounters, memes, and commentary. That supports a substantial and varied sampled presence, but it does not explain any individual’s ad frequency, targeting, or exposure across platforms.
Are the ads in this article verified TikTok ads?
No named network is verified for these records in the supplied package. The videos use features familiar from social content, such as vertical framing, subtitles, and presenter-led scenes, but those features do not establish TikTok distribution. A platform-specific conclusion would require a verified network mapping or other placement evidence attached to the relevant record.
Who are the actors in the Kalshi commercials?
The sampled frames cannot establish who appears or whether each person is an actor, creator, customer, or another participant. This article therefore does not identify anyone. It describes their visible role in the creative, such as a presenter, a person in a vehicle, or someone shown in a dialogue scene, without assigning names or credentials.
Does this sample show a Kalshi World Cup commercial?
The attached contact sheets do not establish a World Cup commercial. They include a phone heading reading “2027 Football Champion,” a Dallas Cowboys versus New York Giants display, and an NBA subtitle. Those observations cannot be converted into a World Cup attribution. The absence of a verified example here also does not establish that no such commercial exists elsewhere.
What does the data say about Kalshi revenue growth?
For 2026-09-29 to 2026-10-28, Kalshi’s iOS listing ranked #139 in the US revenue ranking, with the modelled value up 235.89%, or 3.4× the previous period. This is an app-store revenue estimate, not company revenue. Because Kalshi earns from trading outside app-store billing, the ranking is a weak proxy for its overall business revenue.
Which brand has more advertising: Kalshi, Polymarket, or Novig?
The supplied evidence does not support a current three-brand spending ranking because Kalshi’s sample uses a different window. In the separate 2026-09-30 to 2026-10-29 bracket, Polymarket has the larger sampled modelled impression total than Novig. That comparison concerns bounded estimated exposure, not verified spending, complete advertising activity, or the identity of the ad buyer.
Can a creative team copy the approach of the leading ad?
A team can study the communication structure and create an original test, but the leading record’s modelled exposure does not establish that its approach will work for another product. Preserve the observable lesson, use your own footage and substantiated claims, and define a measurable hypothesis. The appropriate result of competitor research is a test brief, not an assumed performance guarantee.
Key Takeaways
Kalshi’s sampled advertising is useful as a study of varied creative introductions, with clear boundaries around what the numbers and images establish.
- The US sample contains 30 records and 28 distinct video files, not 30 unique productions.
- The leading record’s 15.9% share and the leading five records’ 45.5% share describe modelled exposure concentration within the sample.
- First-seen dates span 2026-09-04 to 2026-10-26; they do not establish production dates or a complete advertising history.
- The eight contact sheets support specific observations about hooks and visible claims, while leaving playback, performer identity, placement, and conversion unresolved.
- Keep the app-store ranking and the earlier competitor bracket in their own dated scopes, then turn creative observations into original, measurable tests.
Sources
The sources below distinguish the frozen advertising evidence from product identity, methodology, and the live research workflow. Observation dates describe the material used for this article, not a guarantee that later live results will match it.
- AdMapix frozen source package, fetched 2026-11-01: public evidence snapshot. Primary scope: US, verified iOS listing 1632713844, 2026-10-03 to 2026-11-01, 30 advertising records, supplied aggregate facts, and eight timestamped visual examples. The captured batches, request parameters, and checksums are public.
- Supplementary AdMapix research dated 2026-10-30, supplied with the source context: US store-listing rankings for 2026-09-29 to 2026-10-28 and the separate Polymarket–Novig top-30 advertising bracket for 2026-09-30 to 2026-10-29. These are retained as distinct dated observations.
- Product identity captured with the 2026-11-01 sample: Kalshi: Trade Sports & Events on the US App Store, listing ID 1632713844 and seller KALSHI INC. The listing identifies the product; it does not identify the buyer of each advertising record.
- AdMapix methodology and workflow context: AdMapix methodology, applied to the 2026-11-01 observation, and the linked Kalshi creative search above. The live search supports further discovery; this article’s claims remain tied to the frozen dates and sample limits.
About AdMapix Research: AdMapix Research is the research byline of AdMapix, an ad-intelligence platform. Its articles are built from AdMapix data (creative records, modelled impression estimates and US app-store rankings), prepared with Codex from a dated frozen sample and checked by automated evidence review. Brad at AdMapix is the accountable editorial owner; this does not imply personal human review.
Turn these observations into your next creative study
Open the creative library and select samples for your market, network and research question.
Related Articles
Solitaire Cash Ads: Cash Hooks, Presenters, and Creative Reuse
Eight timestamped Solitaire Cash examples and 30 verified US iOS advertising records reveal account claims, presenter formats, gameplay imagery, and creative reuse, with dated portfolio context and clear limits on performance conclusions.
Underdog Rips Ads: Pack Reveals in a Sports-Led Sample
Eight Underdog advertising contact sheets show pack reveals alongside prominent sports offers, while a dated US iOS sample reveals recent records, concentrated modelled impressions, and clear limits on claims about fleet turnover, revenue, and product experience.
Liftoff Playable Ads: Requirements and Vungle Examples
Analyze eight dated US Liftoff (Vungle) video examples, understand the limits of a 30-record sample, and follow separate official playable requirements and testing workflows for Direct, Accelerate, and Vungle Exchange.