Paid Ads Analytics Tools in 2026: Metrics, the Stack & Data You Can Trust
A 2026 guide to paid ads analytics tools — the four jobs your stack must cover, the core metrics that actually drive decisions, a data-trust hierarchy that separates first-party from modeled and public signals, how attribution and cross-channel aggregation break in a privacy-constrained world, the tool-stack layers from native reports to MMPs to BI to competitor intelligence, how to choose by the decision each tool supports, and a weekly workflow that turns data into the next test.

Paid Ads Analytics Tools in 2026: Metrics, the Stack & Data You Can Trust
By the AdMapix Research Team — Updated June 21, 2026
A paid ads analytics stack should cover four distinct jobs: account performance tracking, clean reporting, creative-level diagnosis, and competitor context. No single dashboard does all four well, so the real task is choosing one tool per job and wiring them into one weekly decision. But choosing tools is only half the problem — the harder half, especially in 2026's privacy-constrained measurement environment, is knowing which numbers to trust. A modeled ROAS, a platform-reported conversion, and a public competitor signal are three very different grades of evidence, and treating them as equally reliable is how teams make confident, expensive mistakes. This guide is for paid media managers, app growth teams, and agency strategists who keep adding dashboards but still argue about numbers in the Monday meeting. After reading it you'll know which category answers which question, which metrics actually drive decisions, how much to trust each data source, and how to stop buying tools that never change an action.

We've helped teams untangle bloated analytics stacks for years, and the pattern is consistent: the problem is rarely too few tools — it's too many tools producing numbers nobody trusts or acts on. The fix isn't another dashboard; it's a clear map of which job each tool does, which metrics earn a place in the weekly review, and how reliable each data source actually is. This guide is that map. For the two adjacent disciplines, see our ad creative fatigue analysis guide for diagnosing why a creative's metrics dropped, and our creative testing framework for the system that turns analytics into the next test. This guide is the measurement-and-tooling layer underneath both.
TL;DR — Paid Ads Analytics Tools in One Screen
- A paid ads analytics stack covers four jobs: owned performance tracking, clean reporting, creative diagnosis, and competitor context. No single suite does all four well — pick one tool per job.
- Name the decision before the tool. If a metric can't change budget, creative, targeting, the landing page, or client communication, it doesn't belong in the weekly review. The decision comes first; the tool serves it.
- Not all data is equally trustworthy. First-party data is the most reliable, platform-reported and modeled data is directional, and public competitor data shows activity but never outcomes. Grade your evidence before you act on it.
- Attribution is harder than it looks in 2026. Privacy changes degraded the signal, so platform-reported conversions are increasingly modeled estimates, not counts — read them as directional, not exact.
- Cross-channel aggregation is the recurring headache. Each platform claims its own conversions, so blended numbers double-count unless you reconcile them in a neutral layer (an MMP, a BI tool, or a clean attribution model).
- The core metrics that drive decisions are spend, CPA/CPI, ROAS or an LTV signal, CTR, and per-creative performance — plus a competitor-freshness check. Everything else is an appendix.
- Competitor intelligence is the fourth job, not the first three. It shows what's changing in the market; it can't measure your own performance. Use it to inform the next test, confirm results in your own data.
What Teams Actually Need From a Paid Ads Stack
Most teams buy analytics tools the week something breaks: CAC spikes, a winning creative dies, a client asks why a competitor looks more active, or a reporting call turns into a fight over which number is right. The instinct is to add another dashboard. The better move is to name the decision first, then buy only the layer that supports it.
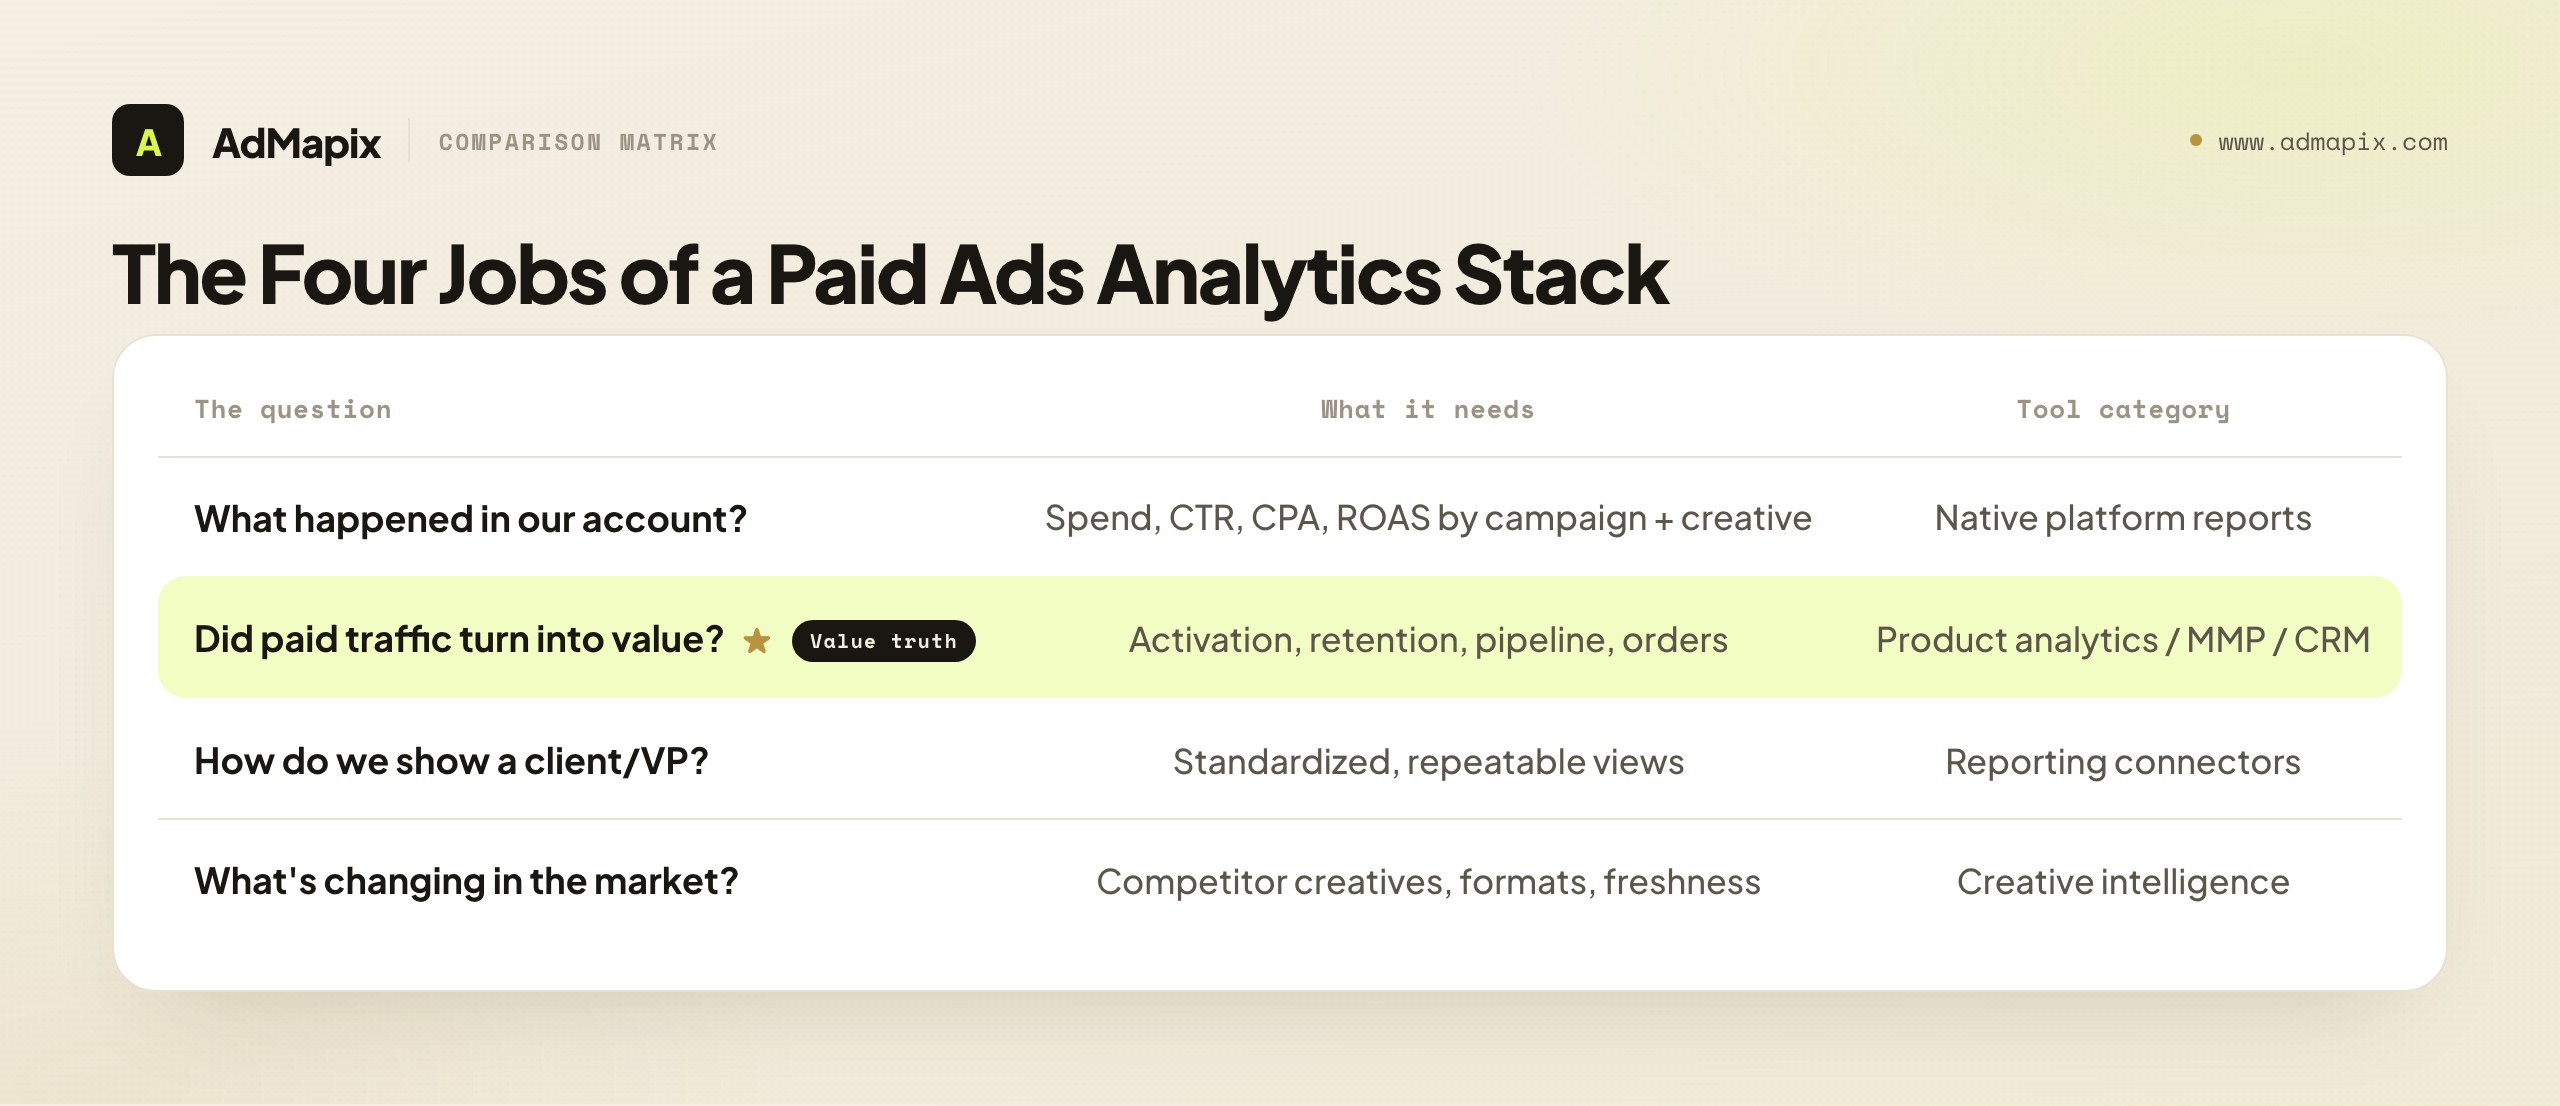
Four different questions drive almost every paid ads tool purchase, and each one maps to a different category. Conflating them is why teams end up with overlapping subscriptions and no clear owner.
| Question the team is really asking | What it needs | Tool category that answers it |
|---|---|---|
| What happened in our account? | Spend, delivery, CTR, CPA, ROAS by campaign and creative | Native platform reports |
| Did paid traffic turn into value? | Activation, retention, pipeline, orders | Product analytics / GA4 / CRM / MMP |
| How do we show this to a client or VP? | Standardized, repeatable views | Reporting connectors (Looker Studio, etc.) |
| What's changing in the market around us? | Competitor creatives, formats, countries, freshness | Creative intelligence (e.g. AdMapix) |
The reason this split matters is that each job has a different owner of truth. Native reports own delivery and cost truth; product analytics and the MMP own conversion and value truth; reporting connectors own presentation; competitor intelligence owns market context. When teams blur these — asking a reporting connector to invent strategy, or trusting a platform's conversion count as gospel — they get a stack that produces numbers but not decisions. The rest of this guide goes deep on the two things most analytics guides skip: which metrics actually earn a place in the review, and how much to trust each data source.
The Decision Comes Before the Tool
The useful question isn't "which tool has the most charts?" It's "which tool changes the next action?" A metric earns a place in the weekly review only if it can move budget, creative, targeting, the landing page, or how you talk to a client. Everything else is an appendix.
That distinction also separates two things teams routinely confuse. Analytics tells you what happened inside your own account. Intelligence tells you what may be shifting in the market around you. First-party analytics can't see a competitor's new hook; competitor intelligence can't tell you your own CPA. You need both, fed into one decision, without pretending either tool covers the other's blind spot.
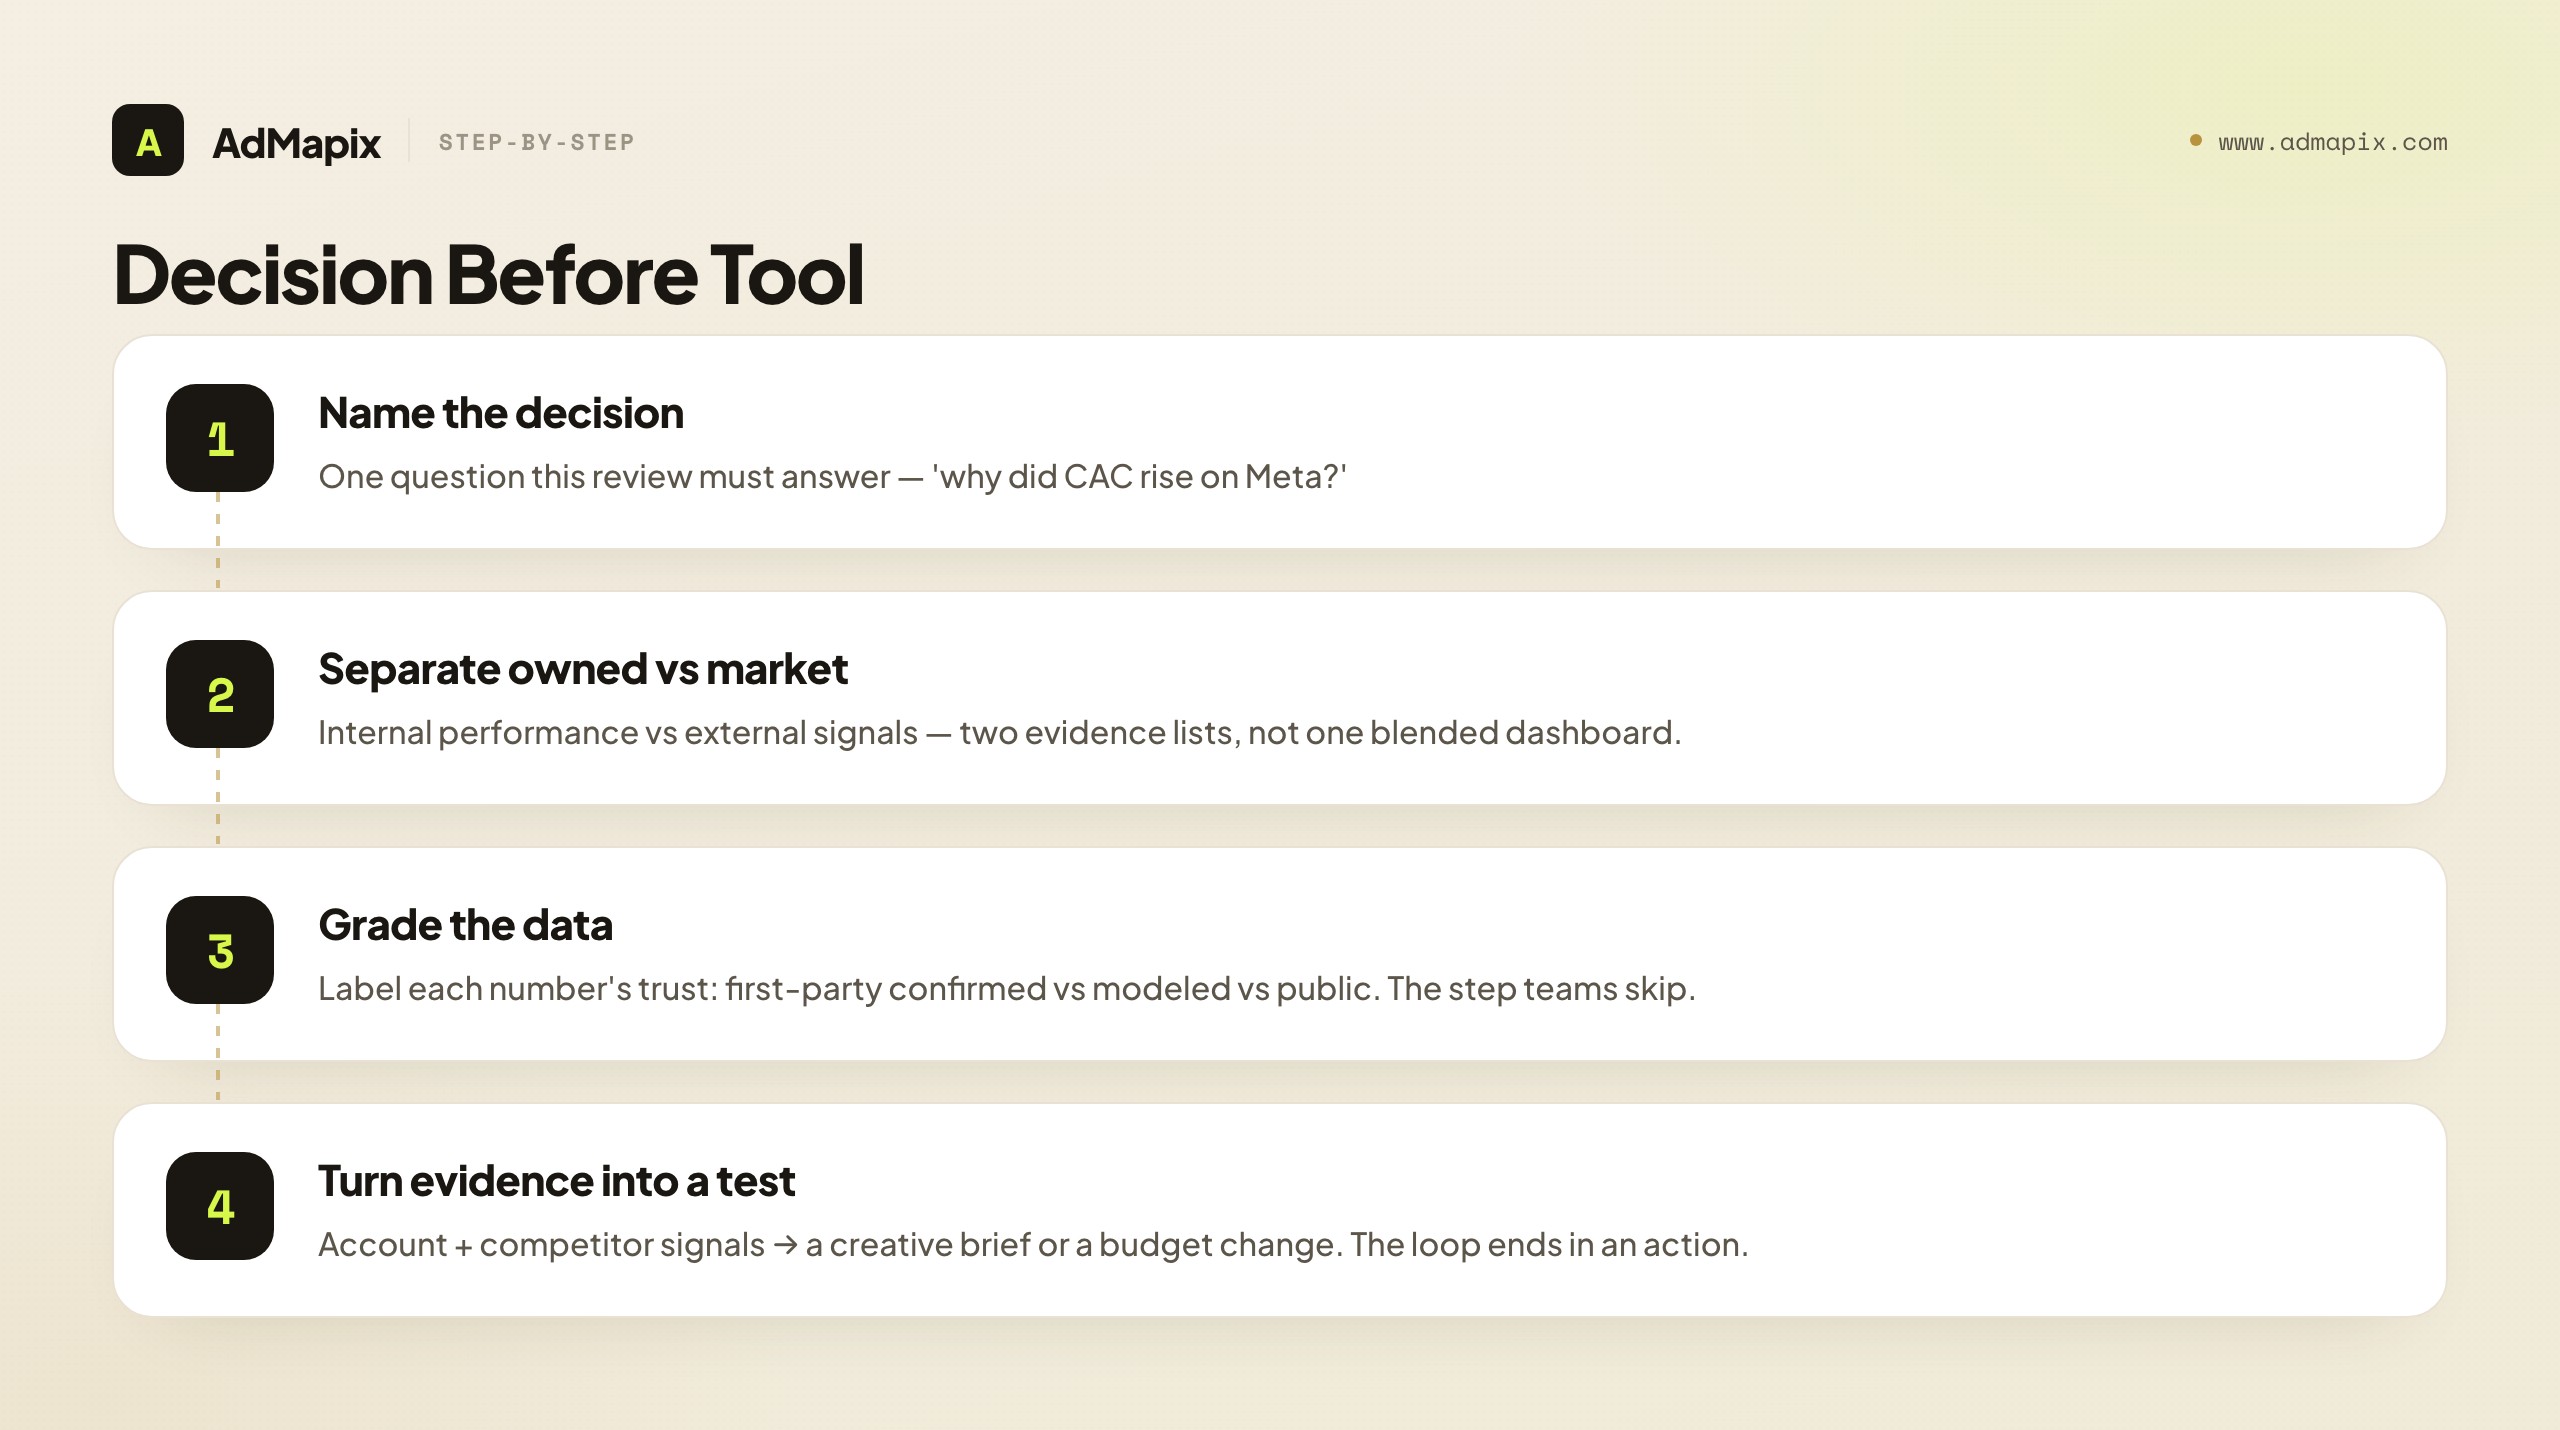
Here's the order that keeps a stack lean:
| Step | What to clarify | Output |
|---|---|---|
| 1. Name the decision | The single question this review must answer | A one-line question ("why did CAC rise on Meta?") |
| 2. Separate owned data from market signals | Which question is internal vs. external | Two evidence lists, not one blended dashboard |
| 3. Track creatives as entities | Creative ID, not just campaign | Per-creative performance view |
| 4. Grade the data | How reliable is each number feeding the decision | A confidence label on each input |
| 5. Set a review cadence | Weekly ritual with one named owner | A standing meeting, not ad-hoc panic |
| 6. Turn evidence into the next test | Competitor and account signals → brief | A test brief or budget change |
The step most teams skip is step 4 — grading the data. A decision built on a high-confidence first-party number is solid; the same decision built on a modeled estimate or a public competitor signal is a hypothesis. Knowing which you're working with is what separates a confident decision from a confident mistake, which is why the data-trust hierarchy below is the heart of this guide.
The Core Metrics That Actually Drive Decisions
A paid ads stack can surface hundreds of metrics, but only a handful actually change an action — so knowing which metrics belong in the weekly review (and which are vanity) is the first filter on a useful stack. The test is simple: can this metric move budget, creative, targeting, the landing page, or client communication? If not, it's an appendix.
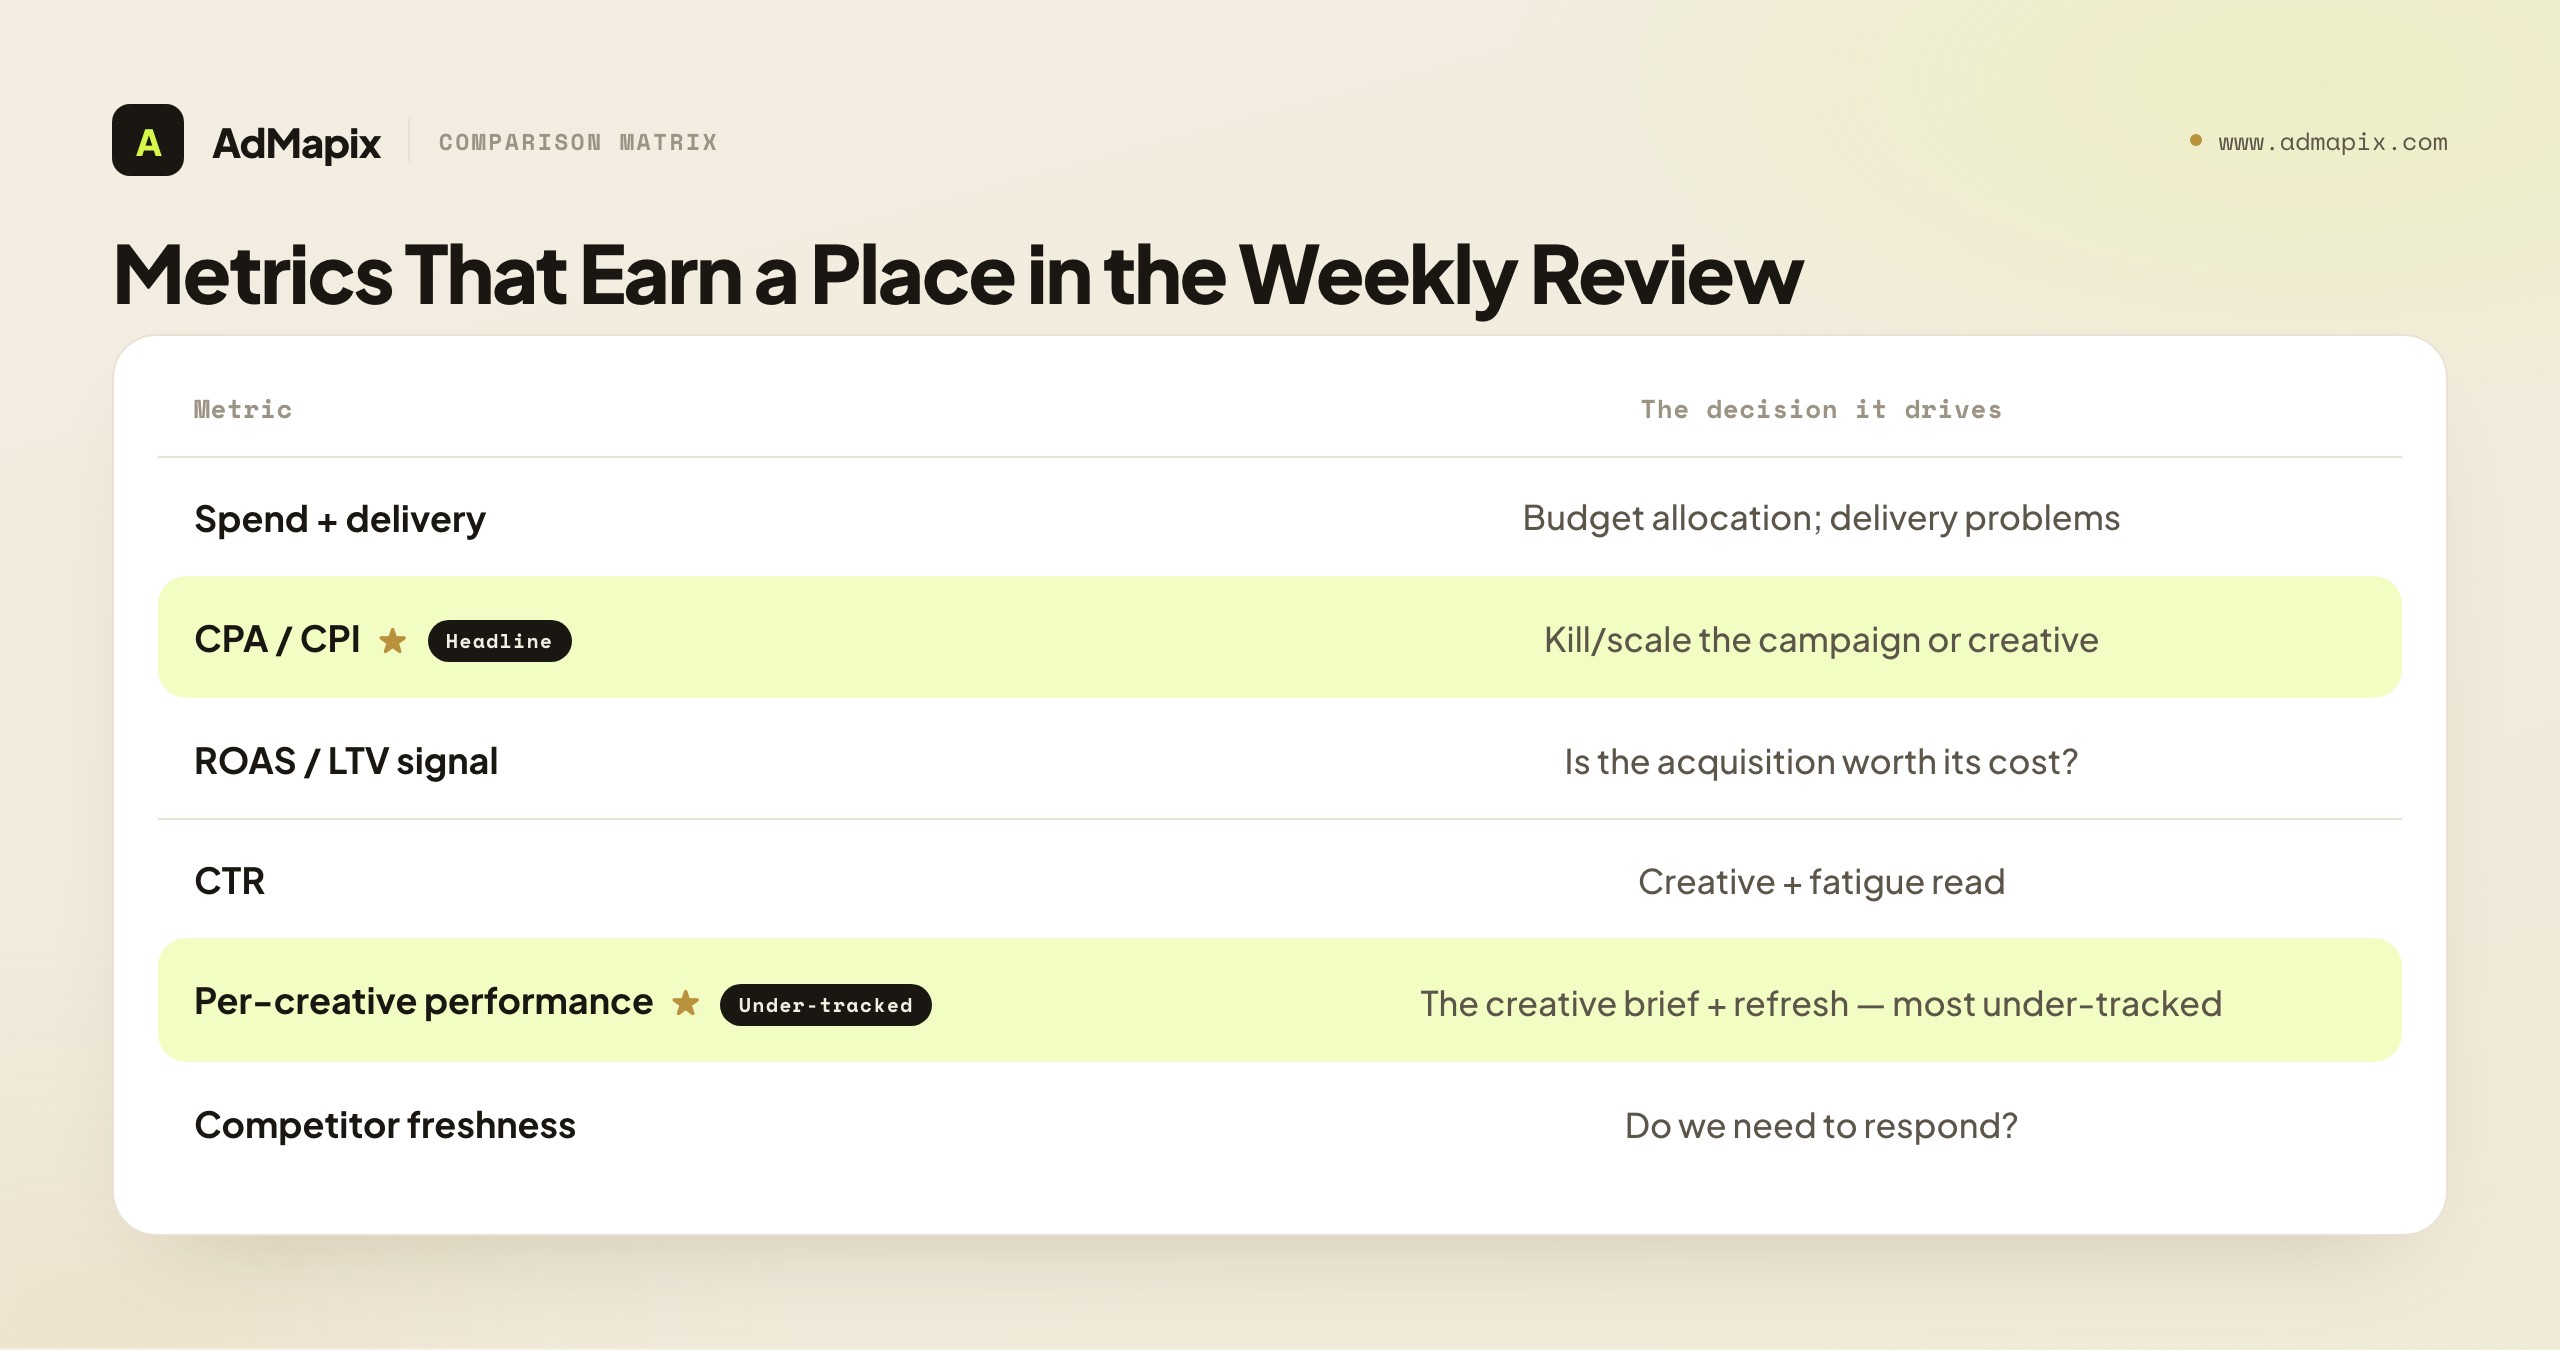
The metrics that earn a place, and the decision each one drives:
- Spend and delivery. The foundation — how much you spent and where it went. Drives budget allocation and flags delivery problems (a campaign not spending, or spending into weak inventory).
- CPA / CPI (cost per acquisition / install). The headline efficiency number for most paid media. Drives the budget and the kill/scale decision on a campaign or creative. The most-watched metric, and rightly so.
- ROAS or an LTV signal. Efficiency alone is incomplete — a cheap acquisition that never converts to value is a bad one. ROAS (for ecommerce) or an LTV/retention signal (for apps and subscriptions) drives whether the acquisition is actually worth its cost. This is the metric that prevents optimizing toward cheap-but-worthless users.
- CTR (click-through rate). The creative-level signal — whether the hook earns attention. Drives creative decisions, and (read alongside frequency) the fatigue diagnosis covered in our creative fatigue analysis guide.
- Per-creative performance. Not campaign-level, but creative-level — which specific creative is winning or losing. Drives the creative brief and the refresh decision. The single most under-tracked metric, because many stacks aggregate to campaign and lose the creative signal.
- Competitor freshness. The one external metric — how active and fresh competitors' creative is. Drives the "do we need to respond?" decision. The fourth-job signal.
The strategic point: a weekly review built on these six metrics drives every decision a paid ads team makes, and almost everything else is decoration. The discipline is to ruthlessly cut metrics that look interesting but never trigger a decision — impressions for their own sake, vanity engagement metrics, dashboard panels nobody acts on. A lean metric set that maps every number to a decision beats a sprawling dashboard that produces numbers nobody uses.
Two structural points sharpen the metric set further. First, pick a north-star metric that the others serve. For most performance teams it's CPA/CPI against an LTV constraint (acquire users at a cost that's profitable given their value) or ROAS for ecommerce — and every other metric is read in service of that one. A north-star prevents the review from drifting into a metrics buffet where everything gets equal attention; it tells you what "good" means and what every other number is contributing to. Second, balance leading and lagging metrics. CPA and ROAS are lagging — they tell you what already happened. CTR, frequency, and early engagement are leading — they tell you what's coming. A review built only on lagging metrics catches problems after they've cost budget; one that pairs each lagging metric with its leading companion (ROAS with CTR and frequency) catches problems as they form. The strongest metric sets are small, north-star-anchored, and balanced between leading and lagging signals — which is a very different thing from a dashboard that shows every metric the platform exposes. The next sections deal with the harder question: how much to trust each of these numbers.
The Data-Trust Hierarchy: Not All Numbers Are Equal
The single most important and most neglected skill in paid ads analytics is grading the trustworthiness of your data, because in 2026 a "conversion" can mean a counted first-party event, a platform-modeled estimate, or an inferred signal — and treating them as equally reliable produces confident, expensive mistakes. Every number feeding a decision sits somewhere on a trust hierarchy, and knowing where is what separates a solid decision from a guess dressed as data.
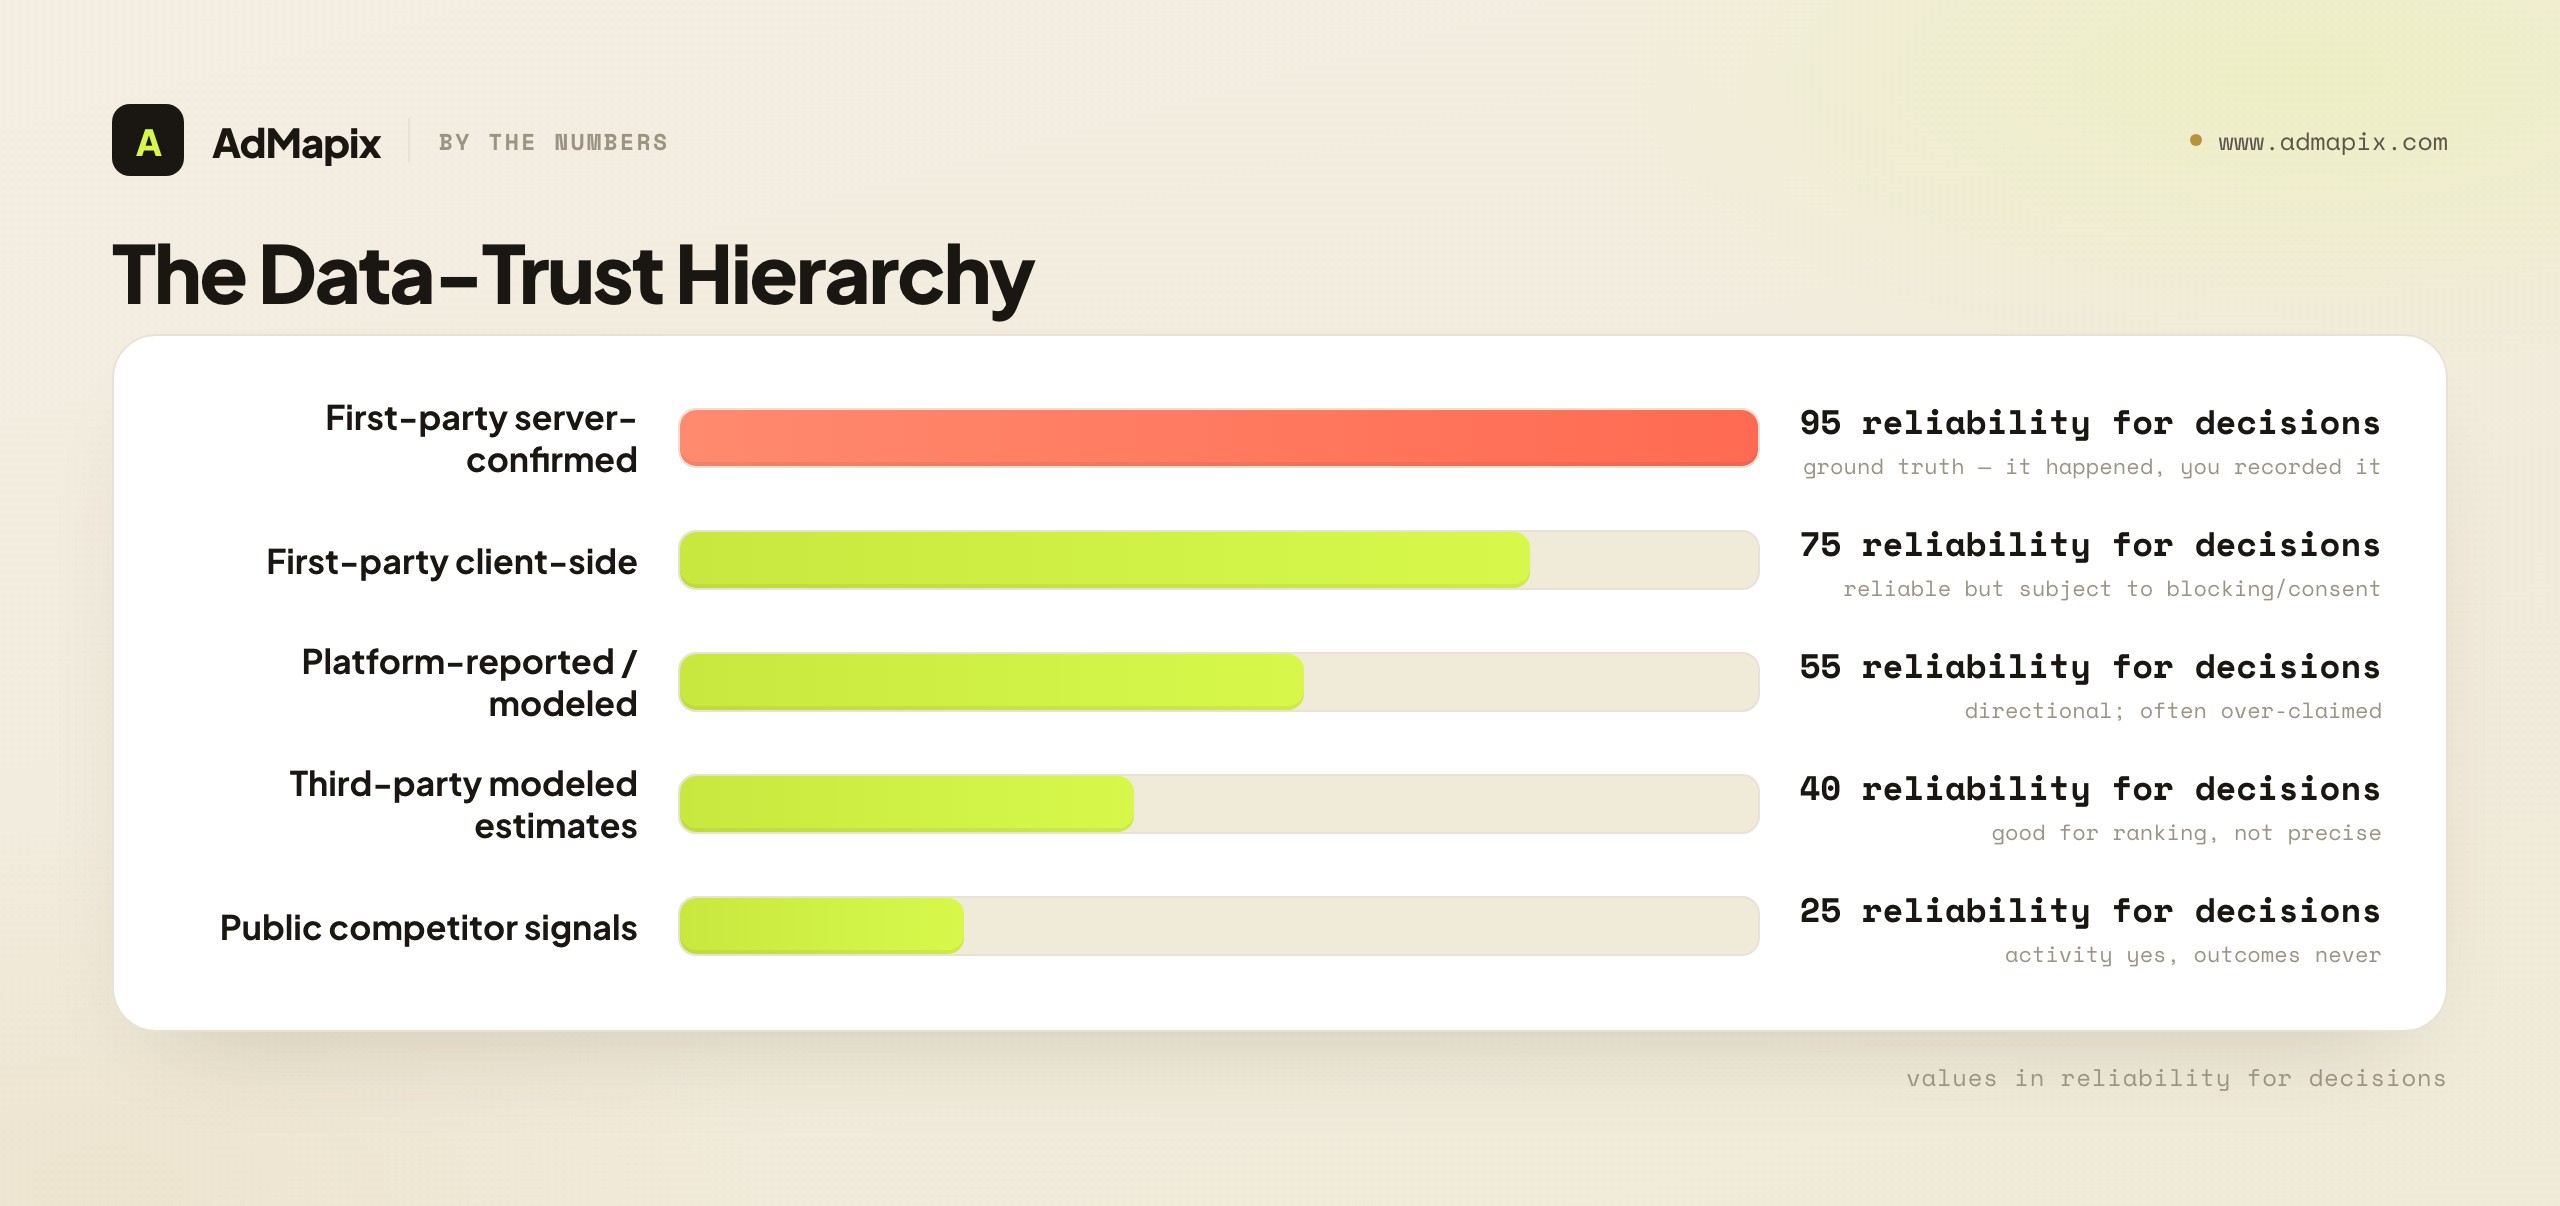
The data-trust hierarchy, most to least reliable:
- First-party, server-side confirmed data (highest trust). A conversion your own server recorded, an order in your database, a subscription in your billing system. This is ground truth — it actually happened, you recorded it, and it's not modeled or inferred. Decisions built on this are as solid as paid ads decisions get.
- First-party client-side data. A pixel-fired event, a client-side conversion. Reliable but subject to blocking, consent gating, and loss — directionally trustworthy, but increasingly incomplete as privacy controls tighten.
- Platform-reported / modeled data. A platform's reported conversions, increasingly modeled (estimated from partial signal) rather than counted. Each platform also tends to over-claim its own contribution. Directional and useful, but not exact — read as an estimate, not a count.
- Third-party modeled estimates. Spend estimates, market-share models, and similar from external tools. Useful for ranking and direction, unreliable as precise figures, with no public ground truth to calibrate against.
- Public competitor signals (lowest trust for outcomes). What competitors are running, observable from ad libraries. Genuine evidence of activity, but never of outcomes — you can't see their spend, ROAS, or whether a creative is winning.
The strategic discipline: label every number feeding a decision with its trust grade, and weight the decision accordingly. A budget shift justified by first-party confirmed ROAS is solid; the same shift justified by a platform's modeled estimate is a hypothesis; the same shift justified by a competitor's public activity is a guess. None of these are useless — but treating a modeled estimate or a public signal as if it were first-party ground truth is the single most common analytics mistake, and it's expensive because it produces confident decisions on shaky evidence. Grade the data, and your confidence matches your evidence.
In practice, the grading doesn't have to be elaborate — a simple discipline goes a long way. When a number drives a decision in the weekly review, attach a one-word confidence label: confirmed (first-party, server-side), reliable (first-party client-side), directional (platform-modeled), or hypothesis (third-party or competitor signal). The label travels with the number into the decision note, so anyone reading the decision knows how much weight the evidence carried. The payoff is twofold: decisions built on confirmed data can be made fast and acted on at scale, while decisions built on directional or hypothesis data are flagged as bets that need a confirmation step (a small test, a holdout, a wait-and-see) before a big commitment. This labeling habit is what turns the data-trust hierarchy from an abstract idea into an operating practice — and it costs nothing but the discipline of asking, for each number, "how do I actually know this?" Teams that build the habit stop being surprised when a "great" channel underperforms in the bank account, because they already knew its ROAS was directional, not confirmed, and treated it accordingly. The grade isn't bureaucracy; it's the difference between a decision you can defend and one you merely hope is right.
Attribution in a Privacy-Constrained World
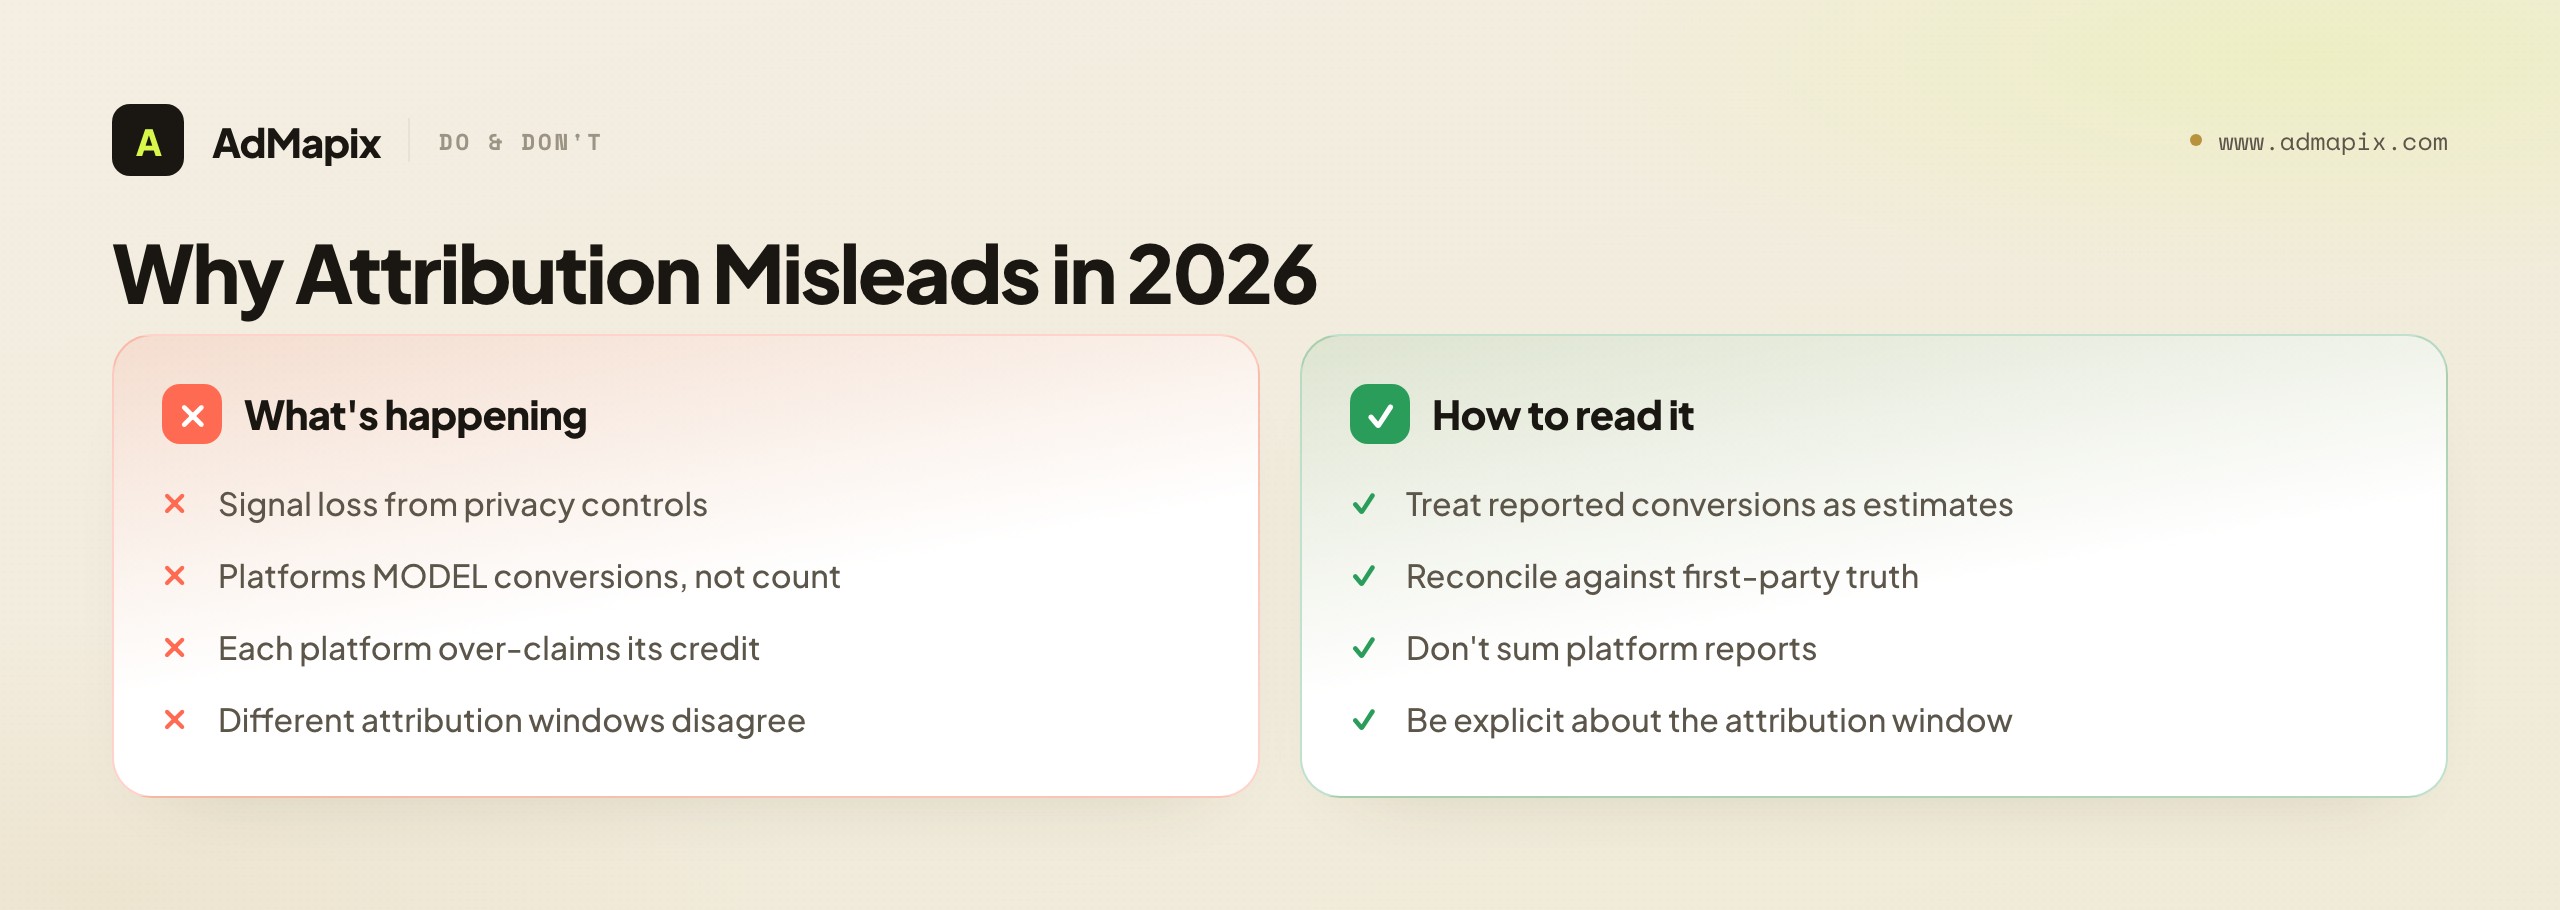
Attribution — deciding which ad gets credit for a conversion — got dramatically harder after the privacy changes of recent years, so understanding why platform-reported conversions are increasingly modeled keeps you from over-trusting them. In 2026, the attribution layer is the part of the stack most likely to mislead, because it looks precise while resting on degraded signal.
What changed and why it matters:
- Signal loss. Privacy controls (app-tracking transparency, cookie deprecation, consent gating) mean a meaningful share of conversions can't be deterministically tied to an ad click anymore. The data that used to connect click to conversion is partly gone.
- Modeling fills the gap. Platforms now model conversions — statistically estimating the conversions they can't directly observe — and report those models as conversion numbers. The number on the dashboard increasingly includes estimated conversions, not just counted ones, which makes it directional rather than exact.
- Platform over-claiming. Each platform models and claims its own contribution, so if you sum the conversions every platform reports, you'll often exceed your actual total — each is claiming credit for the same conversions. Blended numbers built by adding platform reports double-count.
- Attribution windows matter. The same conversion attributed on a 1-day click versus a 7-day click versus a view-through window produces different numbers, so two dashboards can both be "right" and disagree because they use different windows.
The practical implications for trusting your analytics: read platform-reported conversions as modeled, directional estimates rather than exact counts; reconcile cross-platform numbers against a neutral source of truth (first-party data, an MMP, or a clean attribution model) rather than summing platform reports; and be explicit about attribution windows when comparing numbers. The teams that measure well in 2026 aren't the ones with the most attribution data — they're the ones that know how much to trust the attribution they have and reconcile it against first-party truth. Attribution is the layer where the data-trust hierarchy matters most, because the numbers look authoritative while resting on the most degraded signal in the stack.
Cross-Channel Aggregation: The Recurring Headache
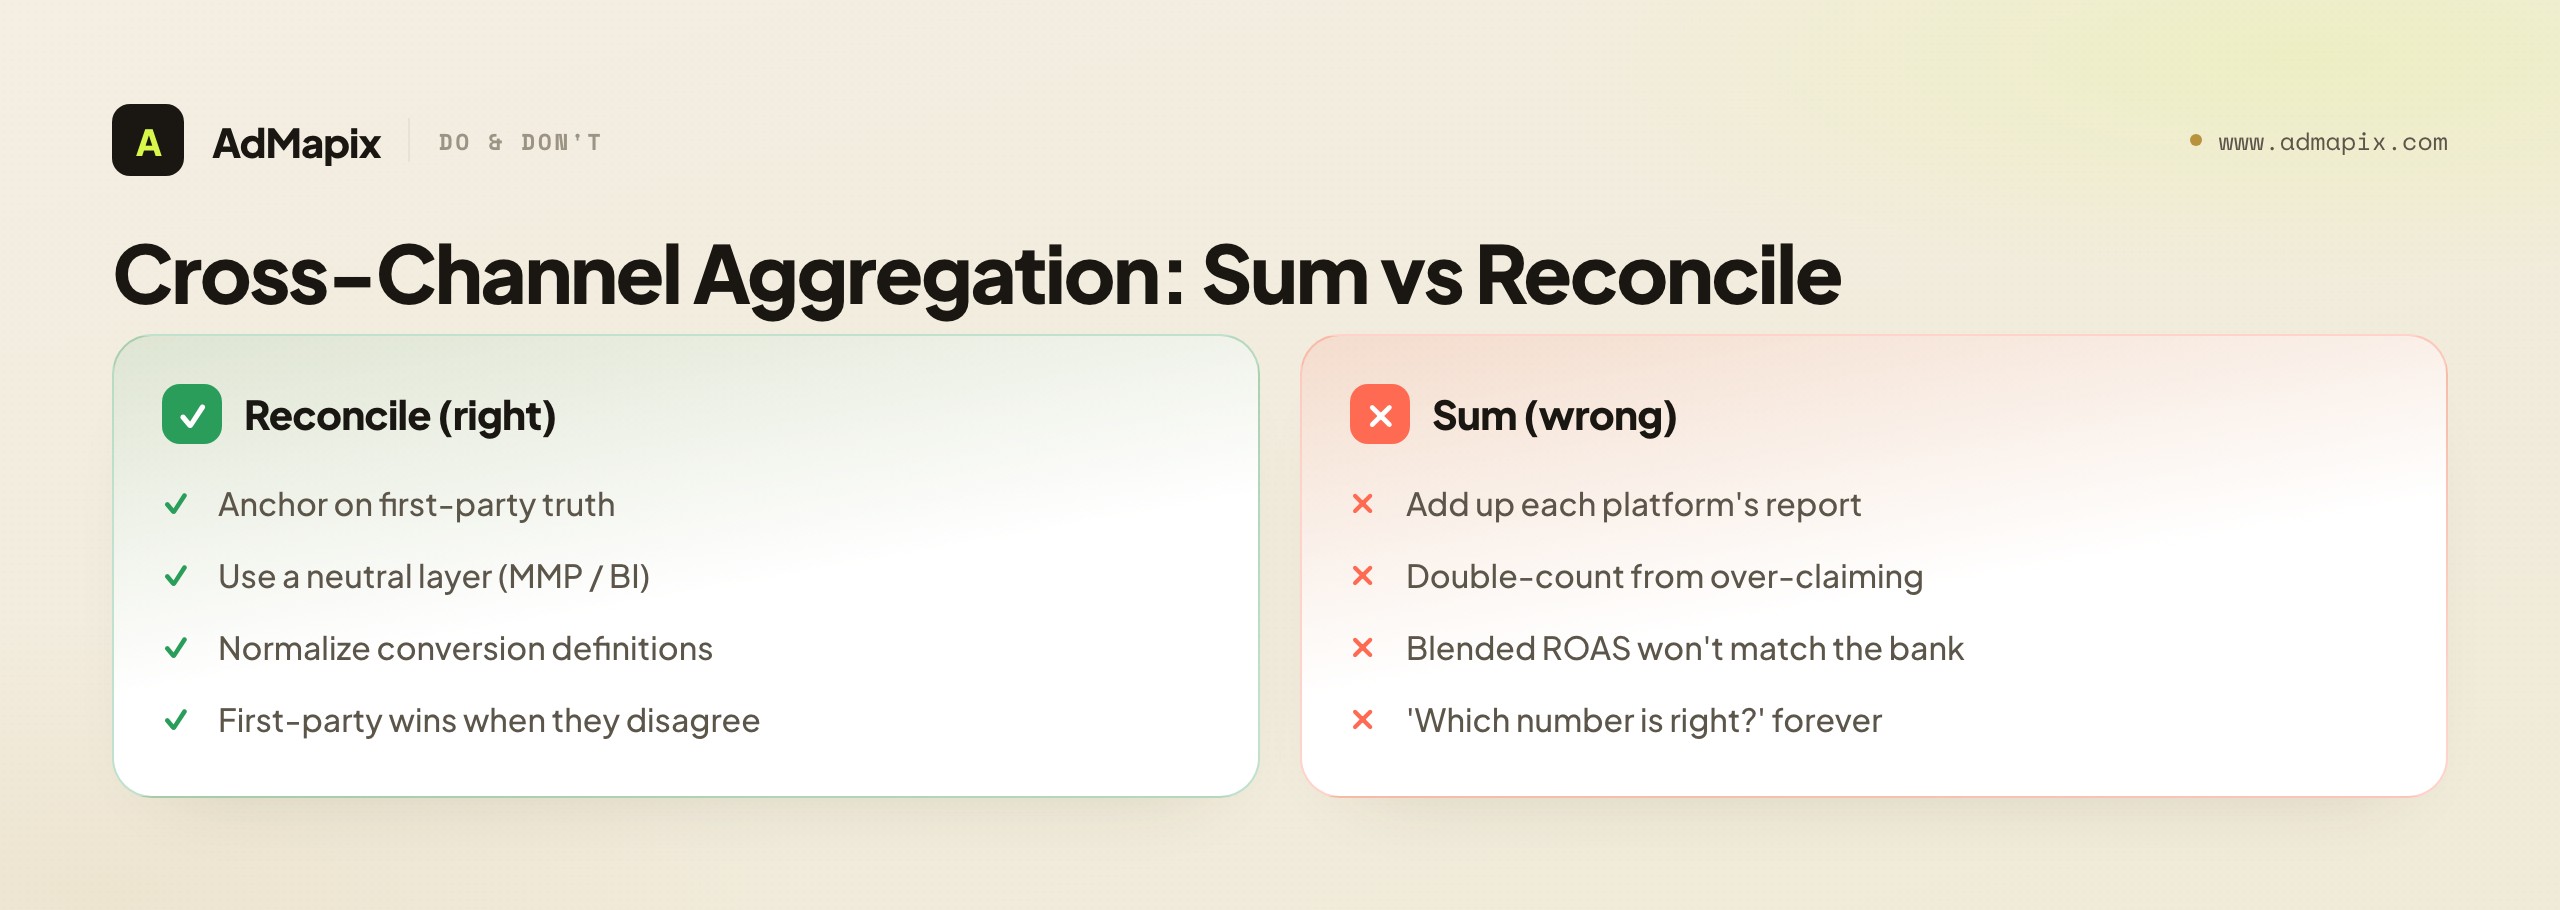
The moment a team runs paid media on more than one channel, aggregating the data into one trustworthy view becomes the recurring analytics headache — because each platform measures in its own walled garden, claims its own conversions, and reports on its own terms. Getting a clean cross-channel picture is harder than getting any single channel's picture, and it's where most "which number is right?" arguments originate.
The cross-channel aggregation problems and how to handle them:
- Double-counting from platform over-claiming. Sum Meta's, Google's, and TikTok's reported conversions and you'll often exceed your real total, because each claims overlapping credit. The fix is to reconcile against a neutral source (first-party data or an MMP) rather than adding platform reports.
- Inconsistent definitions. A "conversion" on one platform isn't defined the same way as on another — different events, windows, and modeling. Aggregating requires normalizing the definitions, not just stacking the numbers.
- The neutral-layer solution. A mobile measurement partner (MMP) for apps, or a BI tool with a clean attribution model for web, gives you a single neutral view that reconciles the platforms rather than trusting each one's self-report. This neutral layer is what makes cross-channel numbers trustworthy.
- The first-party anchor. Whatever the platforms say, your own first-party data (orders, signups, subscriptions in your own systems) is the anchor of truth that the channel reports should reconcile to. When platform numbers and first-party numbers disagree, the first-party number wins.
The strategic synthesis: cross-channel aggregation is a reconciliation problem, not an addition problem. The teams that get it wrong sum platform reports and wonder why the blended ROAS doesn't match the bank account; the teams that get it right anchor on first-party truth, use a neutral measurement layer to reconcile the channels, and treat each platform's self-report as a claim to be checked rather than a fact to be summed. This is where the tool stack's measurement layer (the MMP or BI tool) earns its place — its whole job is producing a cross-channel view you can actually trust.
Beyond Attribution: Incrementality and Holdout Testing
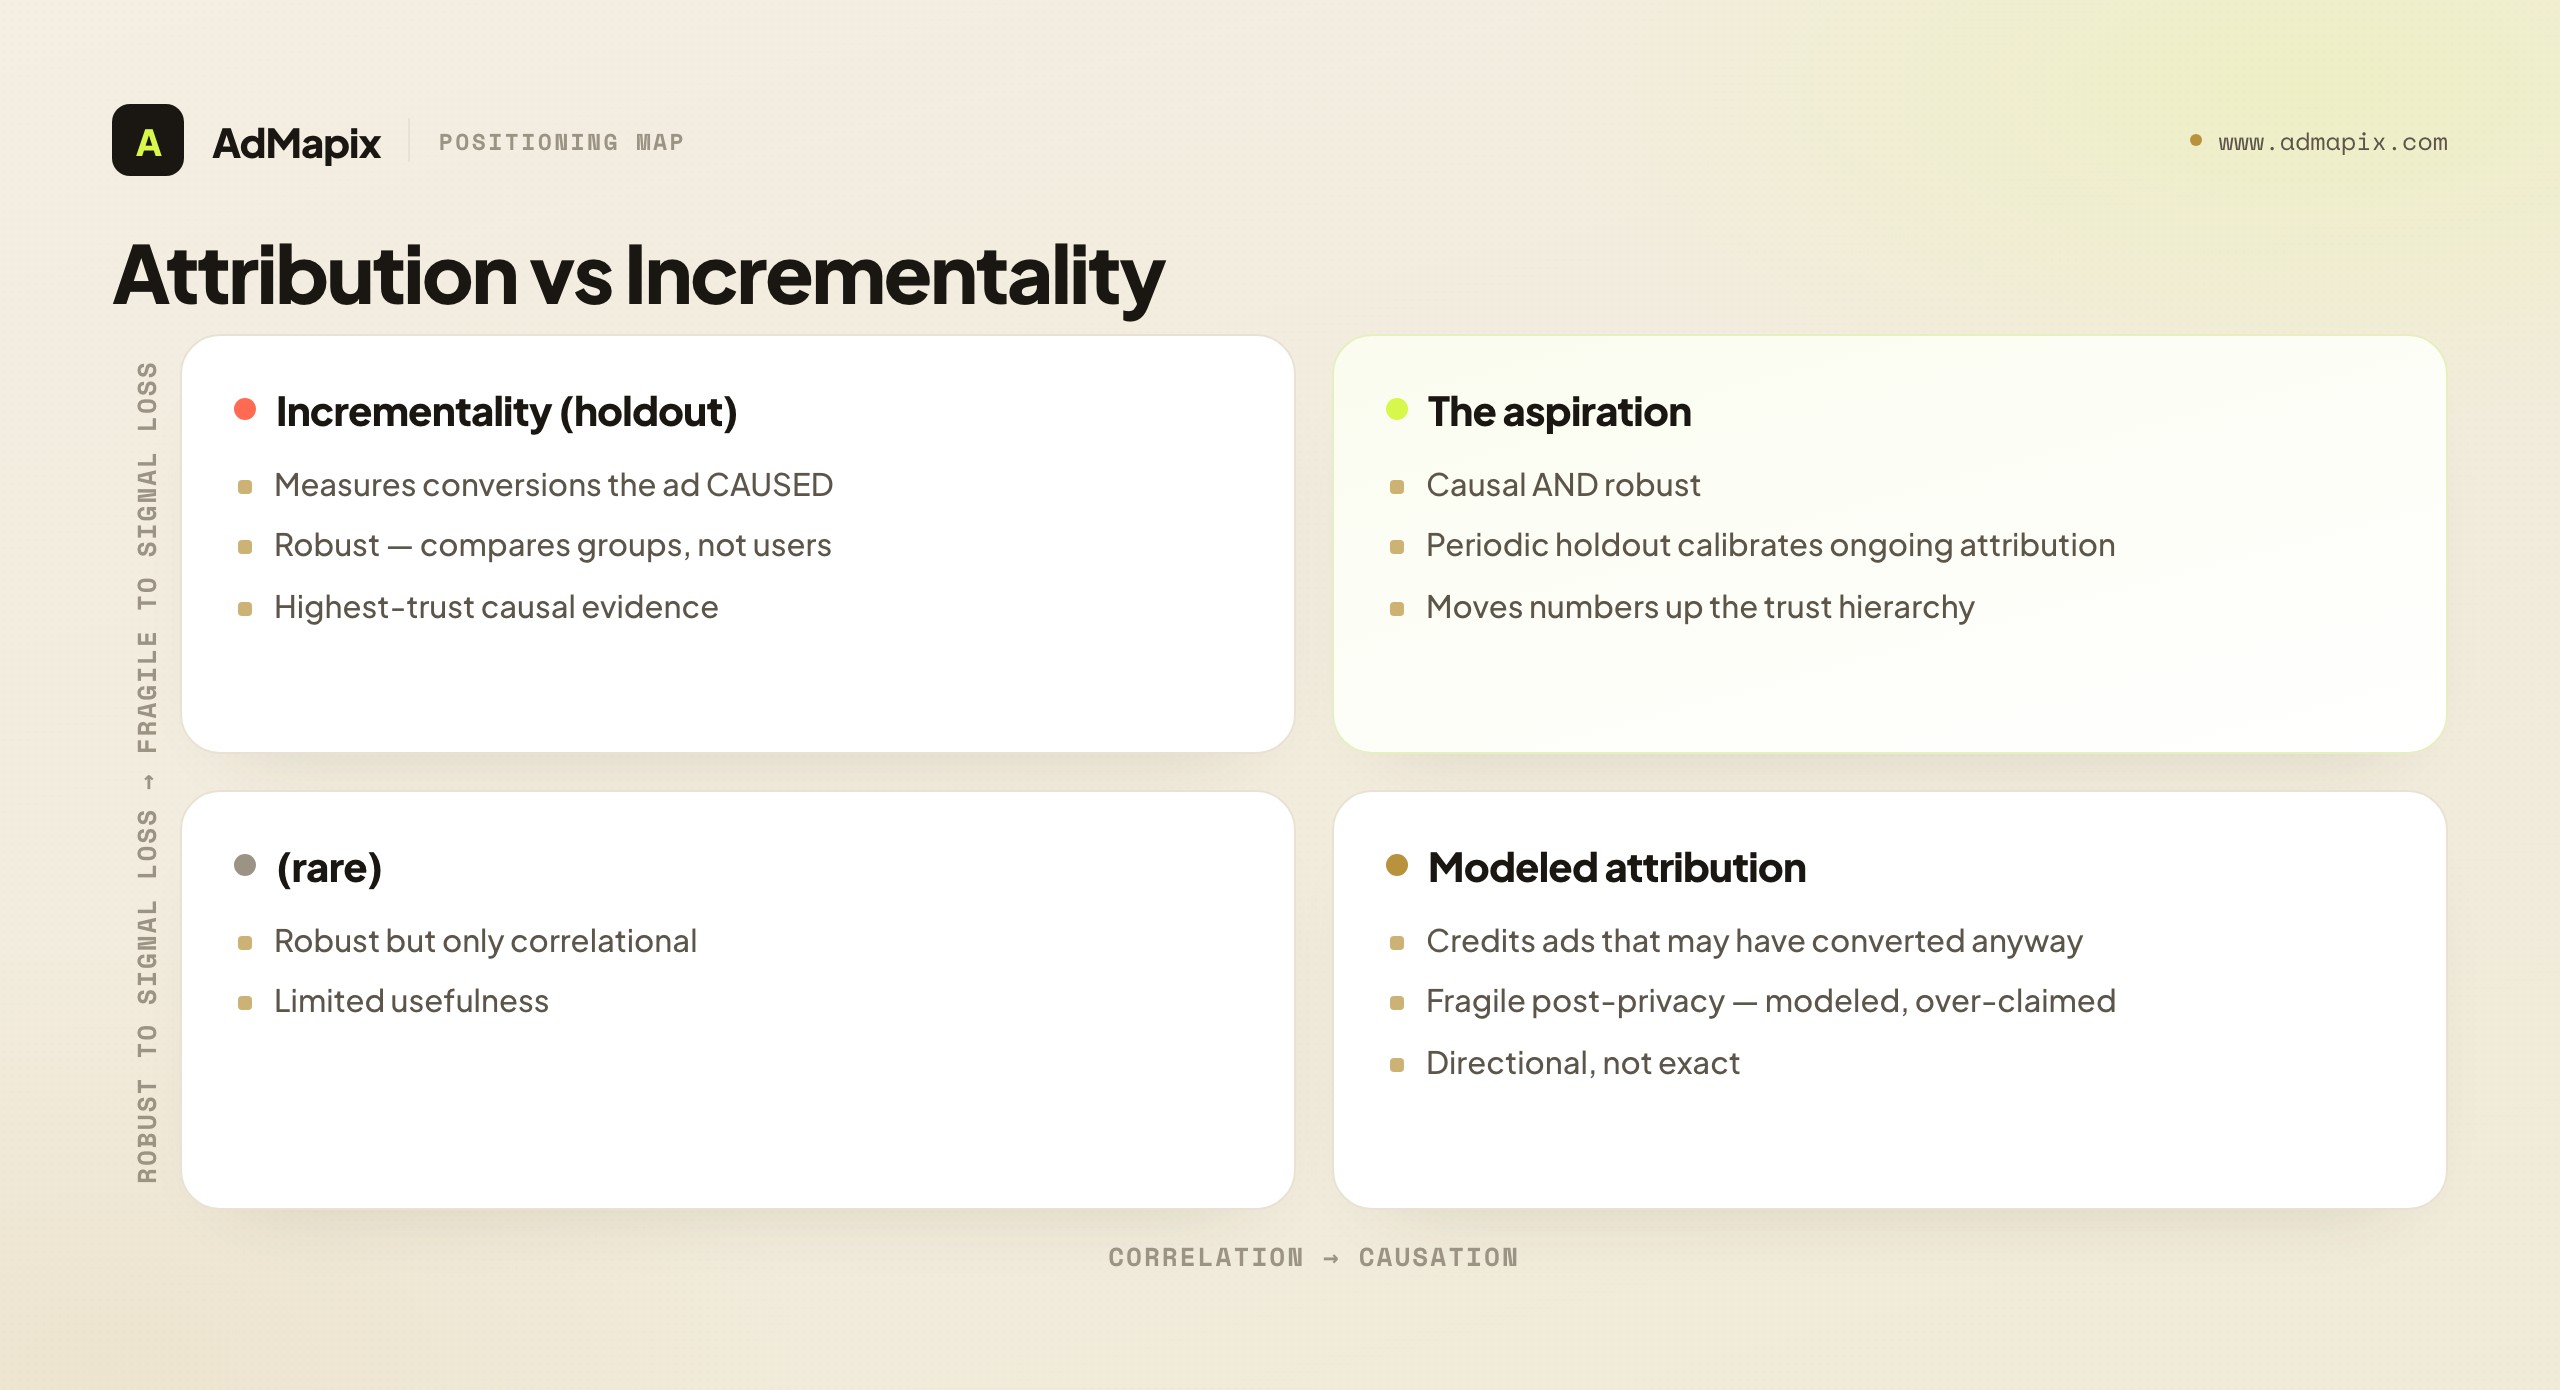
When attribution can't tell you whether an ad actually caused a conversion, incrementality testing can — so the most trustworthy measurement technique in 2026 isn't a better attribution model, it's a holdout test that measures causation directly. This is the measurement upgrade most teams haven't made, and it's where the data-trust hierarchy points: incrementality produces first-party causal evidence, the highest grade there is.
The core idea is simple: attribution asks "which ad gets credit for this conversion?" — a question that's gotten unanswerable as signal degraded. Incrementality asks a different, more answerable question: "how many more conversions did we get because we ran this ad, versus not running it?" You answer it by holding out a portion of your audience (showing them no ads, or a control), running ads to the rest, and measuring the difference in conversions between the two groups. That difference is the incremental lift — the conversions the ad genuinely caused, not the ones it merely got attribution credit for.
Why incrementality matters for trusting your analytics:
- It measures causation, not correlation. Attribution credits an ad for a conversion that might have happened anyway; incrementality measures only the conversions that wouldn't have happened without the ad. That's the number that actually justifies the spend.
- It's robust to signal loss. Because it compares two groups rather than tracking individual click-to-conversion paths, incrementality testing survives the privacy changes that broke deterministic attribution. You don't need to track the individual user; you need the difference between the groups.
- It exposes over-claiming. Platform-reported conversions often dramatically exceed the incremental lift a holdout test reveals — the platform claims conversions that would have happened anyway. Running an incrementality test on a channel that looks great in platform reports is the cleanest way to learn whether its reported ROAS is real or inflated.
- It's the antidote to attribution arguments. When two dashboards disagree about which channel deserves credit, an incrementality test settles it by measuring actual causal lift rather than arguing about attribution windows.
The practical caveat: incrementality testing requires enough volume to detect a difference between the holdout and the test group, and it costs you the conversions from the held-out audience during the test. So it's not something you run constantly — it's a periodic calibration that tells you how much to trust your ongoing attribution. The mature measurement stack uses attribution for day-to-day directional reads and periodic incrementality tests to calibrate how much that attribution can be trusted. For most teams in 2026, adding even occasional holdout testing is the single biggest upgrade to data trustworthiness available — it moves the most important numbers up the trust hierarchy from "modeled estimate" toward "first-party causal evidence." The teams that scale budget confidently are the ones that have calibrated their attribution against incrementality at least once, so they know how much of their reported ROAS is real lift and how much is the platform claiming credit for conversions that would have happened anyway.
Tracking Creatives as Entities, Not Campaign Lines
The single most under-tracked thing in most paid ads stacks is per-creative performance, because so many stacks aggregate to the campaign and lose the creative signal — yet the creative is what you actually iterate, so tracking creatives as first-class entities is what makes the analytics actionable. A stack that can tell you a campaign's CPA but not which creative drove it can't inform a creative brief, which is where most of the actionable decisions live.
What tracking creatives as entities requires and unlocks:
- A persistent creative ID. Each creative needs an identifier that follows it across campaigns and ad sets, so you can see its performance wherever it ran, not fragmented across the campaigns it appeared in. Without a creative ID, the same creative's performance is scattered and invisible.
- Per-creative metrics, not just campaign rollups. CTR, CPA, frequency, and spend at the creative level — because a campaign's blended number hides which specific creative is winning and which is dragging it down. The blended number tells you the campaign is fine while a fatigued creative quietly bleeds inside it.
- Creative-level fatigue and lifecycle reads. Tracking each creative's frequency and CTR over time is what enables the fatigue diagnosis from our creative fatigue analysis guide — you can't diagnose creative fatigue if you can't see per-creative frequency and CTR.
- The link to the testing system. Per-creative performance is the scoreboard for your creative testing — which variant won, by how much, on which metric — which is how analytics feeds the creative testing framework. Without per-creative data, you can't rank creatives or know which test won.
The strategic point: a stack that tracks creatives as entities turns analytics from a campaign-level "is it working?" into a creative-level "what should the next creative be?" — and the second question is where the value is, because the creative is the lever you pull. Most analytics dysfunction around creative comes down to this: the stack aggregates away the creative signal, so the team flies blind on the one variable they most need to optimize. Insist on per-creative tracking, and the whole stack becomes more actionable — it's the difference between knowing a campaign works and knowing which creative to make next.
The Tool-Stack Layers, From Native Reports to Competitor Intelligence
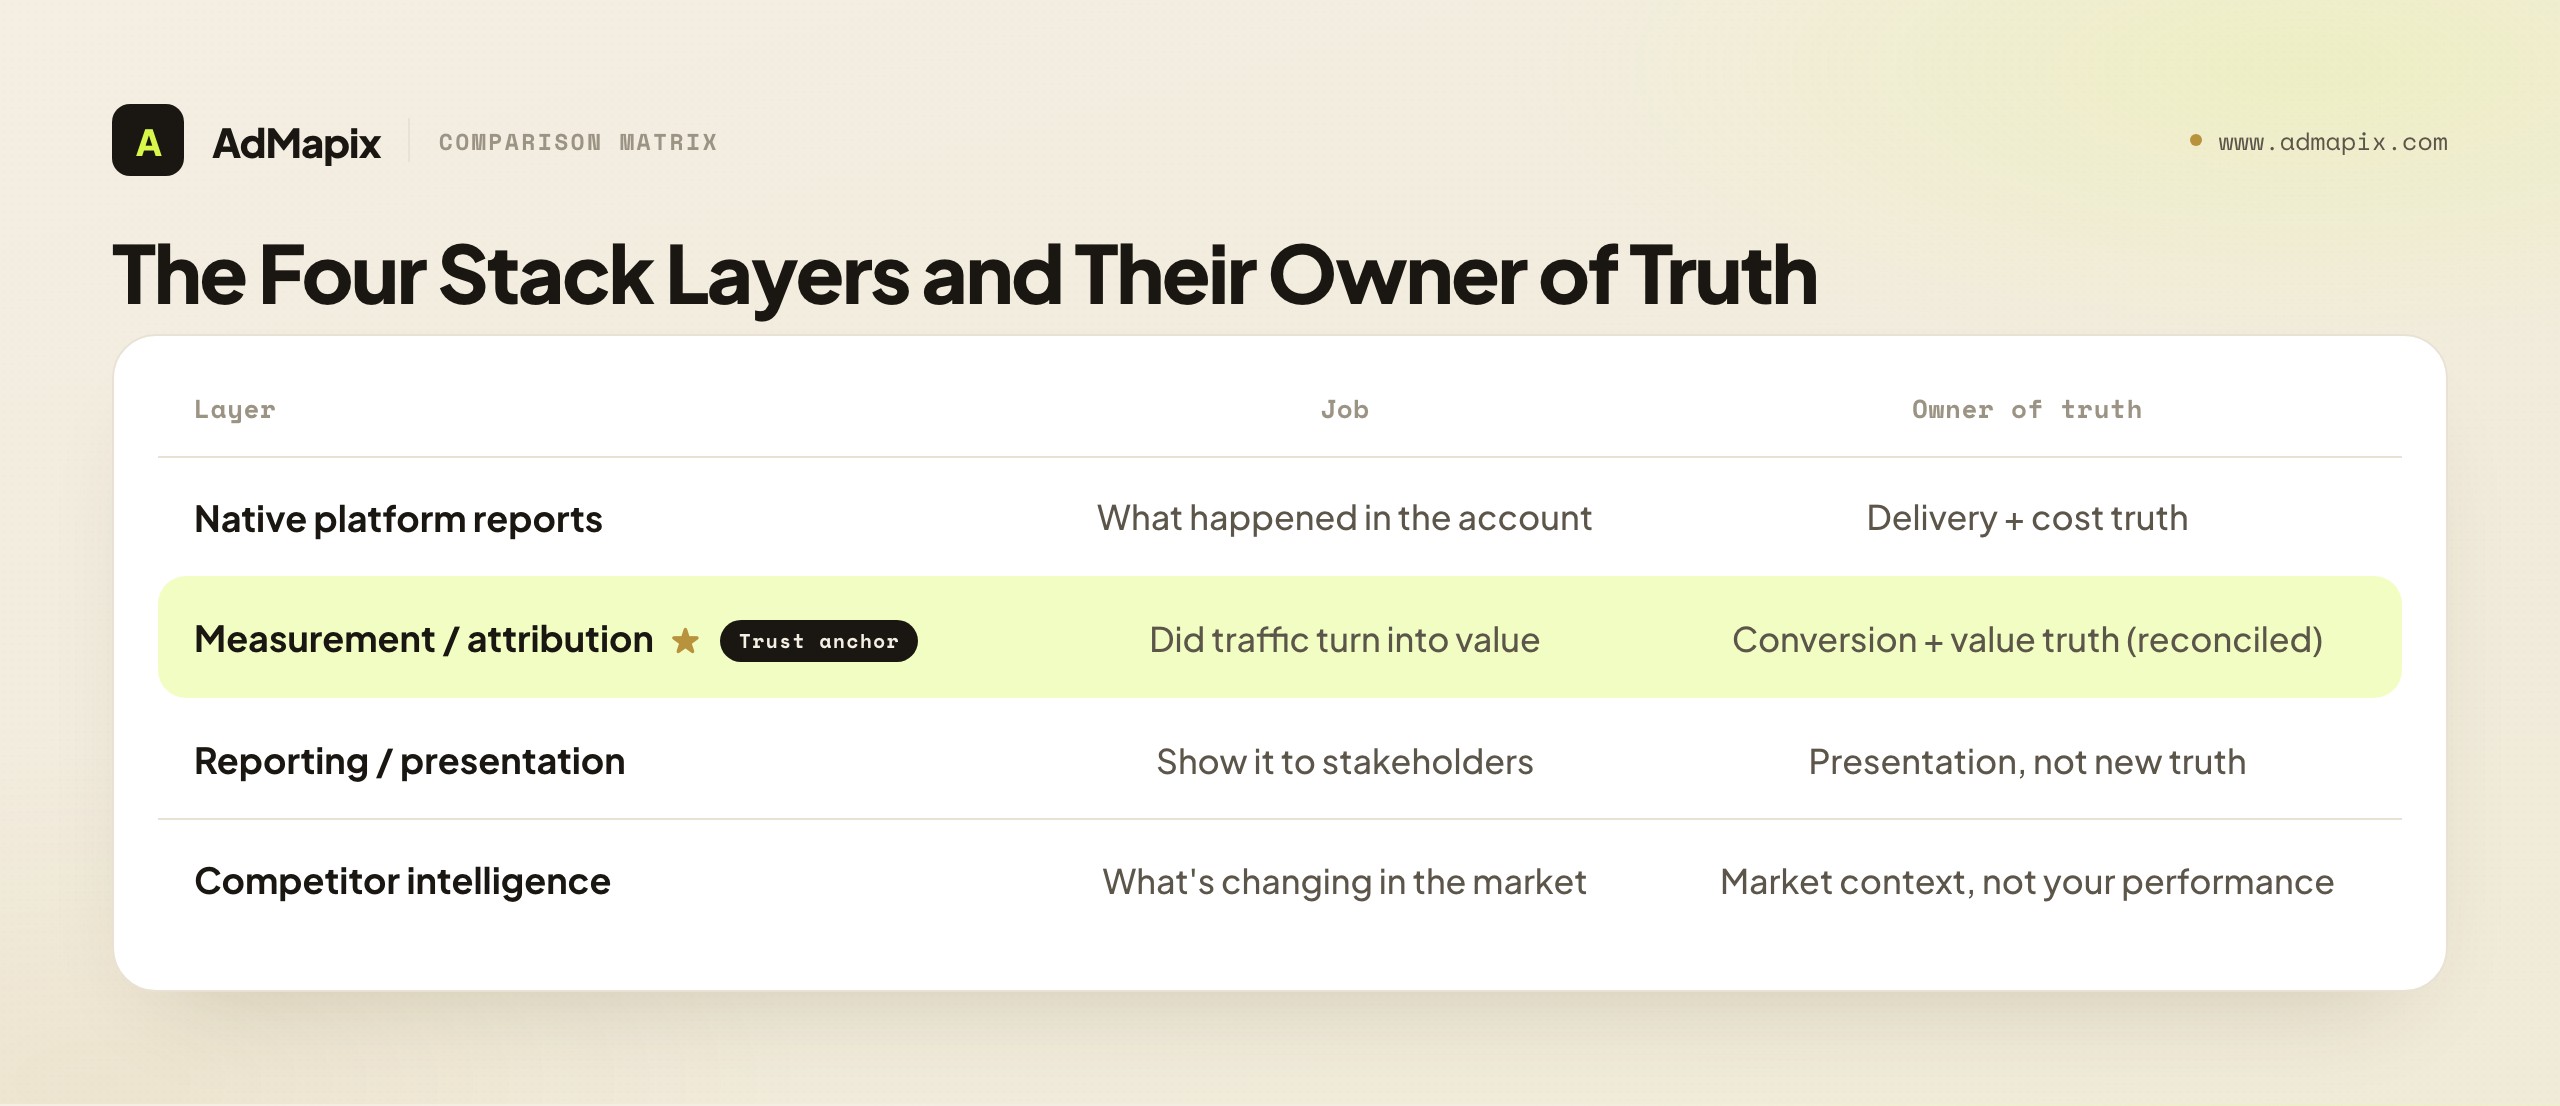
With the metrics and data-trust questions settled, the tool stack itself is straightforward — four layers, each doing one job, each with a clear owner of truth. The mistake is buying overlapping tools that blur the layers; the fix is one tool per layer, chosen for the job it actually does.
| Layer | Job | Owner of truth | Example tools |
|---|---|---|---|
| Native platform reports | What happened in the account (spend, delivery, CTR, platform conversions) | Delivery and cost truth | Meta Ads Manager, Google Ads |
| Measurement / attribution | Did paid traffic turn into value (reconciled across channels) | Conversion and value truth | MMP (apps), product analytics / GA4 / CRM, BI |
| Reporting / presentation | Show it to a client or stakeholder | Presentation, not new truth | Looker Studio, reporting connectors |
| Competitor intelligence | What's changing in the market | Market context, not your performance | AdMapix, ad libraries |
How the layers fit together: native reports give you cost and delivery truth and a first read on performance, but you can't trust their conversion claims at face value (the attribution problem). The measurement layer (an MMP for apps, product analytics or a BI tool with a clean attribution model for web) reconciles conversions across channels and anchors on first-party truth — this is where you get a trustworthy value picture. The reporting layer packages that for stakeholders without inventing new truth (a reporting connector standardizes views; it doesn't create strategy). And the competitor-intelligence layer adds market context the other three can't see. Each layer has a distinct owner of truth, and confusing them — trusting a native report's conversion count, or asking a reporting connector for strategy — is the root of most analytics dysfunction. For the broader tool landscape, see our marketing intelligence tools guide and best ad spy tools roundup.
A Weekly Workflow That Uses All Four Jobs
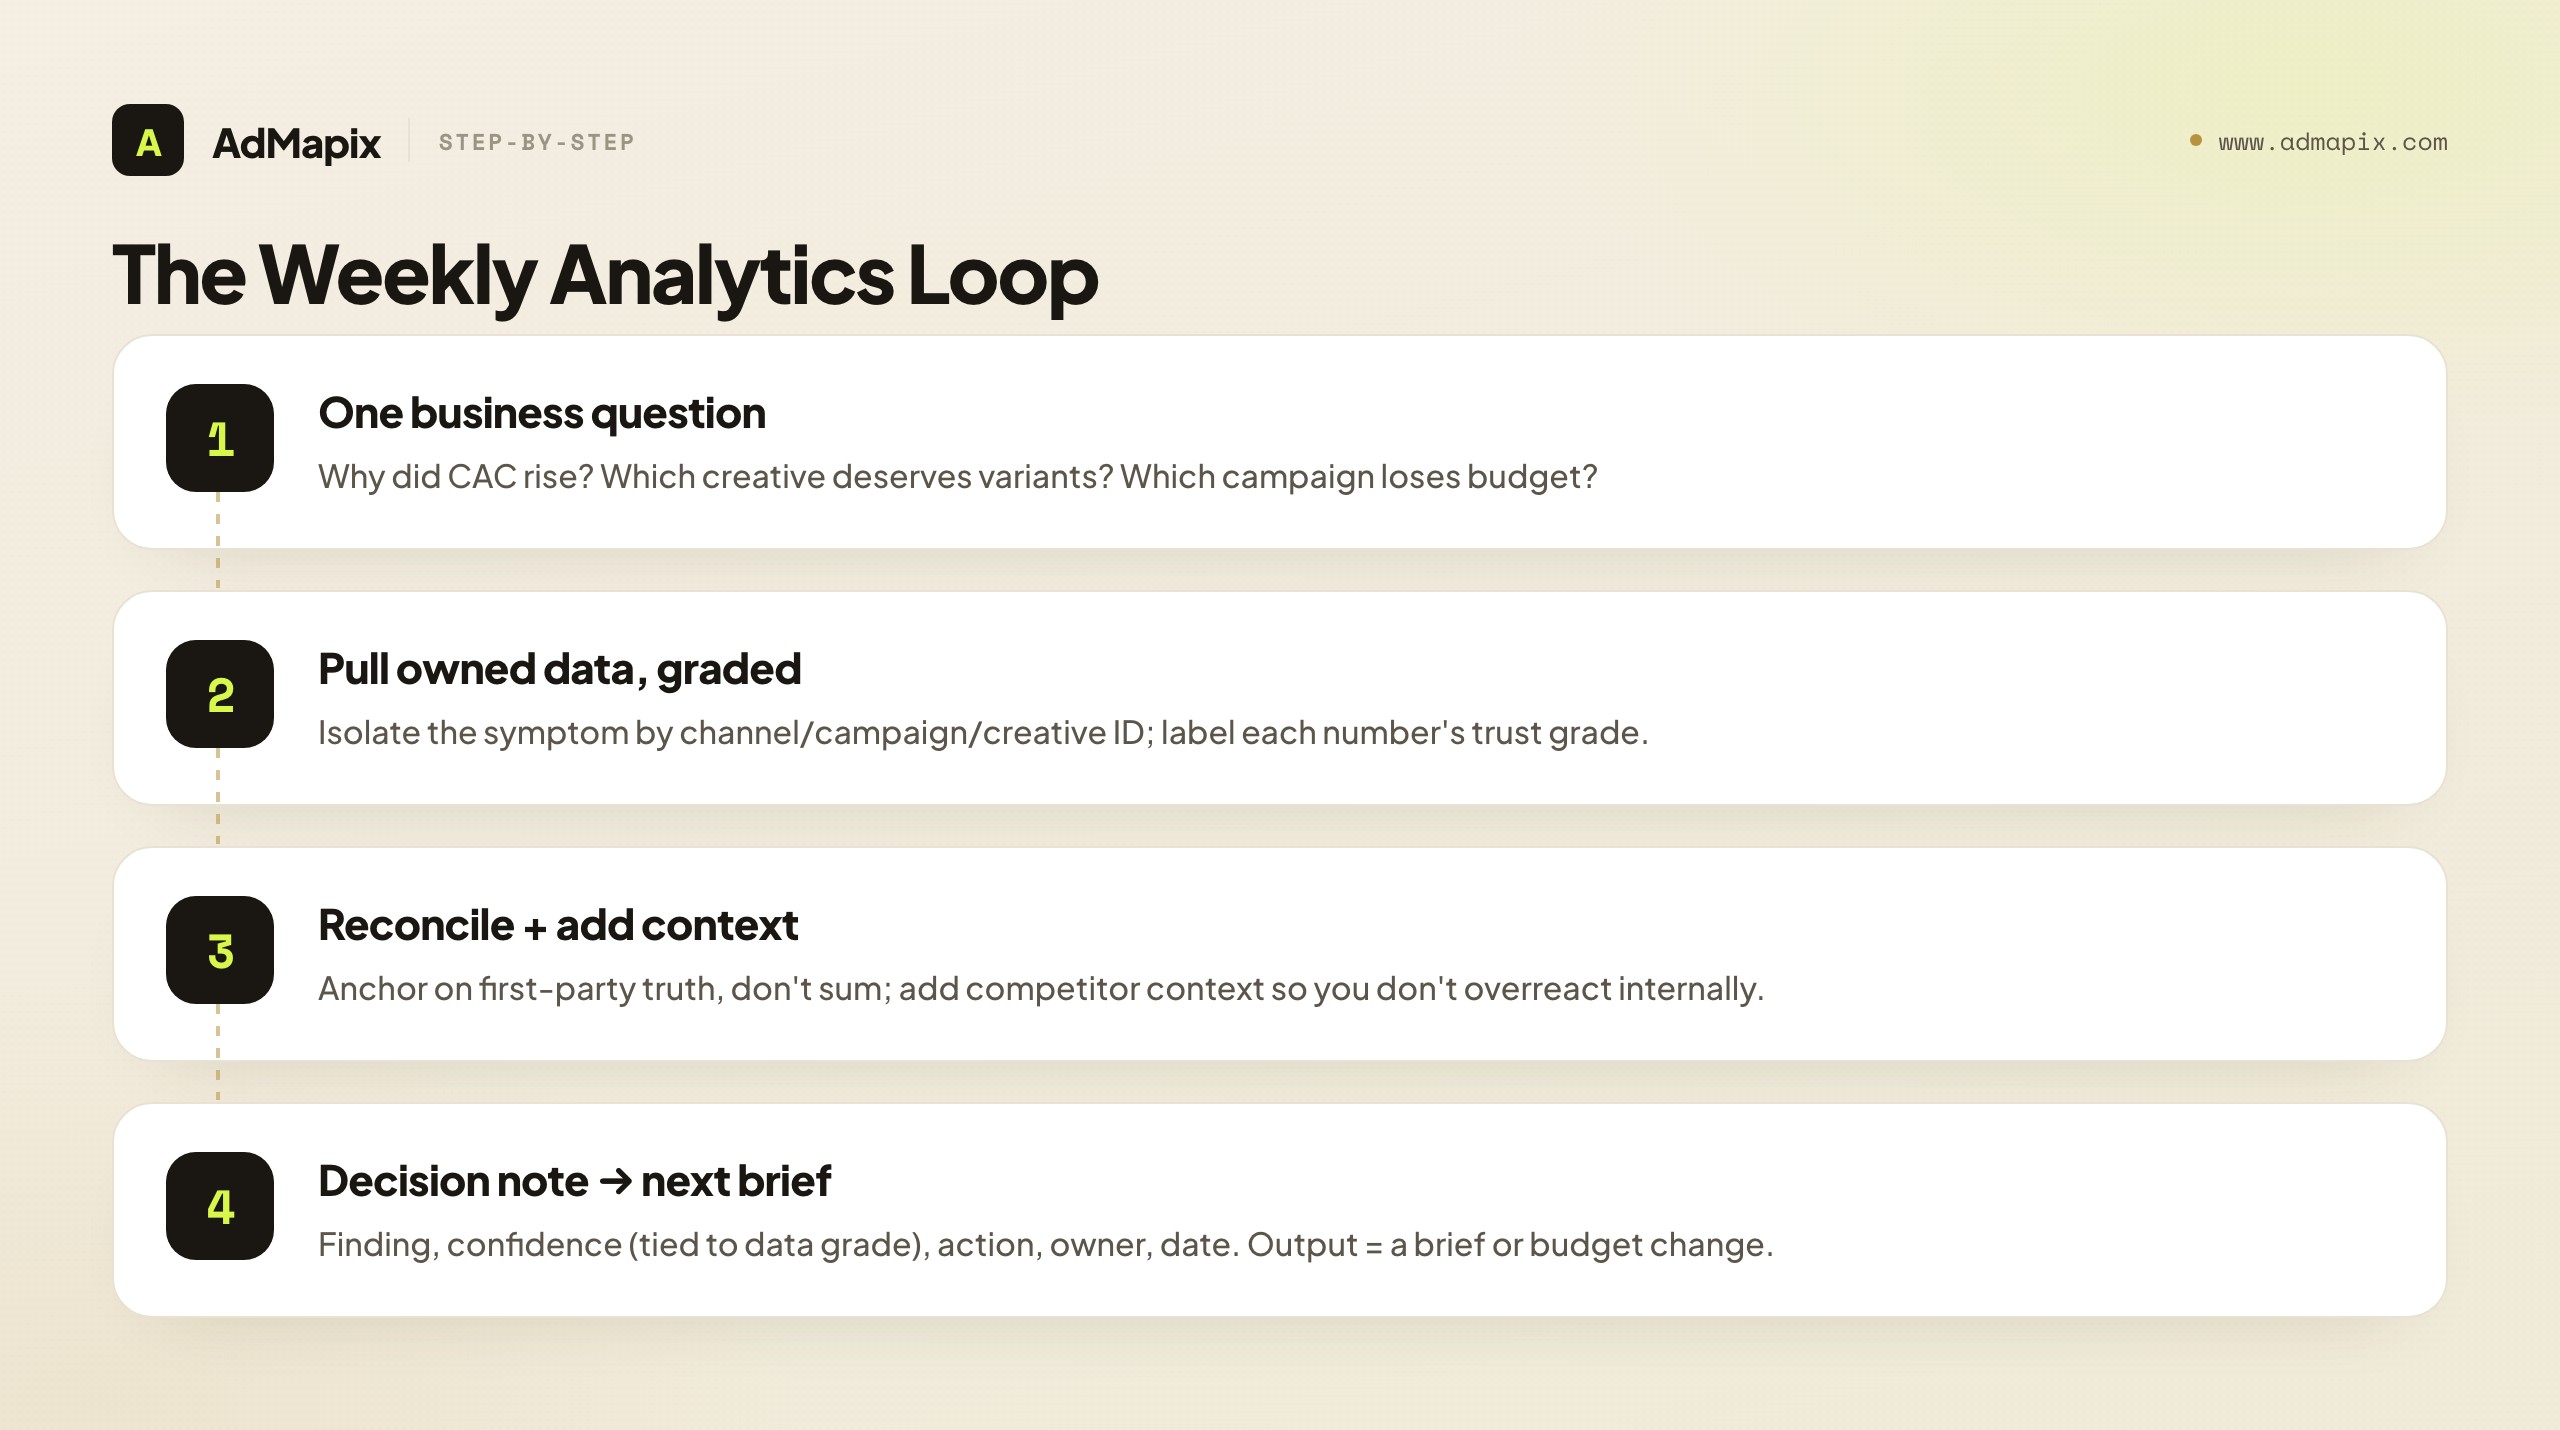
The workflow that keeps the stack honest is a single weekly loop that starts with a business question and ends with a brief. Tools serve the loop; the loop doesn't serve the tools.
- Start with one business question. For example: why did CAC rise, which creative angle deserves new variants, which campaign should lose budget, or which competitor move needs a response.
- Pull owned performance data, graded. Use native reports and your measurement layer to isolate the symptom by channel, campaign, creative ID, audience, and landing page — and label each number with its trust grade (first-party confirmed vs. modeled).
- Reconcile, don't sum. Anchor cross-channel numbers on first-party truth rather than adding platform reports, so the blended picture is trustworthy.
- Add external context. Look at recent competitor ads, offer changes, channel mix, and format shifts. This stops teams from overreacting to internal data alone.
- Write a short decision note. Finding, confidence level (tied to the data grade), action, owner, review date. Five lines is enough.
- Feed the next brief. The output should become a creative brief, a search-copy update, a landing-page test, or a reporting change.
The discipline that makes this work is steps 2 and 3 — grading the data and reconciling rather than summing. A weekly review that labels each number's trust grade and anchors on first-party truth produces decisions you can stand behind; one that treats every dashboard number as equally reliable produces confident mistakes. The loop, run weekly with one named owner, is what turns a pile of tools into a decision engine.
Mini Case: Rising CPI, Flat CTR
A short example shows why competitor context belongs in the same review as account data, and why grading the data matters. A mobile app team watches cost per install climb while CTR stays flat. Account analytics confirms the symptom — but here's the data-trust nuance: the CPI is a first-party-anchored number (installs are confirmed), so the team trusts the symptom is real, not a modeling artifact. That confidence lets them act rather than second-guess the data.
The flat CTR with rising CPI is a useful diagnostic combination (covered in the fatigue analysis guide): clicks are steady but installs cost more, which points past the creative hook. Pulling competitor creatives shows the market has moved from testimonial hooks to direct gameplay proof in the first three seconds. The right response isn't a bid tweak; it's a new creative brief built around gameplay-proof openers — a hypothesis from competitor context, to be confirmed in the team's own first-party install data once the new creative ships.
This is where a creative intelligence layer earns its place. With AdMapix you can search ads by network, country, app, time range, and format, then save the strongest examples, run video analysis on the openers, and tag the patterns worth testing. The value isn't collecting examples; it's turning them into a sharper hypothesis before the next test ships — and the discipline is remembering that the competitor signal is a hypothesis (low trust for outcomes), confirmed only in the team's own first-party data (highest trust).
The Stack by Team Size
The right analytics stack depends heavily on team size and maturity, so matching the stack to where you actually are prevents both over-buying (a solo marketer buying enterprise tools) and under-building (a scaled team flying on platform reports alone). The four jobs are universal, but how you staff and tool them scales with the team.
- Solo marketer / small store. Native platform reports plus a lightweight product-analytics tool (GA4) plus a spreadsheet covers most needs, and competitor context comes from free ad libraries or a single creative-intelligence tool. The measurement layer can be light because the channel count is low — cross-channel reconciliation is less urgent when you run one or two channels. Don't buy an MMP or a BI suite; you don't have the volume or channel complexity to justify it.
- Growing in-house team. Once you're across several channels with meaningful spend, the measurement layer earns its place — an MMP for apps, or a BI tool with a clean attribution model for web — because cross-channel reconciliation has become a real problem. Reporting connectors start mattering as stakeholders multiply, and a dedicated creative-intelligence tool earns its place once competitor research is weekly.
- Scaled team / multiple products. The full four-layer stack with dedicated tools per layer, plus periodic incrementality testing to calibrate attribution, plus per-creative tracking infrastructure. At this scale the cost of measurement error is large enough that the investment in trustworthy data (incrementality, reconciliation, first-party anchoring) pays for itself.
- Agency. A standardized stack applied across clients, with reporting connectors doing heavy lifting (because client-ready presentation is a core deliverable) and creative intelligence as a differentiator. The agency challenge is consistency across accounts, so the stack is chosen for repeatability as much as depth.
The strategic point: don't copy a scaled team's stack if you're a solo marketer, and don't run a scaled team on a solo marketer's stack. The four jobs are constant, but the tooling investment should match the channel count, spend level, and team size — over-tooling wastes money on capabilities you can't use, and under-tooling leaves a scaled team making big decisions on untrustworthy blended numbers. Match the stack to the stage, and revisit the fit as the team and the channel mix grow — the right stack at one stage is the wrong stack at the next.
Build vs. Buy for the Measurement Layer
The measurement layer — the part that reconciles conversions across channels and anchors on first-party truth — is where the build-vs-buy decision matters most, because it's the layer that determines how much you can trust your numbers. Native reports and competitor intelligence are clearly buy; the measurement layer is where teams genuinely choose.
The realistic options for the measurement layer:
- Buy a measurement product (MMP or analytics platform). For apps, a mobile measurement partner is effectively the standard — building app attribution in-house is rarely worth it. For web, a product-analytics platform or a BI tool with attribution capabilities handles most teams' needs. Buying is the right default for most teams, because measurement is a solved, specialized problem.
- Build a data warehouse with a custom attribution model. A scaled team with engineering resources and complex, multi-channel measurement needs sometimes builds a warehouse (pulling platform and first-party data into one place) with a custom attribution model on top. This gives maximum control and the cleanest first-party anchoring, but it's a real engineering investment justified only at scale.
- Hybrid. Many scaled teams buy the MMP or analytics platform for the heavy lifting and build a lightweight warehouse layer on top for first-party anchoring and custom reconciliation. This balances the specialized measurement capability you'd buy against the first-party control you'd build.
The decision principle: buy the measurement layer unless you're at a scale where custom measurement is a genuine competitive advantage and you have the engineering to maintain it. For the large majority of teams, a bought measurement product reconciled against first-party data is more trustworthy and far cheaper than a half-built custom system. The trap is a mid-size team building custom measurement it can't maintain, ending up with a fragile system less trustworthy than the product it could have bought. Build only when the scale and the engineering justify it; otherwise buy and anchor on first-party truth.
Metric Anti-Patterns to Cut From the Review
The fastest way to make a paid ads review more useful is to cut the metrics that don't drive decisions, so recognizing the common anti-patterns is what keeps a review lean and actionable. Every metric that survives the review should map to an action; the ones that don't are noise that crowds out signal.
The anti-patterns to cut:
- Vanity reach and impression counts. Impressions and reach for their own sake — without a cost or conversion tie — rarely change an action. They feel like progress but don't tell you what to do. Keep them only where they tie to a specific decision (frequency for fatigue, for instance).
- Blended numbers with no segmentation. A blended ROAS or blended CPA across channels, creatives, and audiences hides everything actionable. It tells you the average is fine while a specific creative or channel quietly fails. Segment, or cut it.
- Engagement metrics with no conversion link. Likes, comments, and shares that don't connect to a conversion or a creative decision are vanity. They can matter for organic, but in a paid performance review they're usually noise.
- Lagging-only metrics with no leading companion. A review built only on lagging metrics (cost per result after the fact) catches problems late. Pair lagging metrics with leading ones (frequency, CTR) so the review catches issues early, not after they've cost budget.
- Metrics nobody owns the action on. If a metric is in the review but no one knows what action it would trigger, it's decoration. Either define the decision it drives or cut it.
The discipline that keeps a review sharp is the same one this whole guide is built on: every metric must map to a decision, and every decision must be weighted by the trust grade of the data behind it. A review with six decision-driving metrics, each graded for trust, beats a dashboard with sixty metrics nobody acts on — and cutting the anti-patterns is how you get from the second to the first. The goal isn't more measurement; it's measurement that changes what you do, which is the entire point of a paid ads analytics stack.
How the Four Jobs Feed One Decision
The four jobs only create value when they feed a single decision, so the final integration point is understanding how owned performance, value measurement, reporting, and competitor context combine — because a stack where the four jobs run in separate silos produces four disconnected dashboards, not one decision. The whole point of the stack is that the four jobs converge.
How the jobs converge in practice:
- Owned performance (job 1) surfaces the symptom. Native reports show what changed — a rising CPA, a falling CTR, a campaign over-delivering — which is where most reviews start. But the symptom alone doesn't tell you the cause or the fix.
- Value measurement (job 2) confirms the symptom is real. The reconciled, first-party-anchored measurement layer confirms whether the symptom is genuine (a real CPA rise) or a measurement artifact (a modeled-attribution wobble). This is the trust check that prevents acting on noise.
- Competitor context (job 4) supplies the hypothesis. When the owned data confirms a real problem but not its cause, competitor intelligence often supplies the missing hypothesis — the market moved to a new hook, a competitor launched an offer, the category shifted. This is the external context that internal data structurally can't provide.
- Reporting (job 3) communicates the decision. Once the decision is made, the reporting layer packages it for stakeholders — the evidence, the read, the action — without inventing new truth.
The decision that emerges is better than any single job could produce: owned data confirms the real problem, value measurement grades how much to trust it, competitor context supplies the likely cause, and reporting communicates the response. A stack where these four run as separate dashboards never produces that integrated decision — the team looks at four screens and argues. A stack wired so the four jobs feed one weekly decision produces a confident, evidence-graded, market-aware action every cycle. That integration — four jobs, one decision, every metric graded for trust — is the entire point of a paid ads analytics stack, and it's what separates a stack that informs decisions from a pile of tools that just produces numbers nobody trusts or acts on.
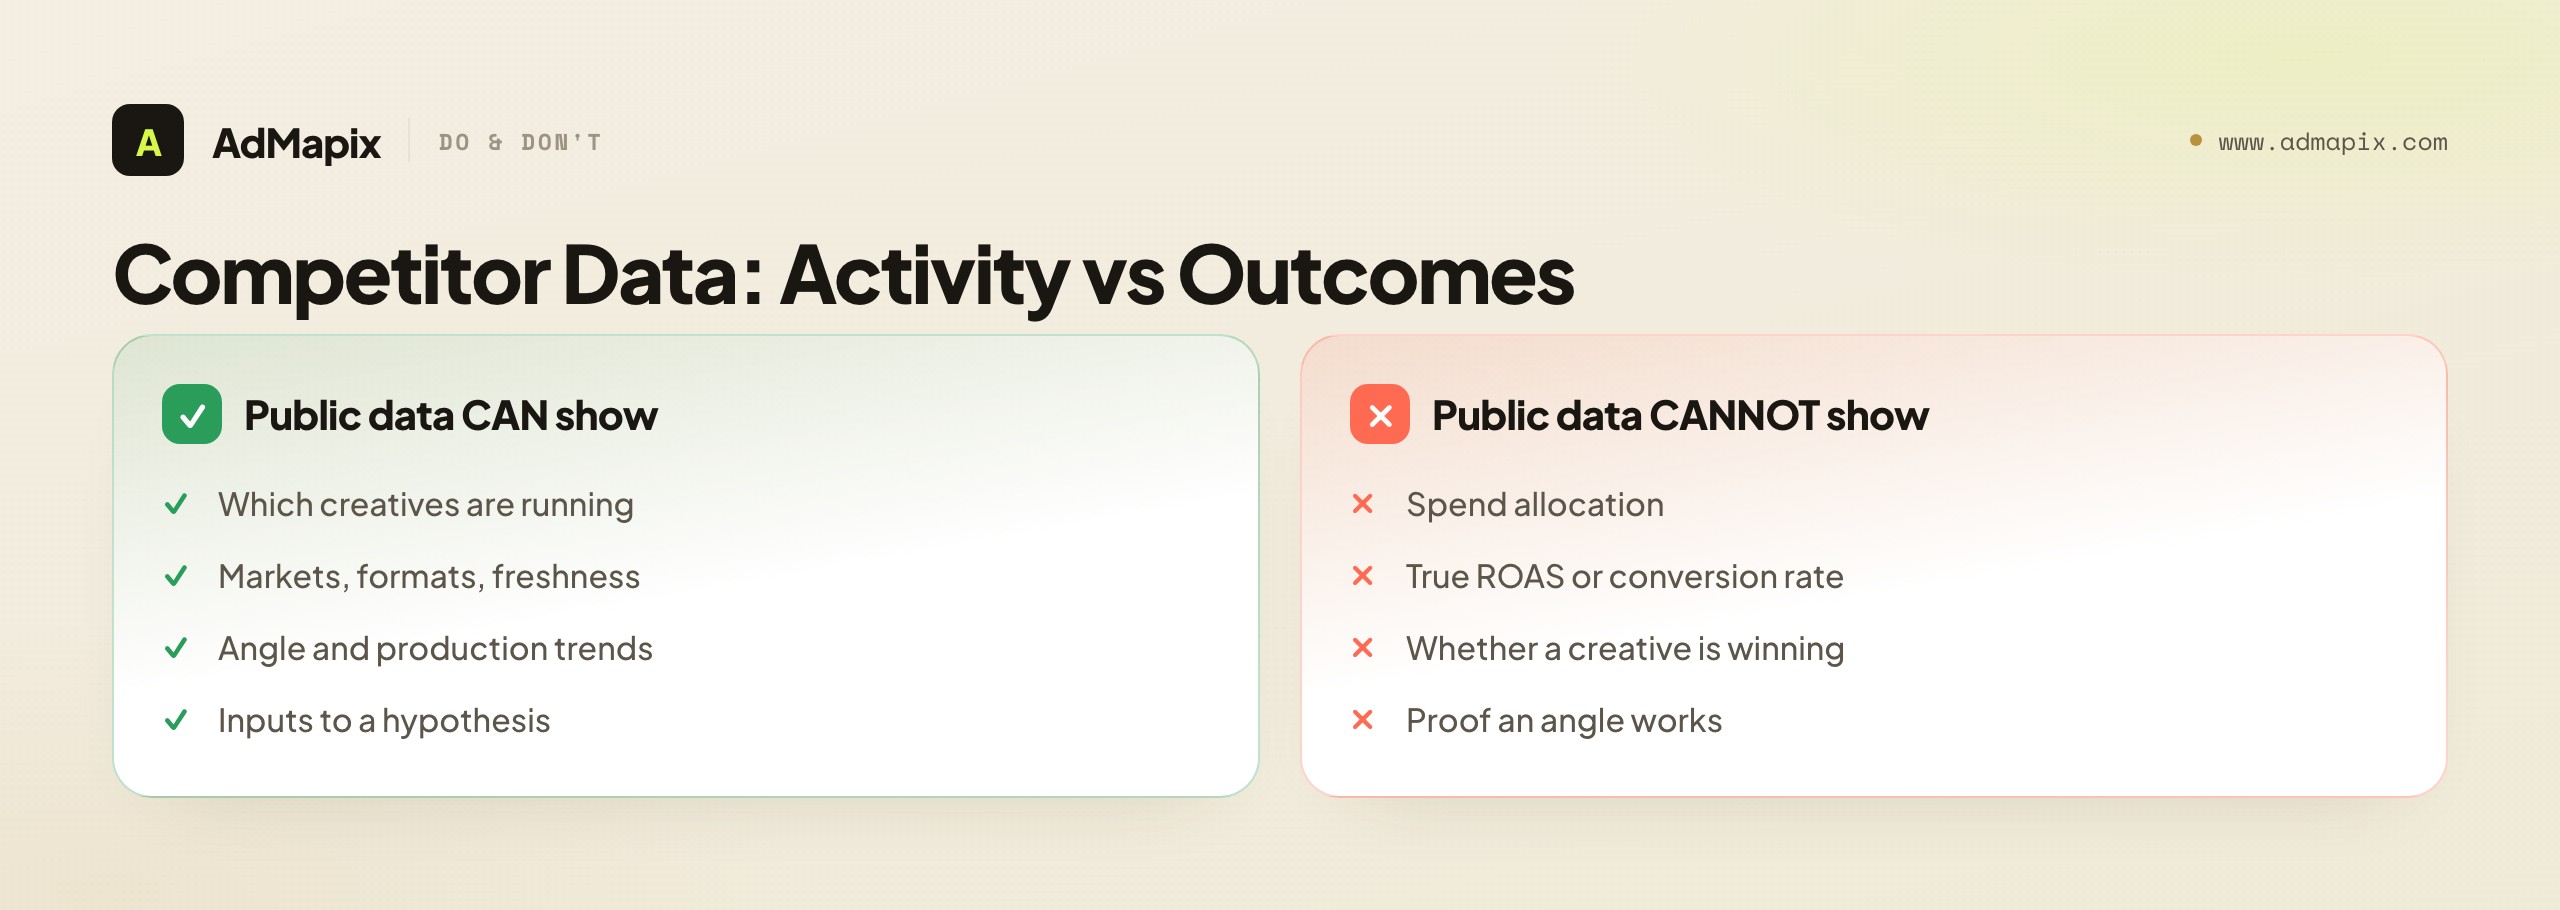
What Public Ad Data Can and Cannot Prove
Competitor intelligence is evidence of activity, not of outcomes. Public ad libraries and creative search tools can show you which ads a competitor is running, in which markets, in which formats, and roughly how fresh they are. That's genuinely useful for spotting angles and production trends — it's the fourth job in the stack.
What public data can't prove is whether those ads are profitable. You can't see a competitor's spend allocation, true ROAS, conversion rate, or whether a heavily-shown creative is winning or just stuck in a test. On the data-trust hierarchy, public competitor data is the lowest grade for outcomes — it's solid evidence of activity but never of results. Treat competitor creatives as inputs to a hypothesis, not as proof that an angle works. The only place you confirm performance is your own account, with your own first-party analytics — the highest grade on the hierarchy. That pairing (low-trust competitor signal generating a hypothesis, high-trust first-party data confirming it) is the correct way to use the two together, and it's how the fourth job connects to the first three.
Common Paid Ads Analytics Mistakes
- Buying an all-in-one suite before naming the weekly decision. Write the decision first, then buy only the layers needed to support it.
- Treating all data as equally trustworthy. A modeled estimate isn't a first-party count, and a public competitor signal isn't proof of outcomes. Grade the data before you act on it.
- Summing platform-reported conversions. Each platform over-claims, so adding them double-counts. Reconcile against first-party truth, don't sum.
- Trusting attribution numbers as exact. Post-privacy, platform conversions are increasingly modeled estimates — read them as directional, not as counts.
- Treating blended ROAS as a creative diagnostic. Segment by channel, creative ID, landing page, and user quality before changing the brief.
- Letting dashboards accumulate metrics nobody acts on. Remove any metric that doesn't change budget, creative, targeting, page, or client communication.
- Asking a reporting connector to invent strategy. Use reporting tools to standardize views; keep strategy in the decision meeting.
- Confusing competitor activity with competitor success. A frequently-shown ad may be a winner or just an active test — it's a hypothesis, not proof.
When to Use AdMapix
AdMapix fits the competitor-context job in the stack, and nothing else. It's for paid media managers, app growth teams, and agency strategists who need to see what competitors are running across networks before they write the next test brief. AdMapix is cross-network ad creative search: you can search ads by network, country, app, format, and time range, save the best examples to Media, break down hooks and pacing with Video Analysis, tag recurring patterns, and roll findings into recurring reports. Compare plans on pricing or log in to start a search.
It's not the tool for measuring your own performance. AdMapix won't track your spend, CPA, ROAS, or post-click quality; that's the job of your native platform reports and your measurement layer. On the data-trust hierarchy, AdMapix provides high-confidence evidence of competitor activity (what's running, where, how fresh) and explicitly not competitor outcomes (spend, ROAS — which are private and unobservable). Use AdMapix to answer "what's changing in the market?" and keep your owned-data tools for "what happened in our account?" — the two jobs the stack needs but no single tool covers.
FAQ
What are paid ads analytics tools?
Paid ads analytics tools are the systems that measure and report on paid media. In practice they split into four jobs: native platform reports for owned performance, a measurement layer (MMP, product analytics, or CRM) for reconciled post-click value, reporting connectors for client-ready views, and competitor creative intelligence for market context. A complete stack picks one tool per job rather than one suite for all four.
Do I need a separate tool for each job?
Usually yes, because the jobs answer different questions and have different owners of truth. Native reports describe your account's delivery and cost, the measurement layer reconciles conversion value across channels, reporting connectors package it for stakeholders, and creative intelligence describes the market. One tool that claims to do all four typically does the easiest job well and the rest poorly. Start with the decision you need to support and buy only the layers that support it.
Which metrics belong in a weekly paid ads review?
Only metrics that can change an action: budget, creative, targeting, landing page, or client communication. That usually means spend and delivery, CPA or CPI, ROAS or an LTV signal, CTR, per-creative performance, plus a competitor-freshness check. Drop vanity metrics that look interesting but never trigger a decision — impressions for their own sake, engagement metrics nobody acts on.
How much should I trust platform-reported conversions?
Treat them as directional estimates, not exact counts. After the privacy changes of recent years, platforms increasingly model conversions — statistically estimating the ones they can't directly observe — and each platform tends to over-claim its own contribution. The number looks precise but rests on degraded signal. Reconcile platform reports against first-party data or a neutral measurement layer rather than trusting any single platform's count at face value.
What's the data-trust hierarchy in paid ads analytics?
From most to least reliable: first-party server-confirmed data (ground truth), first-party client-side data (reliable but subject to blocking), platform-reported and modeled data (directional, often over-claimed), third-party modeled estimates (useful for ranking, not precise), and public competitor signals (evidence of activity, never of outcomes). Label every number feeding a decision with its grade and weight the decision to match — a decision built on ground truth is solid; the same decision built on a modeled estimate is a hypothesis.
Why do my platform conversion numbers not add up to my actual sales?
Because each platform models and claims its own contribution, so summing their reported conversions double-counts — multiple platforms claim credit for the same conversion. The reported numbers are also increasingly modeled estimates rather than counts. The fix is to anchor on your own first-party data (orders, signups in your own systems) and reconcile the channels against it through a neutral measurement layer, rather than adding up what each platform self-reports.
How does AdMapix fit into a paid ads analytics stack?
AdMapix covers the competitor-context layer only. Teams use it to search competitor creatives across networks by country, app, format, and time range, save examples, run video analysis, tag patterns, and generate reports. It feeds the creative-brief stage of your weekly review with market context the other three layers can't see; it doesn't replace your own performance analytics, and on the data-trust hierarchy it provides evidence of competitor activity, never of competitor outcomes.
Can competitor ad data tell me what's working for a rival?
No. Public ad data shows which creatives a competitor is running, where, and how fresh they are, but not their spend, ROAS, or conversion rate. A frequently-shown ad may be a winner or just an active test. It's the lowest-trust grade for outcomes — treat competitor creatives as inputs to a hypothesis you confirm in your own account, never as proof of profitability.
How do I handle cross-channel measurement?
Don't sum platform reports — reconcile them. Anchor on your own first-party data as the source of truth, use a neutral measurement layer (an MMP for apps, a BI tool with a clean attribution model for web) to reconcile conversions across channels, and normalize the conversion definitions and attribution windows before comparing. Cross-channel measurement is a reconciliation problem, not an addition problem, and treating it as addition is the most common source of "which number is right?" arguments.
What's the biggest mistake teams make with paid ads analytics?
Treating all data as equally trustworthy — acting on a modeled estimate or a public competitor signal as confidently as on first-party ground truth. The math is rarely the problem; the misplaced confidence is. A stack that grades its data and weights decisions to match its evidence makes fewer, better decisions than a sprawling stack that produces a hundred equally-trusted numbers nobody can reconcile.
Related Reading
- Ad Creative Fatigue Analysis: Signals, Thresholds & Refresh Decisions — diagnosing why a creative's metrics dropped, using the signals this stack surfaces.
- Creative Testing Framework: Systematically Test & Rank Creatives — turning analytics into the next test.
- Ad Budget Optimization Framework — how the metrics here feed budget allocation decisions.
- Marketing Intelligence Tools: The 2026 Stack — the broader competitive-intelligence tool landscape.
- Ad Spend Tracking: Methods and Limits — what spend data you can and can't trust.
- Best Ad Spy Tools in 2026 — the competitor-intelligence layer's tool options.
Sources
- Google Ads official site — the official platform for spend, delivery, and creative reporting.
- Meta Ad Library help — official guidance on what the public ad library does and does not show.
- Meta Ads Manager — Meta's native reporting surface for owned campaign performance.
- Google Analytics 4 — the product-analytics layer for post-click value measurement.
Sources verified as of June 21, 2026. Platform features and reporting change — verify each URL before relying on specifics. AdMapix data scope is limited to the ad creatives it indexes across networks, which is evidence of advertiser activity, not of competitor performance or spend.
See what competitors are really running
Search 6M+ ad creatives, landing pages, and weekly spend across 200+ countries. No credit card, no commitment.
Related Articles
Ad Hook Examples in 2026: 7 First-3-Second Patterns (with UGC Breakdowns)
A complete 2026 library of ad hook examples organized into seven repeatable patterns — problem, proof, objection, comparison, curiosity, offer, and transformation — with UGC hook breakdowns, platform-by-platform differences for TikTok, Meta, and YouTube, an industry-by-industry hook map, a hook-testing workflow that ships variants, the metrics that actually grade a hook, and a worked teardown that turns a competitor opener into a running test.

Meta Ads API Alternative in 2026: Ad Library API, Marketing API, or a Creative Layer?
A 2026 guide to choosing a Meta ads API alternative — what the Ad Library API, Marketing API, and Graph Ads Archive each actually expose and where they stop, how a creative-intelligence layer fills the saved-media, video-breakdown, and reporting gap, exactly what public Meta data can and cannot prove (creative yes; spend, targeting, and ROAS no), and a decision framework matched to the job you are doing.
Outbrain Ad Spy Tool in 2026: Native Ad Research for the Open Web
How to research Outbrain native ads from public evidence in 2026 — what a spy tool can and cannot prove, how to decode headline-and-thumbnail hooks, advertorial landing paths, retargeting trails, and how to turn patterns into testable native campaigns.