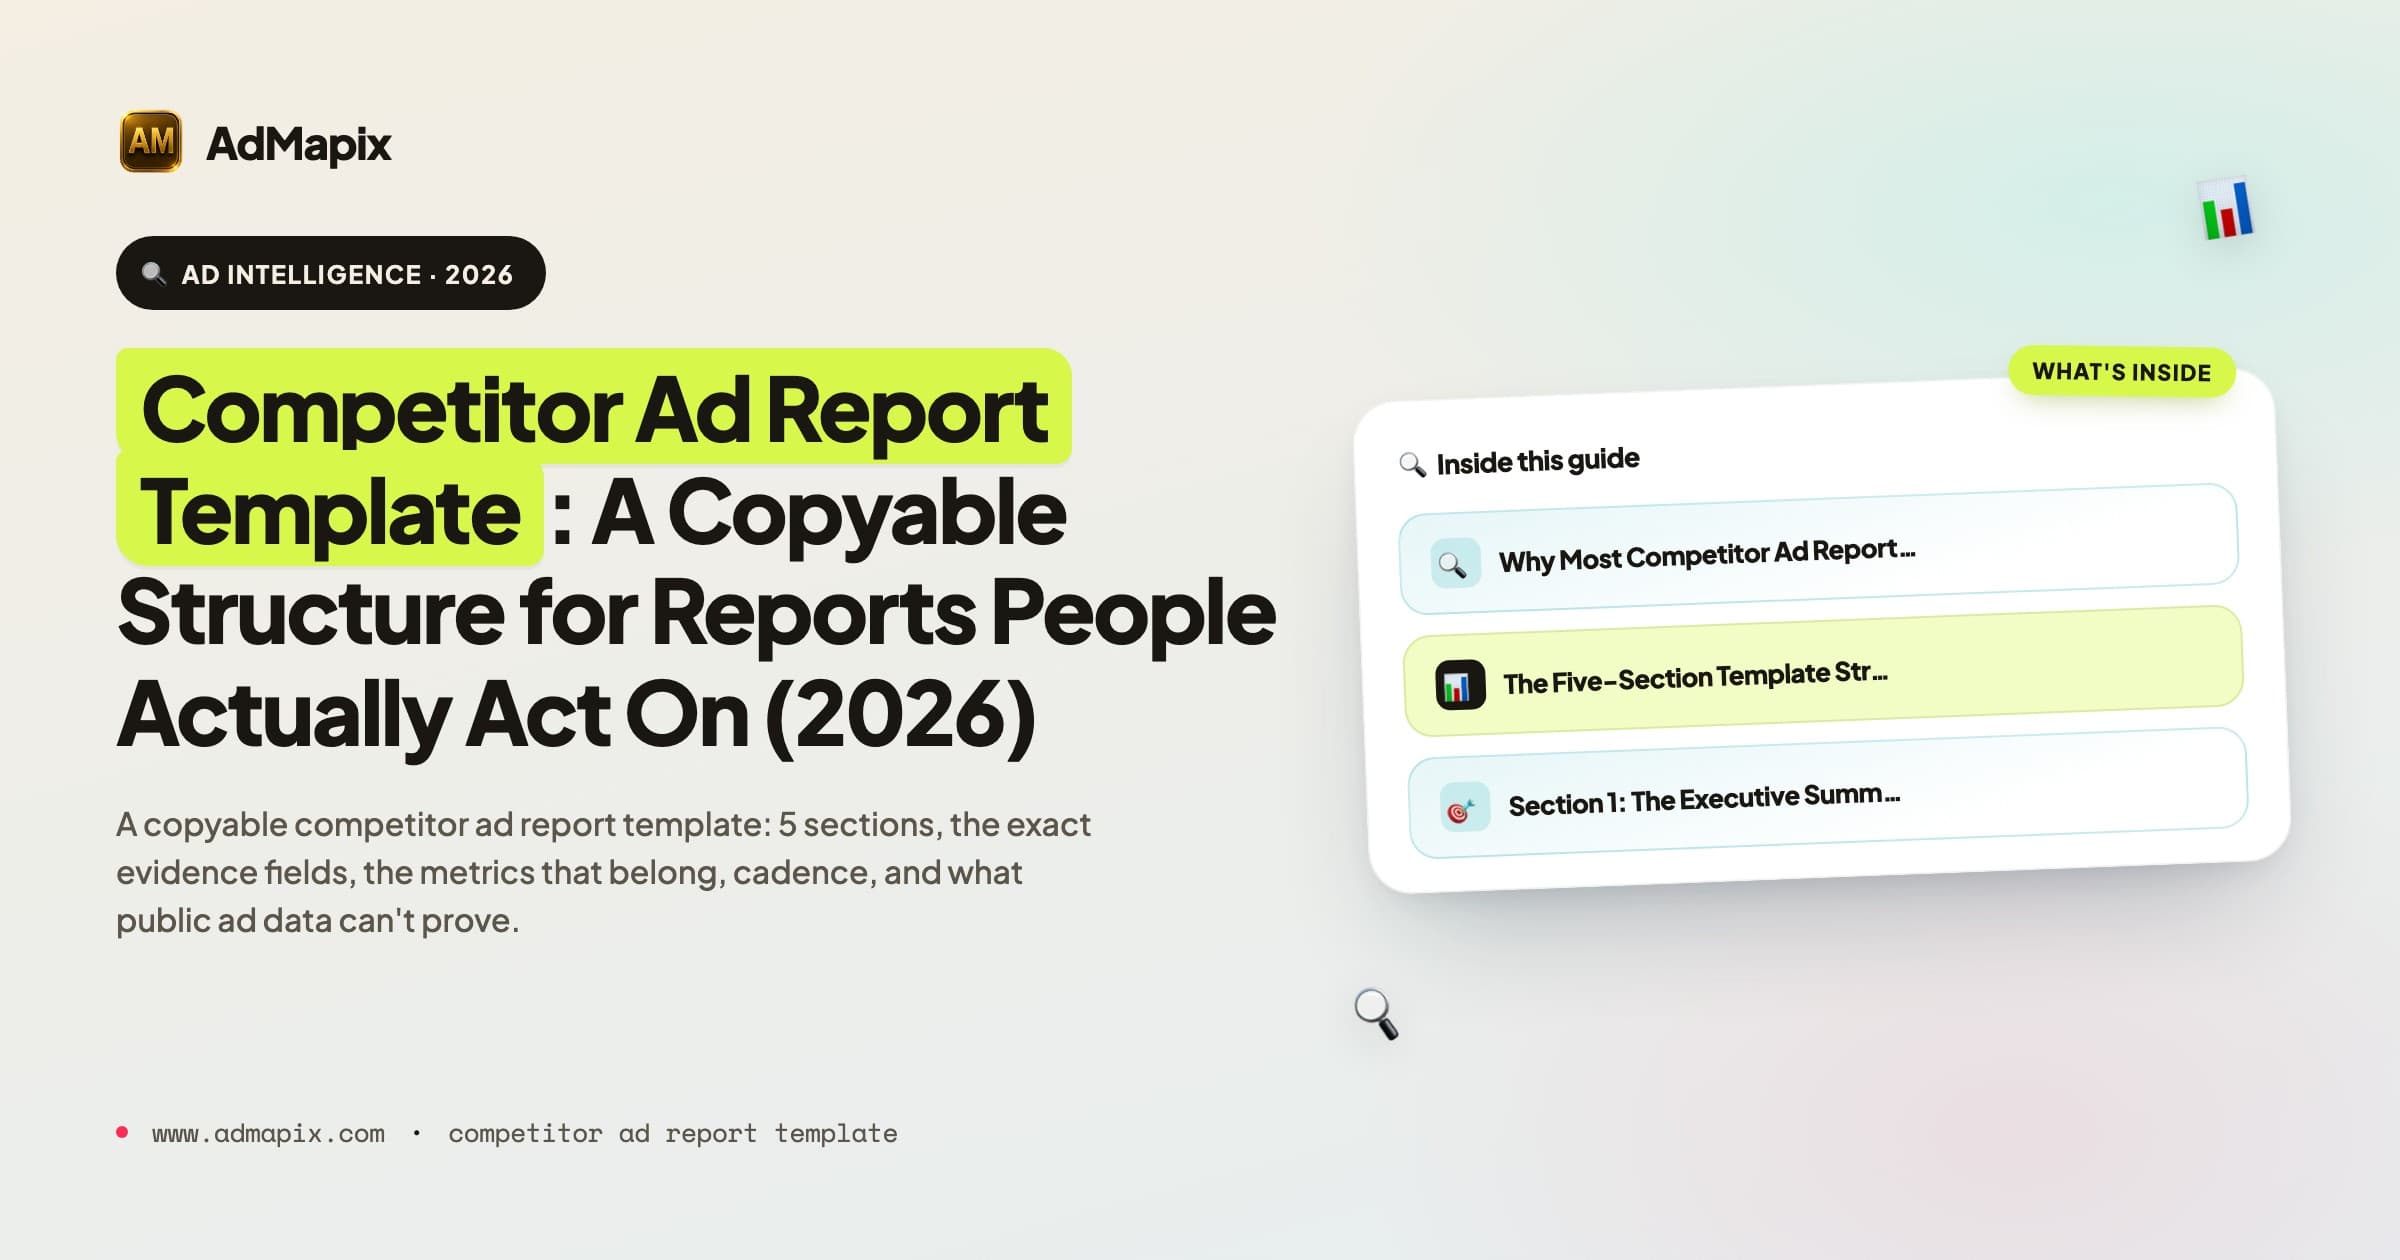
Competitor Ad Report Template: A Copyable Structure for Reports People Actually Act On (2026)
A complete, copyable competitor ad report template for agencies, growth teams, and founders. The five sections every report needs — executive summary, evidence table, creative teardown, public-data caveats, and next tests — plus the exact fields each evidence row must carry, the metrics that belong in the report, the cadence to run it on, and an honest line on what public ad data can and cannot prove. Built to turn screenshot dumps into decisions: scale, refresh, test, or monitor.
Competitor Ad Report Template: A Copyable Structure for Reports People Actually Act On (2026)
Updated June 21, 2026 — written and reviewed by the AdMapix Research team.
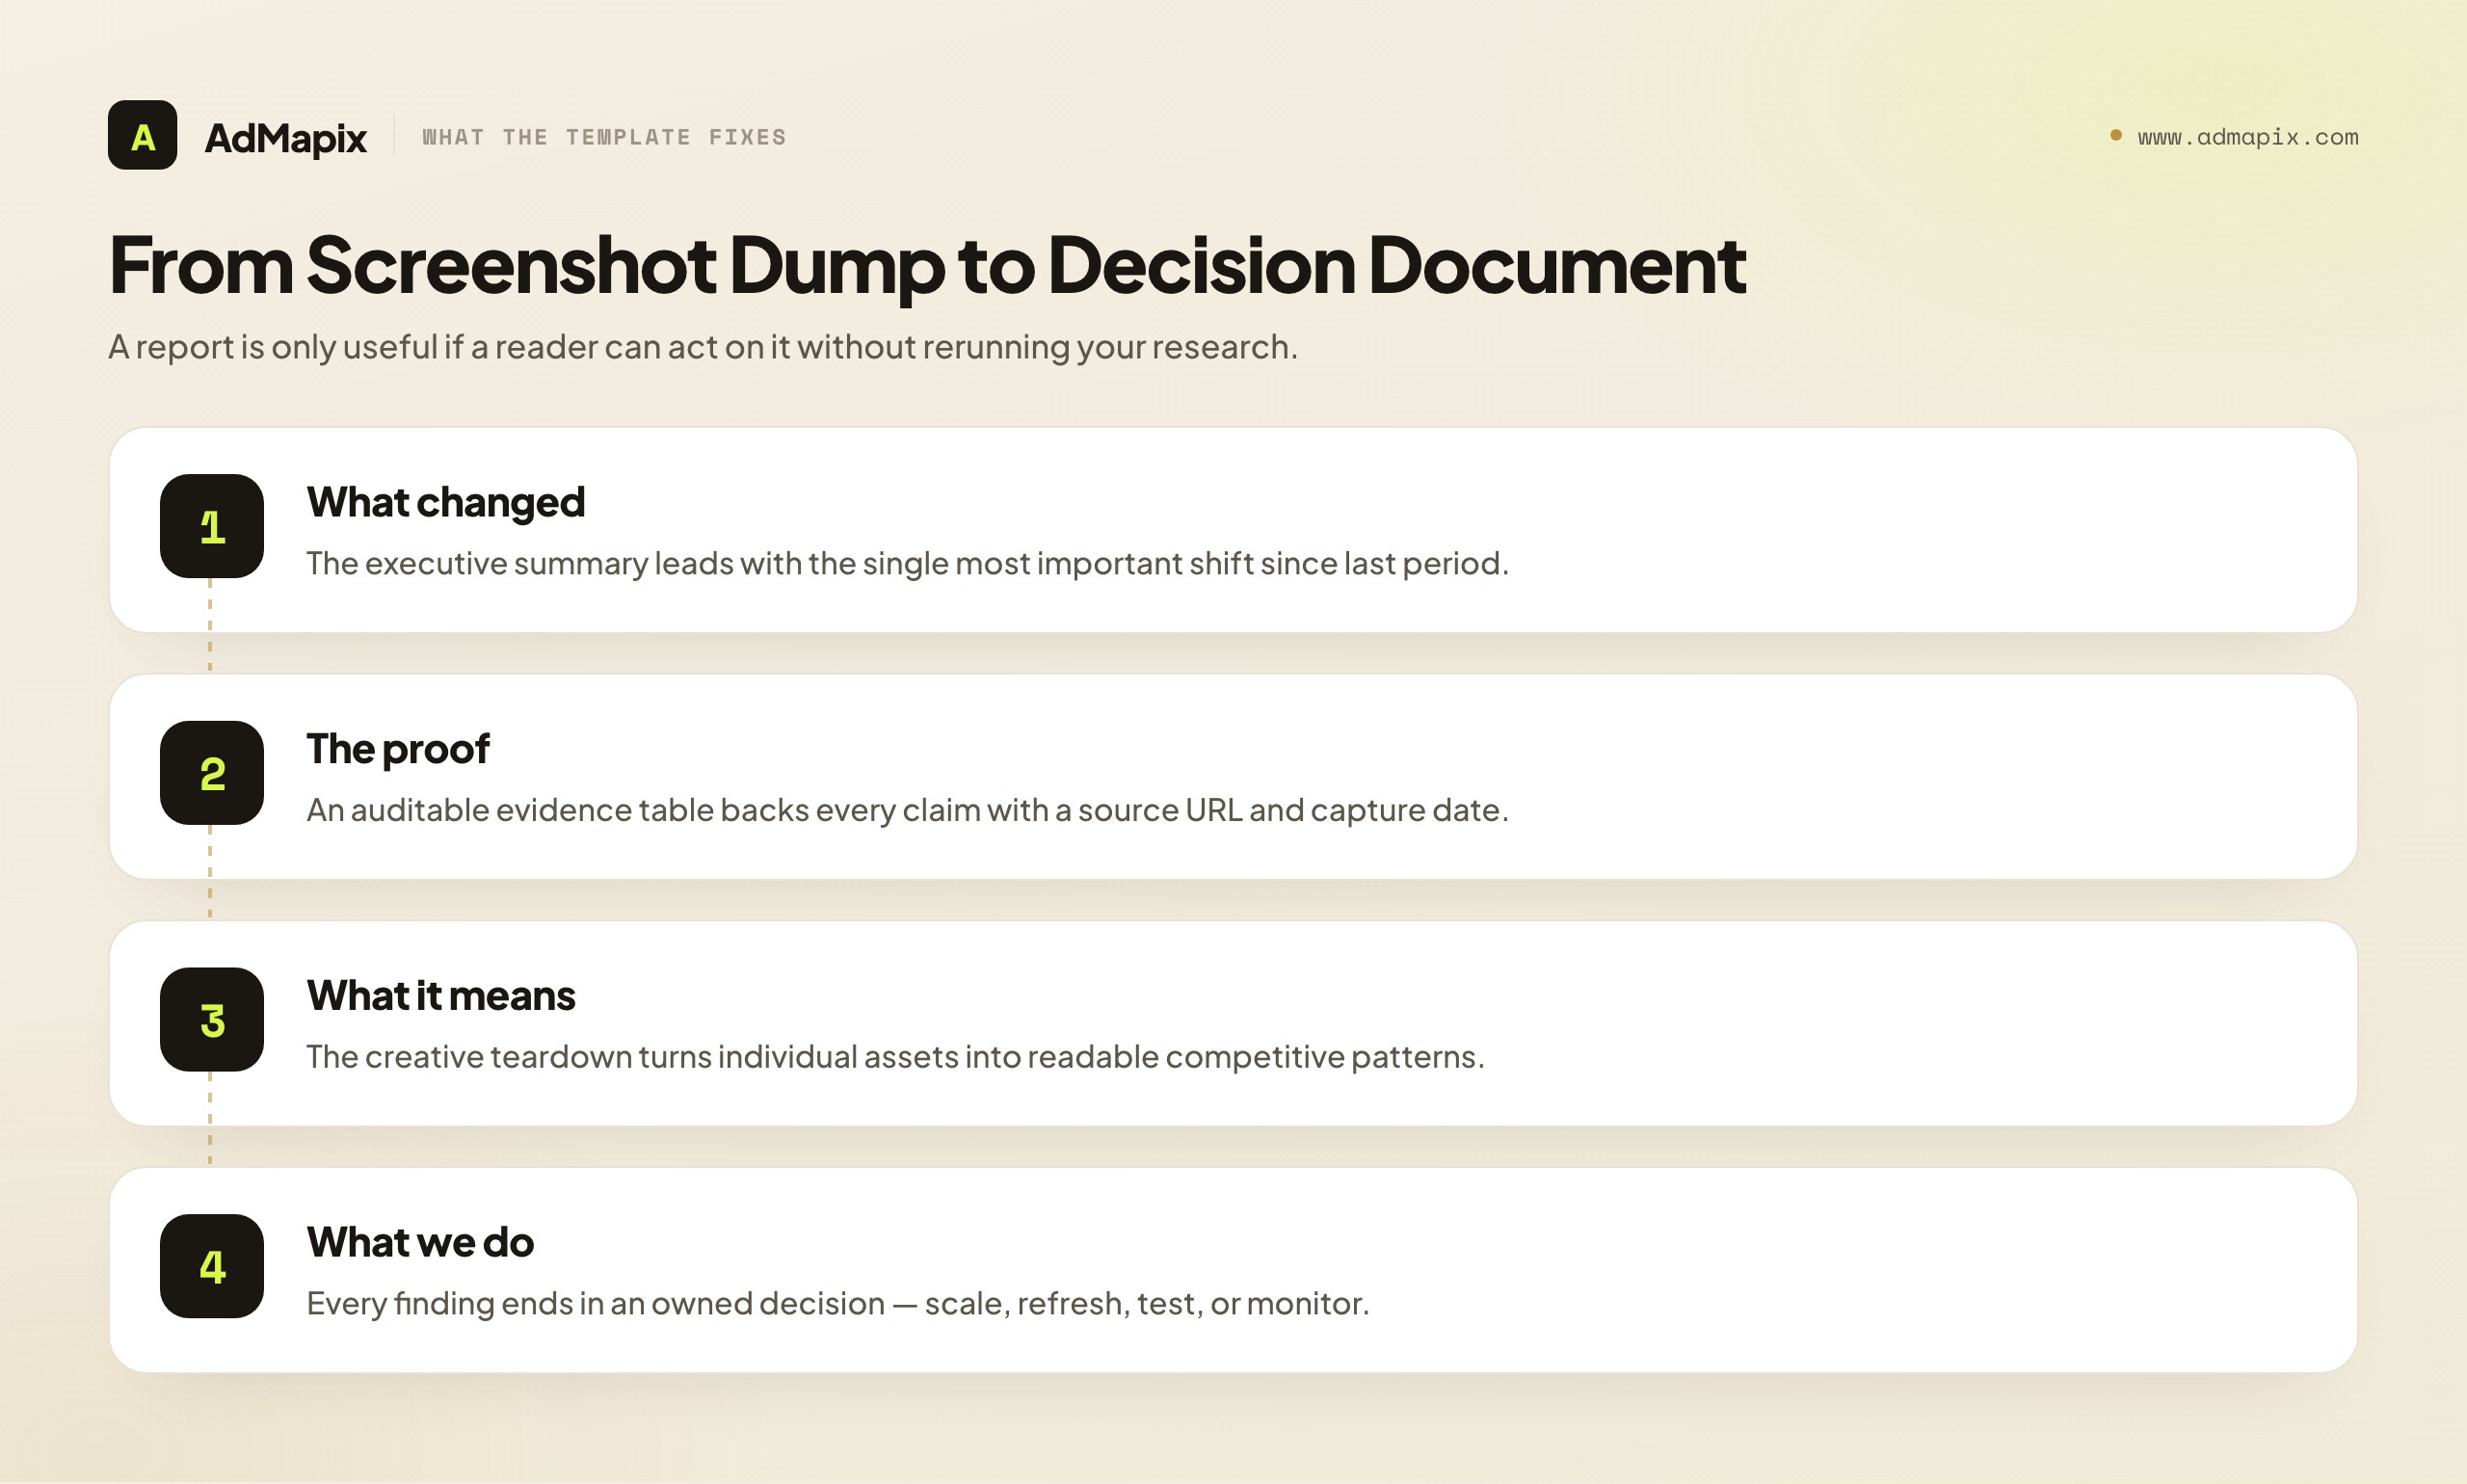
A competitor ad report template is only worth using if the report it produces gets acted on without anyone rerunning the research. That is a high bar, and most competitor ad "reports" miss it badly — they are screenshot dumps that someone assembled once, presented once, and nobody opened again. The difference between a screenshot dump and a report people act on is structural: every claim ships with a source URL, a capture date, and the actual creative behind it; every finding ends with a decision (scale, refresh, test, or monitor); and the whole thing is honest about what public ad data can and cannot prove. This guide gives you that structure — a copyable, five-section template with the exact fields each part needs — so your next competitor ad report is a decision document, not a slide graveyard.
This is for agencies producing competitive intelligence for clients, in-house growth and creative teams, founders doing their own research, and strategists who are tired of building reports nobody reads twice. It is the deliverable companion to our method content: where the competitor ad analysis framework teaches the analysis and the advertising intelligence guide covers the broader practice, this article hands you the literal shape of the output. We will walk the five sections in order, specify every field, list the metrics that belong (and the ones that do not), set a cadence, and — as always on this blog — draw a hard line between what public creative evidence proves and what it cannot.
TL;DR — The Competitor Ad Report Template in One Screen
- A strong report has exactly five sections, in this order: executive summary, evidence table, creative teardown, public-data caveats, and next tests. Each has a distinct job; together they take a reader from "what changed" to "what we do about it" in one pass.
- The executive summary is written last and read first. Three lines: the change you observed, why it matters to the business, and the single highest-priority action. A stakeholder who reads only this block should still know the right next step.
- Every evidence row carries the same fields: competitor, source URL, capture date, format, the actual creative asset, the offer, the landing path, and a one-line note. A screenshot alone is never an evidence row — without the source and date, no one can verify or re-find it.
- The creative teardown turns assets into patterns: hook, proof, CTA, visual style, core message, and audience assumption. This is where individual ads become a readable strategy.
- The caveats section protects the reader from over-reading. State plainly that public ad data proves what ran, where, and roughly when — never spend, ROAS, conversion rate, or impression-level targeting.
- Every finding ends in a decision, with an owner: scale, refresh, test, or monitor. A report that observes but never decides is overhead. The decisions are the product.
- Run it on a cadence (monthly is the default), because the value is in the deltas. A standing report that tracks change beats a one-off audit. AdMapix can supply and organize the creative evidence and produce the recurring report — but it cannot, and does not, fabricate spend or performance data the platforms never publish.
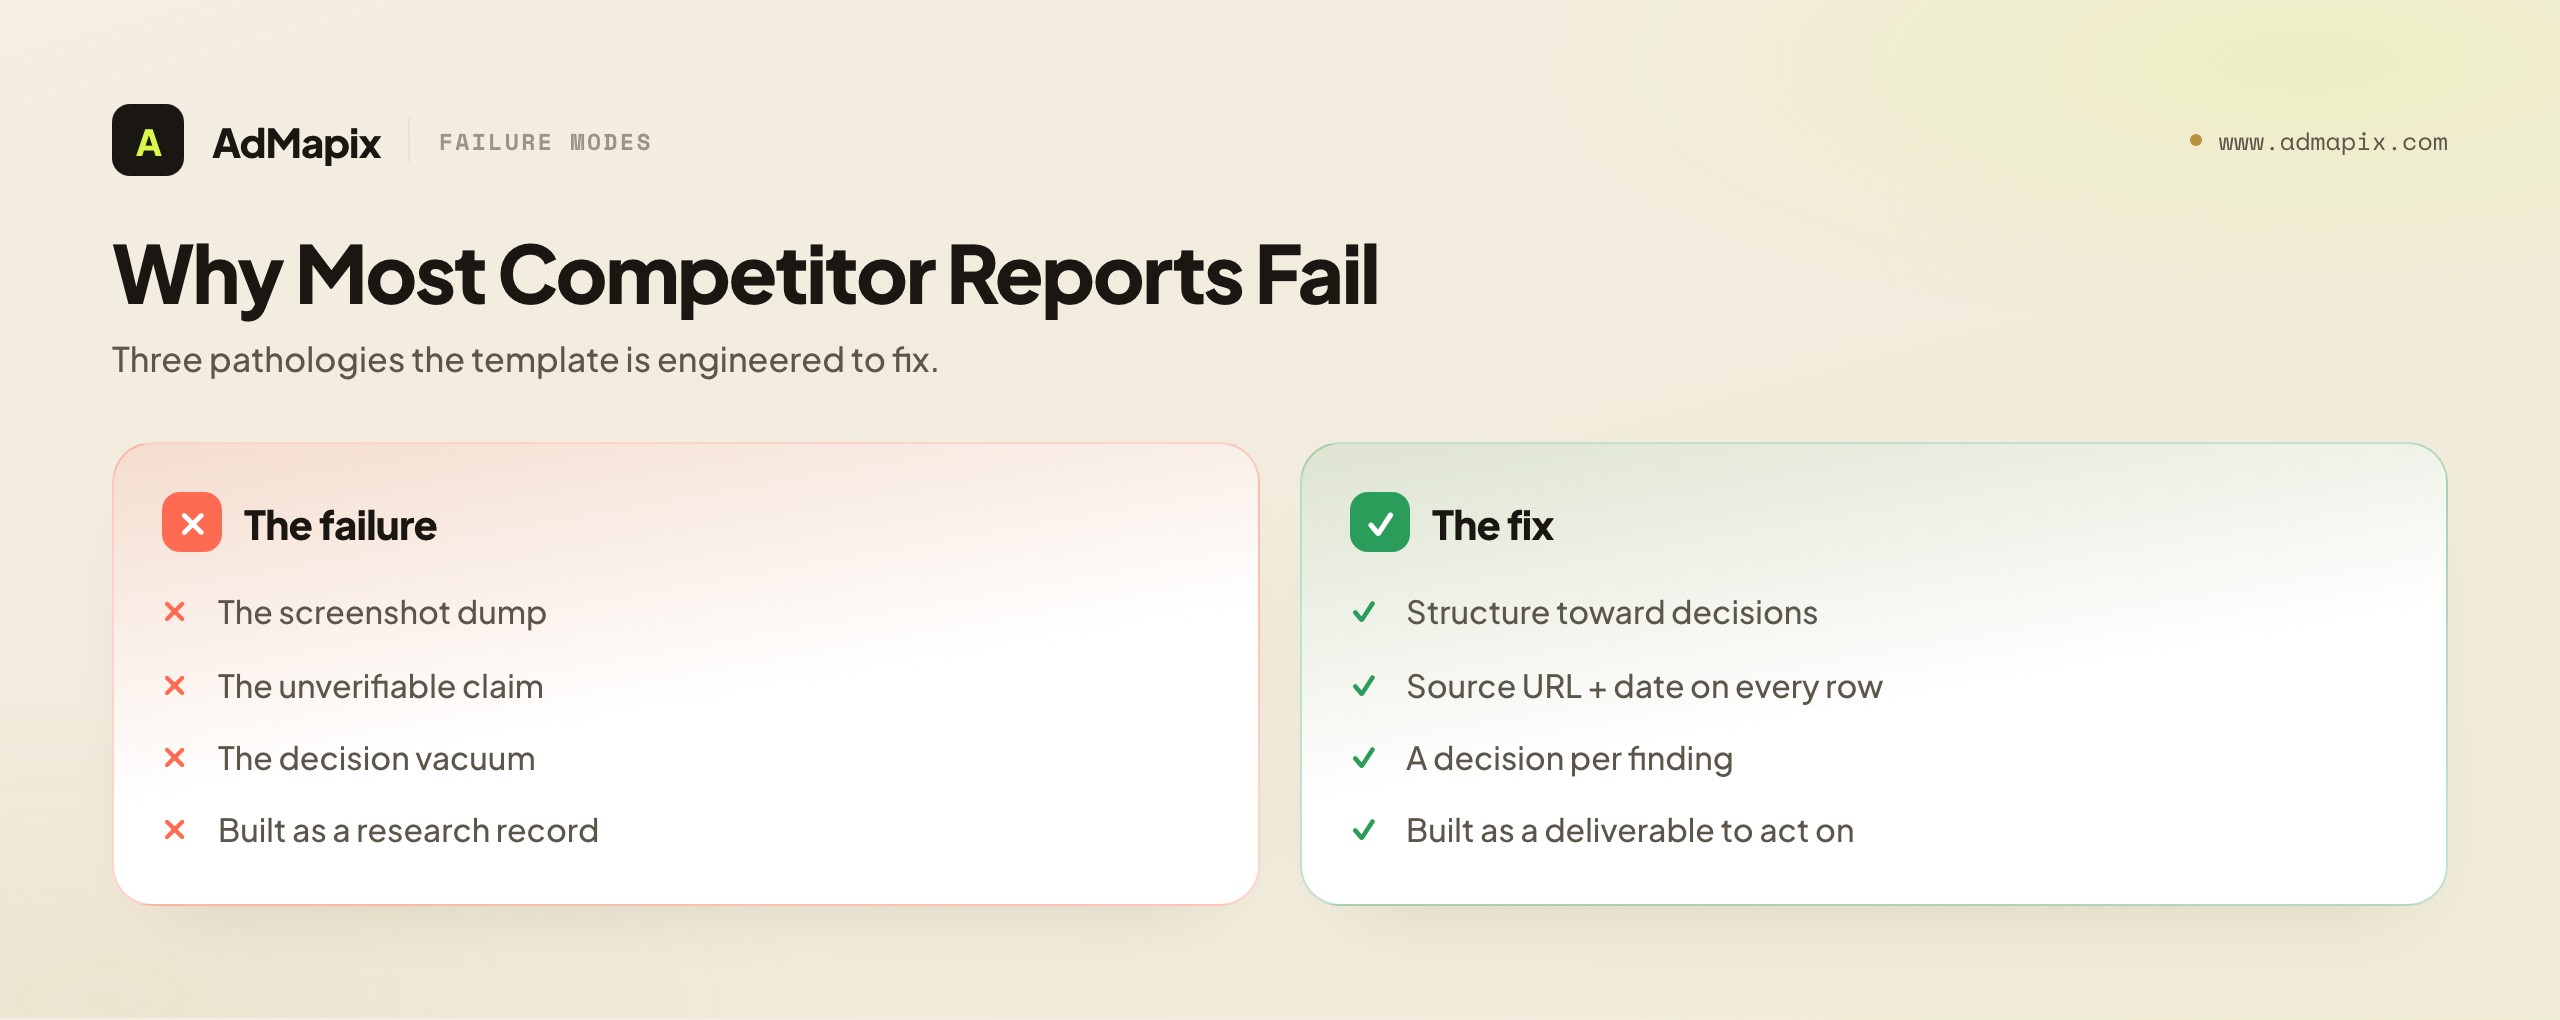
Why Most Competitor Ad Reports Fail
Before the template, it helps to name why the default competitor report fails, because the template is engineered specifically to fix those failures. Three pathologies recur, and a report that avoids all three is already ahead of most.
The screenshot dump. The most common failure: a deck of competitor ad screenshots with light captions, presented once and never reopened. It fails because it has no structure a reader can act on — no decisions, no priorities, no way to verify anything, no thread connecting the images. It feels like work was done (look at all these ads!) while delivering nothing a decision-maker can use. The fix is the whole template: structure that forces every observation toward a decision.
The unverifiable claim. Reports that assert things — "Competitor X is going hard on video," "they've shifted to a discount strategy" — without the evidence attached to verify or re-find them. The reader has to trust the analyst's memory, and three months later nobody can reconstruct what was actually seen. The fix is the evidence table with its mandatory source URL and capture date: every claim traces to a re-openable source.
The decision vacuum. Reports rich in observation that end with no recommendation, leaving the reader to ask "so what do we do?" — a question the report should have answered. Observation without decision is the analyst abdicating the hard part. The fix is the next-tests section, where every finding is mapped to a specific action with an owner.
Underlying all three is a missing discipline: treating the report as a deliverable for a reader who will act, not as a record of research the analyst performed. The template inverts the default. Instead of "here is what I looked at," it produces "here is what changed, here is the proof, here is what it means, here is what we cannot know, and here is what we will do about it." Build to that inversion and your reports stop being graveyards and start being instruments.
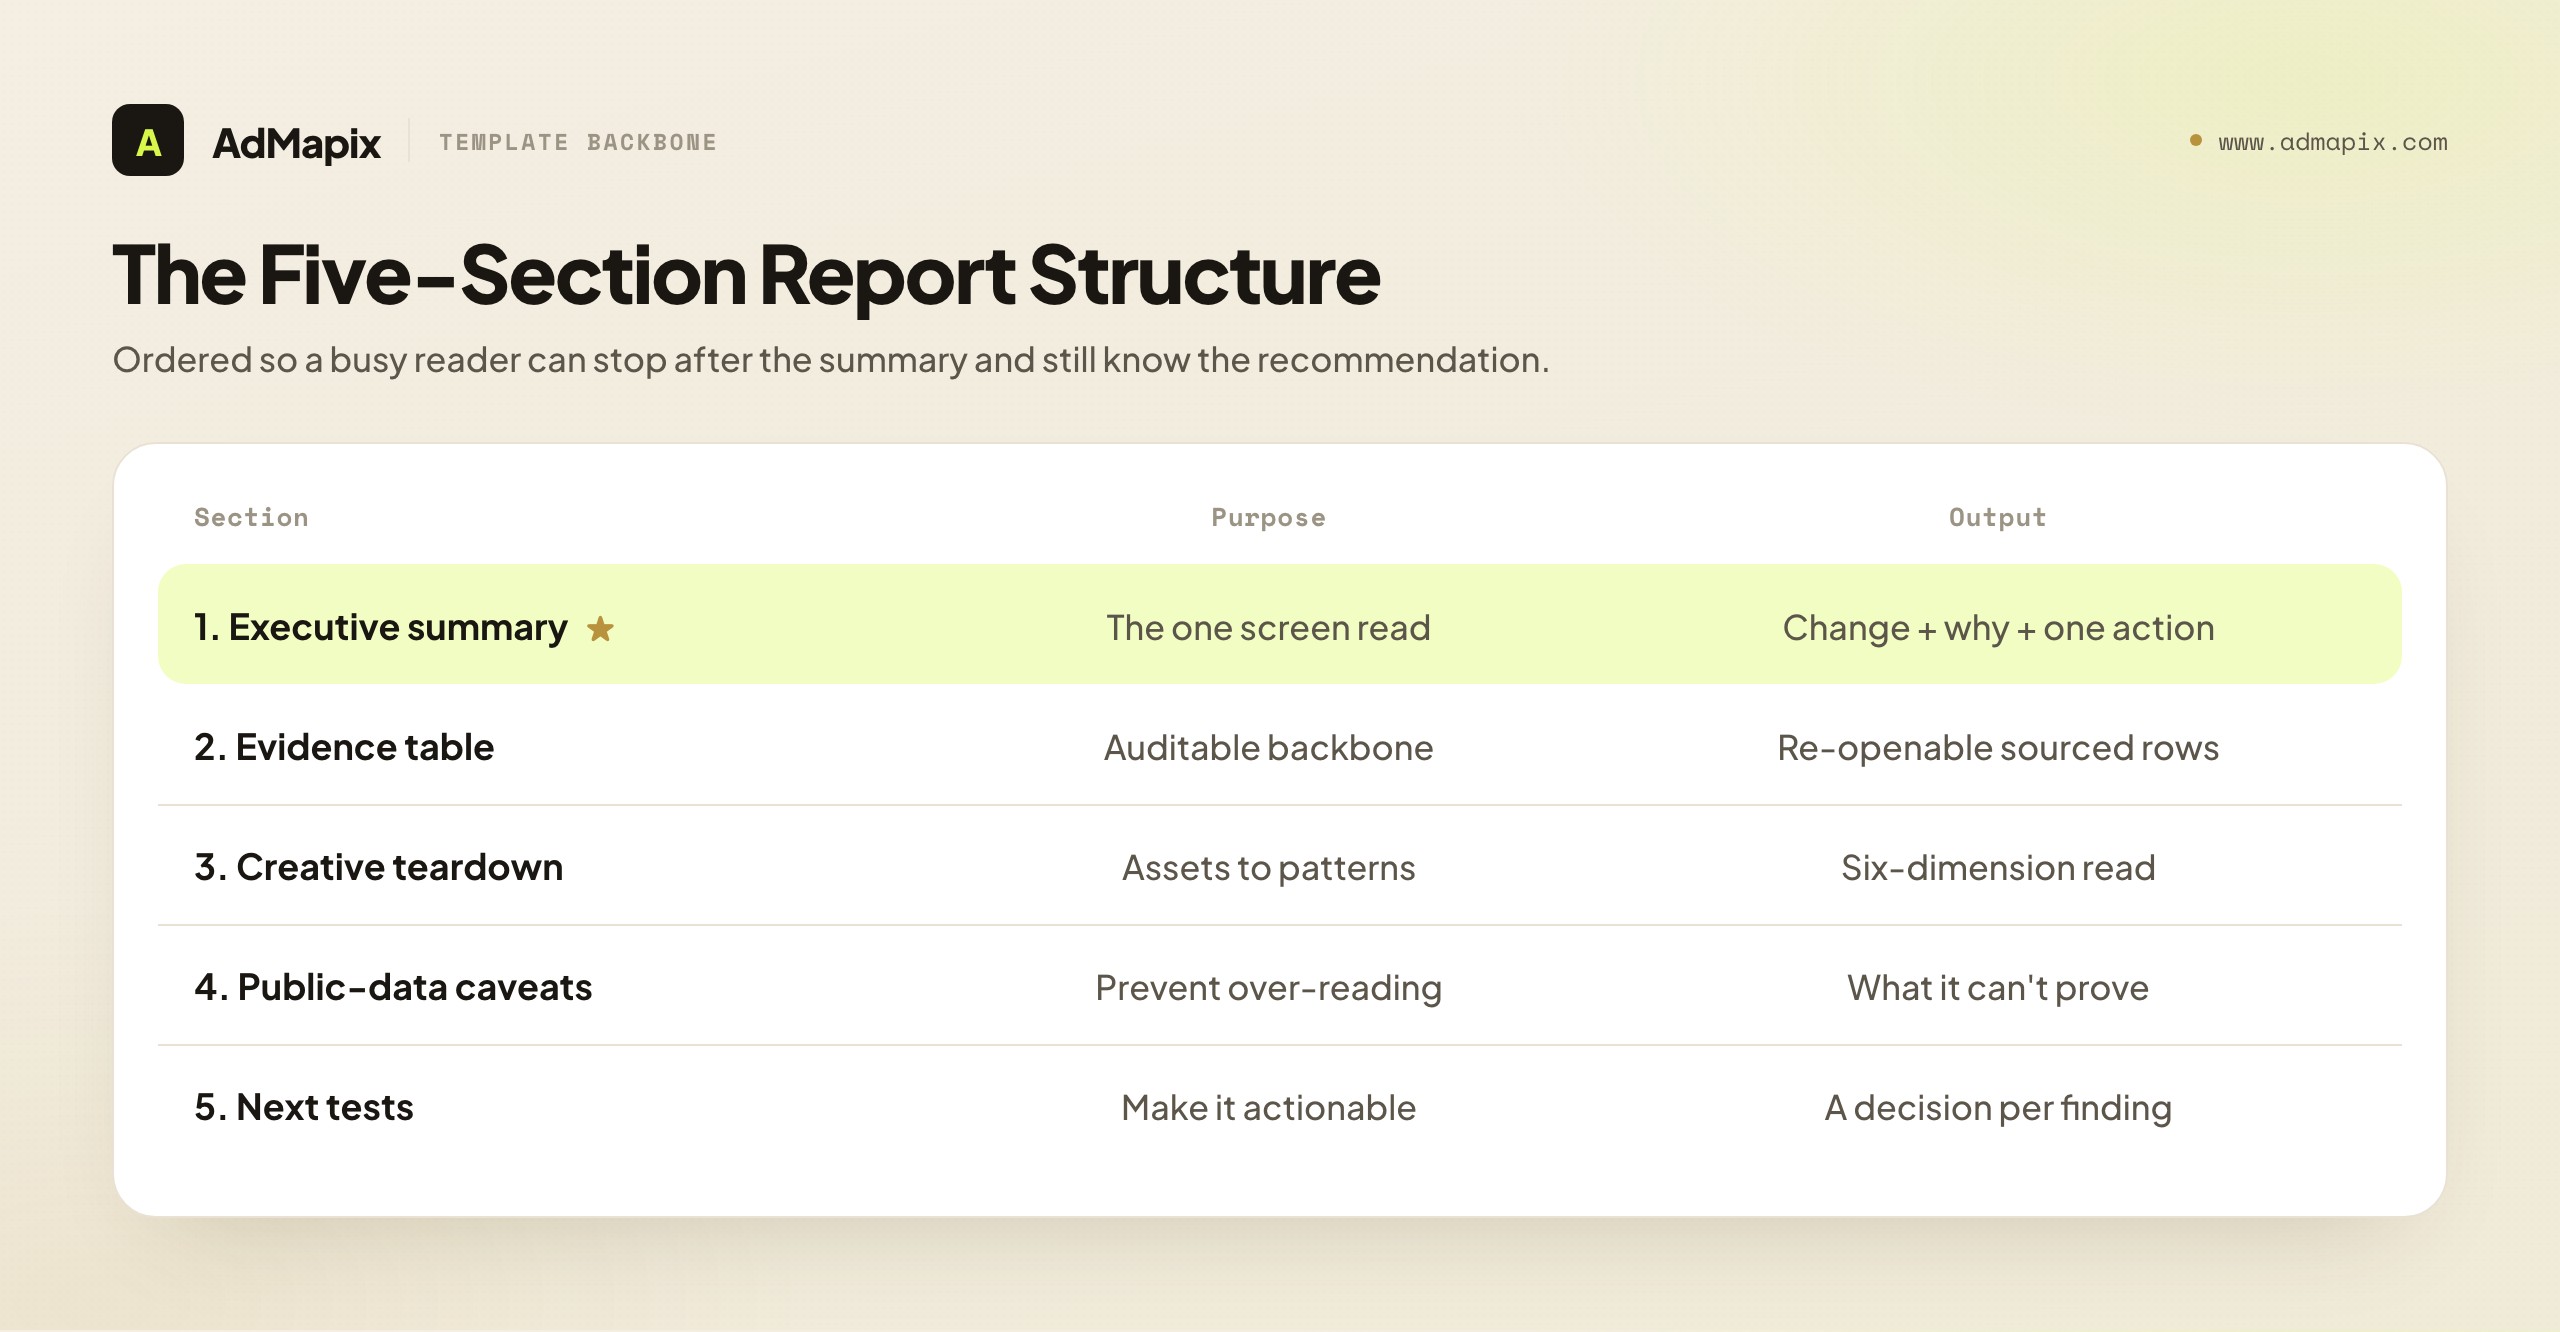
The Five-Section Template Structure
Here is the copyable backbone. A competitor ad report should move from "what changed" to "what we do about it" in a single pass, and the sections are ordered so a busy reader can stop after the summary and still walk away with the recommendation. Use these five sections, in this exact order.
| Section | Purpose | What goes in it |
|---|---|---|
| 1. Executive summary | The one screen a stakeholder reads | What changed, why it matters, the single recommended action |
| 2. Evidence table | The auditable backbone | Competitor, source URL, capture date, format, asset, offer, landing path, note |
| 3. Creative teardown | Turn assets into patterns | Hook, proof, CTA, visual style, core message, audience assumption |
| 4. Public-data caveats | Protect the reader from over-reading | What the evidence does NOT show — spend, targeting, results |
| 5. Next tests | Make it actionable | Each finding mapped to a test (or monitor), with an owner |
The order is deliberate and load-bearing. Summary first, because the most important reader is the busiest and may read nothing else. Evidence second, because the summary's claims must be immediately backable. Teardown third, because once the evidence exists, the patterns can be drawn from it. Caveats fourth, positioned to catch over-reading before the reader reaches the recommendations. Tests last, because they are the destination — everything before them exists to justify them. Reorder these and you break the logic; keep them and the report reads itself into a decision.
A note on length and tooling: this template works as a shared doc, a spreadsheet (the evidence table especially wants to live in a sheet), a slide deck, or a tool-generated report. The structure matters more than the medium. The one rule across media is that the evidence table must remain auditable — every row re-openable from its source URL — because that auditability is what separates this report from a screenshot dump regardless of format.
Section 1: The Executive Summary
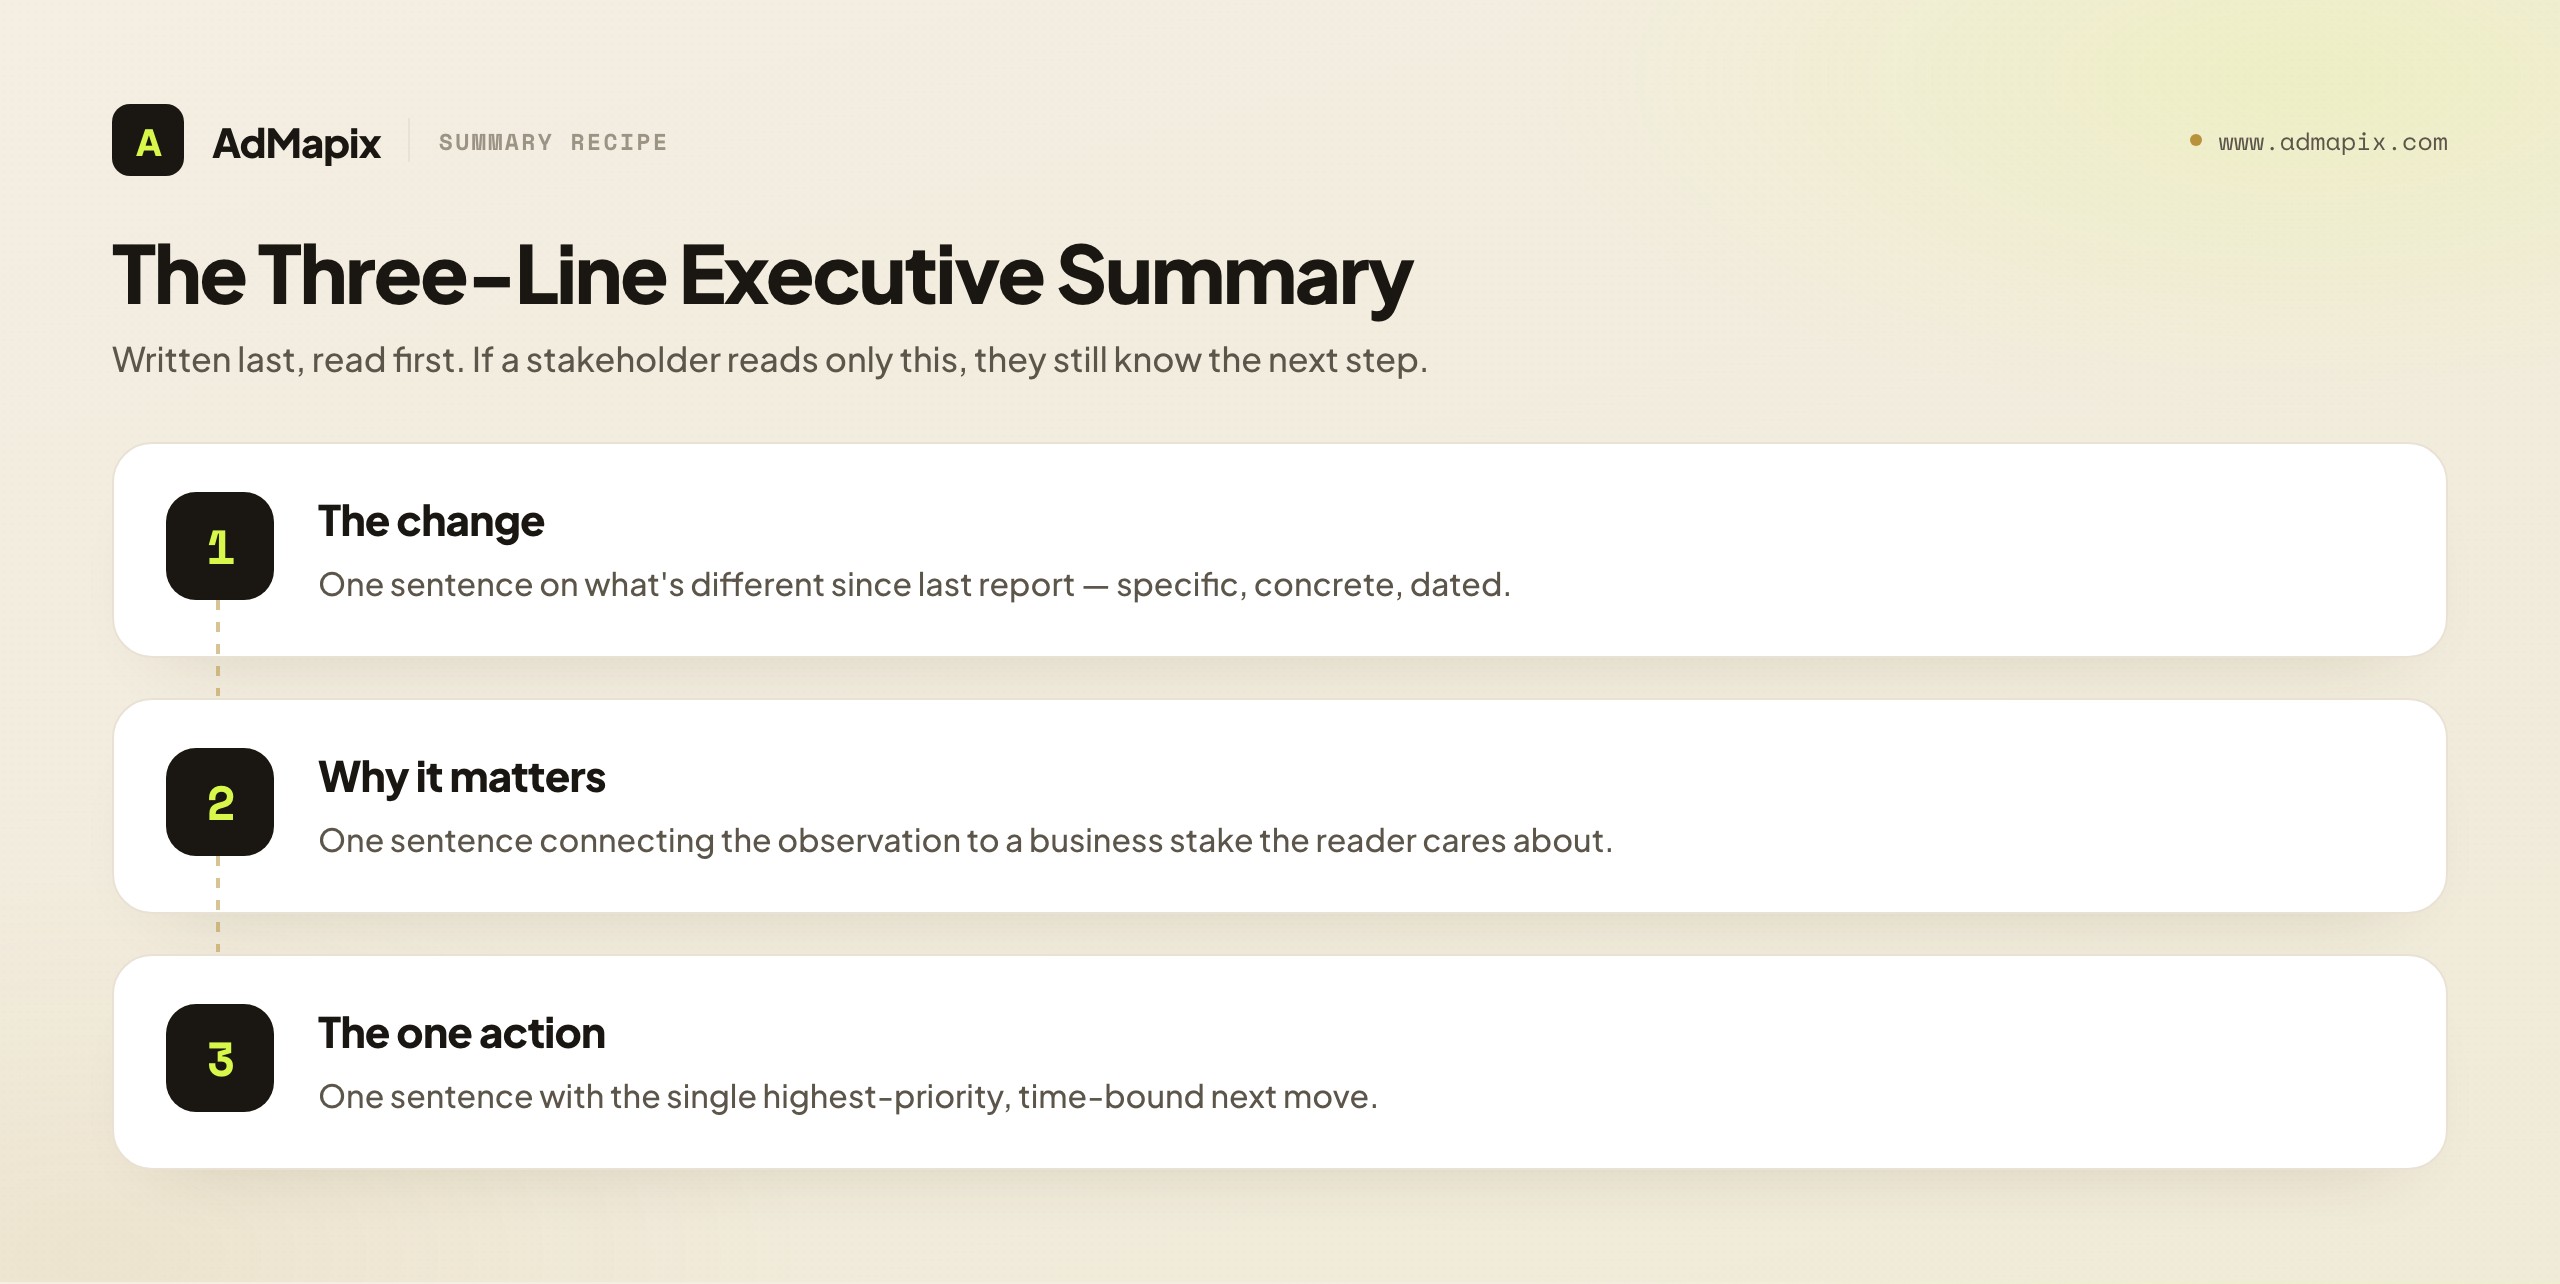
The executive summary is the section written last and read first, and getting it right matters more than any other part because it is the only part many stakeholders will read. Its job is to deliver, in three lines or less, everything a decision-maker needs to act.
Structure it as exactly three beats:
- The change you observed. One sentence on what is different since the last report (or what you found, if this is the first). "Two of our four tracked competitors launched video ads leading with an ROI-calculator offer this month." Specific, concrete, dated.
- Why it matters to the business. One sentence connecting the observation to a stake the reader cares about. "This is the first time the category has moved off demo-request offers toward a self-serve calculator wedge — a shift in how the market is trying to convert." Translate the observation into business meaning.
- The single recommended action. One sentence with the highest-priority next move. "Recommend we test an ROI-calculator landing experience against our current demo page within two weeks." One action, prioritized, time-bound.
The discipline of the executive summary is ruthless prioritization. There may be ten findings in the report; the summary names the one that matters most. A summary that lists everything has prioritized nothing and forces the reader to do the analyst's job. Write the summary after the full report is assembled, look across all findings, and ask: if the reader does exactly one thing because of this report, what should it be? That answer is your third line.
Resist two temptations. First, do not pad the summary with methodology or caveats — those have their own section; the summary is for the decision. Second, do not soften the recommendation into mush ("we should consider exploring options around..."). A recommendation that cannot be acted on is not a recommendation. The summary's value is its decisiveness; a stakeholder should be able to approve or reject a clear action, not wade through hedged possibilities.
Section 2: The Evidence Table — What Every Row Must Contain
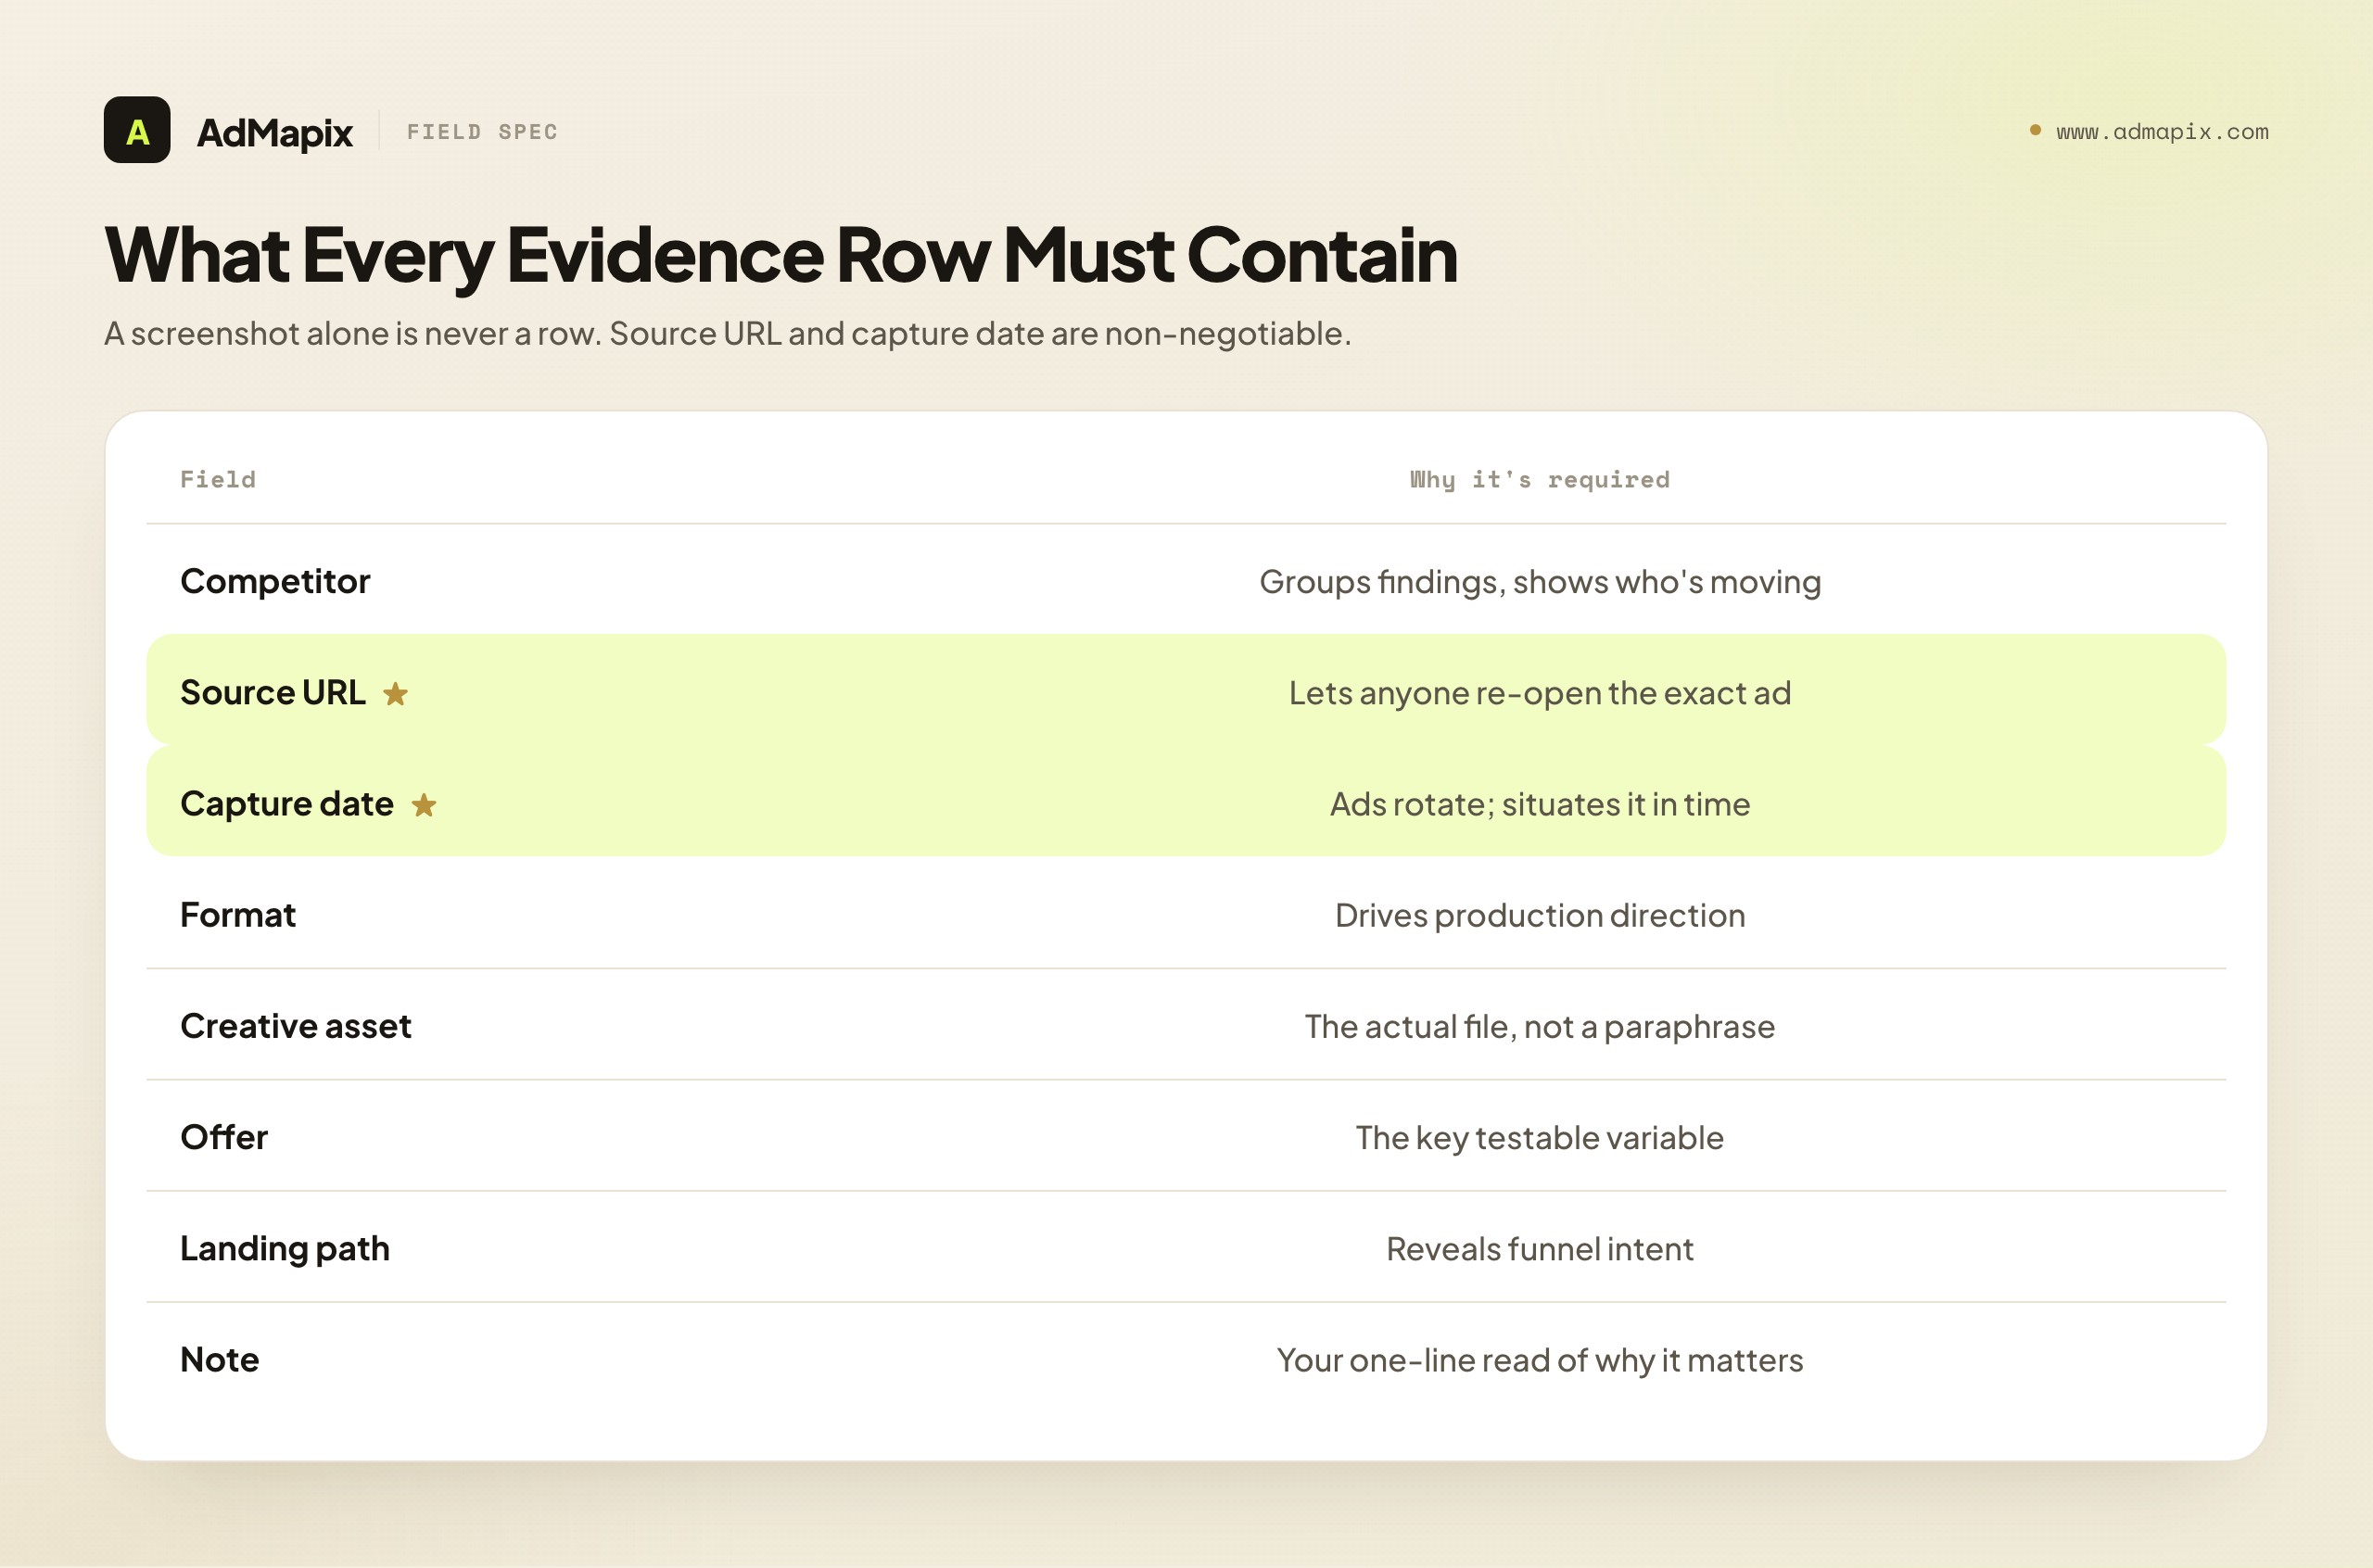
The evidence table is the auditable backbone of the entire report. Its purpose is singular: to let any colleague independently verify any claim, which means a screenshot alone is never sufficient. Every row pairs a public source with enough context to reconstruct the finding months later. Here are the mandatory fields.
| Field | Why it is required |
|---|---|
| Competitor | Groups findings by advertiser and shows who is moving |
| Source URL | Lets anyone re-open the exact ad in the public library it came from |
| Capture date | Ads rotate; the date tells you whether it was still live when seen |
| Format | Single image, video, carousel, document, etc. — drives production direction |
| Creative asset | The actual file or screenshot, not a paraphrase of it |
| Offer | The promise (free trial, % off, demo, calculator) — the key testable variable |
| Landing path | Where the click goes — reveals funnel intent and conversion philosophy |
| Note | Your one-line read of why this row matters |
Two fields deserve emphasis because they are the ones most often skipped, and skipping them is what turns a report into an unverifiable claim. The source URL is non-negotiable: it is the difference between "trust me, I saw this" and "here, re-open it yourself." A competitor ad report without source URLs is not auditable, and an unauditable report is a screenshot dump with better formatting. The capture date matters because ads are not permanent — they rotate, pause, and disappear. A finding without a date is a finding you cannot situate in time, and "when did they run this?" is one of the first questions a sharp reader asks.
Where do source URLs come from? Public ad libraries are the canonical answer. The Google Ads Transparency Center lets you search ads from verified advertisers with stable, shareable URLs, and is one of the cleanest starting points. The Meta Ad Library covers Facebook and Instagram ads similarly. Other platforms (TikTok, LinkedIn) maintain their own transparency surfaces. Each gives you a public, re-openable source for the ads you record — exactly what the source-URL field needs. Capture every row from one of these public sources and your evidence table is auditable by construction.
The discipline of the evidence table is one row per ad, every field filled, every time. The temptation under time pressure is to skip the note, or paraphrase the asset, or omit the landing path. Resist it: a half-filled row is a future hole in the report's auditability. The table is tedious to fill and that tedium is the price of a report someone can actually trust. Front-load the discipline here and the rest of the report rests on solid ground.
Section 3: The Creative Teardown — Turning Assets Into Patterns
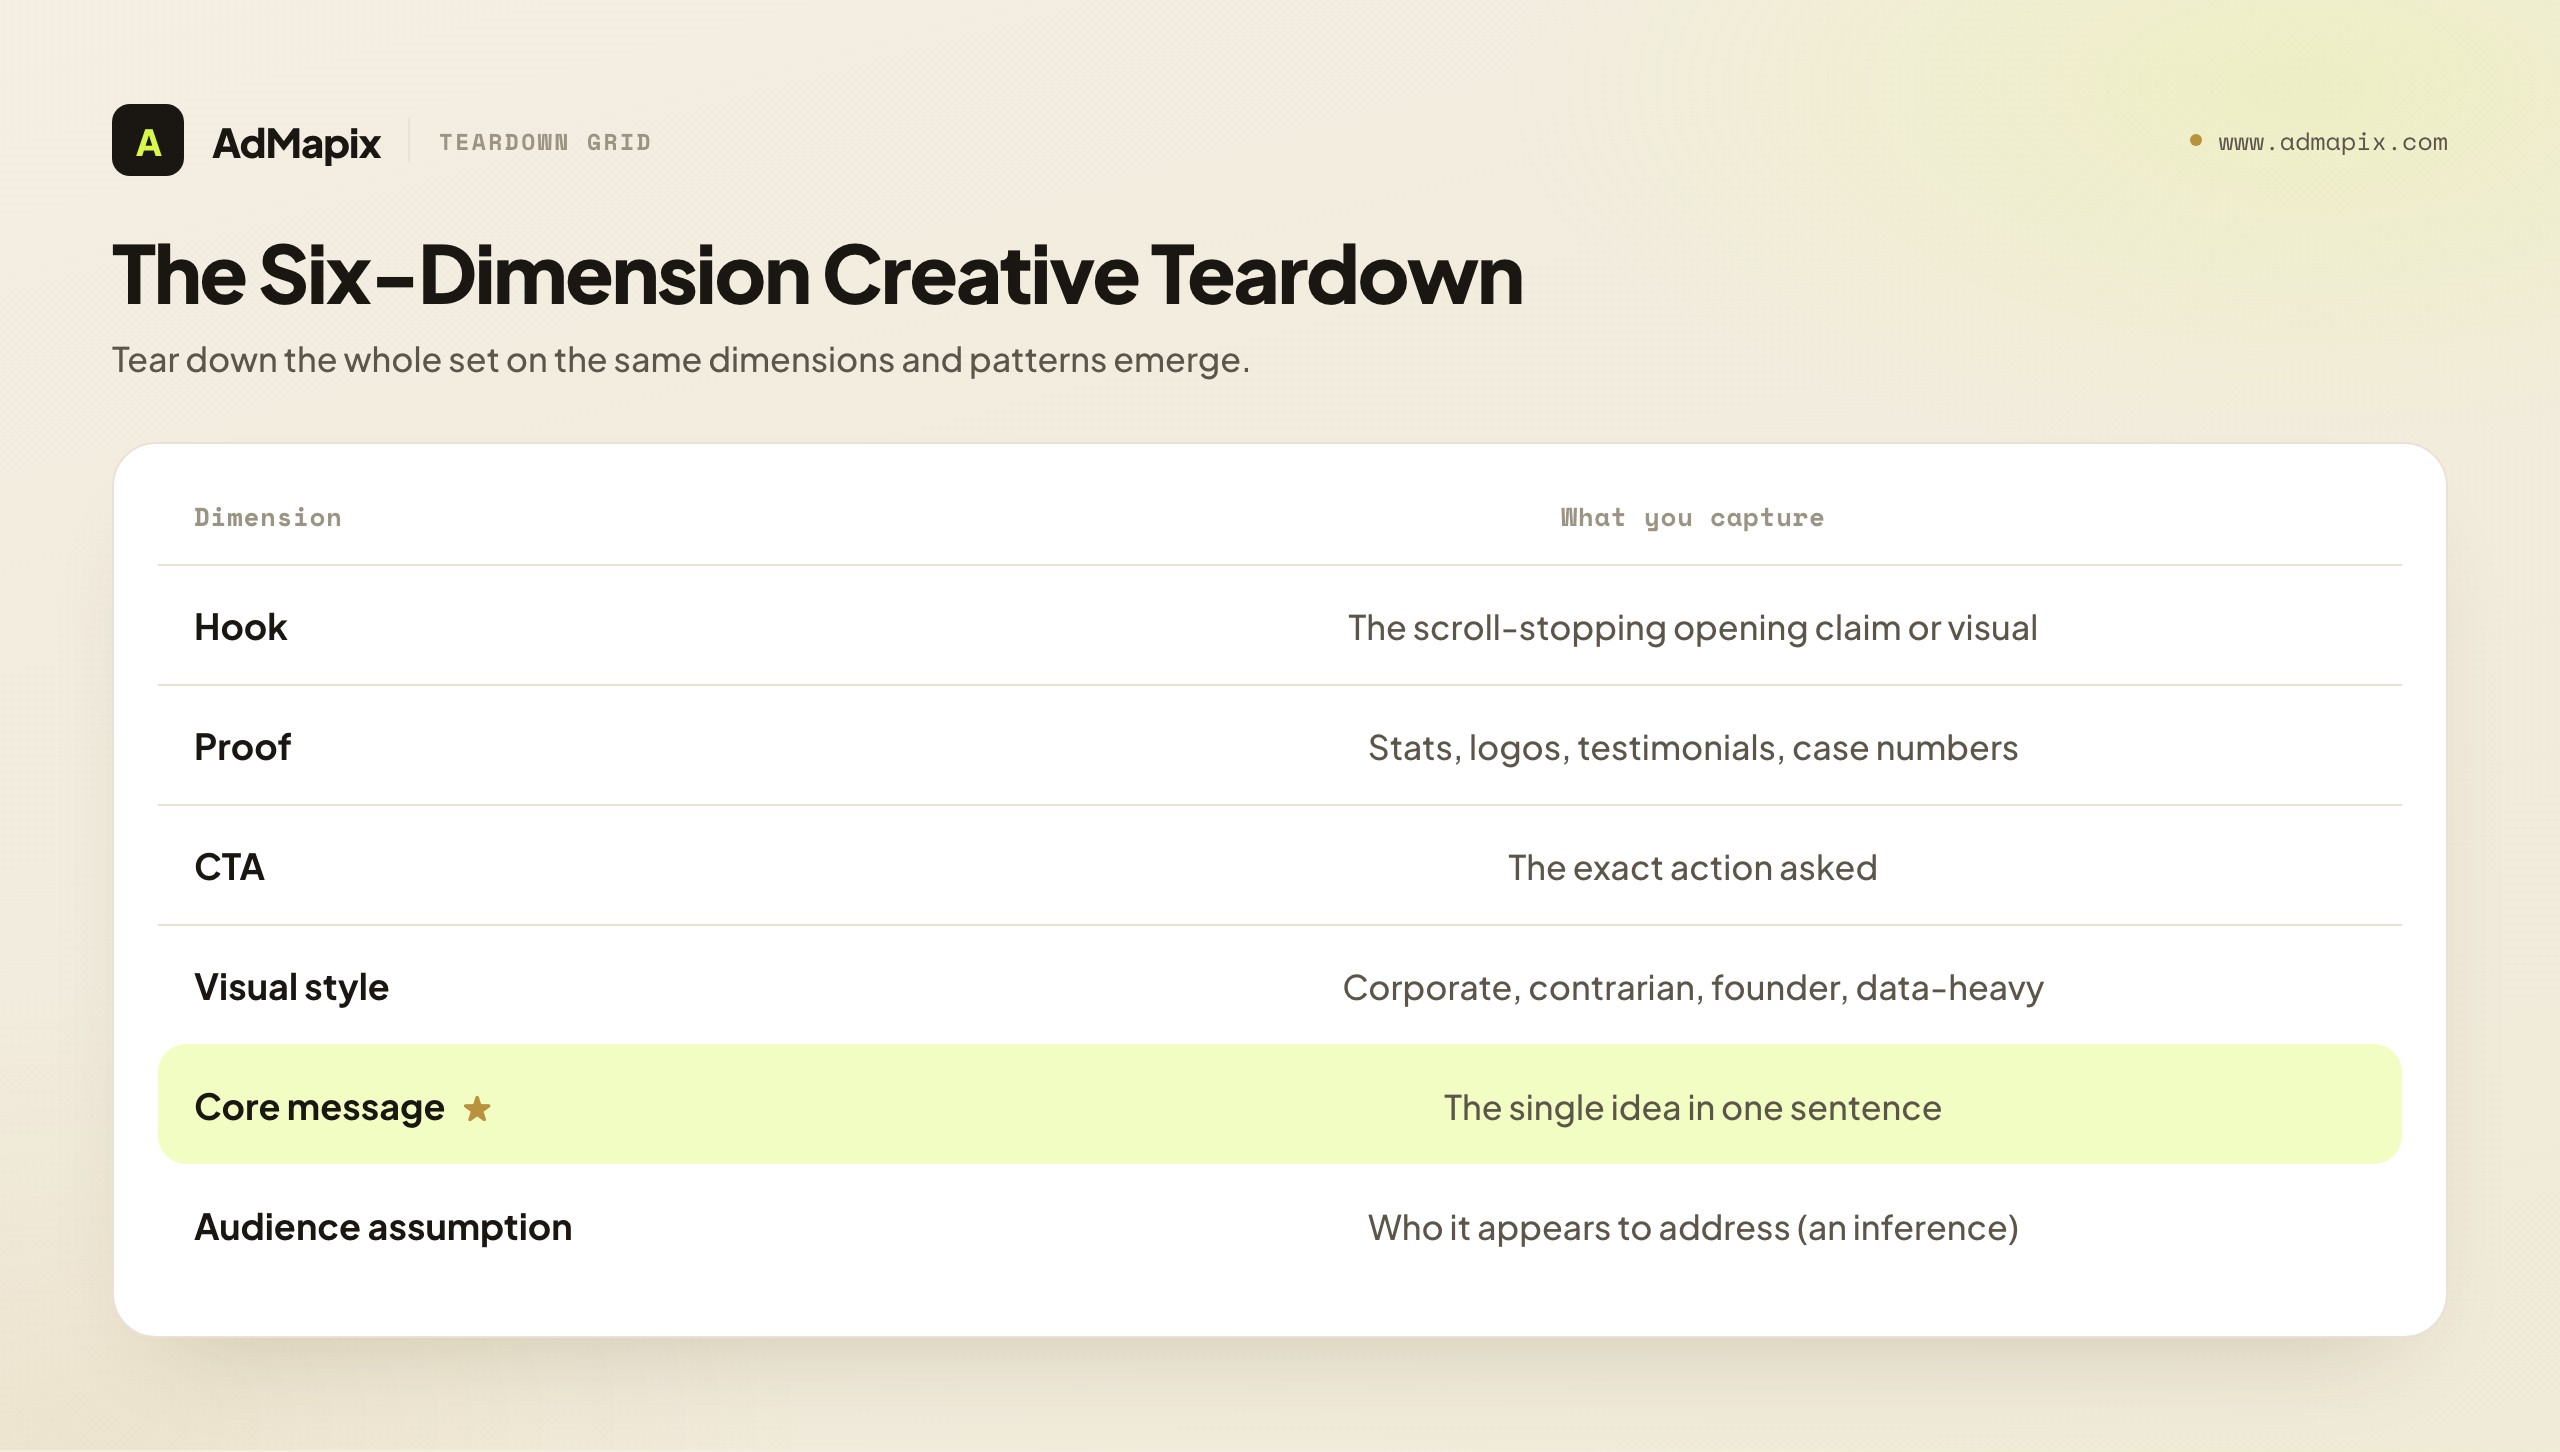
The evidence table records what ran; the creative teardown extracts what it means. This is where individual ads become a readable strategy — where you move from a list of creatives to an understanding of how a competitor is trying to win. Tear down each notable creative (or cluster of similar creatives) on six dimensions.
| Teardown dimension | What you capture |
|---|---|
| Hook | The first thing that grabs attention — the opening line, the on-screen claim, the visual that stops the scroll |
| Proof | The evidence the ad offers — stats, logos, testimonials, case-study numbers, certifications |
| CTA | The exact action asked — "Request demo," "Calculate savings," "Start free," "Download" |
| Visual style | The aesthetic and format choices — clean and corporate, bold and contrarian, founder-personal, data-heavy |
| Core message | The single idea the ad is built around, stated in one sentence |
| Audience assumption | Who the ad appears to address, read from copy, imagery, and offer |
The teardown's value is comparative. Tear down one competitor's ad and you have a description; tear down a whole competitive set on the same six dimensions and patterns emerge — shared hooks (the category's consensus framing), common proof types (what the category believes closes its buyer), CTA clustering (where everyone points in the funnel), and the gaps where nobody is playing. The dimensions are deliberately consistent so the teardowns are comparable; resist inventing a new framework for each ad, because comparability is the whole point.
A crucial honesty note on the audience assumption dimension: it is an assumption, read from the visible creative, not confirmed targeting. You can see who an ad appears to address; you cannot see the actual targeting parameters the advertiser set. Record it as "the ad appears to address [audience]," never as "they are targeting [audience]." This keeps the teardown on the right side of the evidence boundary — inference clearly labeled as inference. The same caution applies to any performance read: longevity or repetition of a creative can suggest it is working (advertisers keep what works), but the teardown should phrase that as a soft signal, never a performance claim.
Done across a competitive set, the teardown is the analytical heart of the report — the section that converts the auditable evidence into the strategic patterns the summary headlines and the next-tests section acts on. It is where the report earns its "intelligence" label, and where a skilled analyst's judgment adds the most value over a raw screenshot collection.
Section 4: Public-Data Caveats — Protecting the Reader From Over-Reading
This section exists to protect the reader (and your credibility) from over-reading the evidence, and skipping it is how competitor reports drift into confident fiction. State plainly, every time, what public ad data does and does not prove.
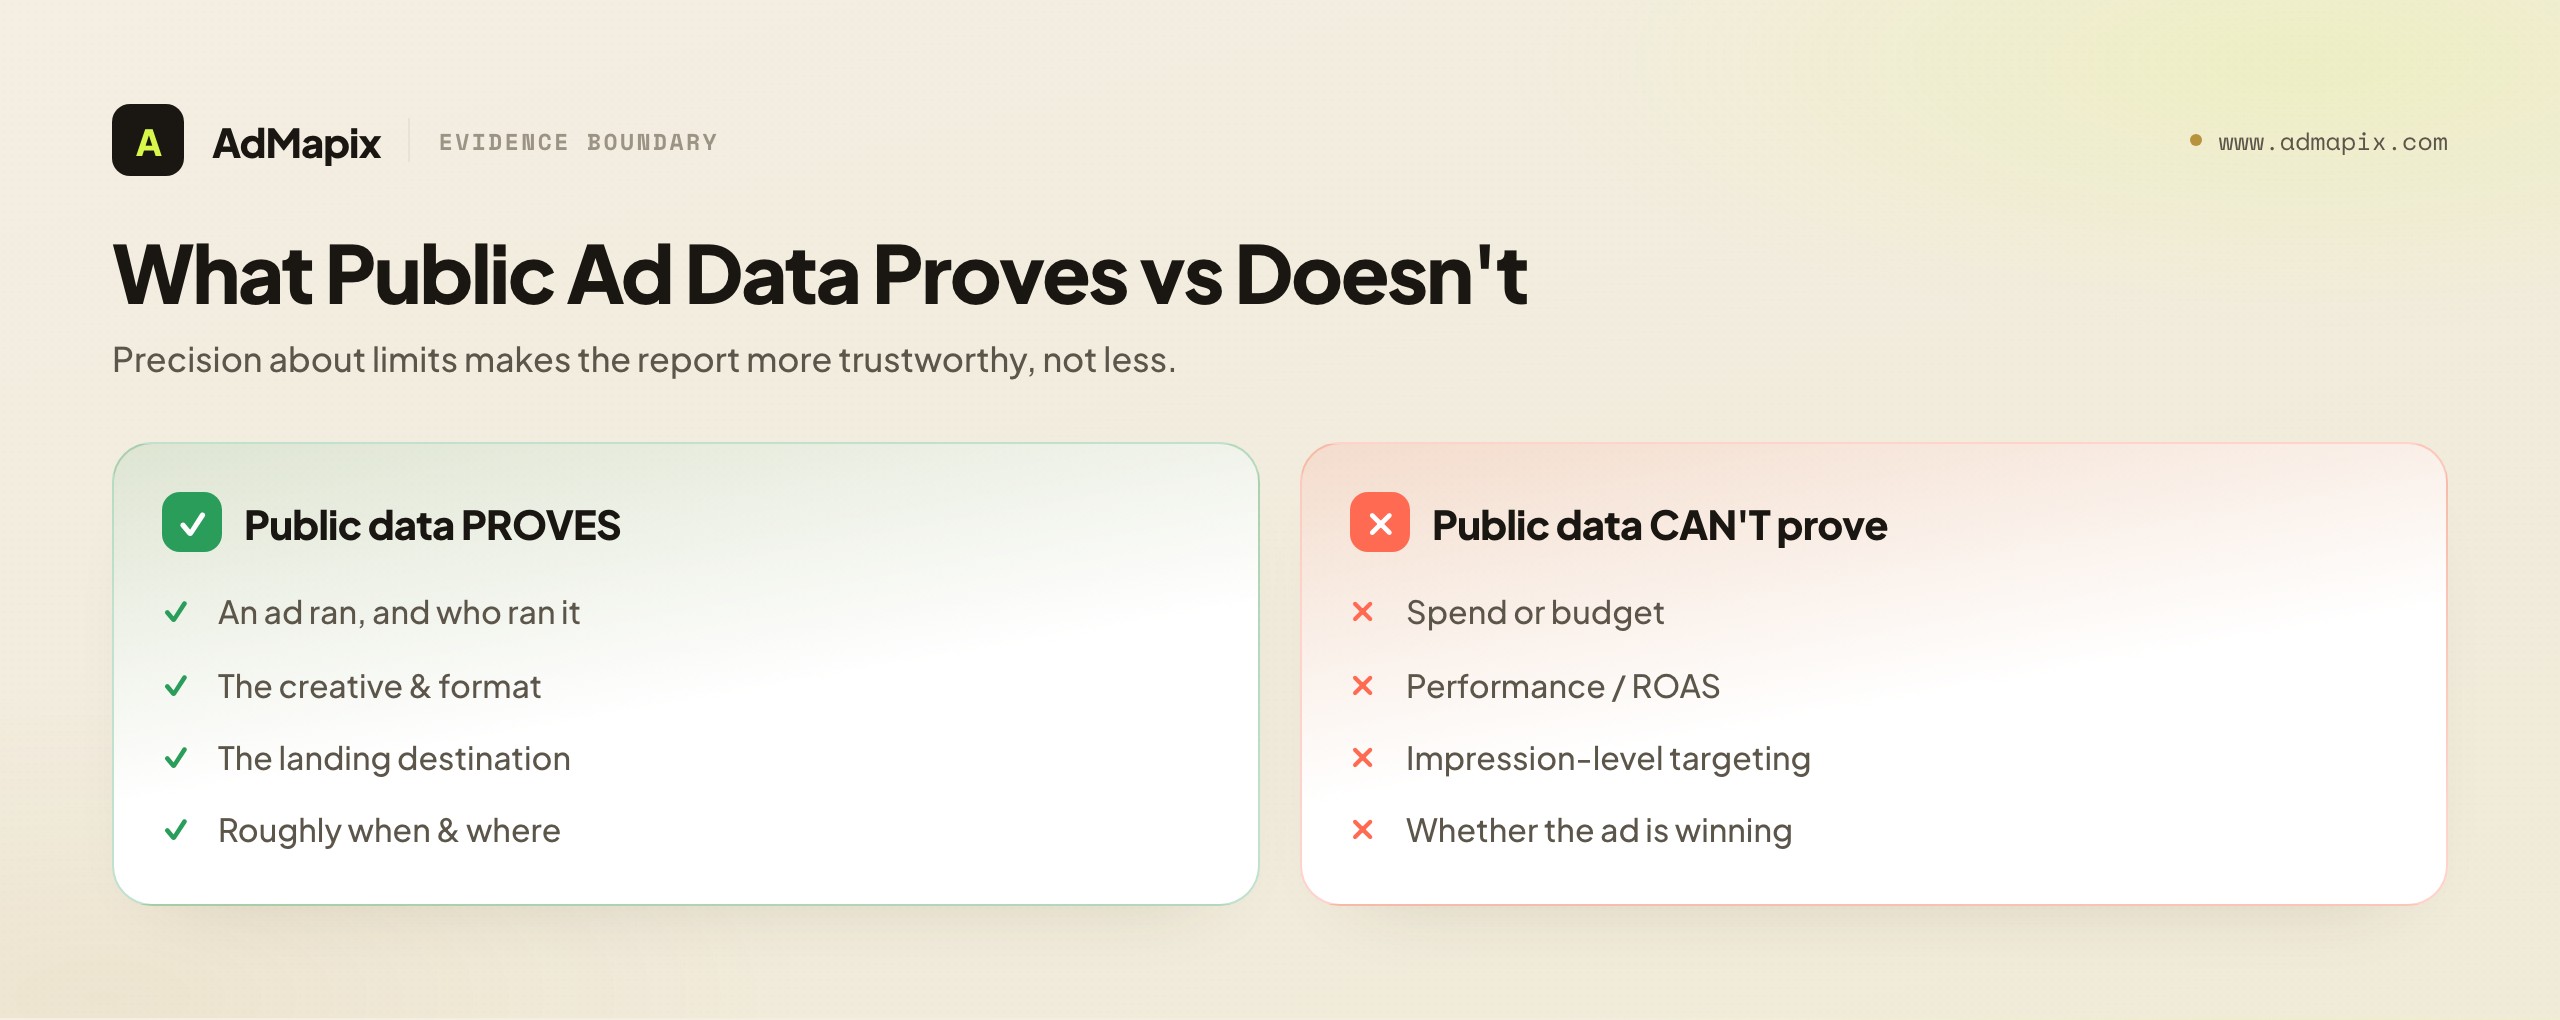
What public ad libraries do prove: that an ad ran, who ran it, the creative itself, the format, the landing destination, and roughly when and where it ran. That is genuinely valuable — it is a verifiable record of what a competitor said to the market.
What public ad data does not prove, and what your report must explicitly disclaim:
- Spend. Public libraries do not publish what advertisers spent (with narrow exceptions for some political ad disclosures in some jurisdictions). Any commercial-ad "spend" figure is a model, not a measurement.
- Performance. No impressions, clicks, click-through rate, conversions, or ROAS. You cannot tell from the library whether an ad worked.
- Impression-level targeting. You cannot see the actual audience an advertiser selected. The audience read in the teardown is an inference from the creative, not confirmed targeting.
- Whether an ad is a winner. A live ad might be a top performer or a dud nobody paused. From the outside they look identical.
The single most important sentence in this section, and arguably the whole report, is some version of: "This report reflects what competitors said to the market — their messaging, offers, and formats — not how their ads performed. Spend, conversion, ROAS, and exact targeting are not in public data and are not claimed here." Putting that in writing does three things: it correctly calibrates how the reader weights every finding, it protects you the first time someone asks "how do you know that's working?", and it pre-empts the credibility collapse that happens when a report is caught implying knowledge it cannot have.
Some analysts worry that the caveats section undercuts the report's authority. The opposite is true. A report that is precise about its limits is more trustworthy than one that implies omniscience, because sophisticated readers know the limits exist and trust an analyst who names them. The caveat section is not an apology; it is a credibility asset. It signals that every claim outside it is one you can actually stand behind — which makes those claims land harder.
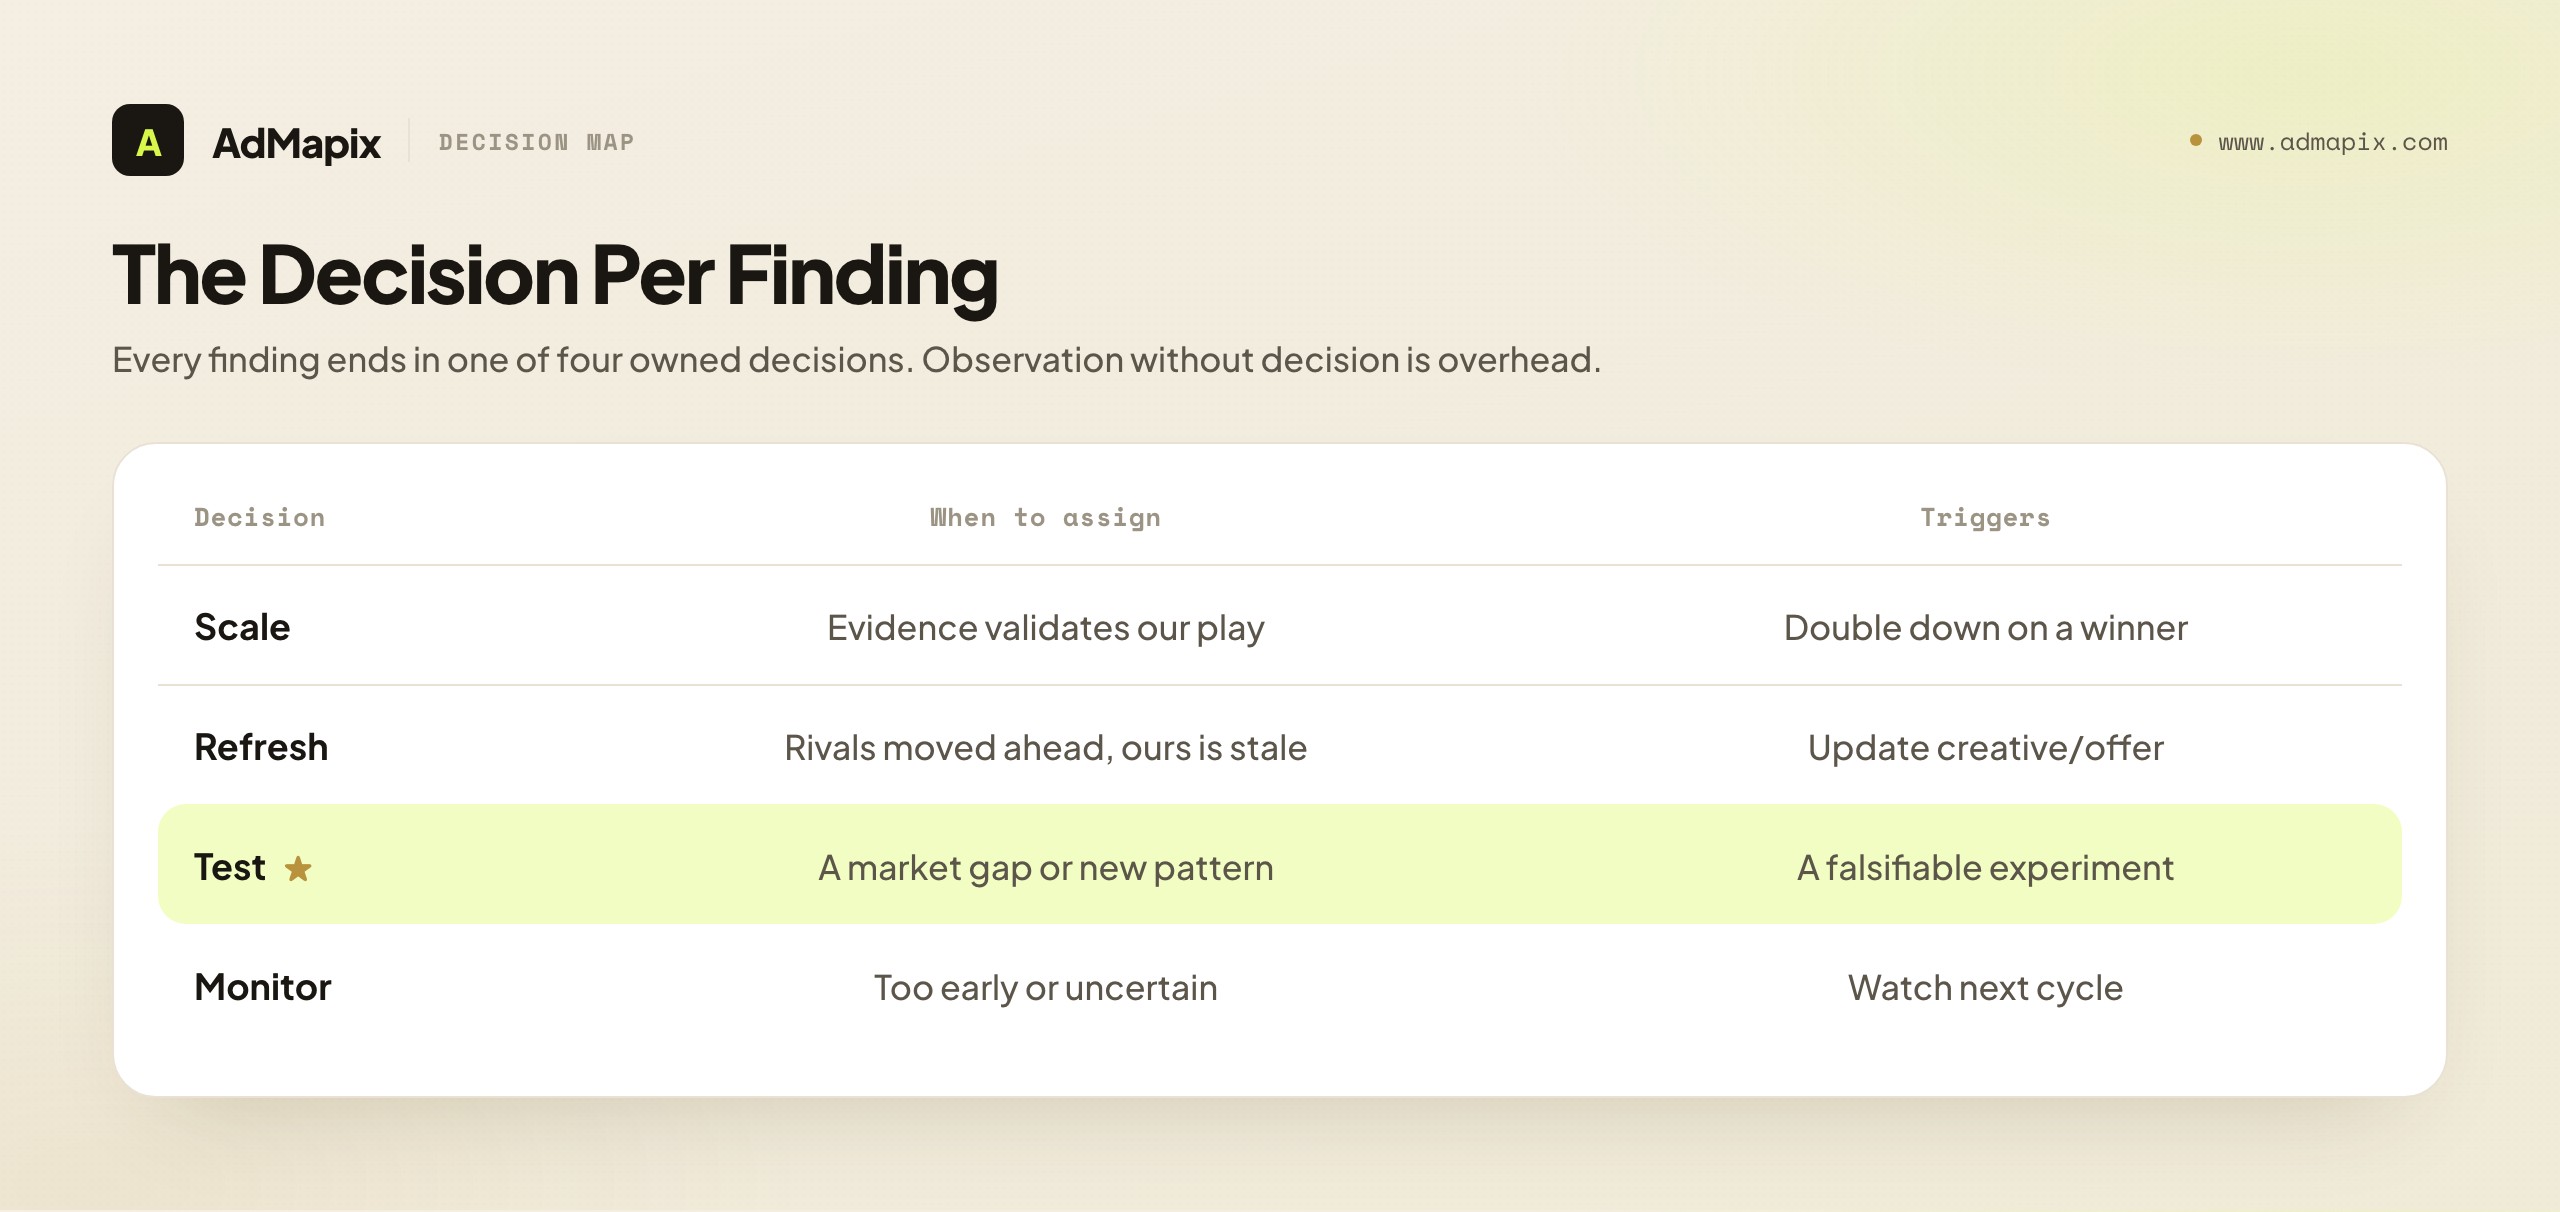
Section 5: Next Tests — The Decision Per Finding
The next-tests section is the destination of the entire report. Everything before it — summary, evidence, teardown, caveats — exists to justify the decisions made here. The rule is absolute: every finding ends in a decision. A finding without a decision is an observation, and a report full of observations and empty of decisions has failed at its only real job.
The decisions come in four flavors, and every finding should be assigned one:
| Decision | When to assign it | What it triggers |
|---|---|---|
| Scale | A play of ours the competitive evidence validates as worth doubling down on | Increase budget/effort on an existing winner |
| Refresh | An area where competitors have moved ahead and ours has gone stale | Update creative, offer, or messaging to match or beat |
| Test | A gap or new pattern in the market worth a falsifiable experiment | A specific creative/offer/landing test with a hypothesis |
| Monitor | A signal too early or uncertain to act on yet | Watch in the next report; no action this cycle |
Each decision needs three things to be real: a specific action (not "improve our video" but "test a 60-second ROI-calculator video against our current demo single-image ad"), a clear owner (a named person responsible, not "the team"), and where it is a test, a falsifiable hypothesis ("we believe a calculator offer will outperform our demo offer for self-serve-inclined buyers"). An action without an owner does not happen; a test without a hypothesis cannot be learned from; a vague action cannot be executed. Specificity, ownership, and falsifiability are what turn the next-tests section from a wish list into a plan.
A vital reminder grounded in the caveats section: the competitor evidence informs which tests to run, but it never determines the result. Your own analytics — not the competitor analysis — are the arbiter of whether a test wins. The report's job is to point you at the highest-leverage experiments, drawn from what the market is doing; running and measuring them is a separate, equally important step. For the discipline of structuring those experiments well, our creative testing framework is the companion. The competitor report is the input to testing, not a substitute for it.
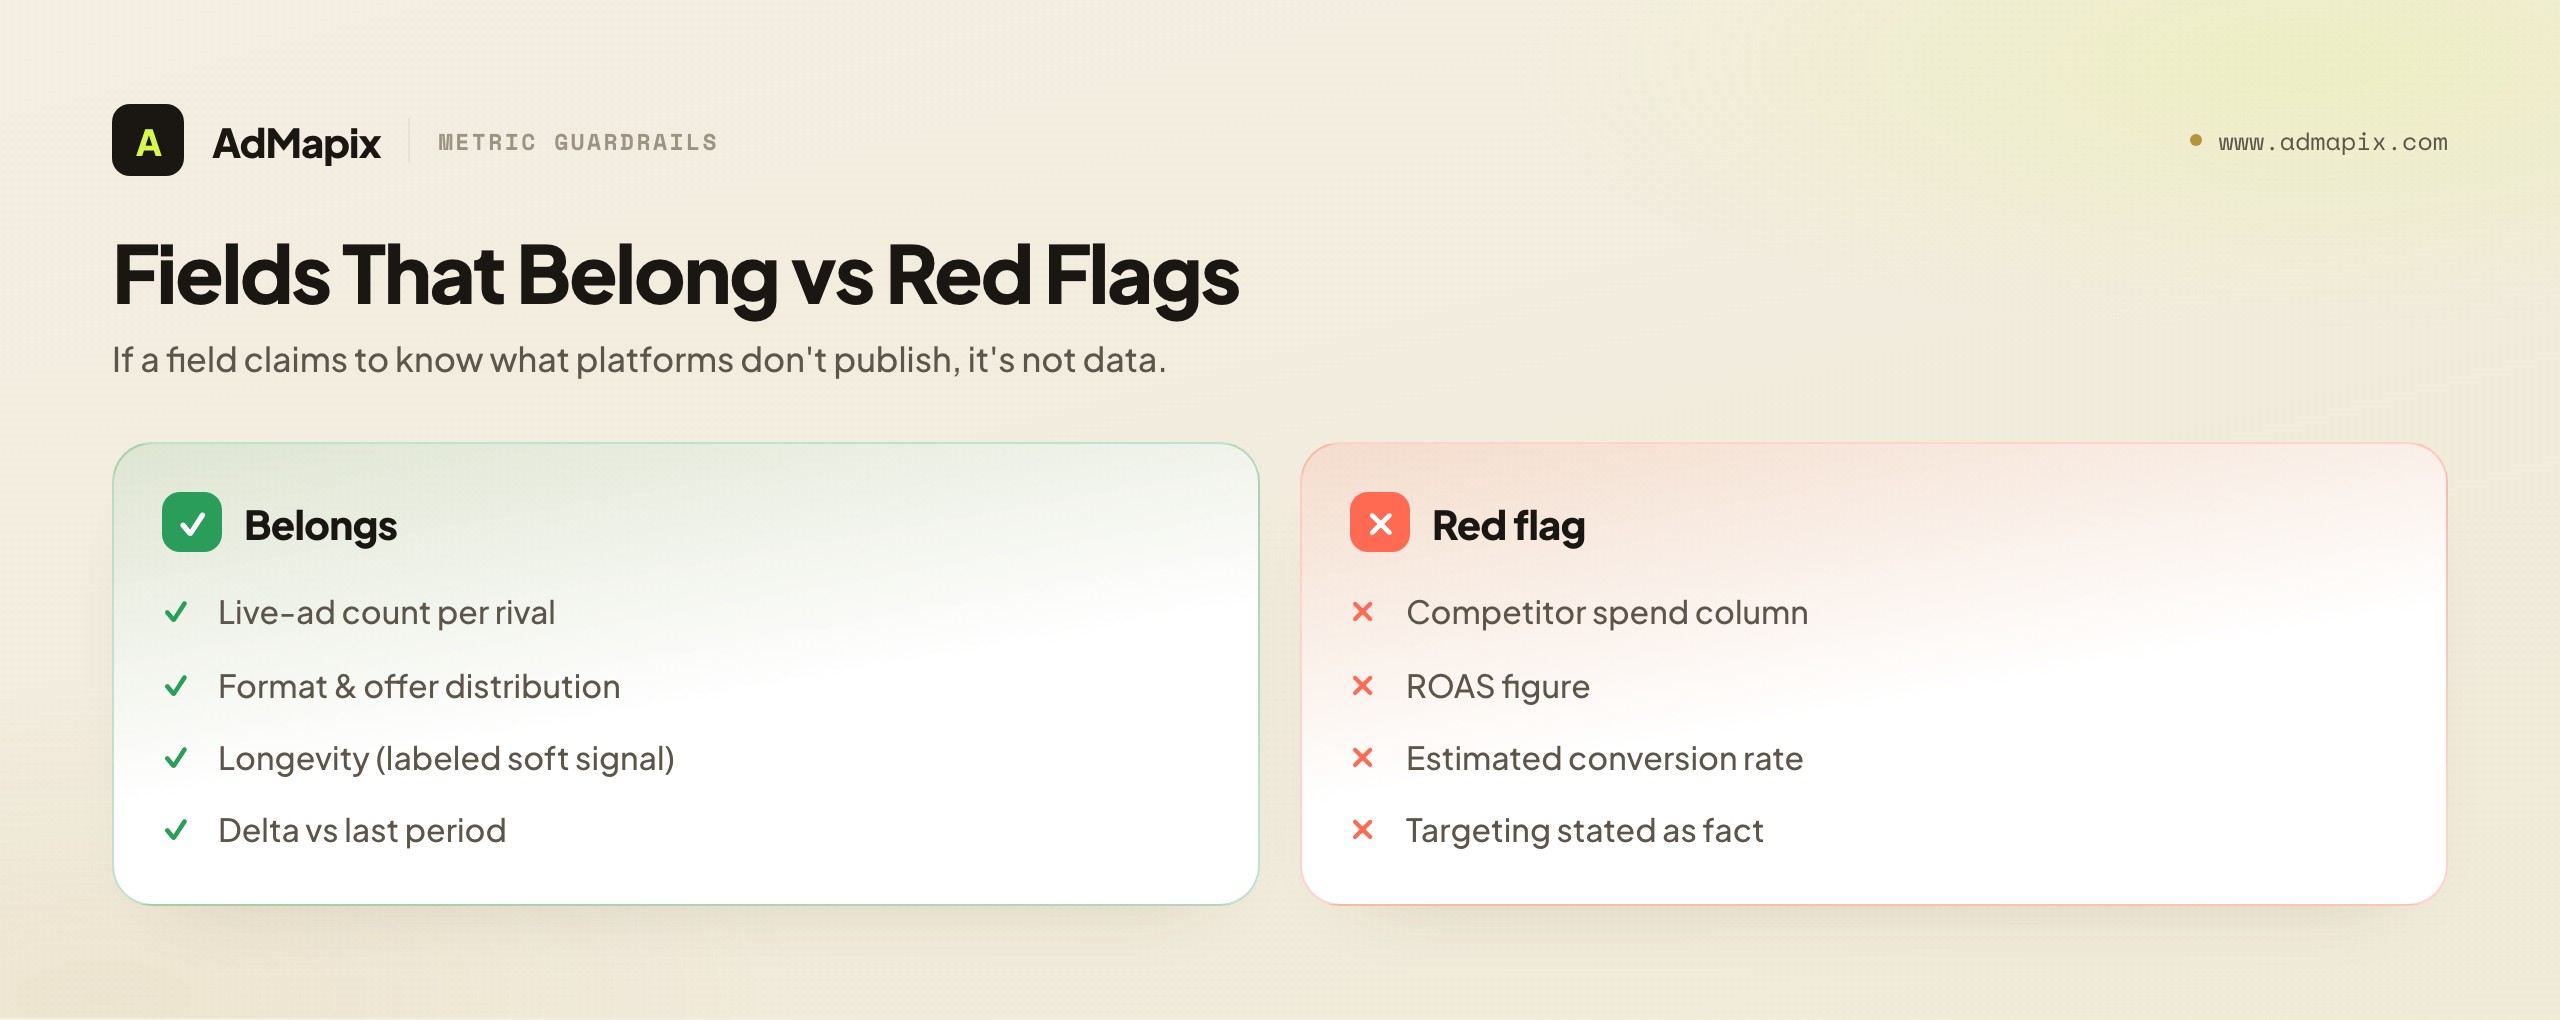
The Metrics and Fields That Belong (and the Ones That Don't)
Because this is a template article, it is worth being explicit about which metrics and fields belong in a competitor ad report and which are red flags — because including the wrong "metrics" is how reports drift into fiction.
Belongs: descriptive, verifiable fields. Count of live ads per competitor (a maturity/activity signal), format distribution (where production investment goes), offer distribution (the funnel-strategy map), longevity/recurrence of creatives (a soft performance proxy, clearly labeled), and the delta versus last period (the change that is the report's real value). These are all derivable from public creative evidence and all verifiable.
Belongs with care: clearly labeled inferences. Audience assumptions (labeled as inferences), likely-working reads based on longevity (labeled as soft signals), and testing-maturity assessments based on format/variant spread. These add value but must be phrased as inference, never as fact.
Does NOT belong: anything implying private performance data. A "competitor spend" column, a "competitor ROAS" figure, an "estimated conversion rate," or a "targeting" field stated as confirmed fact. These are not derivable from public data, and putting them in a report — even as estimates — corrupts the report's integrity, because readers will treat a number in a cell as a measurement. If you must include a directional spend estimate from a model, it belongs in the caveats with its methodology disclosed, never as a clean metric in the evidence table. The safest rule: if a field claims to know something the platforms do not publish, it does not belong in the report as data.
The metric that matters most across all of this is the delta — what changed since last period. A first report establishes a baseline; every report after earns its keep by surfacing change: new offers, abandoned messages, entered or exited segments, broadening format mixes, new entrants. The deltas are the intelligence; the static snapshot is just the baseline against which deltas are measured. A report template that does not foreground change-over-time is leaving most of the value on the table.
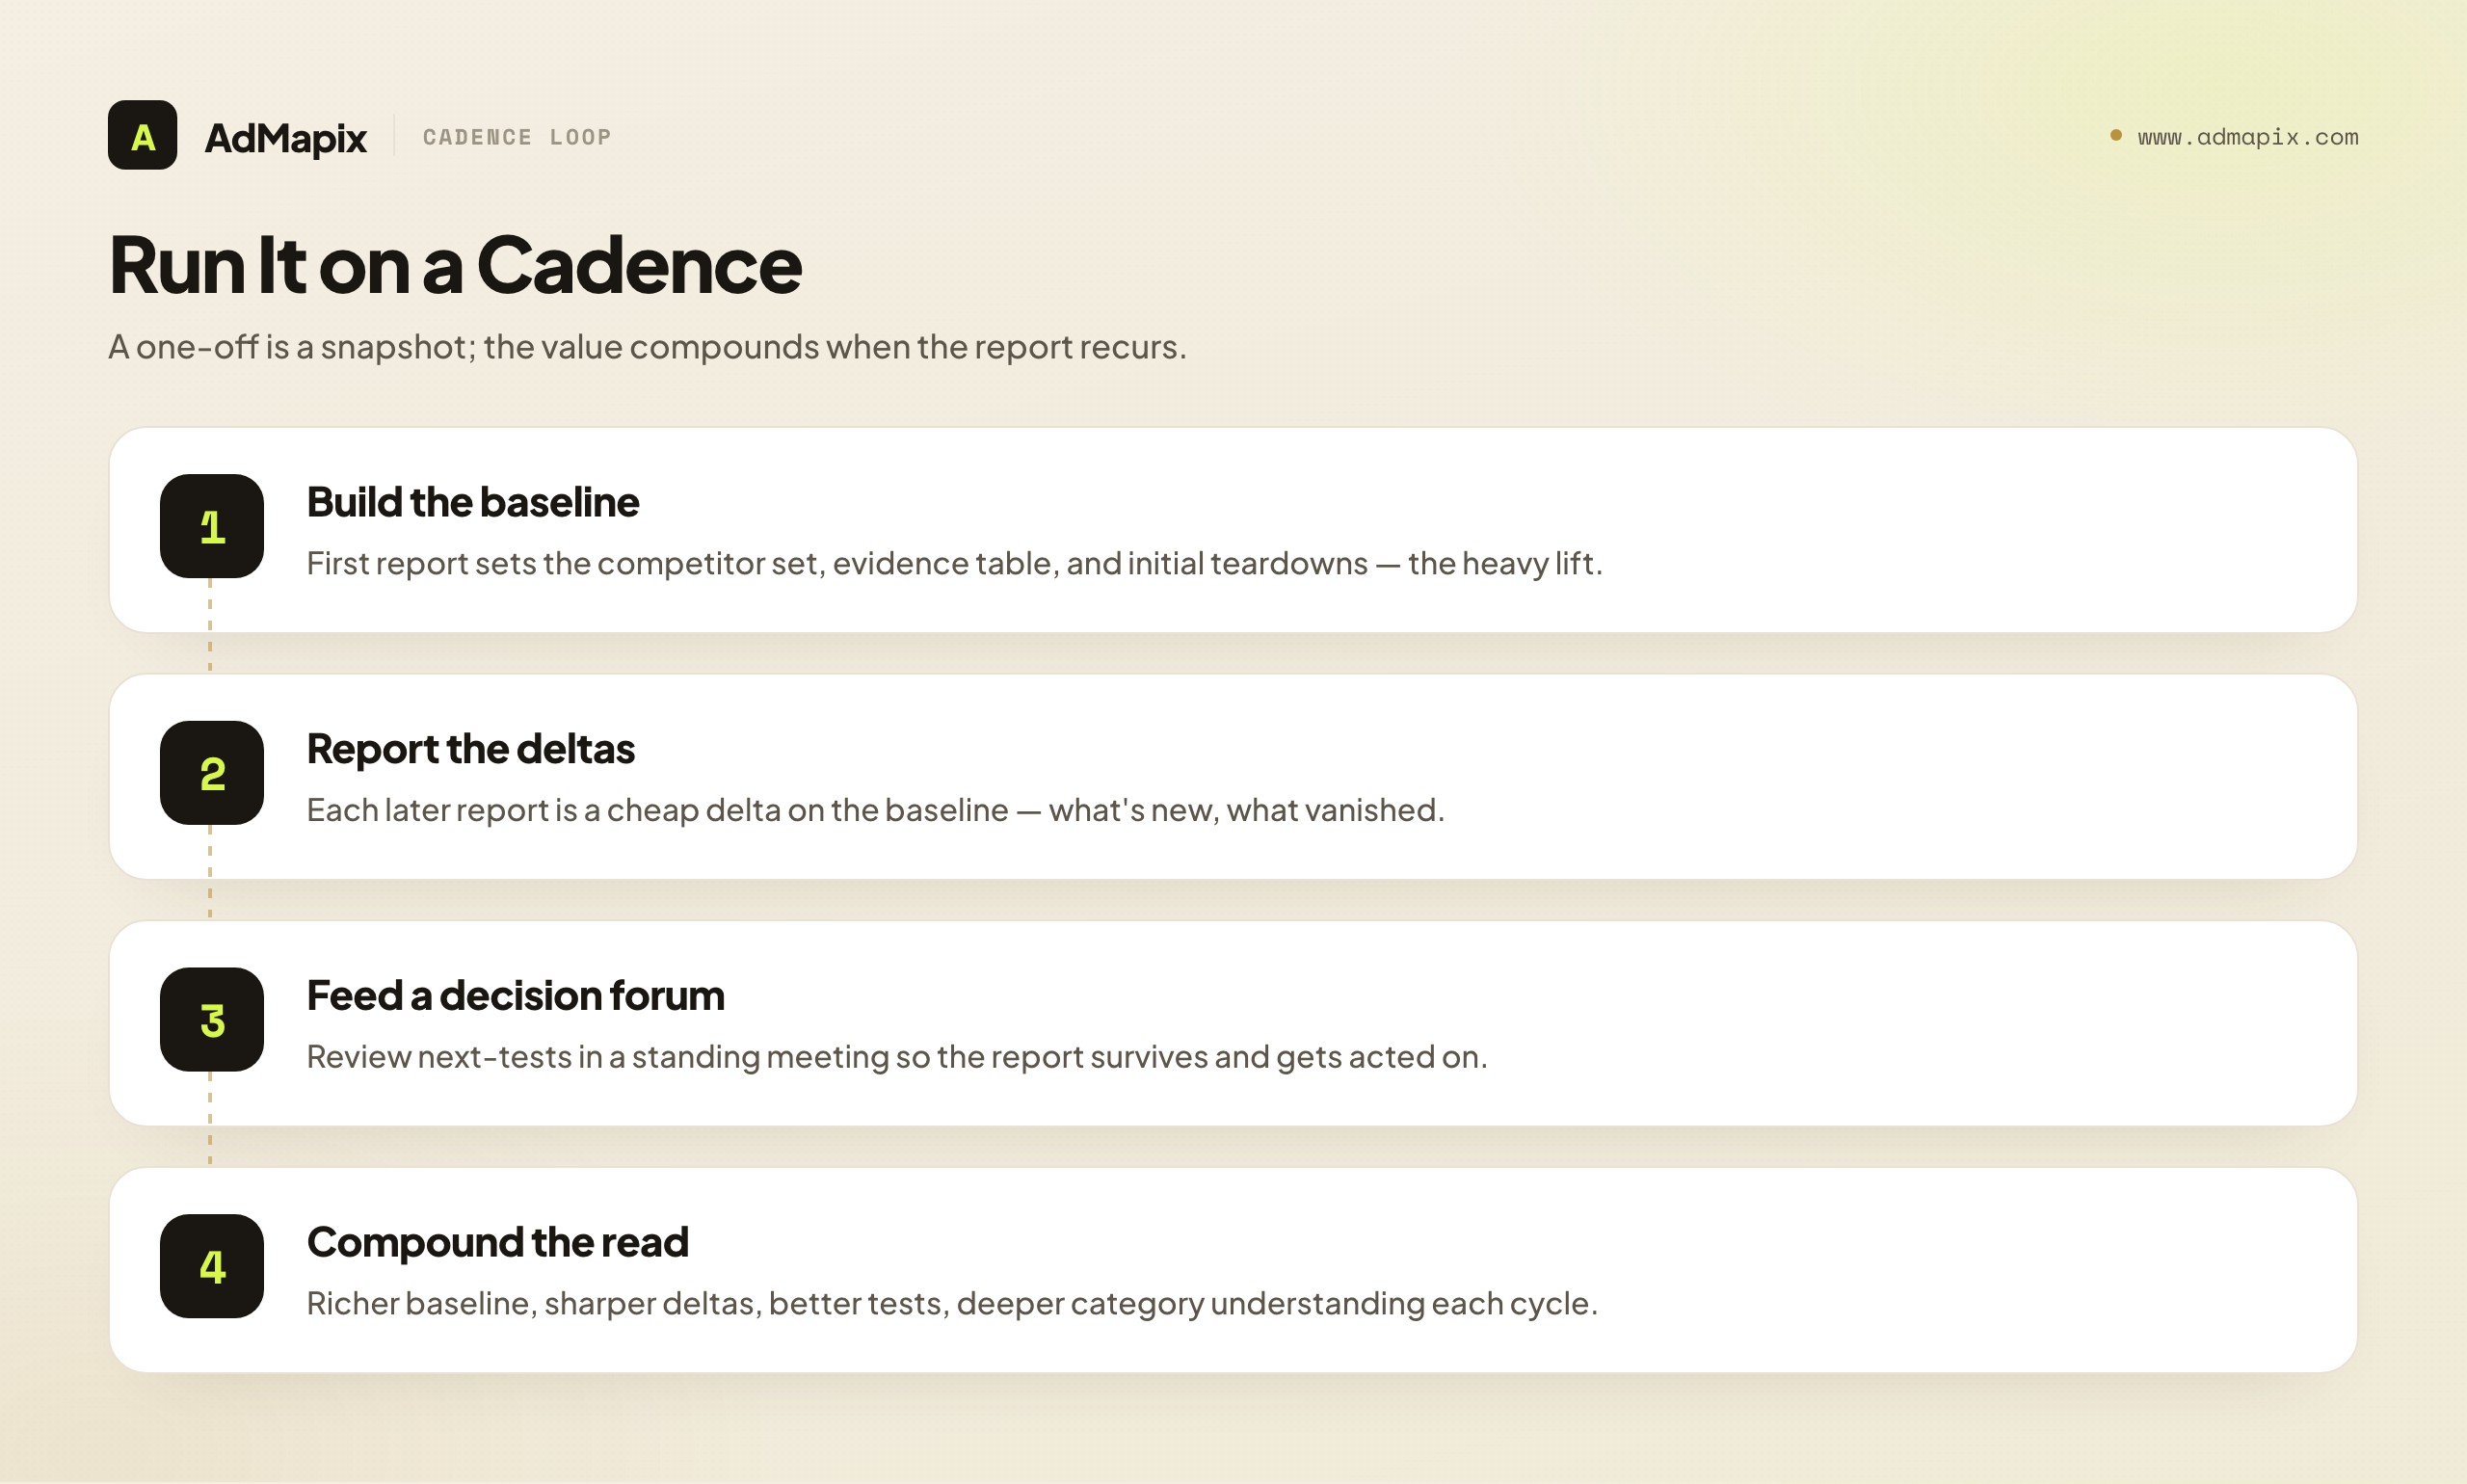
Cadence: Why a Recurring Report Beats a One-Off
A one-time competitor ad report is a snapshot; the strategic value compounds only when it runs on a cadence. The template is designed to be re-run, and the rhythm of re-running it is where the intelligence accumulates.
Monthly is the sensible default for most categories — long enough that meaningful change accumulates between reports, short enough that you catch a new offer or campaign before it is obvious to everyone. Fast-moving categories or active competitive launches may justify a tighter loop (bi-weekly); slow, stable categories can stretch to quarterly. The right cadence is the one where each report reliably contains enough change to be worth reading — too frequent and reports are mostly "no change," too infrequent and you are surprised by shifts you should have caught.
The recurring report is structurally easier than the first. The first report builds the baseline — the competitor set, the initial evidence table, the first teardowns — which is the heavy lift. Every subsequent report is a delta on a maintained baseline: re-check the same competitors, update the evidence table with what is new, note what disappeared, and the analysis focuses on change rather than starting from scratch. This is why the discipline of maintaining the evidence table across periods pays off — it converts an expensive one-off into a cheap recurring habit.
The cadence must feed a decision forum to survive. A recurring report that is produced into a void will quietly die. Tie it to a standing meeting — a monthly growth review, a creative-planning session — where the next-tests section is reviewed and the decisions are approved and assigned. A report with a standing audience that acts on it has a reason to keep being produced; one that nobody reviews becomes a chore that lapses. The surest way to keep competitor reporting alive is to make a downstream decision depend on it.
Run this way, the competitor ad report becomes a flywheel: each cycle the baseline is richer, the deltas sharper, the team's read of the category deeper, and the tests better-targeted. The teams with the best competitive intelligence are not the ones who ran one brilliant audit; they are the ones who built a boring, durable monthly report and let it compound. The template is the structure that makes that compounding possible.
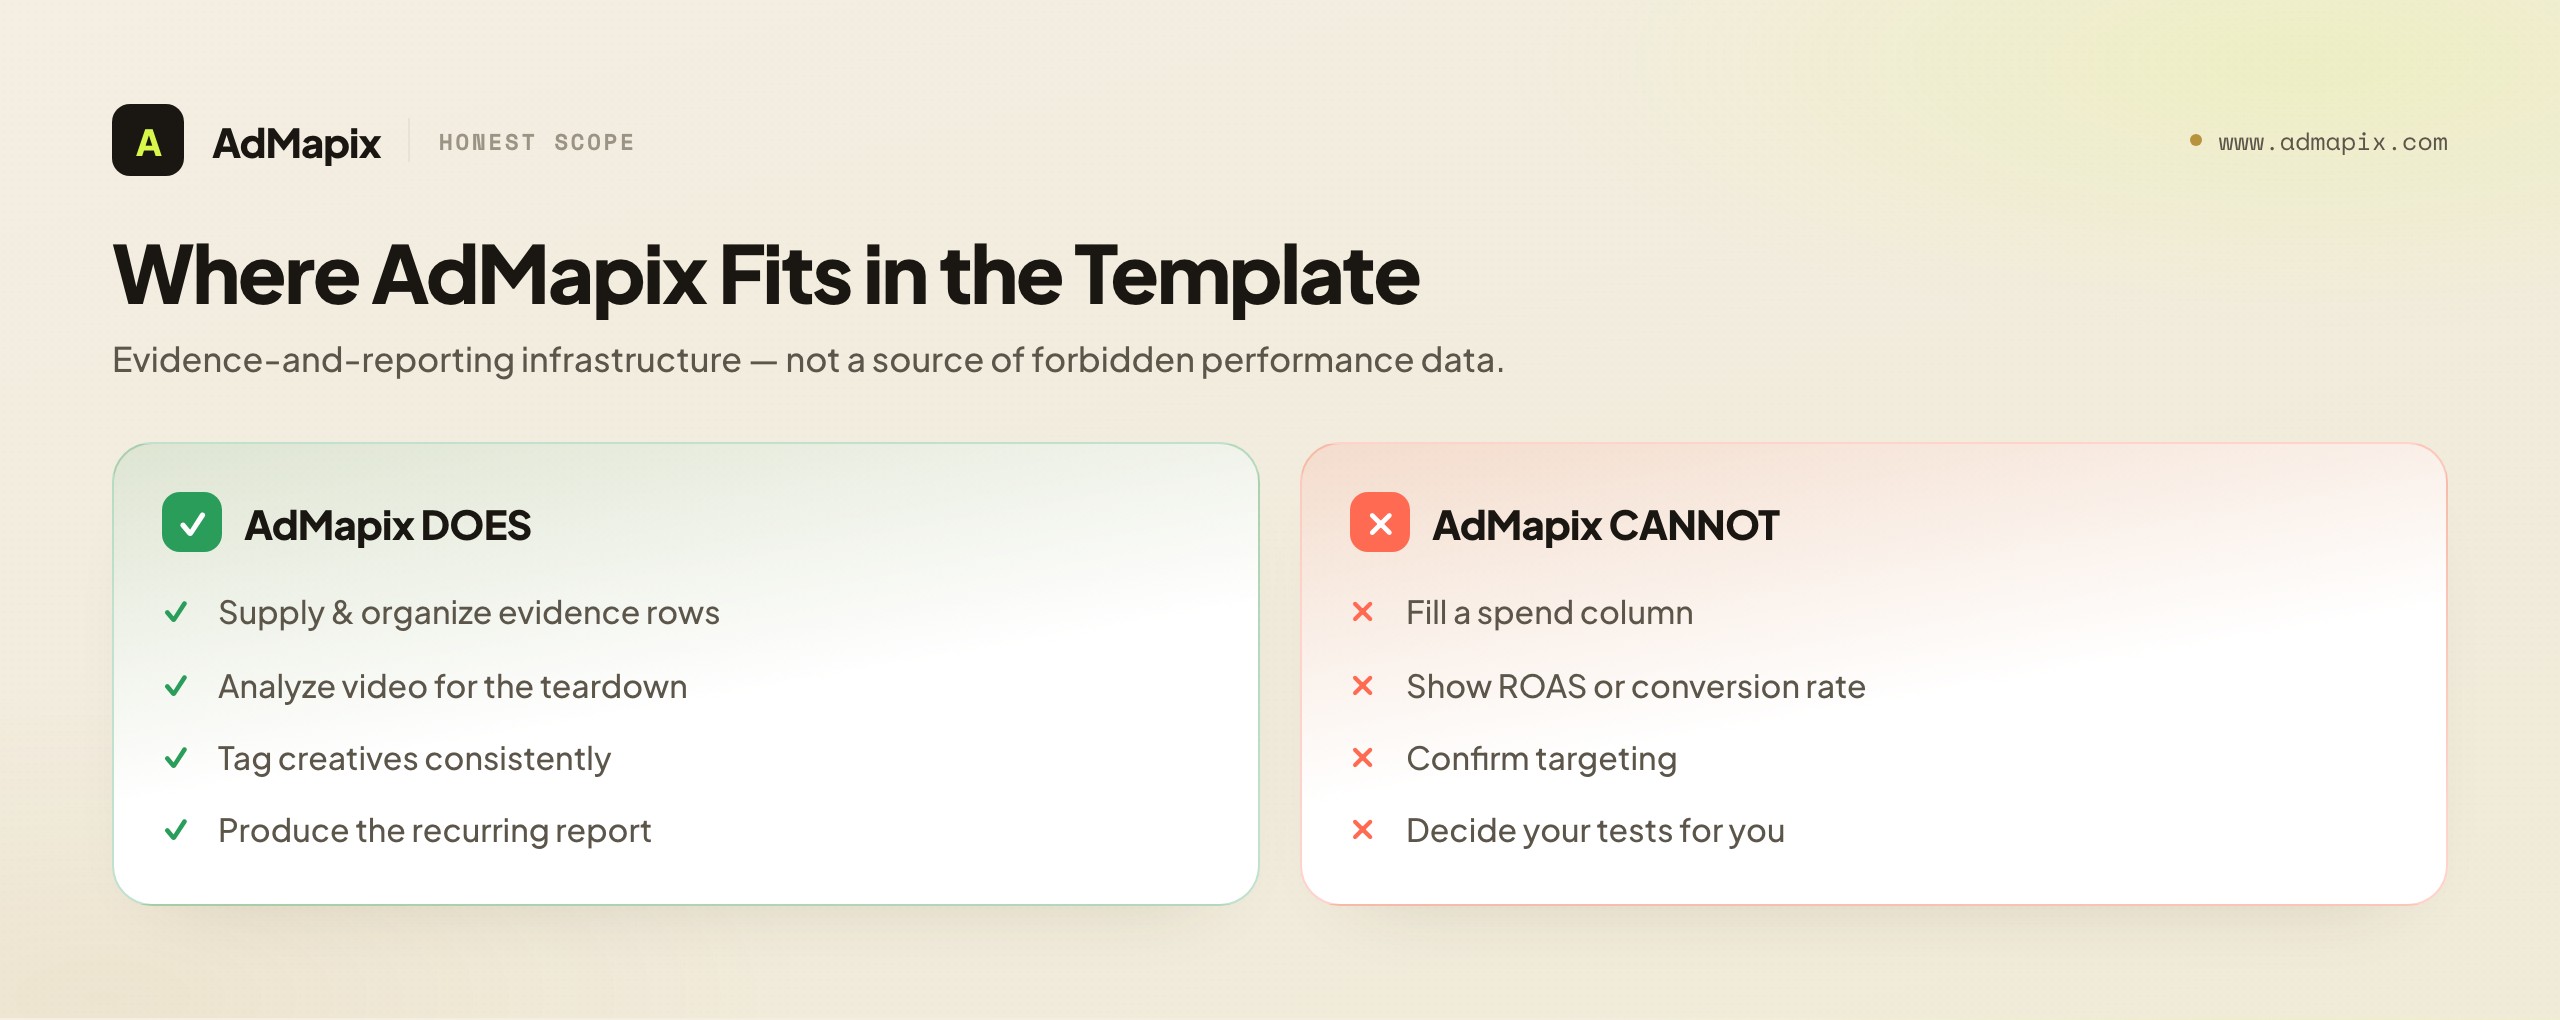
Where AdMapix Fits — and Where It Honestly Does Not
A precise account of where our own tool sits relative to this template, including its limits, because the whole caveats argument above obligates us to hold ourselves to the same standard.
AdMapix is a creative-evidence layer, and in the context of this template it helps with the parts that do not scale by hand: supplying and organizing the searchable cross-network ad-creative evidence that fills the evidence table, analyzing video creatives to support the teardown, tagging ads consistently, and producing the recurring report on a cadence. In template terms, AdMapix is strongest at Sections 2 and 3 (evidence and teardown) and at the recurring-report cadence — exactly the labor-intensive, easy-to-let-slip parts of producing this deliverable repeatedly.
What AdMapix is not, and cannot be — and this is the part the caveats section of every report must reflect — is a source of the data the template explicitly excludes. AdMapix cannot populate a competitor-spend column, a ROAS figure, a conversion rate, or a confirmed-targeting field, because none of that is in public ad data and no tool can derive what platforms do not publish. AdMapix gives you the creative-evidence layer — what competitors are saying and testing — organized, analyzable, and reportable at scale. The performance layer is not publicly knowable, and any vendor offering to fill those forbidden columns is selling a model dressed as a measurement. We hold our own tool to the exact standard this template demands of every report: claim only what public creative evidence proves, label inferences as inferences, and disclaim the rest.
So the honest placement: AdMapix accelerates the production of the evidence and teardown sections and the recurring cadence, while the report's structure, the analytical judgment, the caveats, and — above all — the decisions remain yours. It is the evidence-and-reporting infrastructure around a template you own and a judgment only you can supply. For how creative-evidence layers compare to other tools, see best ad intelligence tools, best ad spy tools 2026, and our ad creative database overview.
A Filled-In Example (Composite)
To make the template concrete, here is an illustrative, composite walk-through — not real competitor data, but a realistic shape of what a filled-in report looks like.
Executive summary. "Two of four tracked competitors launched video ads this month leading with an ROI-calculator offer — the first category move off demo-request offers. This signals a shift toward self-serve conversion. Recommend we test an ROI-calculator landing experience against our current demo page within two weeks."
Evidence table (excerpt). Competitor A | [source URL] | captured 2026-06-15 | video | [asset] | "Calculate your savings" | calculator landing page | "First video + first calculator offer from this rival." Competitor C | [source URL] | captured 2026-06-16 | video | [asset] | "See your ROI in 4 min" | calculator page | "Same calculator wedge, sharper framing."
Creative teardown. Both new video ads share a hook (an on-screen savings claim in the first two seconds), proof (a specific dollar/percentage figure), CTA ("Calculate"), visual style (clean, data-forward), core message ("see your specific savings, fast"), and audience assumption (appears to address budget-owning operations leaders — an inference from the copy, not confirmed targeting).
Caveats. "This reflects what these competitors are saying and testing — their offers, formats, and messaging. It does not show their spend, conversion rates, ROAS, or actual targeting, none of which are in public data. The 'first move' read is based on the public library within our search and date range."
Next tests. Finding: category moving to calculator offers. Decision: Test. Action: "Build an ROI-calculator landing experience; test against current demo page; hypothesis: calculator offer converts self-serve-inclined buyers better than demo offer." Owner: [name]. Finding: our existing video is now visually dated versus rivals. Decision: Refresh. Action: "Update hero video to data-forward style." Owner: [name].
Notice what the example never does: it never states a competitor's spend, ROAS, or confirmed targeting; it labels the audience read as an inference; it ends every finding in an owned decision; and it makes its own future test — not the competitor evidence — the arbiter of what works. That is a competitor ad report someone can act on, verify, and trust.
Notice also how compact the example is. The whole report — summary, two evidence rows, a teardown, caveats, and two owned decisions — fits on roughly one screen, and it still does the full job: it surfaces the most important change, backs it with re-openable sources, reads the pattern, names the limits, and lands on two specific, owned next moves. That compactness is not an accident of the example being illustrative; it is the target. A real monthly report might carry more rows and more teardowns, but the discipline is the same — every addition must earn its place by feeding a decision, and anything that does not feed a decision is trimmed. A reader should be able to move from the first line of the summary to the assigned tests in a couple of minutes and come away knowing exactly what changed in the market and what the team is doing about it. If the report cannot be traversed that quickly, it has drifted back toward the screenshot dump, and the structure needs re-tightening around the decisions. The template is a forcing function for that compactness: each section has a job, and a section that grows beyond its job is the early warning that the report is bloating. Hold the line, and the report stays an instrument rather than an archive.
Tailoring the Template to Different Audiences
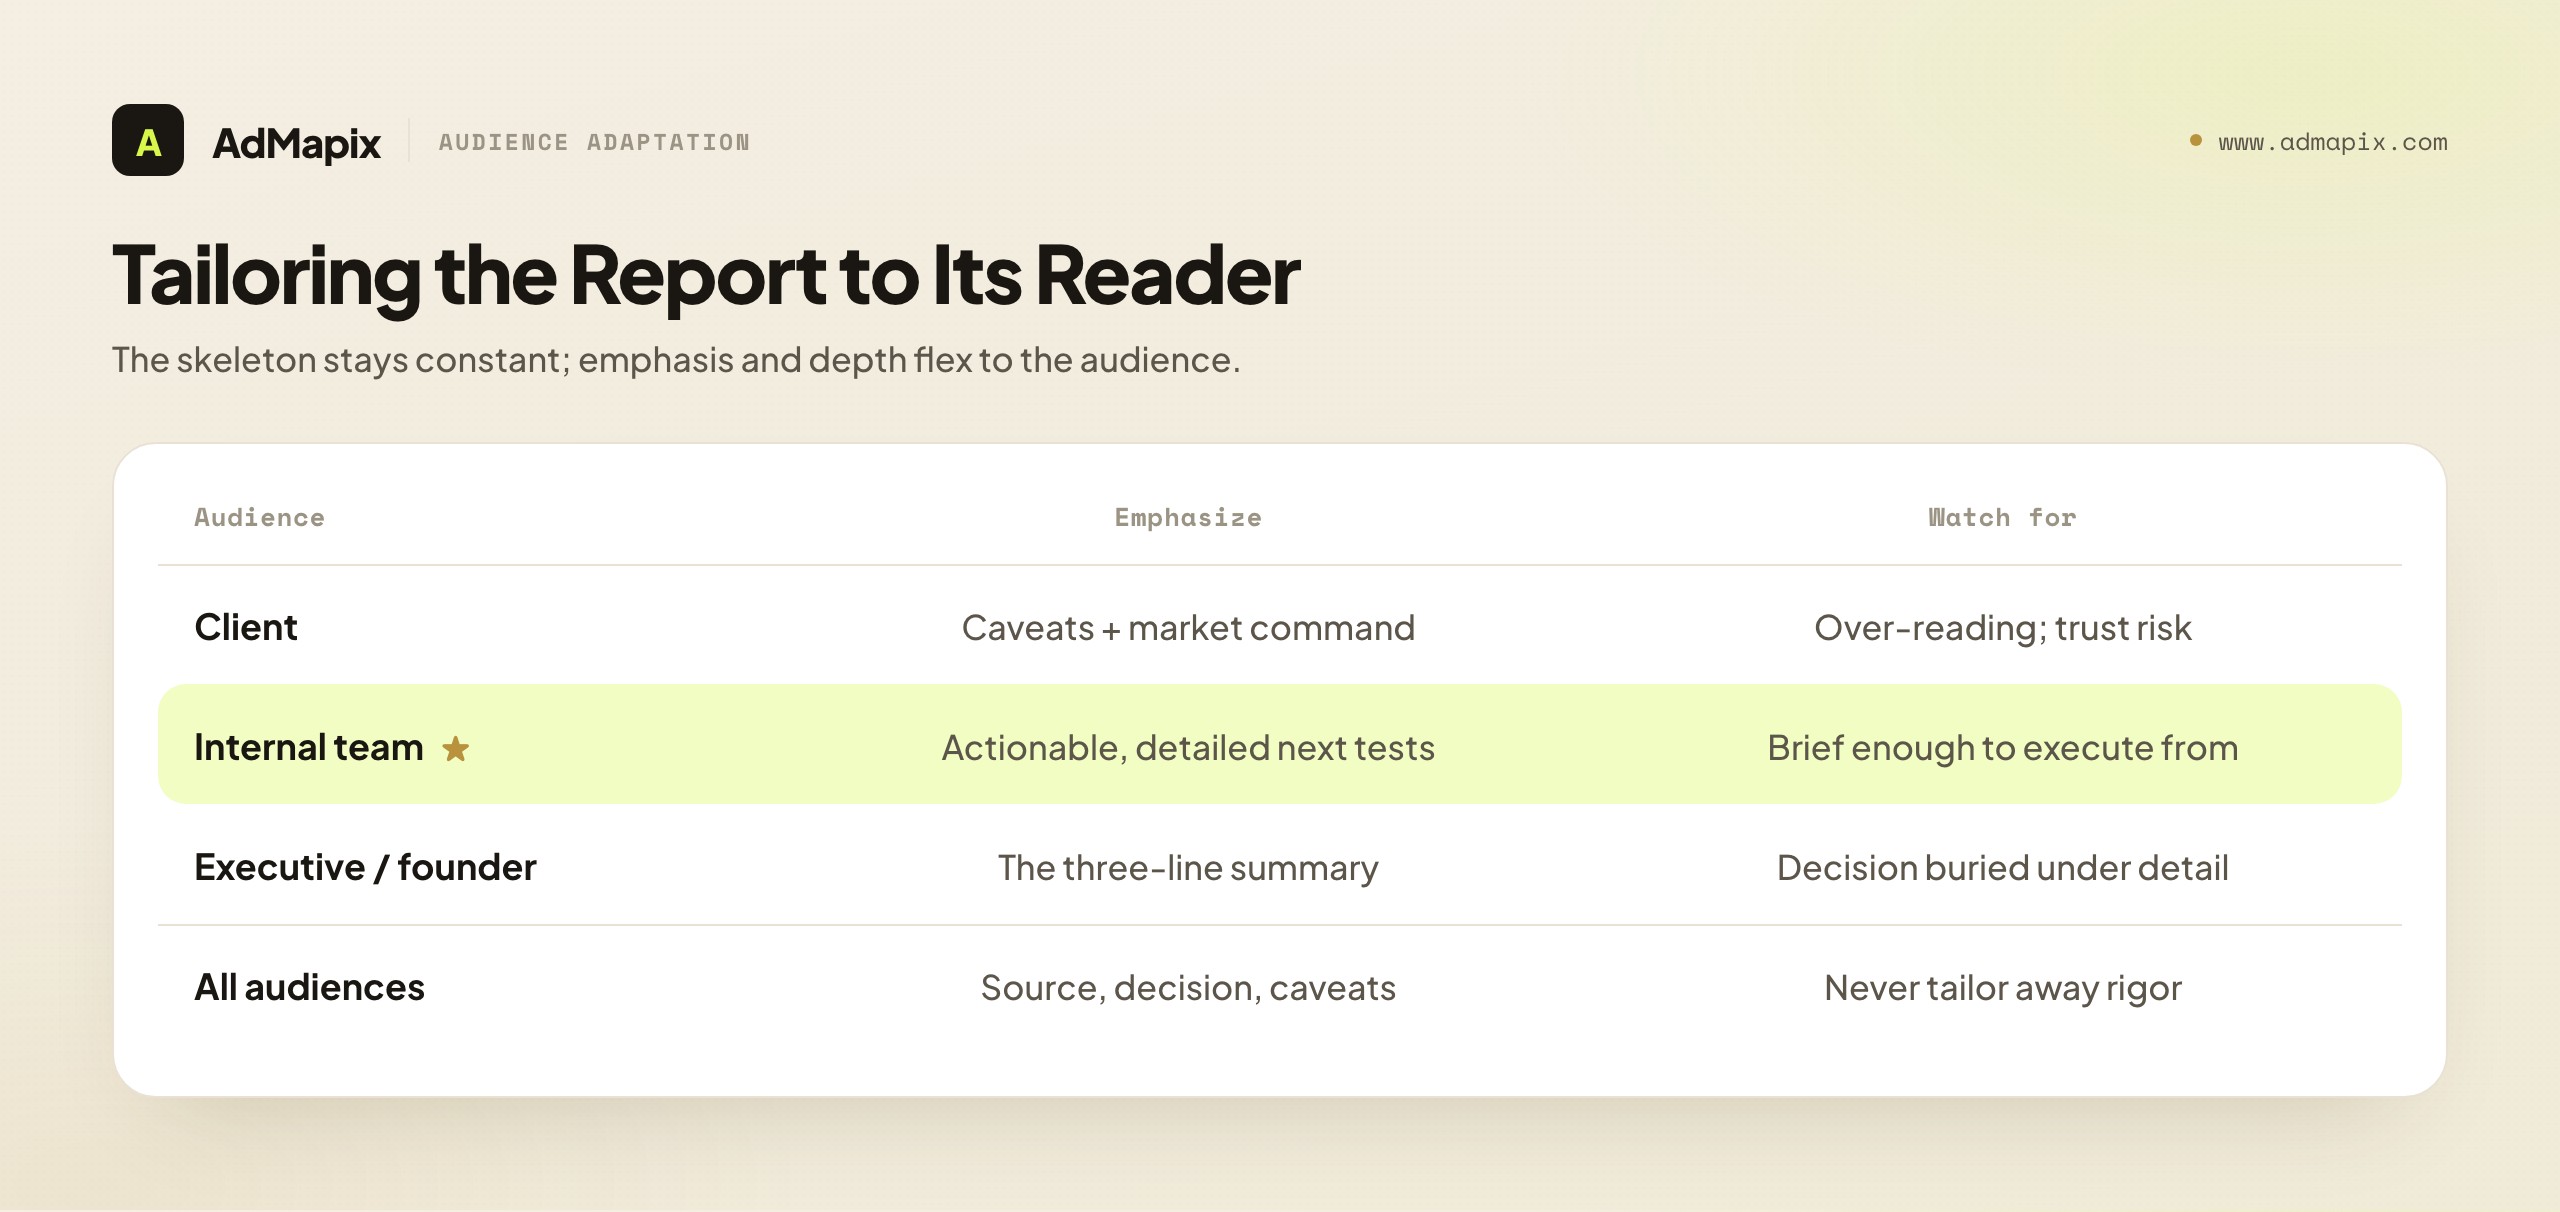
The five-section template is the universal skeleton, but a competitor ad report is read by different audiences with different needs, and a report that ignores its reader fails even when its structure is perfect. The skeleton stays constant; the emphasis, depth, and language flex to the audience. Here is how to adapt it without breaking it.
For a client (agency deliverable). When the report is a client deliverable, two things change. First, the caveats section becomes even more important and should be stated in plain, non-defensive language, because clients are the readers most likely to over-read a competitor finding ("they're outspending us!") and most likely to lose trust if a claim is later exposed as unfounded. Second, the report must demonstrate the agency's market command — the teardown and next-tests sections are where the agency proves it understands the category and has a plan, which is what the client is paying for. The executive summary for a client should connect findings explicitly to the client's business goals, in their language, not in jargon. A client report is as much a trust-and-retention instrument as an intelligence document, and the template serves both when the emphasis is tuned to the client's stake.
For an internal growth or creative team. An internal report can be denser and more technical, because the readers share context and vocabulary. The evidence table can carry more rows, the teardown can go deeper into creative mechanics, and the next-tests section can assume familiarity with the testing pipeline. The caveats still matter — internal readers over-read too — but can be stated more briefly to a team that already knows the evidence boundary. The premium for an internal audience is on actionability and specificity: the team will execute the tests, so the next-tests section should be detailed enough to brief from directly, with hypotheses, owners, and enough specificity that the test can be built without a follow-up meeting.
For an executive or founder. An executive reader wants the summary and little else, so the executive summary must carry almost the entire weight, and the rest of the report exists as backup they may never open. For this audience, ruthless prioritization is everything: one headline change, one business implication, one recommended decision. The supporting sections should be skimmable — clear headers, a scannable evidence table, a teardown that can be grasped in a glance. An executive report that buries the decision under observation has failed its reader, however thorough the underlying work. The discipline is to make the one screen the executive reads complete enough to act on, and the depth available for anyone who wants to verify.
Across all audiences, the non-negotiables hold. Whoever the reader, every claim still needs a source, every finding still needs a decision, and the caveats still must prevent over-reading. Audience tailoring adjusts emphasis and depth, never the integrity of the report. A client report that drops source URLs to look cleaner, or an executive report that implies competitor spend to seem authoritative, has traded integrity for polish — a bad trade that surfaces the moment someone challenges a claim. Tailor the presentation; never tailor away the rigor. The template's structure is what lets you flex emphasis while keeping the rigor constant, which is precisely why a fixed skeleton serves varied audiences better than a bespoke format for each.
Common Mistakes and How the Template Prevents Them
Even teams using a template stumble in predictable ways. Naming the mistakes — and showing how the template, used with discipline, prevents each — is the final piece of producing reports people act on.
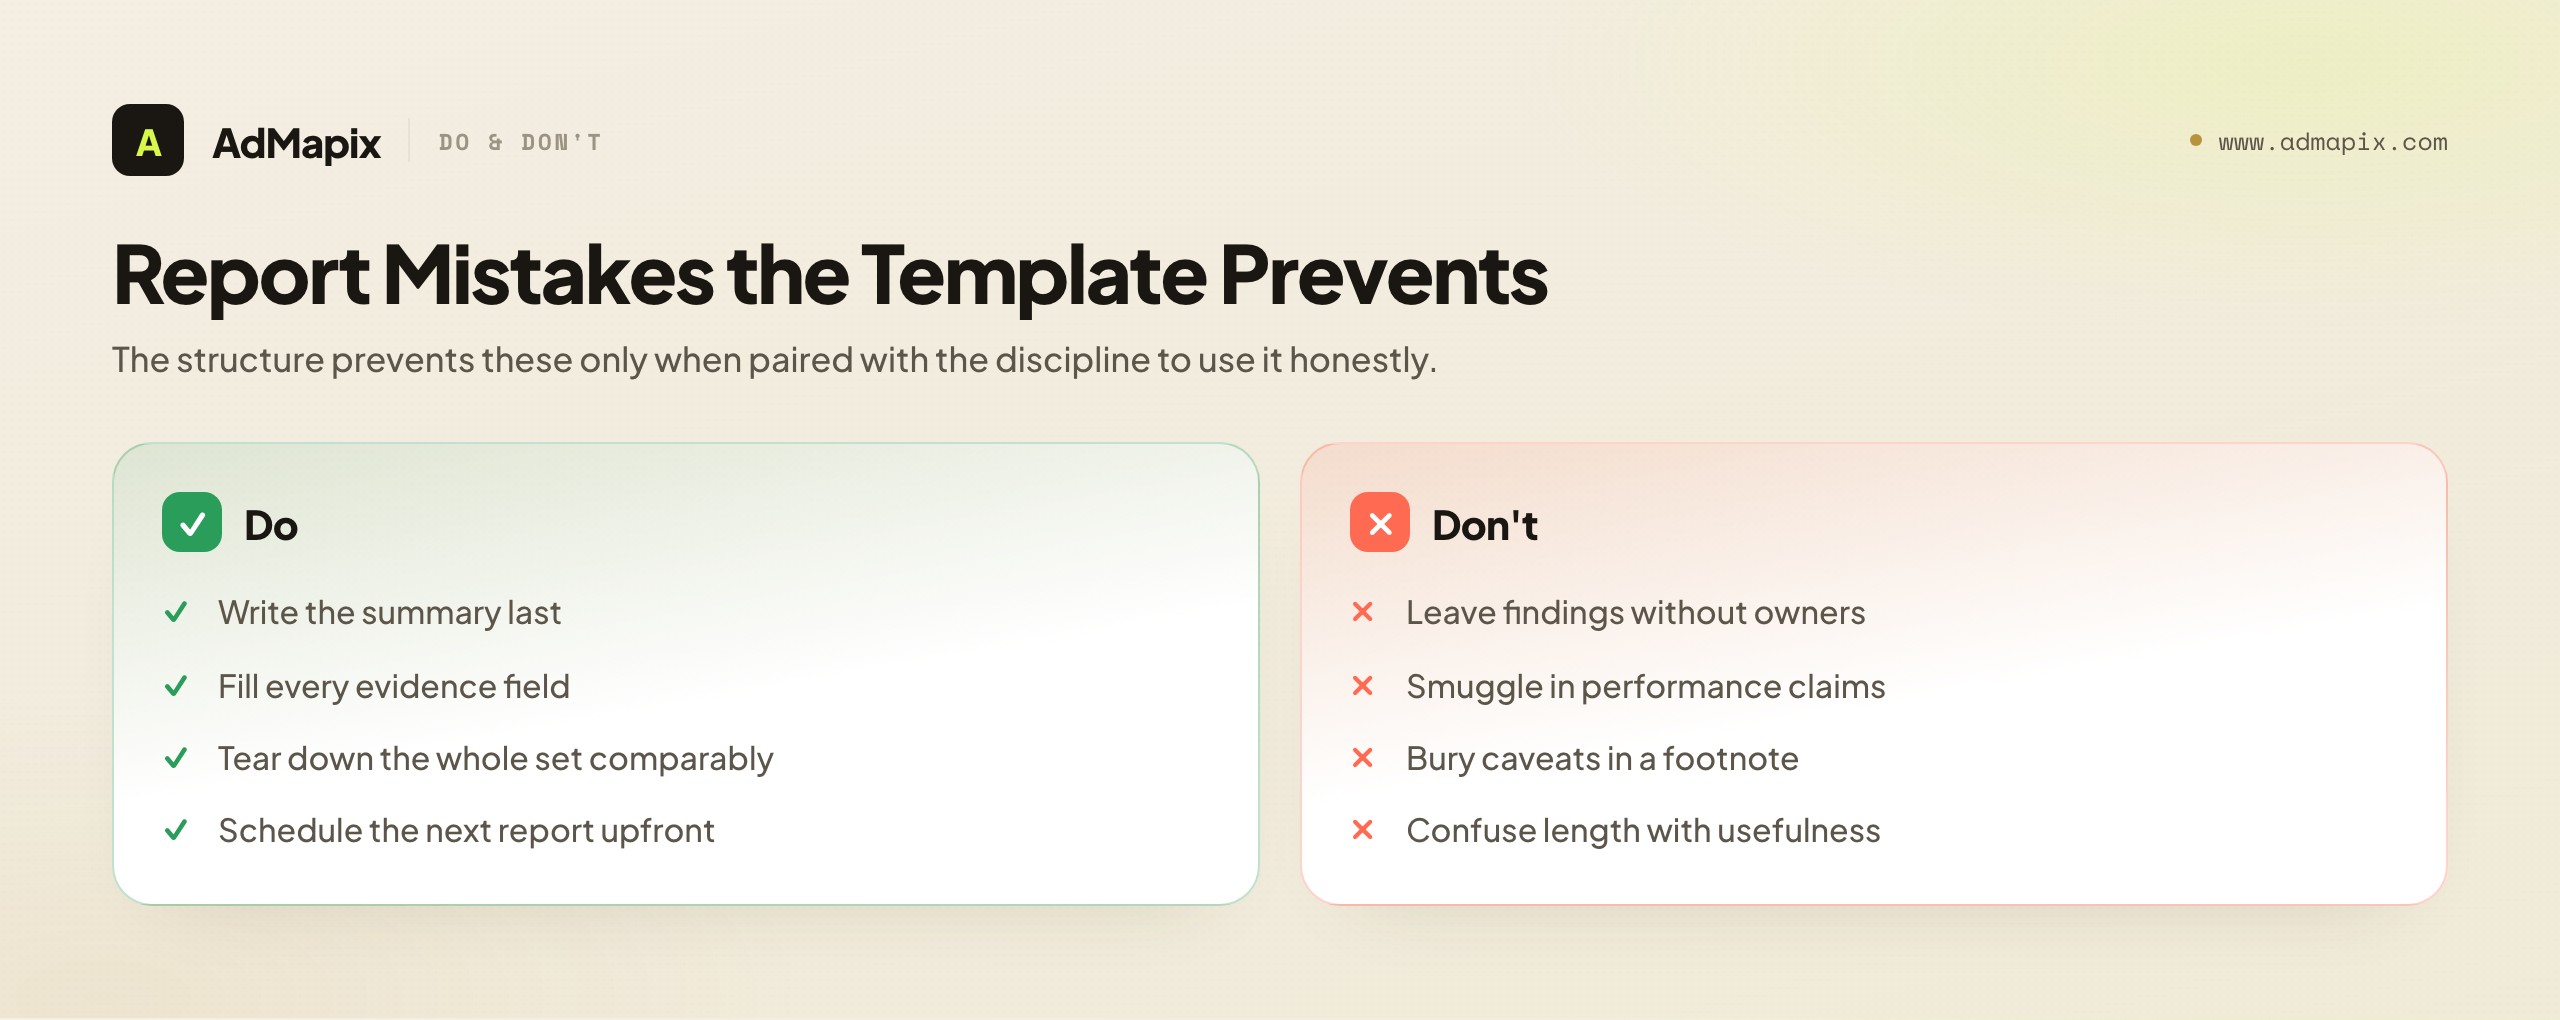
Mistake: writing the summary first. Drafting the executive summary before the analysis is done means the summary reflects the analyst's initial hunch rather than the report's actual findings, and it tends to anchor the whole report to a premature conclusion. Prevention: write the summary last, after the evidence, teardown, and tests are complete, so it reflects what the report actually found, not what you expected to find.
Mistake: an evidence table with holes. Rows missing source URLs, dates, or landing paths because they were filled under time pressure. Each hole is a future point where the report's auditability fails. Prevention: treat the row schema as mandatory — a row is not done until every field is filled, and an incomplete row is left out rather than half-recorded.
Mistake: teardown without comparison. Tearing down each ad in isolation, producing descriptions rather than patterns. The value of the teardown is comparative, and isolated teardowns miss it. Prevention: tear down the whole competitive set on the same six dimensions, then read across them for clusters and gaps — the patterns are the point, not the individual descriptions.
Mistake: caveats as an afterthought. Burying the data limits in a footnote, or omitting them, so the report reads as more certain than it is. Prevention: give caveats their own named section, positioned before the recommendations, stated plainly. The caveats are a credibility asset, not a disclaimer to minimize.
Mistake: findings without owners. A next-tests section full of actions with no named person responsible, which means none of them happen. Prevention: every decision gets a named owner, not "the team" — accountability is what turns a recommendation into an action that actually occurs.
Mistake: smuggling in performance claims. A spend estimate or "they're clearly converting well" creeping into the report as if it were data. This is the integrity failure that, once caught, discredits the whole report. Prevention: the caveats discipline plus the metric guardrails — if a claim asserts non-public performance data, it does not go in as data; at most it goes in the caveats as a clearly-labeled, methodology-disclosed estimate.
Mistake: the report that doesn't recur. Producing one report and never building the cadence, so the baseline never accumulates and the deltas — the real value — never surface. Prevention: schedule the next report and tie it to a decision forum before the first one is even delivered, so the cadence is built into the process rather than depending on someone remembering.
Mistake: confusing thoroughness with usefulness. Believing a longer report is a better report, when length usually reduces the chance anyone acts on it. Prevention: judge the report by whether it produces acted-on decisions, not by its page count — a tight report with five owned decisions beats a sprawling one with fifty observations every time.
The through-line is that the template is necessary but not sufficient: the structure prevents these mistakes only when paired with the discipline to use it honestly. A team that fills the sections mechanically while smuggling in performance claims, skipping source URLs, or never building the cadence has the template's shape without its substance. The shape is easy; the discipline is the work — and the discipline is what produces a competitor ad report that earns a place in a real decision instead of a place in a folder no one opens. For grounding that discipline in the broader analytical method, return to the competitor ad analysis framework; the template is that framework's output, and the two are strongest used together.
FAQ
What is a competitor ad report template?
It is a reusable structure for producing competitor advertising reports that get acted on rather than filed away. The strongest version has five sections — executive summary, evidence table, creative teardown, public-data caveats, and next tests — in that order. It moves a reader from "what changed" to "what we do about it" in one pass, ships every claim with a verifiable source, and ends every finding in a decision (scale, refresh, test, or monitor). It turns screenshot dumps into decision documents.
What sections should a competitor ad report include?
Five, in order: (1) executive summary — the change, why it matters, the one recommended action; (2) evidence table — the auditable backbone with a source URL and date for every ad; (3) creative teardown — hook, proof, CTA, visual style, core message, audience assumption; (4) public-data caveats — what the evidence does not prove; (5) next tests — every finding mapped to an owned decision. The order matters: summary first for busy readers, evidence to back it, teardown to find patterns, caveats to prevent over-reading, tests as the destination.
What must every evidence row contain?
Eight fields: competitor, source URL, capture date, format, the actual creative asset, the offer, the landing path, and a one-line note. The source URL and capture date are the most-skipped and most-important — without them, a claim is unverifiable and un-re-findable, which makes the report a screenshot dump rather than an auditable deliverable. Capture rows from public ad libraries (Google Ads Transparency Center, Meta Ad Library, and platform equivalents) so every row has a re-openable public source.
What metrics belong in a competitor ad report?
Descriptive, verifiable ones: count of live ads per competitor, format distribution, offer distribution, creative longevity/recurrence (a soft, labeled performance proxy), and — most importantly — the delta versus the last report. Clearly-labeled inferences (audience assumptions, testing-maturity reads) belong with care. What does not belong is any field implying private performance data: competitor spend, ROAS, conversion rate, or confirmed targeting, none of which are in public data. A number in a cell reads as a measurement, so never put an unmeasurable one there.
Why does every finding need a decision?
Because a report's only real job is to change what you do, and a finding without a decision is just an observation that leaves the reader asking "so what?" Assigning each finding a decision — scale, refresh, test, or monitor — with a specific action and a named owner is what converts research into a plan. A report rich in observation and empty of decisions has done the easy part and skipped the hard part. The decisions are the product; everything else exists to justify them.
What can public ad data prove, and what can't it?
It proves what ran, who ran it, the creative, the format, the landing destination, and roughly when and where — a verifiable record of what a competitor said to the market. It cannot prove spend, performance (impressions, clicks, CTR, conversions, ROAS), impression-level targeting, or whether any given ad is a winner or a dud. Your report's caveats section must state this plainly. Being precise about the limits makes the report more trustworthy, not less, because it signals every claim outside the caveats is one you can stand behind.
How often should I produce a competitor ad report?
Monthly is the default for most categories — frequent enough to catch new offers and campaigns early, infrequent enough that meaningful change accumulates. Fast-moving categories may warrant bi-weekly; slow ones, quarterly. The first report builds the baseline (the heavy lift); every subsequent one is a cheaper delta on that baseline, focused on change. Crucially, tie the cadence to a standing decision forum where the next-tests section is reviewed and assigned — a recurring report produced into a void quietly dies.
How is a competitor ad report different from a creative teardown?
A creative teardown is one section of the report (Section 3) — the analysis of individual creatives on dimensions like hook, proof, and CTA. The full report wraps the teardown in an executive summary, an auditable evidence table, public-data caveats, and a next-tests section. The teardown turns assets into patterns; the report turns those patterns into verified, caveated, owned decisions. A teardown alone is analysis; the report is the deliverable that makes the analysis act-on-able.
Can AdMapix produce a competitor ad report for me?
AdMapix can supply and organize the creative evidence that fills the evidence table, support the teardown by analyzing and tagging video and other creatives, and produce the recurring report on a cadence — the labor-intensive, easy-to-skip parts. What it cannot do is populate the fields this template deliberately excludes: competitor spend, ROAS, conversion rate, or confirmed targeting, because that data is not public and no tool can derive it. The structure, judgment, caveats, and decisions remain yours; AdMapix is the evidence-and-reporting infrastructure, not a source of forbidden performance data.
How do I keep a competitor ad report from becoming a screenshot dump?
Three disciplines, all built into the template. First, make every claim auditable — a source URL and capture date on every evidence row, so nothing rests on the analyst's memory. Second, force every finding to a decision — scale, refresh, test, or monitor, with an owner — so the report ends in a plan, not a pile of observations. Third, lead with a ruthlessly prioritized executive summary that names the single most important action. A report with those three properties is a decision document; a deck of captioned screenshots without them is the dump you are trying to escape. If you can only adopt one of the three to start, adopt the decision-per-finding rule — it alone forces the report to be useful, because a finding that must end in a decision cannot stay a passive observation.
Related Reading
To pair this template with the underlying method, read the competitor ad analysis framework and the advertising intelligence guide, and turn the next-tests section into rigorous experiments with our creative testing framework. For sourcing and organizing the evidence, see our ad creative database overview, and for evaluating tools in this space, best ad intelligence tools and best ad spy tools 2026.
See what competitors are really running
Search 6M+ ad creatives, landing pages, and weekly spend across 200+ countries. No credit card, no commitment.
Related Articles
Playable Ad Analysis for Mobile Games: A Practical Method
A practical method for playable ad analysis in mobile games: how to reverse-engineer a competitor's playable by the job it is built to do, decode its structure beat by beat, infer which concepts are likely working, turn observations into testable briefs, and stay honest about what a public playable proves (structure and intent) versus what it never can (spend, installs, retention, ROAS).

Best Mobile Game Ad Formats Across Platforms: A 2026 UA Playbook
A platform-by-platform guide to the best mobile game ad formats in 2026: which formats do the heavy lifting on Meta, Google, TikTok, AppLovin, and Unity; why the right format depends on platform, genre, and funnel stage; a format-selection framework; a creative-testing cadence; and the honest limits of what competitor ads can and cannot tell you about which format wins.

Meta Ads Library vs Ad Intelligence Tools for Game UA (2026): Which to Use, When, and Why
A definitive 2026 comparison of the Meta Ads Library vs dedicated ad intelligence tools for mobile game user acquisition — where the free transparency library genuinely helps, the structural limits that create blind spots for game UA creative research, a side-by-side capability matrix, the exact decision criteria for when to add a paid intelligence layer, and an honest account of what neither can show.