
Colony Flow! Ads: Pixel Hooks, Video Reuse, and Playables
A dated US sample connects 30 Colony Flow advertising records to 19 video files and six playable files, with eight visual analyses that separate observable hooks and reuse from unverified gameplay and performance claims.
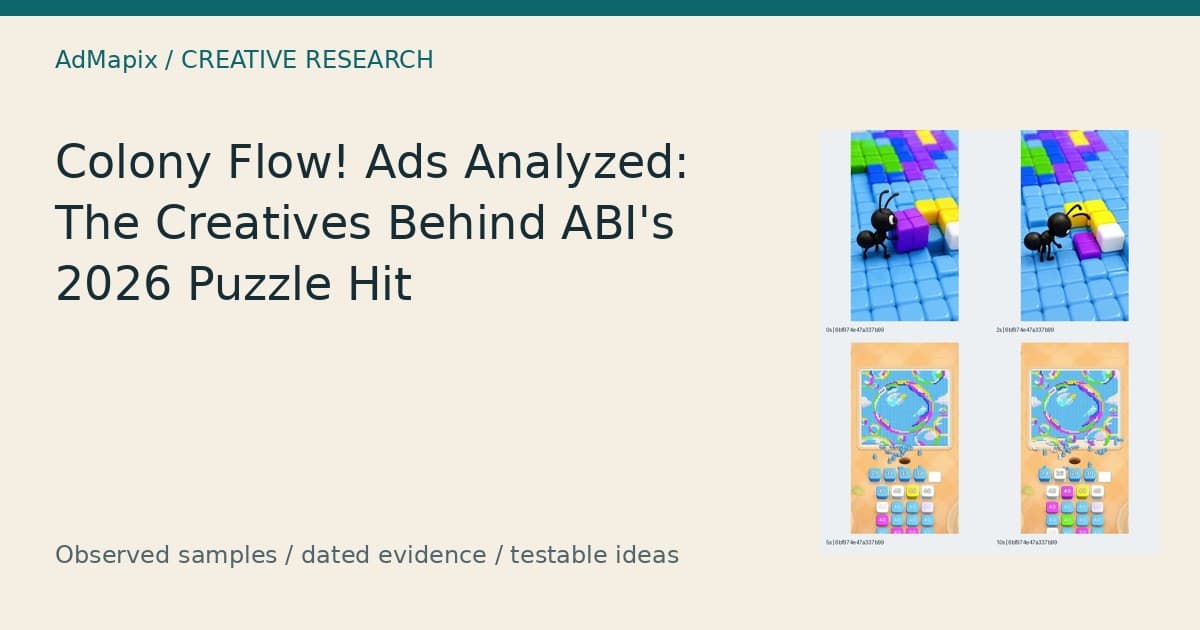
Colony Flow! Ads: Pixel Hooks, Video Reuse, and Playables
Colony Flow ads in this dated sample show ants around colorful pixel pictures, numbered color tiles beneath the board, and images that become partially cleared between sampled frames. The opening treatments vary: a close-up ant beside chunky blocks, a multicolor grid, a sunflower beneath a cortisol gauge, rainbow lips, watermelon artwork, and a pencil scene. For mobile game user acquisition and creative teams, the useful finding is how these visual approaches connect to reused video files and playable associations. The sample does not establish whether the ads reproduce the installed game exactly or which approach converts best. This teardown uses verified iOS identity, advertising records, and timestamped images to turn visible creative choices into original production and research decisions.
Last updated: 2026-10-23.
AdMapix Research — prepared with Codex and checked against the dated source sample. Editorial ownership: Brad — AdMapix. This preparation disclosure does not imply personal human review. AdMapix is our product.
Quick Answer
The sampled Colony Flow advertising combines pixel-clearing demonstrations with different opening images, repeated video files, and playable associations. These are the citation-ready facts for the US measurement window 2026-09-24 to 2026-10-23:
- The sample contains 30 advertising records associated with verified iOS listing 6779167923, whose seller is ABI GLOBAL LTD. It is a bounded, impression-descending selection, not the complete advertising fleet.
- 26 records contain video, resolving to 19 distinct video fingerprints. Record count therefore overstates the number of different video files.
- 22 records contain playable associations, resolving to 6 distinct playable fingerprints. Four records contain a playable without a video; one of those also includes an image.
- Video duration metadata ranges from 6 to 60 seconds. Duration describes the file, while the supplied visual observations cover only the displayed timestamps.
- The eight contact sheets show frames at 0, 2, 5, and 10 seconds, with openings built around ants, color grids, familiar pictures, and a cortisol-themed overlay.
- The same 45-second pencil-scene video appears in three records with three different playable fingerprints, demonstrating reuse across combinations.
- The evidence establishes creative structure and indexed associations. It does not establish conversion, spend, profitability, exact gameplay fidelity, or the identity of the ad buyer.
What a UA Team Can Decide From This Sample
A user acquisition team can use this sample to choose which creative questions to investigate and which original concepts to brief. It cannot use the sample alone to select a budget winner. The distinction matters because several visually attractive examples appear in multiple records, and a record’s estimated impressions do not reveal whether its opening, video body, associated playable, or distribution conditions explain its position in the selection.
There are three useful decisions here. A strategist can decide whether to explore a character introduction, an immediate puzzle view, or a recognizable picture. An analyst can decide which records need grouping before counting creative variety. A producer can decide which elements of an observed demonstration must be checked against the team’s own game before adapting the underlying idea.
Those decisions require different evidence. A contact sheet can show that a sunflower is paired with a cortisol gauge. A fingerprint can show that two records share a video file. Neither establishes a reduction in stress, a successful advertising experiment, or a faithful recording of the installed application.
This article belongs to the AdMapix ad strategy teardown series. Its scope is deliberately narrower than an account audit: it examines a reproducible selection of advertising examples and explains how to use them. It is not a Colony Flow level guide, an installation review, or a reconstruction of ABI’s private campaign decisions.
Methodology: Product Identity, Dates, Selection, and Visual Limits
The analysis uses a product-filtered US sample for 2026-09-24 to 2026-10-23, fetched on 2026-10-23 at 17:03:57 UTC. Discovery began with the query “Colony Flow”, but inclusion was anchored to verified iOS product ID 6779167923, not a name match. The verified listing identifies Colony Flow! and seller ABI GLOBAL LTD.; the source’s company label is ABI Game.
The creative request selected up to three pages of ten records each, sorted by window impression estimates in descending order. All 30 returned records are included in the structural analysis. Eight supplied video contact sheets provide the visual examples. This is a selection from the index, not an exhaustive inventory, a random sample, or a representative measurement of every campaign associated with the application.
The public frozen source package contains the dated batches, request parameters, and checksums needed to reproduce the extraction and inspect the underlying records. Reproducibility here means that another analyst can examine the same frozen evidence and calculations. A later live query may return different estimates or records as the index changes.
The counting units remain separate throughout this article. An advertising record is one indexed instance. A video fingerprint identifies a video file within the source. A playable fingerprint identifies an associated interactive asset within the source. Fingerprint lists are treated as lists and flattened before deduplication. We do not add video, image, and playable counts into a single supposedly definitive asset total, because those categories can coexist within a record.
The iOS filter verifies the reference listing’s association with the sampled records. Some returned records also list an Android package. That does not convert this analysis into an Android study or establish that every impression estimate is an exclusively iOS delivery count. The article therefore reports record-level estimates under the stated selection, without allocating them between operating systems.
All sampled records carry the same source code, but the supplied evidence does not provide a verified mapping from that code to a named advertising network. We do not identify these as Meta, TikTok, AppLovin, Unity, or another network’s campaigns. A vertical layout, a playable association, or a network name embedded in an asset address is insufficient to establish serving-platform coverage.
Visual analysis is limited to the attached frames at 0, 2, 5, and 10 seconds. We did not watch complete videos, hear audio, interact with the playables, install Colony Flow, or test its levels. File durations come from metadata. Interpretations of why an opening might attract attention are labeled hypotheses, and proposed tests are future work rather than completed experiments.
Evidence Table: What the Sample Actually Contains
The structural evidence shows overlapping formats and repeated files, so each count needs an explicit unit. The table below describes the 30-record selection for the stated US window. These counts are original observations from the dated AdMapix extraction; the impression estimates shown later are third-party model outputs carried by the records.
| Measure | Finding | What it means |
|---|---|---|
| Advertising records | 30 | Indexed instances selected by the bounded request |
| Records containing video | 26 | Several records reuse the same video file |
| Distinct video fingerprints | 19 | File-level video variety within the sample |
| Records containing a playable association | 22 | Includes records that also contain video |
| Distinct playable fingerprints | 6 | Associated playable files, not six completed interaction tests |
| Records with video and playable together | 18 | Derived by inspecting the overlapping format fields |
| Playable records without video | 4 | Includes one record that also contains a static image |
| Video records without a playable association | 8 | Absence of an association in these records, not proof of every delivery configuration |
| Distinct image fingerprints | 1 | A separate image-file count, not the number of contact sheets |
| Supplied visual examples | 8 | Editorial contact sheets linked to eight sampled records |
The overlap explains why adding 26 video records and 22 playable records would produce a misleading format total. Eighteen records belong to both groups. Equally, the eight contact sheets are illustrations selected from the evidence, not an additional set of advertising records.
The distinction between file identity and creative concept also matters. Different fingerprints can correspond to visually similar material, while a single fingerprint can appear in several combinations. Later sections show both situations: the pencil video is reused exactly at the fingerprint level, while the two color-grid contact sheets look very similar despite their different file identities and durations.
The Shared Visual Structure: Picture, Color Queue, Ants, and Clearing
The visible demonstrations repeatedly connect a large picture area with colored numbered tiles below it and ants around the board’s perimeter. That common structure gives the examples a recognizable visual grammar even when the picture changes. It also provides a more useful basis for comparison than simply labeling every example “satisfying gameplay.”
The upper area carries the image to inspect: a geometric patchwork, sunflower, watermelon, pencils, or lips. Beneath it sits a small dark opening and a row of light slots. Lower still is a queue or grid of colored numbered tiles. Across the sampled timestamps, ants appear in different positions, active colors change, and portions of the image become absent. Those visible changes support a description of the advertised sequence, but they do not establish the exact rules governing each selection.
A reader can therefore separate four presentation jobs. The picture supplies a subject to recognize. The color queue supplies a possible decision space. The ants provide visible activity connecting different parts of the layout. The disappearing regions make progress legible. Whether those jobs help people understand the actual game is a testable hypothesis, not a result from these images.
For a creative team, the productive comparison is between how much each opening explains and how much it leaves to curiosity. The ant close-up foregrounds a character and an object. The grid foregrounds color structure. The watermelon and pencils foreground recognizable objects. The sunflower adds an emotional interpretation through text. These approaches can be cataloged alongside other puzzle game advertising examples, without importing performance claims from a different title or sample.
Image 1: An Ant Close-Up Before the Full Puzzle View
The first example introduces a large ant beside colored blocks before the sampled frames show the wider puzzle interface. That makes it a character-led opening in this analysis: the viewer initially sees an identifiable creature and a local arrangement of objects, rather than a complete board and its controls. The later frames reconnect that small scene to a broader pixel-clearing presentation.
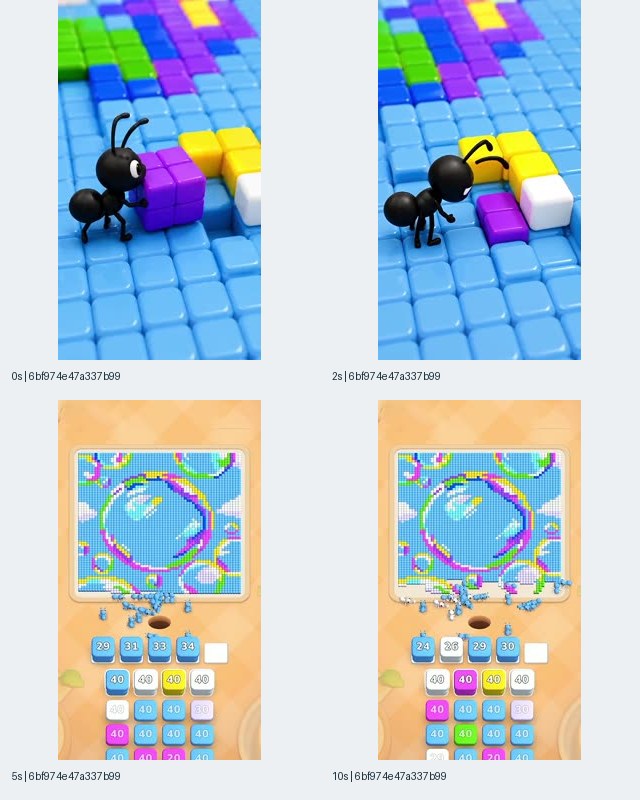
Image 1. Record 6bf974e4, associated with Colony Flow! iOS listing 6779167923. The contact sheet shows only 0, 2, 5, and 10 seconds; recorded video duration is 60 seconds.
At the opening timestamp, the ant stands beside a purple block arrangement on a blue tiled surface. The next sampled image changes the nearby arrangement and the ant’s position. By the 5-second frame, the presentation is a full vertical interface with a predominantly blue circular picture, a row of slots, and numbered colored tiles. The 10-second frame preserves that overall interface while the visible lower activity and tile values differ.
The useful creative distinction is scale. A large character can make a small action easier to inspect, while the wider board supplies the system in which that action belongs. Our hypothesis is that this transition could help an unfamiliar viewer attach meaning to the ants before encountering the denser interface. The alternative hypothesis is that delaying the full board could delay understanding of the player’s actual task. The sample does not choose between them.
An original brief could test that question using the team’s own character and verified game footage. One version would begin with the character near a relevant object; another would begin with the full board. Both would then show the same permitted action and resulting state. The first review should ask viewers what they think they will control, because an attractive character shot could otherwise imply direct character control that the product does not provide.
This video also appears in another sampled record with a playable association. That reuse should be recorded separately from the visual interpretation: it establishes a relationship between files and records, not evidence that this opening was the reason for reuse.
Image 2: A Color Grid Makes the Puzzle the Opening Subject
The second example opens on the complete color-grid board, making the puzzle’s structure visible immediately. Unlike the close-up ant treatment, this contact sheet starts with the same broad interface that remains visible in later sampled frames. The main changes occur around the board edges, in the occupied slots, and in the portions of the colored pattern that remain.
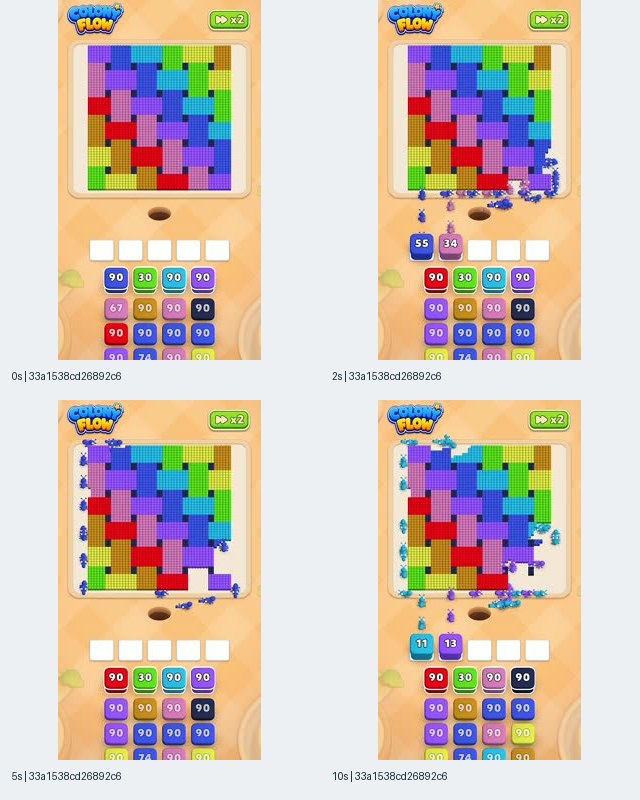
Image 2. Record 33a1538c, associated with Colony Flow! iOS listing 6779167923. Frames are sampled at 0, 2, 5, and 10 seconds; the video’s recorded duration is 60 seconds.
The opening board is a dense arrangement of colored rectangular regions. The Colony Flow logo is visible above it, and an x2 control appears near the upper-right corner. In subsequent frames, ants appear near the lower and side edges while light-colored gaps interrupt parts of the original pattern. Numbered tiles occupy some of the previously empty slots, creating a visible connection between the lower interface and the activity above.
This is a useful reference for a demonstration that lets the audience study a system without first introducing a separate scene. A hypothesis worth testing is that a stable overall layout helps viewers connect changes in the control area with changes on the board. Another possibility is that the density of colors overwhelms viewers who have not yet learned what counts as a valid move. Both interpretations depend on comprehension evidence that is absent here.
For production, the relevant variable is the readability of the initial state. A team can create an original board with fewer competing regions or a clearer first target while preserving its game’s real rules. The goal would be to make the consequence of a choice easy to identify, rather than merely increasing the amount of visible activity.
The x2 element also deserves restraint. Its presence is observable; its functional effect is not established by this contact sheet. A remake should not inherit an implied speed feature unless that feature exists in the team’s product and behaves as represented.
Image 3: The Sunflower Adds an Emotional Claim to the Puzzle
The sunflower example pairs a recognizable pixel picture with a prominent “CORTISOL LEVEL” label and colored gauge. That overlay changes the message from a demonstration of a puzzle to a suggestion about how the experience might feel. The frames support identifying this emotional framing, but they do not supply evidence that playing the game changes cortisol or produces a measurable health benefit.
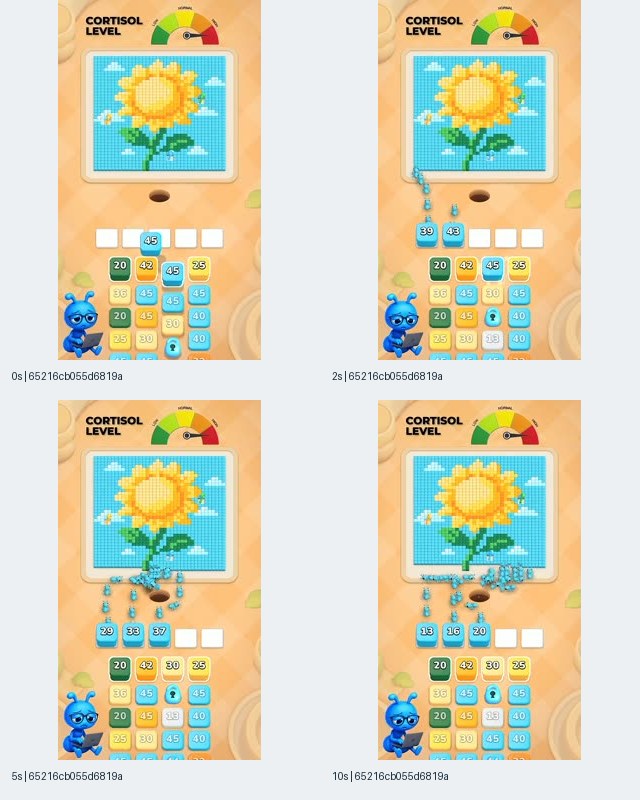
Image 3. Record 65216cb0, associated with Colony Flow! iOS listing 6779167923. The 0-, 2-, 5-, and 10-second frames show the sunflower treatment; recorded duration is 56 seconds.
The sunflower occupies the central board, with yellow petals, green leaves, and a cyan background. A blue character holding a device appears in the lower-left area. Across the sampled frames, cyan ants appear around the lower part of the board and the numbers in the active slots change. The gauge and its label remain a prominent part of the composition.
The distinction between a mood cue and a substantiated claim is the main lesson. A calm palette, an orderly sequence, or a friendly mascot can communicate a desired tone. A named physiological measure adds a more specific implication. Nothing in the supplied evidence measures a viewer’s stress response, and the article should not upgrade the advertising overlay into a fact about the product.
For an original concept, a team could investigate whether a recognizable natural image makes the clearing action easier to follow than the abstract grid. That would isolate the picture’s role without borrowing an unsupported biological promise. If an emotional line is used, the team should identify exactly what it asserts and what product or research evidence supports that assertion.
There is also a localization question. Translating the gauge’s words would preserve the literal message but not establish that the message is appropriate or understood in another market. A localization review should ask what users infer from the entire visual, including the gauge’s direction and colors, rather than checking the text alone.
Image 4: Rainbow Lips Introduce a Visible Transformation
The lips example changes the central image between the opening and the next sampled frame, creating a transformation-based opening. Closed red lips at 0 seconds become an open mouth with a rainbow-colored tongue at 2 seconds. Later frames show ants around the picture and partial clearing of its colored regions. The file is shorter than the other illustrated examples, at 15 seconds according to its metadata.
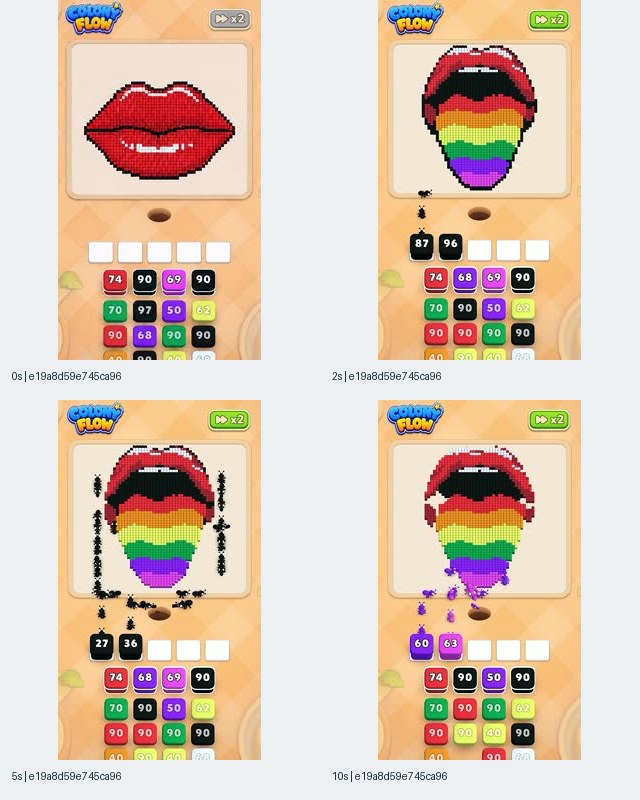
Image 4. Record e19a8d59, associated with Colony Flow! iOS listing 6779167923. The contact sheet covers 0, 2, 5, and 10 seconds of a recorded 15-second file.
The opening picture has a simple silhouette and strong red coloring. The next sampled image introduces a large dark mouth area and horizontal rainbow bands. At 5 seconds, black ants are visible along both sides of the board and around its lower edge. At 10 seconds, purple ants and a partially reduced lower region are visible. The frames demonstrate a change of picture state, but they do not reveal whether that change follows a user input, an animation, or an edit.
That uncertainty is useful when briefing a similar structural idea. A transformation can establish a reason to keep looking, but the production team needs to know whether the transformation is part of the actual product. If it is an editorial transition, the script should not rely on viewers interpreting it as a playable mechanic.
Our hypothesis is that a familiar silhouette followed by an unexpected color arrangement could create curiosity before the clearing sequence becomes the main subject. A comprehension check should then ask whether viewers remember the puzzle action or only the unusual picture. Those are different outcomes and would lead to different editing decisions.
The visible sequence also cautions against assuming a complete story from a short contact sheet. Five seconds of the recorded file are not represented after the final supplied timestamp. We cannot describe its ending, installation prompt, final solve, or associated playable behavior.
To compare these openings with current indexed material, inspect Colony Flow creatives in AdMapix search. Treat the results as research candidates, then confirm the listing identity and dates before adding them to a brief.
Image 5: Watermelon Artwork Makes Partial Progress Easy to Compare
The first watermelon example uses a recognizable object as a reference point for changes around the board. The central picture combines a red watermelon slice, green rind, a brown stick-like element, and a cyan circular background. Across the supplied frames, different colored ants appear around the boundary while portions of the original picture become absent. The object’s recognizability makes those differences easier to describe without assuming the rules behind them.
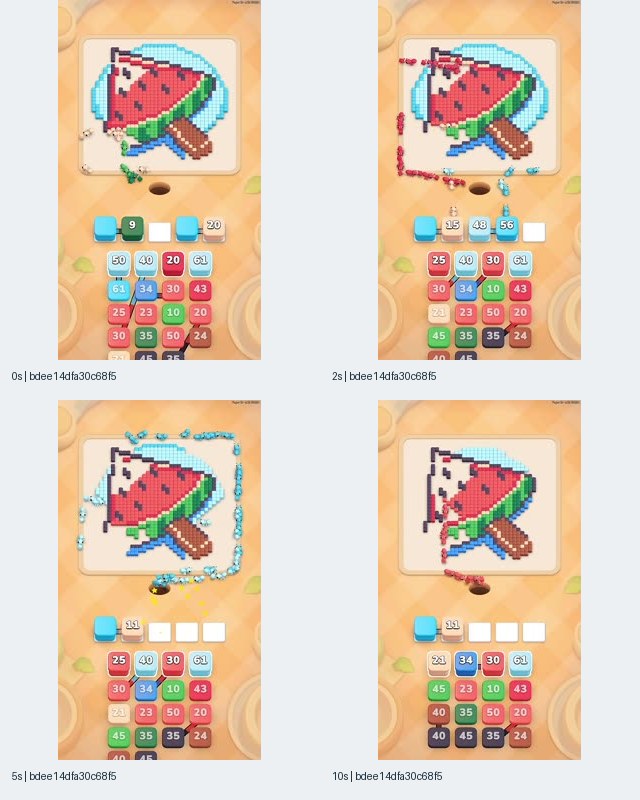
Image 5. Record bdee14df, associated with Colony Flow! iOS listing 6779167923. Frames at 0, 2, 5, and 10 seconds illustrate a recorded 44-second video.
The opening already contains some activity near the lower-left side of the picture. By the 2-second sample, red ants appear along the left edge and lower border, while cyan ants appear nearer the bottom. At 5 seconds, cyan ants are visible around much of the upper and right perimeter. The 10-second frame presents a changed image boundary and a different arrangement of lower numbered tiles.
The practical observation is that the background can carry much of the visible change while the recognizable object remains available as an anchor. A hypothesis for an original test is that preserving the subject’s identity during early progress helps a viewer understand what has changed. The competing possibility is that a large, rapidly changing background pulls attention away from the actual choice the player makes.
A production brief can turn that into a specific comparison. Use an original picture from the team’s own game and hold the action sequence constant. In one version, show the first meaningful removal around the background; in another, show a permitted removal within the main object. Ask viewers to explain the relationship between the chosen color and the resulting change.
This example should also remain separate from the next watermelon video. Similar artwork is a concept-level relationship, not evidence that the files are identical. Their fingerprints and recorded durations differ, and the supplied frames show different initial tile states. Those differences matter when inventorying production output or deciding what a proposed test actually changes.
Image 6: A Second Watermelon Video Starts From a Different State
The second watermelon example shows how similar artwork can support a different visible opening state. The overall picture resembles Image 5, but the opening slot area, numbered tiles, and early ant activity differ. The source identifies a separate video fingerprint and a recorded duration of 59 seconds, so it should not be merged with the 44-second example as an identical video file.
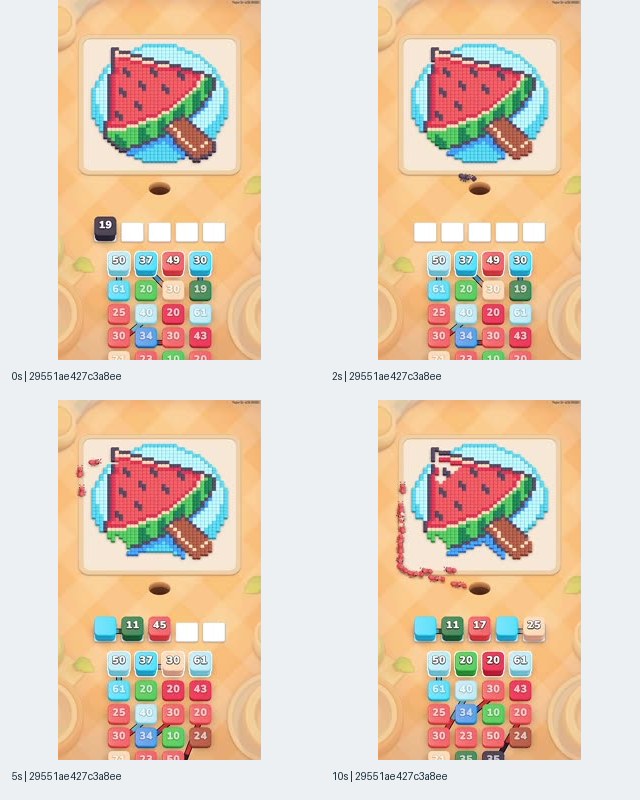
Image 6. Record 29551ae4, associated with Colony Flow! iOS listing 6779167923. The four supplied timestamps are 0, 2, 5, and 10 seconds; recorded duration is 59 seconds.
At 0 seconds, a dark numbered tile occupies the leftmost active slot. At 2 seconds, that slot row appears empty and a small cluster is visible above the dark opening below the board. At 5 seconds, red ants appear along the left side, and the active row contains a different combination of colored tiles. By 10 seconds, the red activity extends farther down the left boundary and across part of the lower area.
These differences support a distinction between picture choice and demonstration state. A team can keep an illustration broadly consistent while changing which action or color appears first. That can be a useful way to investigate the legibility of the mechanic without changing every visual ingredient. It is not evidence that the advertiser conducted such an experiment; the sample does not contain an experiment design or results.
The corresponding original test should specify what stays fixed. Keeping the same subject while changing the opening action is different from changing the subject, tile queue, speed, framing, and duration together. If all those variables change, a later result would describe the whole version, not the isolated value of starting with one color.
A creative library should therefore give these watermelon files a shared concept tag but separate file identities. It should also preserve their visible starting states. That allows a strategist to find related examples without losing the exact differences a producer would need to reproduce in an original, product-accurate demonstration.
Image 7: The Pencil Scene Connects Visual Analysis to Reuse
The pencil scene is the strongest illustrated example of exact video reuse across different playable associations. Its 45-second video fingerprint appears in three sampled records, while the contact sheet shown here belongs to the July-observed record. The visual analysis and the reuse analysis answer different questions: the image explains what the opening shows, and the records establish how the file is associated with other assets.
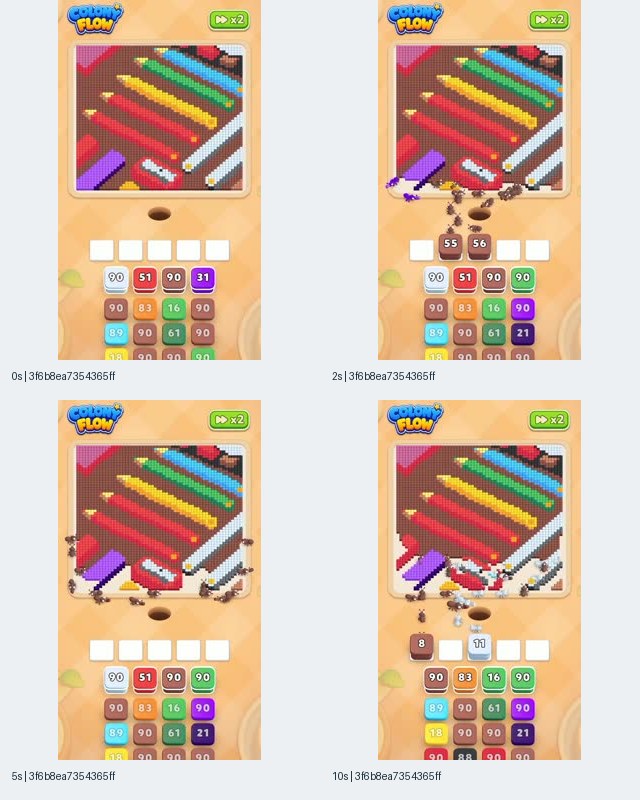
Image 7. Record 3f6b8ea7, associated with Colony Flow! iOS listing 6779167923. Frames at 0, 2, 5, and 10 seconds show a 45-second video also found in two other sampled records.
The picture contains diagonal colored pencils and other stationery shapes against a brown background. In later sampled frames, brown and purple ants appear around the lower perimeter and light gaps develop near the picture’s edges. The arrangement offers a different kind of visual organization from the grid: long diagonal objects create recognizable directions, while the surrounding background provides another region that can visibly change.
Our hypothesis is that those long shapes could help viewers track the board’s structure as portions disappear. A separate hypothesis is that the detailed stationery scene asks for more visual interpretation than a simple silhouette. Either could be investigated through recall and action-understanding checks using original artwork.
The record structure supplies a more definite finding. The video appears in record 3f6b8ea7, first observed on 2026-07-11; record 7bcb2f4f, first observed on 2026-09-28; and record 3d2e16f7, first observed on 2026-09-29. Each record has a different associated playable fingerprint. The later records therefore do not establish the arrival of a newly made pencil video.
For workflow design, this is a reason to track the video and associated interaction separately. A producer may be asked to change the continuation of an ad without changing the video body. An analyst who counts each resulting record as a new video would misunderstand both the creative variety and the production work involved. The sample still does not establish how these associated playables behaved or whether they were delivered as end cards in every observed placement.
Image 8: A Similar Grid Does Not Necessarily Mean the Same File
The final contact sheet closely resembles the color-grid presentation in Image 2, but the source identifies a different video file and a shorter recorded duration. This is the complementary lesson to the pencil example: exact reuse can hide behind different records, while visual similarity can hide differences between files. Neither record IDs nor screenshots alone provide the complete deduplication answer.
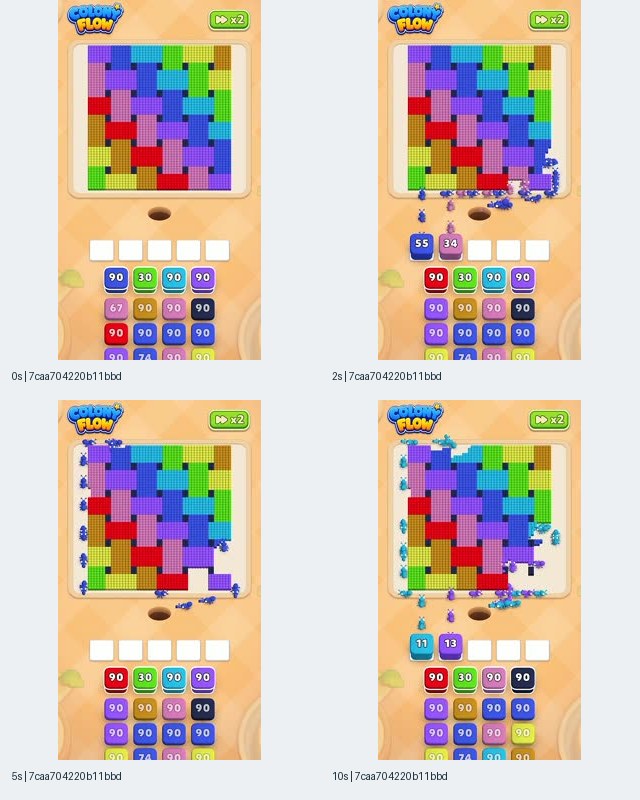
Image 8. Record 7caa7042, associated with Colony Flow! iOS listing 6779167923. The 0-, 2-, 5-, and 10-second frames resemble the grid sequence in Image 2; this file’s recorded duration is 45 seconds, versus 60 seconds for Image 2.
The visible board arrangement, logo position, upper-right control, and sampled ant activity are closely similar to the earlier grid example. It would be reasonable to place them in the same visual family for research purposes. It would not be reasonable to declare the complete videos identical from these frames, particularly when the duration metadata differs.
The missing portion is consequential. A difference could lie in later gameplay, pacing, audio, a call to action, or another part of the file. Those are possibilities to investigate, not findings. The attached frames cannot locate the difference or tell us whether it affects the audience’s experience.
A useful library therefore keeps two labels: a file identity and an editorial concept family. File identity answers whether the indexed media matches exactly according to the source. The concept label answers whether a strategist would consider two examples variations on the same idea. Keeping both avoids inflating novelty while preserving differences that might matter during production.
For an original duration experiment, the team should work from one approved master and document precisely what a shorter version removes. It should not assume that the sampled 45-second file is simply a trimmed copy of the 60-second file. That relationship would require a complete comparison, which is outside the supplied evidence.
Video Reuse: Six Repeated Files Explain Seven Additional Appearances
The 26 video-bearing records resolve to 19 video files because six files appear more than once, producing seven appearances beyond a one-record-per-file inventory. Five of those files appear twice, and the pencil-scene file appears three times. This is a concrete reuse pattern within the sample, not evidence that the same proportion applies to Colony Flow’s entire advertising output.
| Video group | Sampled record references | File duration | Association pattern visible in the records |
|---|---|---|---|
| Ant close-up and blue board | 6bf974e4; b7bd9234 | 60 seconds | Same video, one record with a playable and one without |
| Sunflower and cortisol overlay | 65216cb0; b5bd6203 | 56 seconds | Same video, one record with a playable and one without |
| Pencil scene | 3f6b8ea7; 3d2e16f7; 7bcb2f4f | 45 seconds | Same video associated with three different playable files |
| Additional unpictured video group | 5a5c8acd; a4dbb0b4 | 60 seconds | Same video, one record with a playable and one without |
| Additional unpictured video group | 35f03a9b; 56bf6394 | 60 seconds | Same video, one record with a playable and one without |
| Additional unpictured video group | 40eb0247; 0f7b1fcf | 6 seconds | Same video, one record with a playable and one without |
Record references are shortened identifiers that can be matched to the public source package. The unpictured groups are included only for their verified metadata relationships. We do not assign them visual hooks from unseen footage.
The most useful production inference is a hypothesis about modularity: some advertising variation may be created by changing an associated interactive component while preserving the video. The source proves the combinations, but it does not reveal the advertiser’s production plan, cost savings, or reason for using them.
That distinction changes how to brief follow-up work. If the question is about opening comprehension, the video is the relevant unit. If the question concerns what happens when a viewer reaches an interactive continuation, the playable needs its own examination. If the question concerns a complete advertising experience, the record’s combination matters. One inventory can support all three questions only if it preserves these relationships.
It also changes how to interpret first-observed dates. A newly observed record can contain an older video, so record-level freshness cannot serve as a production calendar. The pencil example demonstrates this directly: the September records reuse a file already associated with a July record. Calling them September video launches would add a claim the evidence does not support.
Video Lengths: A Range of Formats, Not a Proven Sweet Spot
The sampled video files span 6 to 60 seconds, with a median recorded duration of 45 seconds after deduplicating by video fingerprint. This describes the available file mix. It does not identify an optimal duration, a completion-rate advantage, or the amount of time a viewer actually watched. Counting repeated records separately would also change the distribution and overemphasize reused files.
| Recorded duration | Distinct video files | Video-bearing records |
|---|---|---|
| 6 seconds | 2 | 3 |
| 15 seconds | 1 | 1 |
| 30 seconds | 2 | 2 |
| 44 seconds | 3 | 3 |
| 45 seconds | 3 | 5 |
| 56 seconds | 1 | 2 |
| 59 seconds | 1 | 1 |
| 60 seconds | 6 | 9 |
| Total | 19 | 26 |
The illustrated examples cover several of these lengths, but their contact sheets all stop at the same final timestamp. That means a 60-second file and a 15-second file do not receive proportionally different visual coverage in this article. The evidence is strongest for comparing the supplied openings and early states, not complete narrative structure.
For a creative team, duration should follow the demonstration task. A shorter version might communicate one permitted action and its result. A longer version might explain a sequence of choices or preserve enough context to understand the rule. Those are production options, not claims about how the unobserved portions of these particular ads are constructed.
A useful test would specify the shared message before choosing a length. If the shorter version removes the explanation of the controls while the longer version retains it, the experiment compares both duration and information. That can still be a valid package comparison, but the team should describe it accurately rather than attributing any result to seconds alone.
Playable Associations: A Shared Asset Appears Across Many Records
One playable fingerprint appears in 14 sampled records, including a record without video and 13 records that also contain video. That repeated association is a notable structural feature of this selection. It indicates that multiple video files connect to the same indexed playable asset, but it does not establish the playable’s design, load performance, interaction rules, or conversion contribution.
Across the whole sample, the six playable fingerprints appear in 22 records. Eighteen of those records also have video. Four have no video, and one of those four includes the sample’s static image fingerprint. Calling all four simply “standalone playable videos” would be wrong: they are records without video, and their other components differ.
The largest record-level impression estimate in the selection belongs to record e287f8ae, which contains a playable association without a video. Its value is 7,279,393,362 third-party model-estimated impressions for 2026-09-24 to 2026-10-23 under the US selection. The record also lists both the verified iOS entry and an Android package association, so this number should not be presented as an independently measured iOS-only delivery total.
That estimate can justify inspecting the record’s provenance and interactive asset more closely. It cannot establish that playable ads outperform video ads, because there is no controlled comparison, no cost information, and no outcome measurement. The ranking procedure selected records by estimates, so prominent estimates are partly a consequence of how the sample was assembled.
The next useful research artifact would be an interaction log. It would record the first actionable state, accepted inputs, feedback, failure behavior, exit behavior, and destination, together with the device and observation date. None of that testing was supplied here. A playable association is therefore a research lead rather than a substitute for observing the actual interaction.
First Observations Show Recombination, Not a Launch-to-Scale Curve
The dates show older records remaining visible alongside newly observed combinations, but they do not reconstruct a campaign’s launch-to-scale trajectory. Twenty-seven sampled records were first observed before the measurement window; three were first observed within it. All 30 have a latest global observation on 2026-10-23. Those timestamps describe indexed observations, not continuous delivery, actual launch dates, or budget changes.
| Observation date | Evidence | Defensible interpretation |
|---|---|---|
| 2026-06-13 | App Store release date supplied in the editorial brief | Product release context, not advertising launch timing |
| 2026-06-28 | Several sampled records have first observations on this date | Some records in the current selection were already observed in June |
| 2026-07-11 | Pencil-scene record 3f6b8ea7 first observed | The shared pencil video appears in a July-observed record |
| 2026-09-28 | Record 7bcb2f4f first observed | An additional record associates that same pencil video with another playable |
| 2026-09-29 | Record 3d2e16f7 first observed | A further pencil-video combination appears in the index |
| 2026-10-21 | Record 57981f30 first observed | A playable-bearing record without video enters the observed selection |
| 2026-10-23 | Latest global observation date for all sampled records | The index reports an observation on this date; uninterrupted activity is unproven |
The October 21 record has 98,612,880 third-party model-estimated impressions for the explicit US-selected window. Its recent first observation and relatively large estimate make it a candidate for follow-up. They do not justify dividing that number by its observed age or declaring that it scaled faster than an older record. The evidence does not provide a daily delivery series, and the record also has more than one store association.
The two September pencil records are especially instructive because they prevent an easy but incorrect launch narrative. The records are newly observed within the window, but their video is not new to the sample’s history. What changes in the evidence is the indexed combination and its first-observed date.
A genuine scaling analysis would need repeated comparable observations or account data with a clear daily definition. It would also need to separate changes in delivery from changes in indexing and estimation. This frozen extraction supports a narrower statement: the selection contains older video material, repeated playable associations, and some newly observed records during the window.
For monitoring, that narrower statement is still useful. A team can flag the new combinations, retain their relationship to older files, and inspect whether later observations introduce different videos or interactive assets. It should describe the exercise as tracking observed changes, without assigning an unverified production or budget explanation.
Chart Context Does Not Explain Creative Performance
The supplementary chart snapshots place Colony Flow! at number 17 on the US App Store free Games chart on 2026-10-11, compared with number 12 on 2026-09-11. These observations were pulled by AdMapix on 2026-10-13. They establish the game’s position in that captured chart context, not the effectiveness of any sampled advertisement.
The earlier snapshot also falls before the advertising measurement window begins, while the later snapshot falls within it. There is no basis for joining the two chart positions to a particular video, playable, or first-observed record and calling the relationship causal. The chart figures are rankings rather than install counts, and the advertising estimates use a different measurement system.
That is why the title of this article focuses on hooks and reuse rather than claiming that a particular creative made the game a hit. The supplied brief helps explain why the entity is worth researching, but the frozen advertising evidence must support the actual findings. It does not contain the experiment, attribution data, or daily investment history needed to explain the chart movement.
For a planning document, keep chart context in a separate field from creative evidence. It can help prioritize which products to research, while the advertising analysis supplies candidate ideas and questions. Combining them into a single score would require additional assumptions that this article does not make.
How Literally Do These Ads Represent Colony Flow Gameplay?
The frames show a coherent advertised puzzle presentation, but the supplied evidence cannot establish how literally it matches the installed game. The recurring board, slots, colored numbers, and ants make the examples visually consistent with one another. Consistency across ads is different from verification against an actual application build, level sequence, or player-controlled session.
There are several distinct questions behind “Is this real gameplay?” They should not be collapsed into a single yes-or-no answer based on appearance. Does the core interaction exist? Can the player reach the pictured state? Does the game use the same controls? Does the demonstrated action produce the shown result? Is the pacing representative? Does the opening imply a kind of control that the installed product does not offer?
| Question | What this sample supports | What would be needed to answer more fully |
|---|---|---|
| Does the ad show a puzzle interface? | Yes, the supplied frames show a board and colored numbered controls | No further evidence needed for that visual description |
| Are the ants and pixel pictures recurring advertising elements? | Yes, across the illustrated examples | A broader sample would be needed to estimate prevalence |
| Is the ant close-up directly playable? | Unresolved | Matching in-app footage and an input log |
| Does the x2 element operate as shown or implied? | Its visual presence is observable | An interaction test or product documentation |
| Are the sunflower and watermelon states available in the app? | Unresolved | A dated build and reachable-state evidence |
| Does the game reduce cortisol? | Not established | Appropriate substantiation beyond advertising imagery |
| Does the ad’s playable match the installed game? | Not established | Separate testing of both experiences |
A practical gameplay-match review should begin with the promise a viewer is likely to take away. The ant close-up could invite a different interpretation from the full-board grid, even if both eventually connect to the same mechanic. The review should therefore preserve the opening as well as the later demonstration, rather than checking only a representative gameplay-looking frame.
Next, record the real product under known conditions. Identify the build, device, relevant progression state, inputs, and resulting screen changes. For each advertised action, locate the corresponding product action or mark the relationship as unresolved. Where the ad uses an editorial animation, document that explicitly instead of treating it as an unedited capture.
This approach avoids both easy accusations and easy assurances. The presence of a stylized opening does not by itself prove deception. A familiar-looking interface does not by itself prove fidelity. Our guide to fake mobile game ads and gameplay verification provides the broader framing; for Colony Flow, the concrete result remains that the supplied evidence is advertising footage, not an installed-game test.
Reading Impression Estimates Without Turning Them Into Outcomes
The impression values can describe the source’s ranking of sampled records within the specified window, but they cannot grade creative quality or profitability. Every value below is a third-party model estimate for the US-selected period 2026-09-24 to 2026-10-23. None is observed delivery, spend, installs, revenue, or a lifetime total.
| Illustrated record | Visual reference | Window model-estimated impressions |
|---|---|---|
| 6bf974e4 | Ant close-up and blue board | 124,493,668 |
| 33a1538c | First color-grid example | 111,890,345 |
| 65216cb0 | Sunflower with cortisol overlay | 104,491,375 |
| e19a8d59 | Lips and rainbow tongue | 93,233,445 |
| bdee14df | First watermelon example | 92,060,548 |
| 29551ae4 | Second watermelon example | 68,668,118 |
| 3f6b8ea7 | Pencil scene | 33,262,182 |
| 7caa7042 | Second color-grid example | 19,863,324 |
The table makes the visual selection traceable to individual records. It does not imply that Image 1 has a better opening than Image 8. The records differ in history, format associations, and potentially other distribution conditions that the evidence does not resolve. There are also no click or installation denominators with which to evaluate response.
Repeated video files introduce another interpretive choice. A record-level estimate describes that indexed combination. Grouping all records sharing a video would answer a different question about the sampled appearances of that file. Neither calculation isolates the video’s causal contribution, and neither should be mixed with product-search aggregates whose time scope is not established.
We also avoid daily-intensity calculations. Dividing a window estimate by the time since first observation would mix incompatible periods. Dividing by the window length would still require a clear purpose and coverage assessment; it would not reveal actual daily delivery. The article’s decisions do not need that derived metric, so omitting it is more informative than presenting a precise-looking rate with an unclear meaning.
A Practical Workflow: From Indexed Example to Research Decision
A useful workflow preserves identity, file relationships, visual observations, and unanswered questions before turning an example into a production idea. The output should let another team member trace a proposed test back to the evidence without inheriting an unsupported claim. The Colony Flow sample provides a concrete model for doing that.
First, anchor the product. Start with the game name for discovery, then confirm the store identifier and seller. Save the exact listing relationship with each candidate. For this article, that anchor is iOS 6779167923 and ABI GLOBAL LTD. If a record lists additional store entries, retain that information rather than silently broadening the study’s scope.
Second, freeze the research conditions. Record the country, both date bounds, sorting rule, page limit, and retrieval date. This tells the next analyst what the selection favors. An impression-descending sample answers a different research question from a discovery-date sample. Neither should be described as complete without evidence of completeness.
Third, make separate inventories. Keep one list of records, one of distinct videos, and one of distinct playables, with links between them. Preserve image associations separately. For Colony Flow, this step converts an apparently large set of 30 entries into a clearer structure: 19 video files, six playable files, and overlapping combinations that can be examined individually.
Fourth, annotate only what was observed. For each image, write down the timestamp, visible subject, control area, changed state, text, and any uncertainty. “Cortisol label above sunflower” is an observation. “Relaxation improves retention” is a hypothesis requiring a different kind of study. Keep those statements in separate fields so that an analyst’s interpretation does not become a production fact through repetition.
Fifth, identify the missing evidence that changes the decision. If the team is deciding whether to imitate a close-up-to-board structure, a comprehension check may be the next step. If it is considering a playable continuation, interaction testing matters more. If it wants to claim gameplay fidelity, installed-build evidence is necessary. Avoid collecting additional screenshots that do not resolve the actual question.
Sixth, translate the structure into an original concept. Retain the abstract lesson, such as “show one recognizable object before a more complex board,” while using the team’s own art, rules, controls, and verified outcomes. The purpose of research is to understand a presentation choice and test its relevance to another product.
Finally, attach a decision rule. State what observation would justify proceeding, revising, or abandoning the concept. A concept that creates curiosity but miscommunicates control may need a different opening. A concept that viewers understand but do not remember may need a clearer subject. Neither decision requires guessing the sampled advertiser’s conversion rate.
An Original Creative Brief Built From the Findings
An actionable brief should describe the viewer’s intended understanding, the real action being demonstrated, and the evidence needed to accept the finished asset. The following is a proposed brief for a team with its own color-based puzzle mechanic. It is not a description of an ABI production document or a claim that this test has been run.
Research question: Does opening on a recognizable object help new viewers understand the relationship between a color choice and a visible board change?
Source observations: The watermelon examples retain a recognizable subject while the perimeter and background change. The color-grid examples show the complete board immediately. The sample provides different presentation approaches, but it does not measure their comprehension or acquisition results.
Hypothesis: A recognizable object may give viewers a stable reference point while they learn the consequence of a color selection. The hypothesis fails if viewers focus on the illustration but cannot explain the action they would take in the product.
| Brief component | Production instruction | Acceptance evidence |
|---|---|---|
| Product state | Use a reachable state from the team’s current build | Saved build information and a recording of how the state is reached |
| Opening | Compare an original recognizable picture with an original abstract board | Version notes identifying the changed element |
| Input | Show the actual permitted selection clearly | Input log aligned with the recording |
| Result | Preserve the game’s real response to that selection | Continuous source capture available for checking |
| Controls | Keep the control location consistent across versions | Side-by-side frame review |
| Text | Explain the action without adding unsupported benefits | Claim review against product evidence |
| Ending | Use the same truthful next-step message | Matched ending files and destination check |
| Evaluation | Check understanding before making performance claims | Recorded participant responses and later owned-account results, if tested |
The production package should include a clean capture, the edited version, the source-to-edit relationship, and the exact wording used on screen. This lets a reviewer distinguish an attractive edit from a change that alters the represented rule. It also prevents later versions from accumulating unverified promises as they pass between editors.
The first evaluation can be deliberately narrow. Ask viewers to describe what they would select, what they expect to happen, and which part of the image communicates success. If responses disagree, revise the explanation before treating the concept as ready for an acquisition test.
A later campaign experiment should define its own success criteria using the team’s economics and measurement setup. The Colony Flow evidence does not supply a universal click-through rate target, installation cost, retention threshold, or budget. Those decisions belong to the team’s controlled environment and should remain separate from the external reference.
How to Compare Hooks Without Confusing the Variables
A useful hook comparison changes a clearly identified presentation choice while preserving enough of the product experience to interpret the result. The Colony Flow examples suggest several possible questions, but they do not supply a ready-made experiment. A team should select one question, specify the shared material, and decide whether it is comparing a single element or complete creative packages.
For the character-led approach, the question could be whether a close-up improves recognition of the game’s central action. Keep the subsequent demonstration and call to action consistent, then compare the opening treatment. If the character version also changes the art style, game state, and duration, the result would apply to the whole version rather than to the character alone.
For the familiar-picture approach, compare the audience’s understanding of progress. Use two original boards that can be demonstrated under equivalent rules, then ask whether viewers identify the changed region and connect it to the selection. A beautiful illustration that hides the relevant change may be unsuitable even if people remember it.
For a transformation opening, distinguish curiosity from misunderstanding. A change resembling the lips sequence could be attention-grabbing in principle, but the team needs to establish whether viewers interpret it as a real mechanic. If they do, the product must support that interpretation or the presentation needs clarification.
For the playable handoff, preserve the promised action across the transition. The first interactive state should let the viewer recognize what they saw in the video and understand what input is expected. That is a design recommendation for a proposed build, not a finding about the untested Colony Flow playables.
Record neutral and disappointing results as carefully as positive ones. If a version is easier to understand but does not improve the chosen campaign outcome, the team has learned that the two measures diverge under those conditions. It has not learned that comprehension never matters, or that the sampled advertiser’s approach is ineffective.
Common Mistakes That Would Change the Findings
The most consequential mistakes would turn a bounded creative study into a claim about production volume, platform coverage, or business performance. They are preventable by retaining the measurement unit and the evidence boundary in every table, caption, and brief. The following checks are particularly relevant to this sample.
Calling 30 records “30 different videos.” Only 26 records contain video, and those resolve to 19 files. The correction changes the apparent amount of video production and reveals reuse that a record-only view would miss.
Treating similar screenshots as exact duplicates. Images 2 and 8 look closely related, but the source identifies different video fingerprints and durations. Group them as a visual family while keeping their file identities separate.
Treating every new record as a newly created video. The September pencil records reuse a video already found in a July-observed record. Preserve first observations at both record and file-group levels before describing creative freshness.
Equating a playable association with a tested end card. The record establishes that an interactive asset is associated with the entry. It does not show its full behavior, the viewer’s actual handoff, or the delivery configuration in every placement.
Using first-to-last observations as proof of uninterrupted advertising. The supplied timestamps show when the index observed the record. They do not disclose every intervening day, campaign pause, budget change, or targeting decision.
Reading the cortisol gauge as a product outcome. It is part of the visible advertising message. Without substantiation, it remains an advertising implication rather than a verified physiological effect.
Assigning a network from appearance or an asset address. A vertical video and an interactive component do not establish a particular network. The source mapping needed to make that attribution is not supplied here.
Combining chart movement and impression estimates into an acquisition story. The chart snapshots and advertising records have different definitions and timing. They provide context and research leads, not a causal account of installs.
Copying the artwork instead of testing the presentation principle. A useful adaptation might examine recognizable subjects, clear input feedback, or the transition from close-up to board. It should use original assets and the team’s actual mechanics.
Letting the headline outrun the evidence. “Hooks, reuse, and playable associations” describes what this sample can support. “The creative that caused growth” would require outcome and attribution evidence that is absent.
When AdMapix Fits This Research Workflow
AdMapix fits teams that need to discover indexed creative references, inspect their product relationships, and build a dated evidence base for original briefs. In this article, its concrete contribution is the frozen selection and the relationships among records, videos, images, and playables. It does not replace an installed-game test, an advertiser’s own analytics, or a controlled experiment.
A small creative team can use the workflow to reduce ambiguity before production: identify the reference listing, distinguish repeated files from new concepts, and write down what remains unverified. An agency can use the same structure to make a client-facing teardown traceable. An analyst can preserve the selection conditions so that a later update explains what changed rather than silently replacing one set of numbers with another.
The appropriate handoff is to live research followed by evidence capture. Sign up or log in to AdMapix to research current Colony Flow creatives, confirm the listing, and save the conditions of your new search. A live result should be treated as a new observation, not assumed to reproduce the October 23 snapshot.
For a purchase decision, consult the current AdMapix pricing page. Plans and terms can change, so this evergreen analysis does not quote prices or credit allowances. No paid-plan trial is promised. There is also no verified hourly refresh commitment in the supplied product facts; freshness should be assessed from the actual records and retrieval date.
FAQ
What do Colony Flow ads show in this sample?
The supplied frames show ants around colorful pixel boards, numbered color tiles, and partially cleared pictures. Openings include an ant close-up, abstract grids, a sunflower, rainbow lips, watermelon artwork, and a pencil scene. These observations cover eight contact sheets at specified timestamps. They describe the sampled advertising presentation, not every Colony Flow ad or the complete installed game.
Are the Colony Flow ads accurate representations of gameplay?
The evidence does not establish exact gameplay accuracy. It shows a recurring puzzle interface across advertising examples, but no installed-app test or matching gameplay recording was supplied. Verifying accuracy would require checking the depicted controls, reachable states, inputs, outcomes, and pacing against a dated application build. A stylized opening alone proves neither deception nor fidelity.
How many different Colony Flow videos were found?
The 30 sampled advertising records include 26 records with video and 19 distinct video fingerprints. Six video files repeat across records, including a pencil-scene video that appears three times. These are counts within a bounded US selection for 2026-09-24 to 2026-10-23, not the total number of videos produced or advertised for Colony Flow.
How long are the sampled video ads?
Recorded durations range from 6 to 60 seconds, with a median of 45 seconds across the 19 distinct video files. Those values come from file metadata. The visual analysis covers only the attached timestamps, so it cannot describe every video’s complete sequence, final call to action, audio, or ending. The distribution does not establish an optimal advertising length.
Do the records prove playable ads perform better than videos?
No. The sample contains six distinct playable fingerprints across 22 records, including many records that also contain video. A prominent model-estimated impression value for a playable-bearing record does not isolate the format’s effect. A fair performance comparison would require defined delivery conditions, costs, outcomes, and a controlled design using the team’s own measurement environment.
Which advertising networks are represented?
A named network cannot be verified from the supplied source mapping. All sampled records share a source code, but the evidence does not provide a confirmed interpretation of that code. The verified iOS listing identifies the associated product, not the advertising network or buyer. Layout, media type, and words embedded in an asset address are insufficient substitutes.
How should a small team use these examples?
Choose one presentation question, such as whether a recognizable picture makes progress easier to understand. Use original artwork and verified actions from your own game, keep the comparison interpretable, and check comprehension before drawing campaign conclusions. AdMapix can supply research candidates and dated context; your product evidence and owned-account results must establish fidelity and performance.
Key Takeaways
The useful result of this teardown is a traceable set of creative structures and reuse relationships that a team can investigate in its own product.
- Treat the 30 records, 19 video files, and six playable files as different units within the stated sample.
- Separate the observed openings into meaningful presentation choices: character introduction, immediate board view, recognizable picture, transformation, and emotional overlay.
- Preserve both exact file identity and visual-family tags; the pencil reuse and similar grid files demonstrate why both are necessary.
- Describe newly observed combinations accurately, without turning record dates into a production or scaling history.
- Verify gameplay promises and test original concepts with your own evidence before making performance or budget decisions.
Sources
The sources below document the dated advertising sample, verified product identity, research workflow, and commercial-information boundaries used in this article.
- AdMapix frozen source package, captured 2026-10-23: Public batches, request parameters, and checksums. Scope: 30 records selected for the US, 2026-09-24 to 2026-10-23, associated with verified iOS listing 6779167923. The eight illustrations reproduce supplied timestamped advertising frames, not performance results.
- Apple App Store identity, captured in the supplied evidence on 2026-10-23: Colony Flow! listing 6779167923. Used for the reference listing and seller identity, not as evidence of advertising outcomes or gameplay testing.
- AdMapix methodology: Measurement and interpretation guidance. Applied to the 2026-10-23 observation, including the distinction between records, file identities, estimated impressions, and private campaign outcomes.
- AdMapix product/search workflow: Colony Flow creative search. The query describes the discovery workflow associated with this study; live results can differ from the frozen sample and require renewed identity checks.
- Supplementary AdMapix store-rank observations, retrieved 2026-10-13: US App Store free Games snapshots place Colony Flow! at number 12 on 2026-09-11 and number 17 on 2026-10-11. These supplied chart observations are used only for context, separately from the advertising measurement.
- AdMapix product facts reviewed 2026-08-13: Commercial terms are deferred to the live pricing page linked above. This article makes no paid-trial promise, fixed refresh guarantee, or claim to private advertiser performance data.
Turn these observations into your next creative study
Open the creative library and select samples for your market, network and research question.
Related Articles
Amaze GO Game Ads: Arrow Puzzles, Hooks, and Video Reuse
A verified US iOS sample links 30 Amaze GO advertising records to 24 video files and 10 playable files, with eight visual analyses covering arrow puzzles, relaxation claims, filmed challenges, and practical creative tests.
Disney Solitaire Ads: Characters, Cards, and Video Reuse
Eight dated Disney Solitaire advertising examples reveal character introductions, card objectives, collection and reward messaging, plus video reuse across a bounded US sample, with practical briefs and clear evidence limits.
Rotate Rings Game Ads: Hooks, Video Reuse, and Playables
A verified US iOS sample connects 30 Rotate Rings advertising records to 13 video files and 10 playable files, with eight timestamped visual analyses and practical workflows for original creative tests.