Taboola Ad Spy Tool in 2026: Native Ad Research for Headlines, Thumbnails, and Offers
How to research Taboola native ads from public evidence in 2026 — what a Taboola ad spy tool can and cannot prove, how to decode the headline-and-thumbnail pair that carries the whole click, read advertorial and quiz landing paths, follow the retargeting trail, separate observed creative facts from private-metric guesswork, and turn repeating patterns into a testable creative brief instead of a one-off screenshot.
By the AdMapix Research Team — Updated June 21, 2026
Taboola Ad Spy Tool in 2026: Native Ad Research for Headlines, Thumbnails, and Offers
A Taboola ad spy tool helps you study the native ads already running across the open web: the headline that wins the click, the thumbnail that stops the scroll, the offer behind the curiosity gap, and the advertorial or landing path the click leads to. What it cannot do is reveal private spend, bids, or audience targeting — Taboola does not publish those, and no public tool can infer them reliably. This 2026 guide is for native advertisers, affiliate teams, ecommerce marketers, and agencies who want to research Taboola creatives, separate fact from guesswork, and turn repeated patterns into a creative brief instead of a one-off screenshot. By the end you will know exactly what public Taboola evidence can prove, how to read the headline-and-thumbnail pair that carries almost all the persuasion, how to follow the click into the advertorial where the real selling happens, how to read the retargeting trail, and how to build a research habit that compounds rather than a folder of screenshots nobody reopens.
TL;DR — Researching Taboola Native Ads
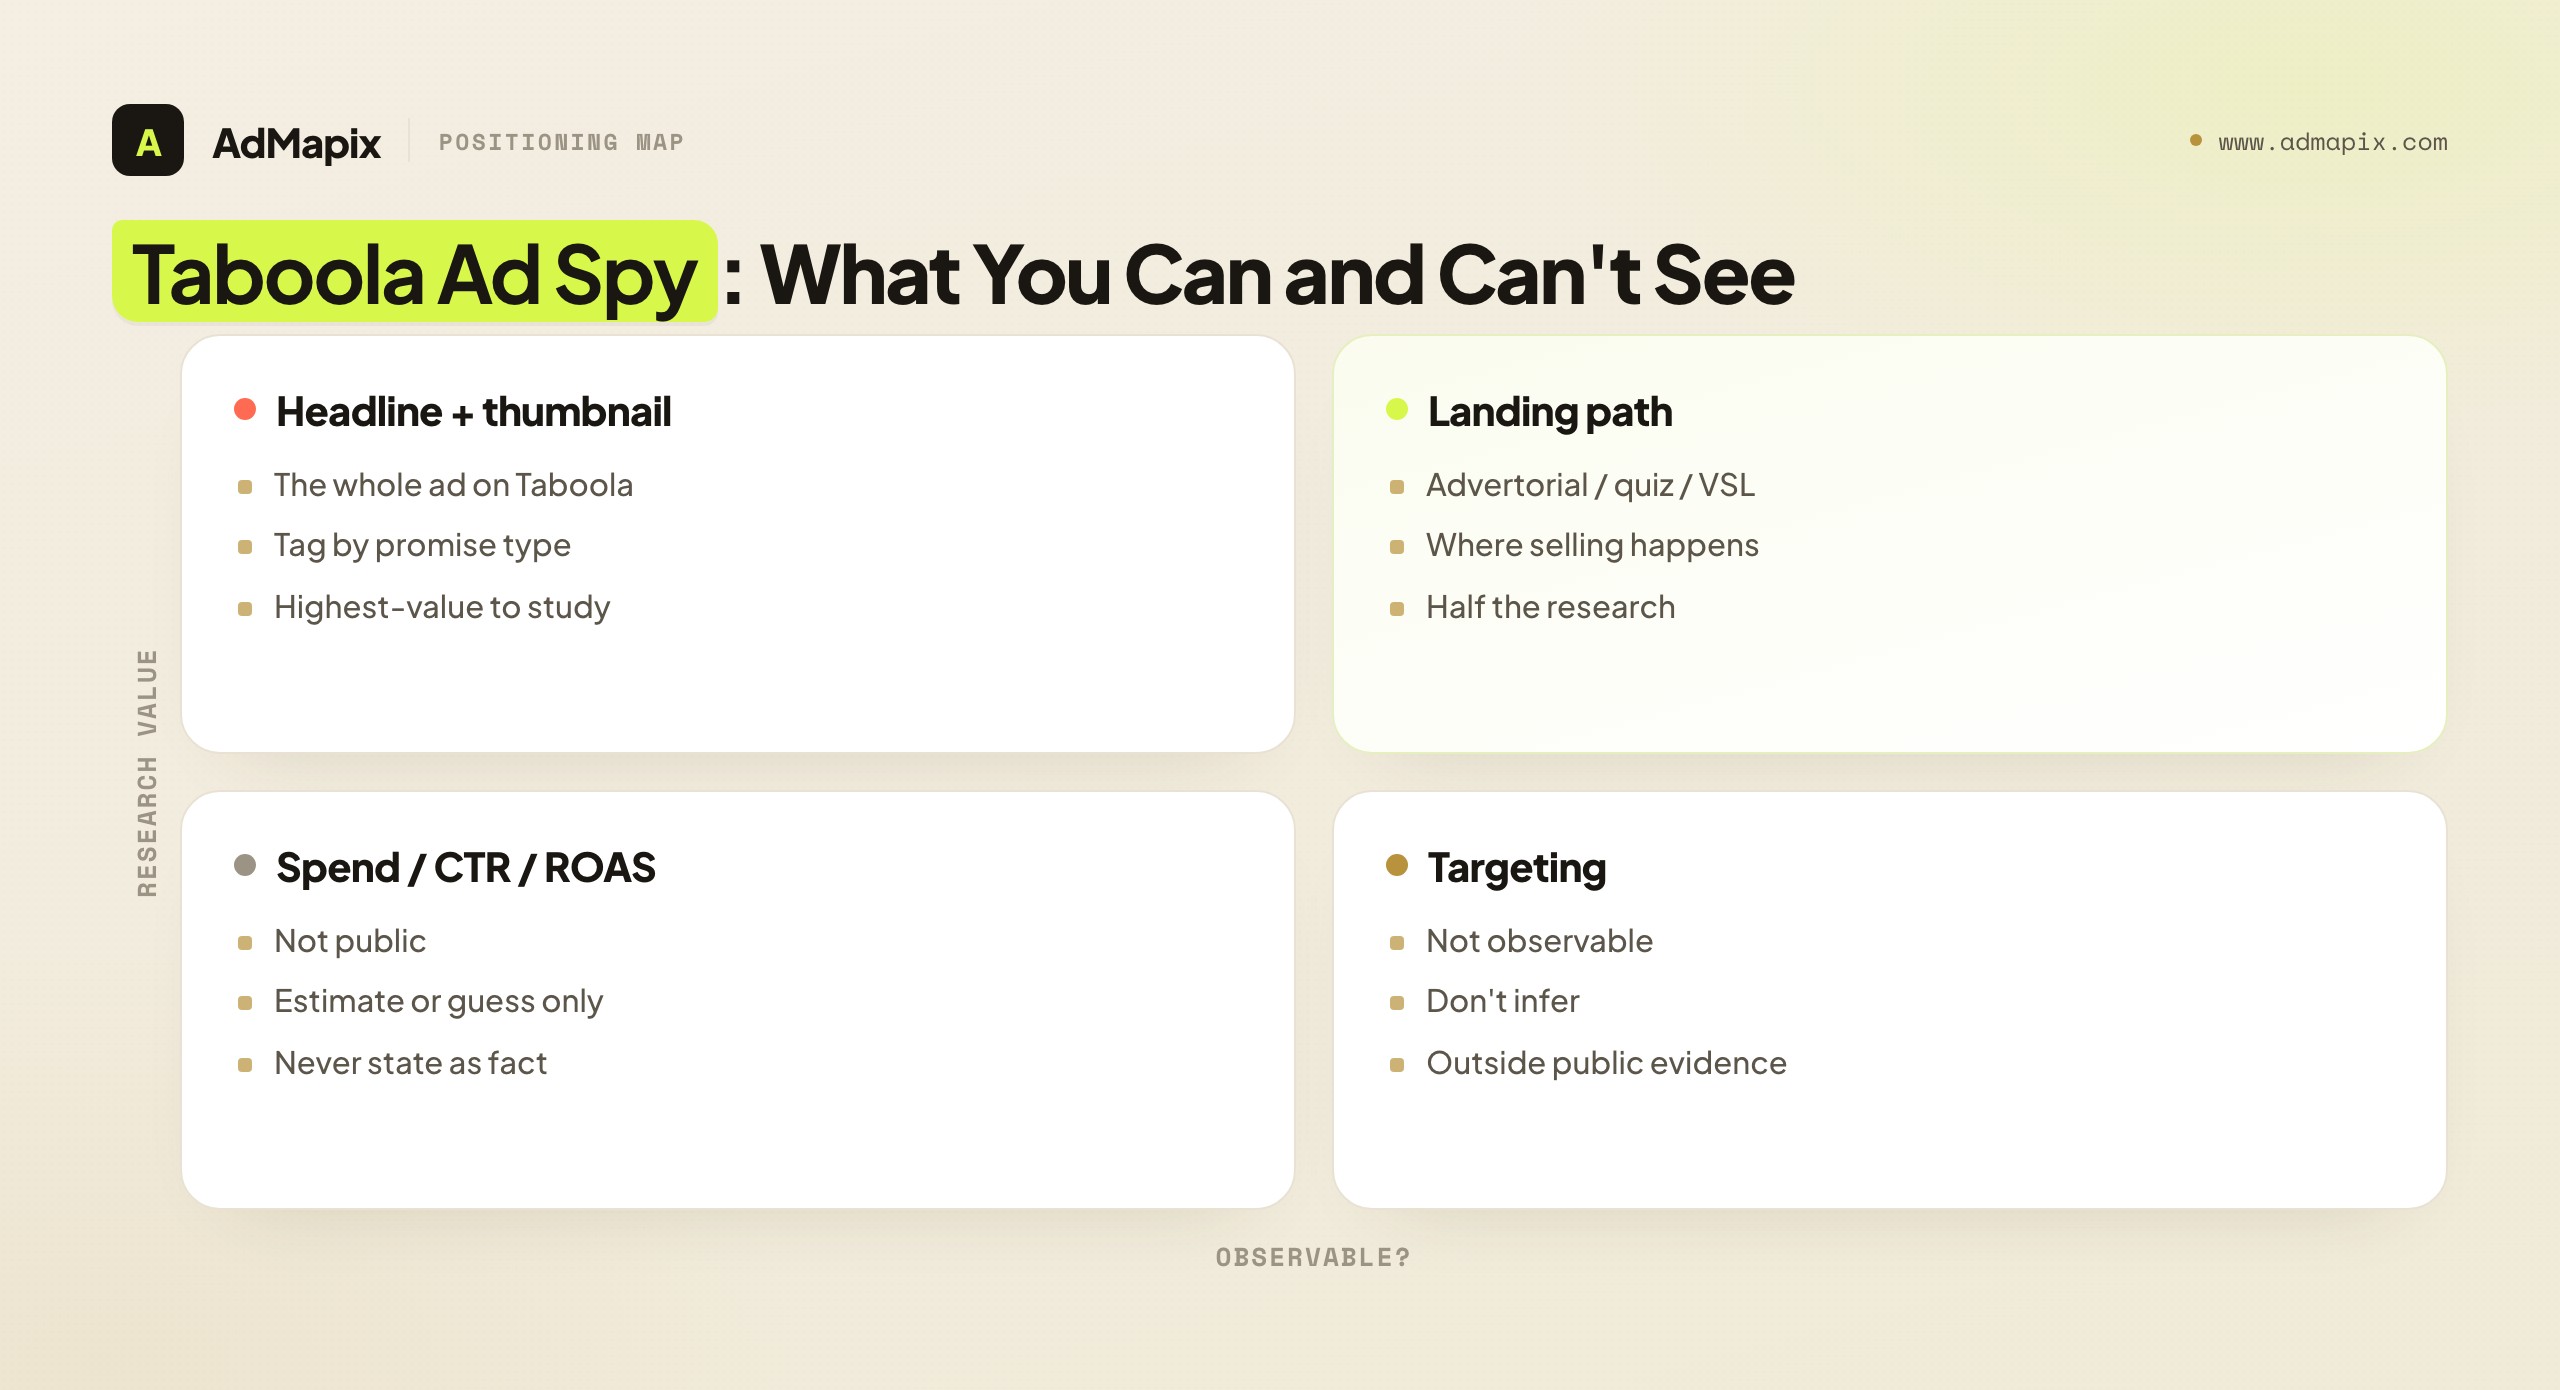
- A Taboola ad spy tool reveals public creative evidence: headlines, thumbnails, offer angles, publisher placement context, and the landing path a click leads to. That is the observable surface, and it is genuinely useful.
- It cannot prove private metrics. Spend, bids, CTR, ROAS, and targeting are not public on Taboola, so treat any such figure from any tool as a modeled estimate or a guess, never a fact.
- The win is not copying one ad — it is spotting the angle that repeats across publishers and many advertisers, and converting that pattern into a testable hypothesis.
- On Taboola the headline-and-thumbnail pair is the entire ad, because the native unit blends into publisher content and cannot rely on motion, sound, or a brand frame. That pair is the highest-value thing to study.
- The landing path is half the research. Taboola clicks usually land on advertorials, quizzes, or video sales pages that do the real converting, so reading the destination matters as much as the ad.
- A creative-intelligence layer such as AdMapix fits teams that want to save native examples, analyze landing and video structure, tag recurring patterns, and turn them into a shareable report — across networks, not Taboola alone.
What a Taboola Ad Spy Tool Actually Exposes
Most people searching for a Taboola ad spy tool are not looking for another folder of saved images — they need to answer specific creative questions before they spend on a test. It helps to be precise about what the public surface actually contains, because the gap between what you can observe and what you wish you could observe is exactly the gap that separates credible native research from wishful guessing.
Taboola's native advertising format is built so ads match the look and feel of the publisher page — the "Around the Web" and "Recommended For You" units you see beneath articles on a vast network of publisher sites. That design choice has a direct consequence for research: the headline and thumbnail carry almost all the persuasion, because the ad cannot interrupt the way a video pre-roll or a full-screen social ad can. It has to earn the click by blending in and then standing out through curiosity, specificity, or a benefit promise. So the things worth researching on Taboola are different from what you would study on Meta or TikTok.
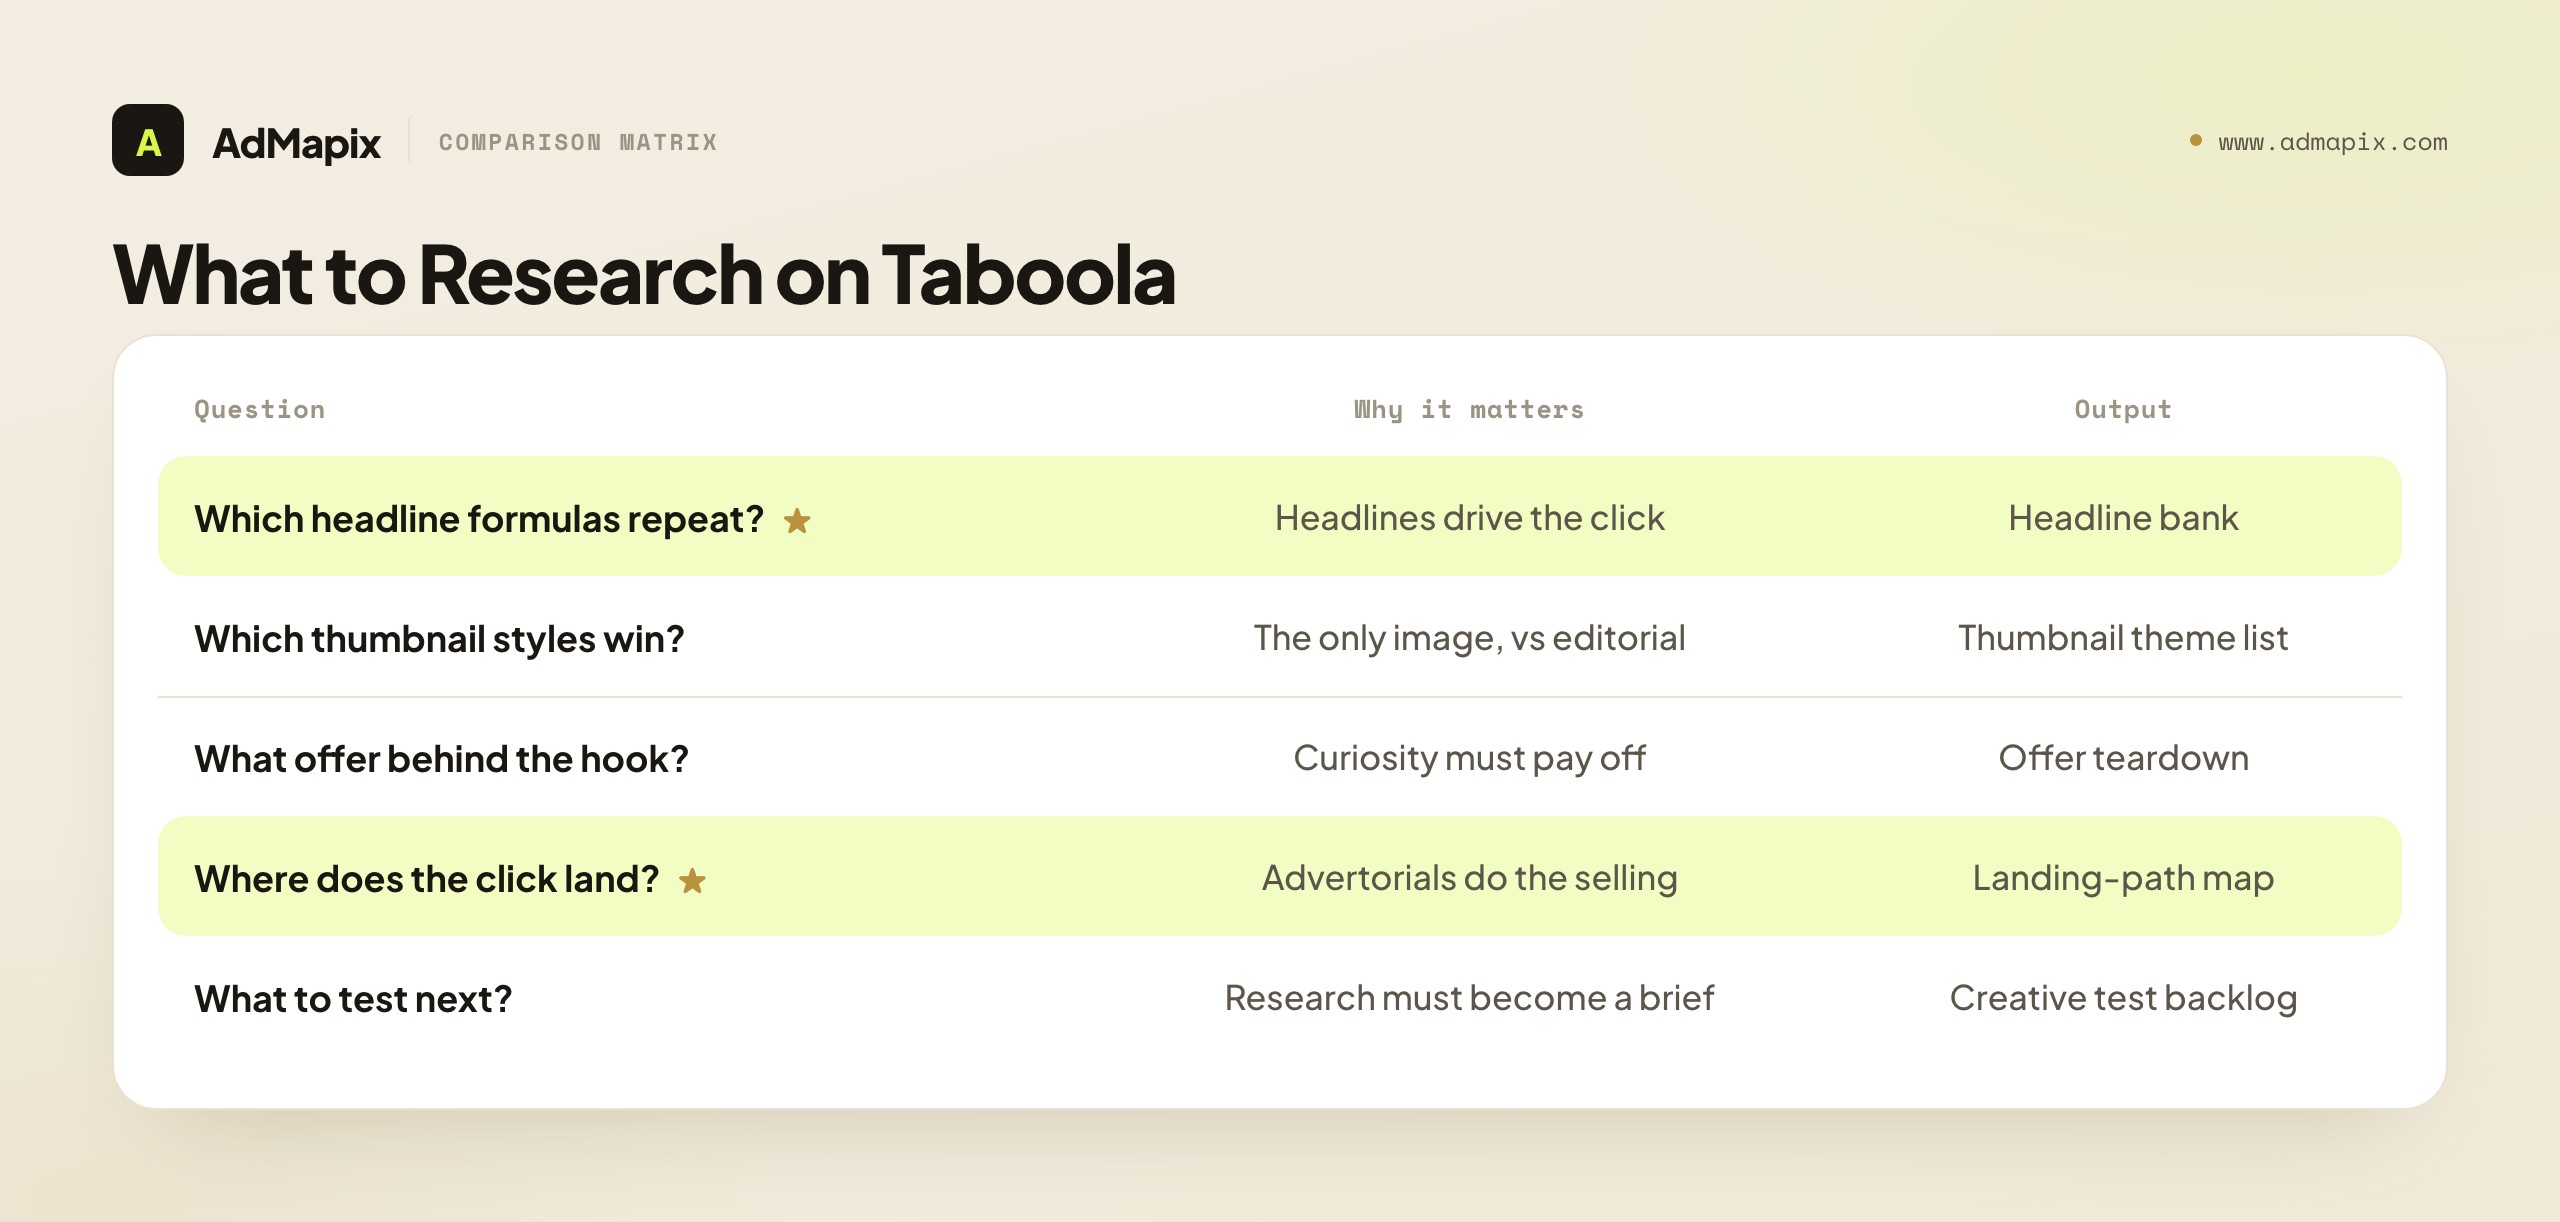
| Question | Why it matters on Taboola | Output you should get |
|---|---|---|
| Which headline formulas repeat? | Headlines drive the click in a feed where the ad blends into editorial | A reusable headline bank |
| Which thumbnail styles win attention? | The thumbnail is the only image and competes with publisher content | A thumbnail theme list |
| What offer sits behind the hook? | The curiosity gap only converts if the offer pays it off | An offer teardown |
| Where does the click land? | Advertorials, quizzes, and VSLs often do the real selling | A landing-path map |
| Which advertisers and verticals recur? | Repeat advertisers signal angles that survive the auction | An advertiser watchlist |
| What should we test next? | Research is worthless until it becomes a brief | A creative test backlog |
Notice what is and is not on that list. Every item is something you can observe from public creative evidence — the headline, the image, the offer, the destination, the advertiser. None of them is spend, bid, click-through rate, or targeting, because none of those is public. A Taboola ad spy tool, whether it is a dedicated third-party product or a disciplined manual process, is fundamentally a tool for studying observable creative, and the moment you ask it for private performance numbers you have left the territory where it can give you honest answers.
Why Taboola Differs From Social and Search Spying
It is worth naming why researching Taboola is a distinct skill from spying on Meta, TikTok, or Google, because importing habits from those channels leads you to study the wrong things. The difference comes down to where the persuasion lives and how the ad is consumed.
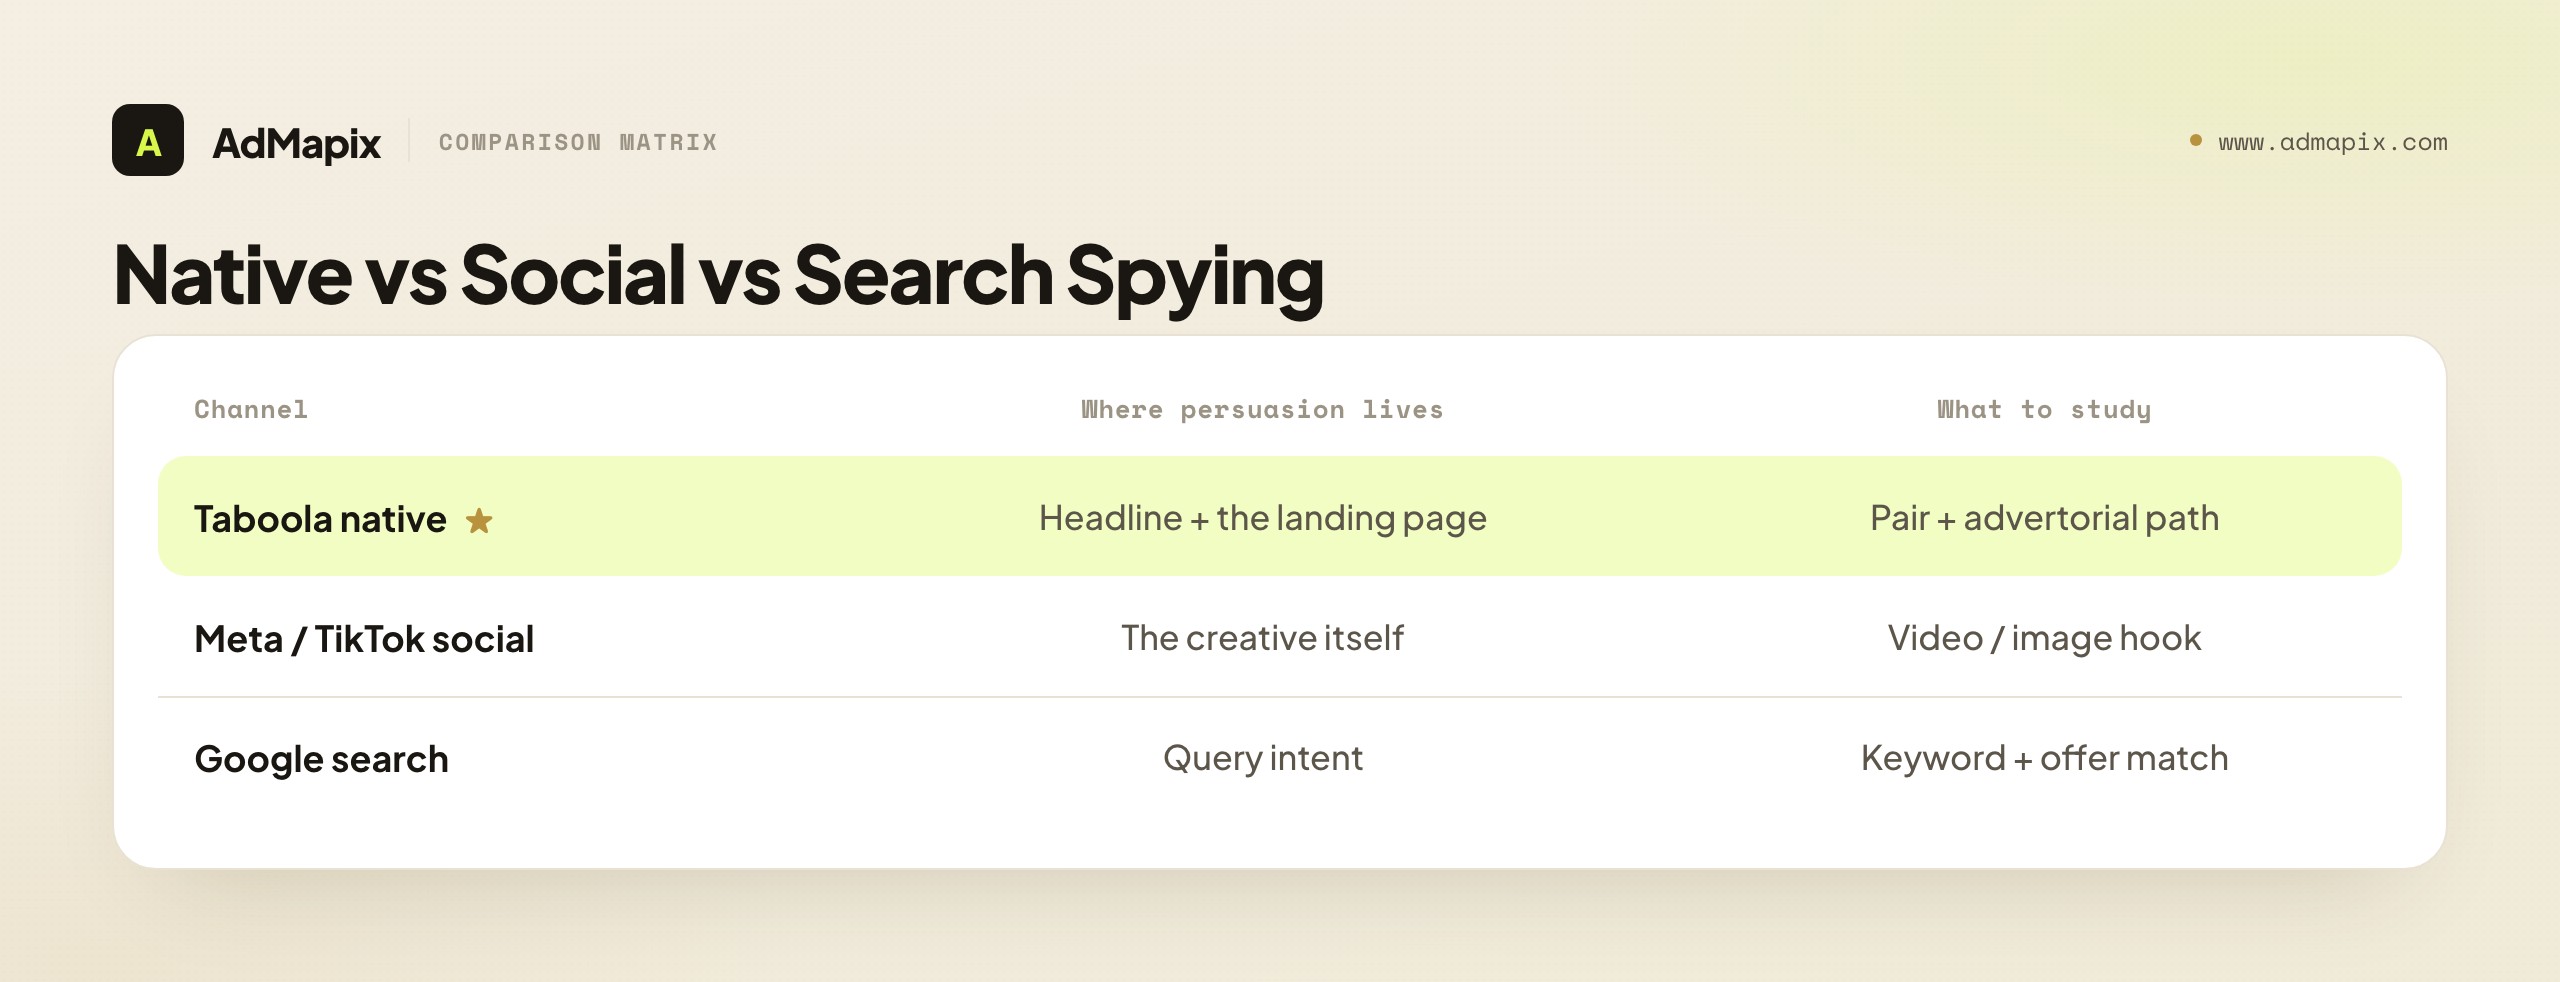
On social, the creative is the pitch — a scroll-stopping video or image carries the message, and you can often judge an ad from the creative alone. On search, intent is the dominant signal — the user typed a query, so the ad meets demand that already exists. Taboola native is neither. The user is mid-article, not searching, and not scrolling a social feed; they are reading content and encounter a recommendation unit designed to look like more content. That means the ad has to manufacture interest from a standing start, with no query intent and no permission to interrupt. The headline does that work, the thumbnail supports it, and almost everything else about the persuasion is deferred to the page the click lands on.
This has a concrete research implication: on Taboola, the post-click path is not optional context — it is half the evidence. A native click rarely goes straight to a checkout; it typically lands on an advertorial that tells a story, a quiz that qualifies and warms the visitor, or a video sales page that does the heavy persuasion. If you study the ad unit and ignore the destination, you have seen the bait and missed the mechanism. This is the single biggest way native research differs from social: the creative you can see in the feed is deliberately the least informative part, and the page it leads to is where the actual selling — and the actual lesson — is. Any serious Taboola research treats the landing path as a first-class object, not an afterthought.
There is also a scale-and-network nuance specific to Taboola. Taboola runs one of the largest native networks on the open web, with placements across a huge range of publishers, and following the merger that brought Taboola and Outbrain together under one corporate roof, the native discovery landscape has consolidated further. For a researcher, that breadth is a double-edged thing: there is an enormous amount of native creative to study, but it is spread across countless publisher sites rather than sitting in one searchable library. That distribution shapes how you have to research it, which is the subject of a later section on the honest state of native transparency.
The scale point has a practical research consequence worth drawing out. Because Taboola's inventory spans premium news publishers, mid-tier content sites, and a long tail of smaller properties, the same advertiser's creative can show up in very different contexts, and the context shapes how the creative is built. An ad designed to blend into a major news site's recommendation strip looks and reads differently from one tuned for an entertainment or lifestyle property, even when it is selling the same offer. For a researcher, this means you learn more by observing an advertiser across several publisher contexts than by studying a single placement — you see how they adapt the same offer to different reading environments, which is itself a sophisticated skill worth understanding. A competitor who tailors headline tone and thumbnail style to the publisher context is operating at a higher level than one running identical creative everywhere, and that adaptation is visible only if you sample across the network rather than fixating on one site.
This breadth is also why "audience" works differently on native than the word implies elsewhere. On social, you might think of audience as targeting parameters; on Taboola, the practical audience is shaped heavily by which publishers and content contexts an advertiser's ads appear alongside. You cannot see their targeting settings, but you can observe the kinds of content environments their ads tend to appear in, which is a softer but real signal about the audience they are reaching. A supplement advertiser whose ads cluster on health and senior-interest content is reaching a different audience than one appearing mostly on general news, and that contextual clustering is an observable proxy — imperfect, but honest — for the kind of reader they are buying. Reading placement context as a soft audience signal is one of the more advanced things native research offers, precisely because targeting itself is invisible.
Public Evidence vs. Private Assumptions
The most important discipline in Taboola research — more important than any tool — is separating what you can observe from what you are tempted to assume. Get this line right and your research is credible; blur it and you build expensive tests on guesses dressed as data.
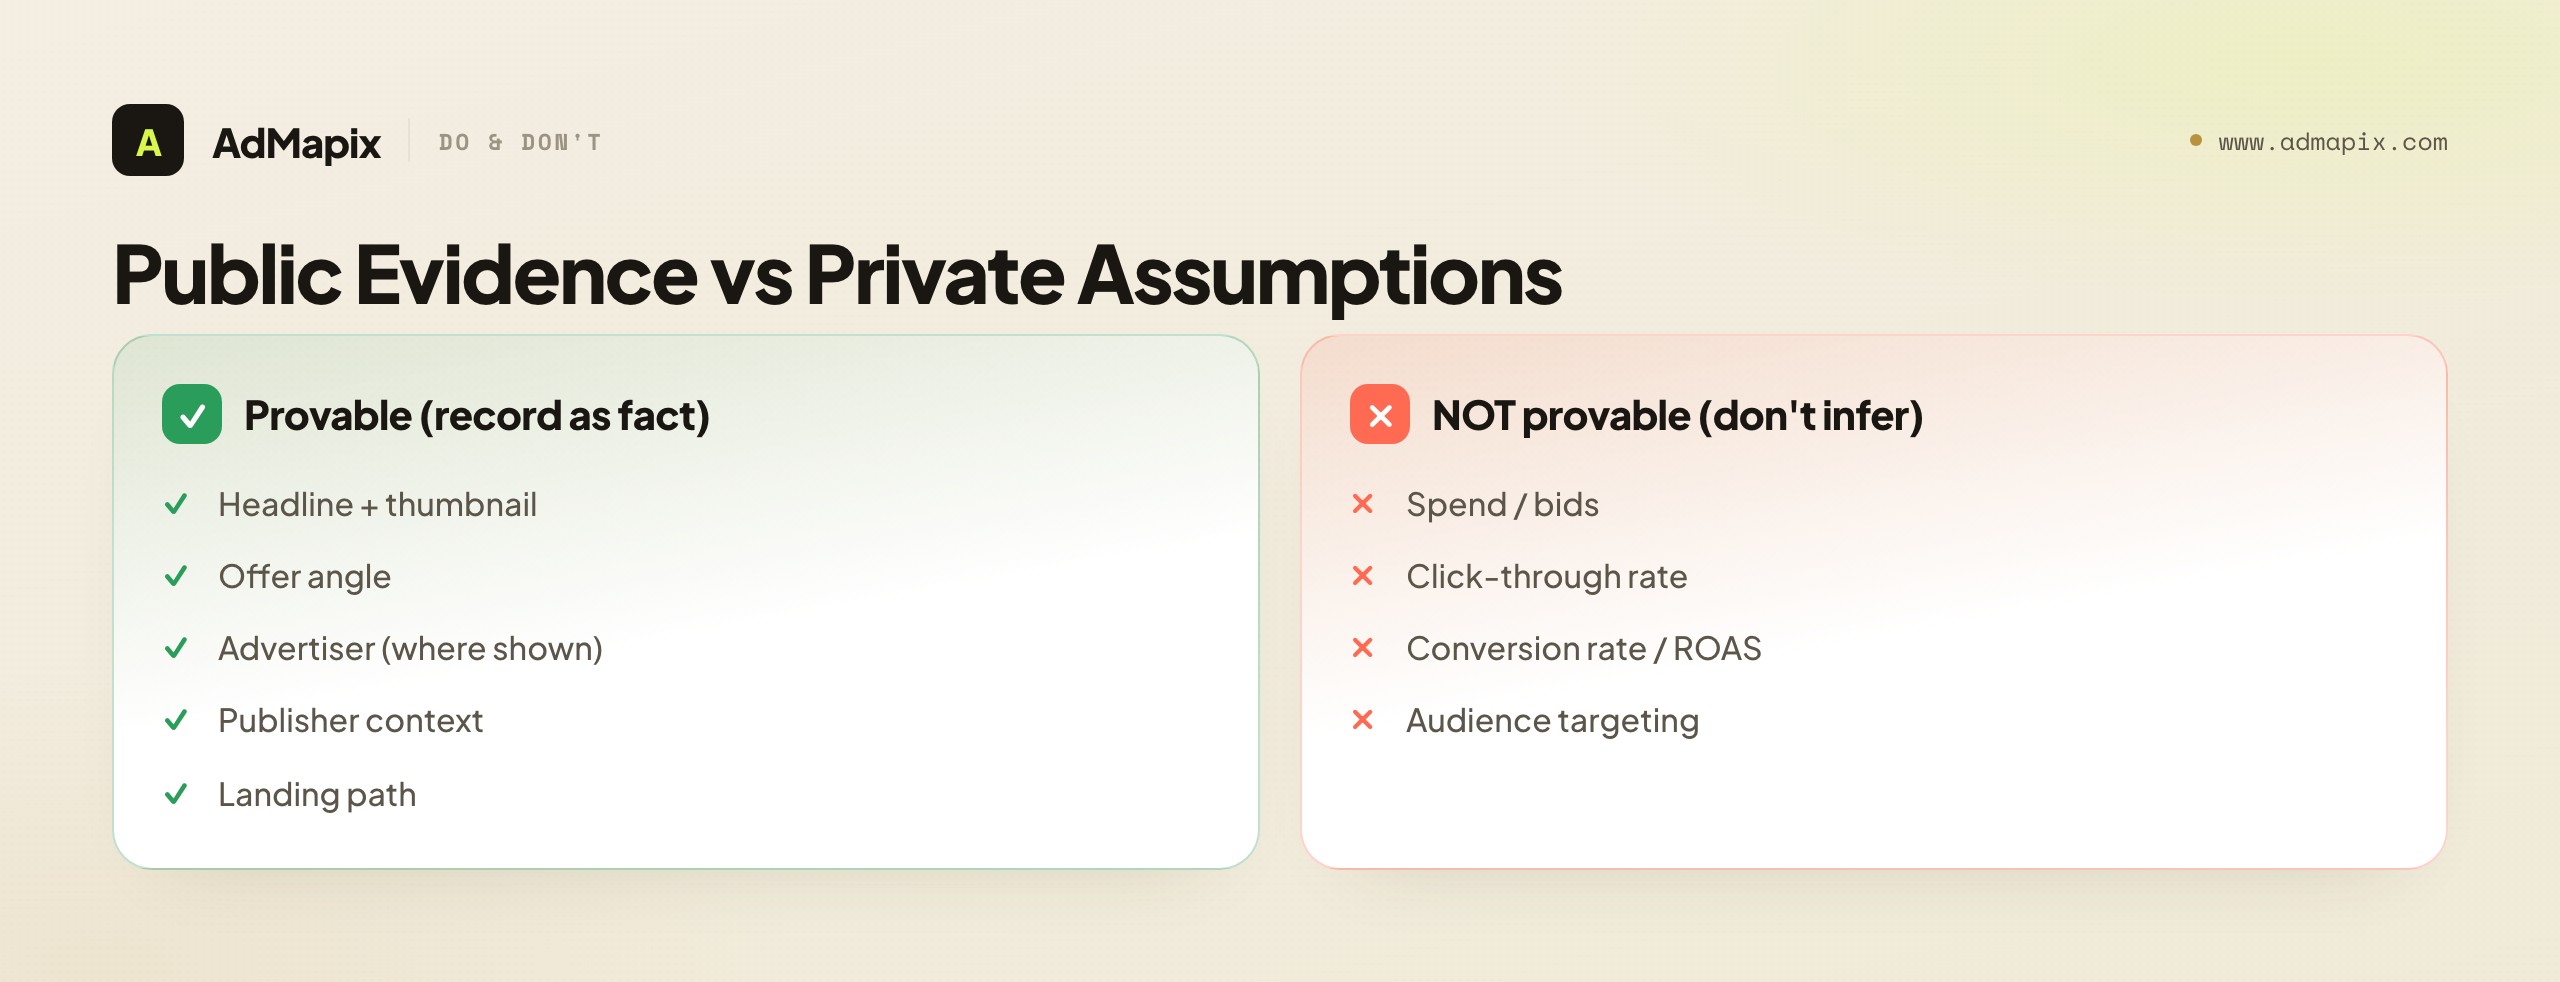
Here is the clean split. Provable from public Taboola evidence: the headline, the thumbnail, the offer angle, the advertiser or brand where it is disclosed, the publisher context where the unit appears, and the landing path the click leads to. These are things you can actually see, record, and defend. Not provable from public evidence: the spend behind the ad, the bid, the click-through rate, the conversion rate, the return on ad spend, and the audience targeting. None of these is published by Taboola, and no public tool can infer them reliably — any number you see for them is either a modeled estimate (which should be labeled as such) or a guess (which should not be in your research at all).
This matters because native research is unusually prone to a specific illusion: because you can see a competitor's headline, thumbnail, and even the advertorial behind it in rich detail, it feels like you should be able to see how well it is doing too. But you cannot, and the richness of the visible creative makes the invisible performance data feel closer than it is. A headline that appears everywhere might be a scaled winner — or an advertiser stubbornly burning budget on something that is not converting. Visible frequency is a hint about where to look, never proof of profit. The researchers whose work gets trusted are the ones who are loudest about this boundary: "here is the creative, offer, and landing path we observed; here is what we cannot determine about its performance from public data." That honesty is not a weakness in the research — it is what makes it credible.
Decoding the Headline-and-Thumbnail Pair
Because on Taboola the headline plus thumbnail is the entire ad, that pair is the single highest-value thing to research, and reading it well is a learnable skill. The native unit cannot rely on motion, sound, or a brand frame to interrupt — it has to earn the click through curiosity, specificity, or a compressed benefit promise, delivered in one line and one image that have to work together.
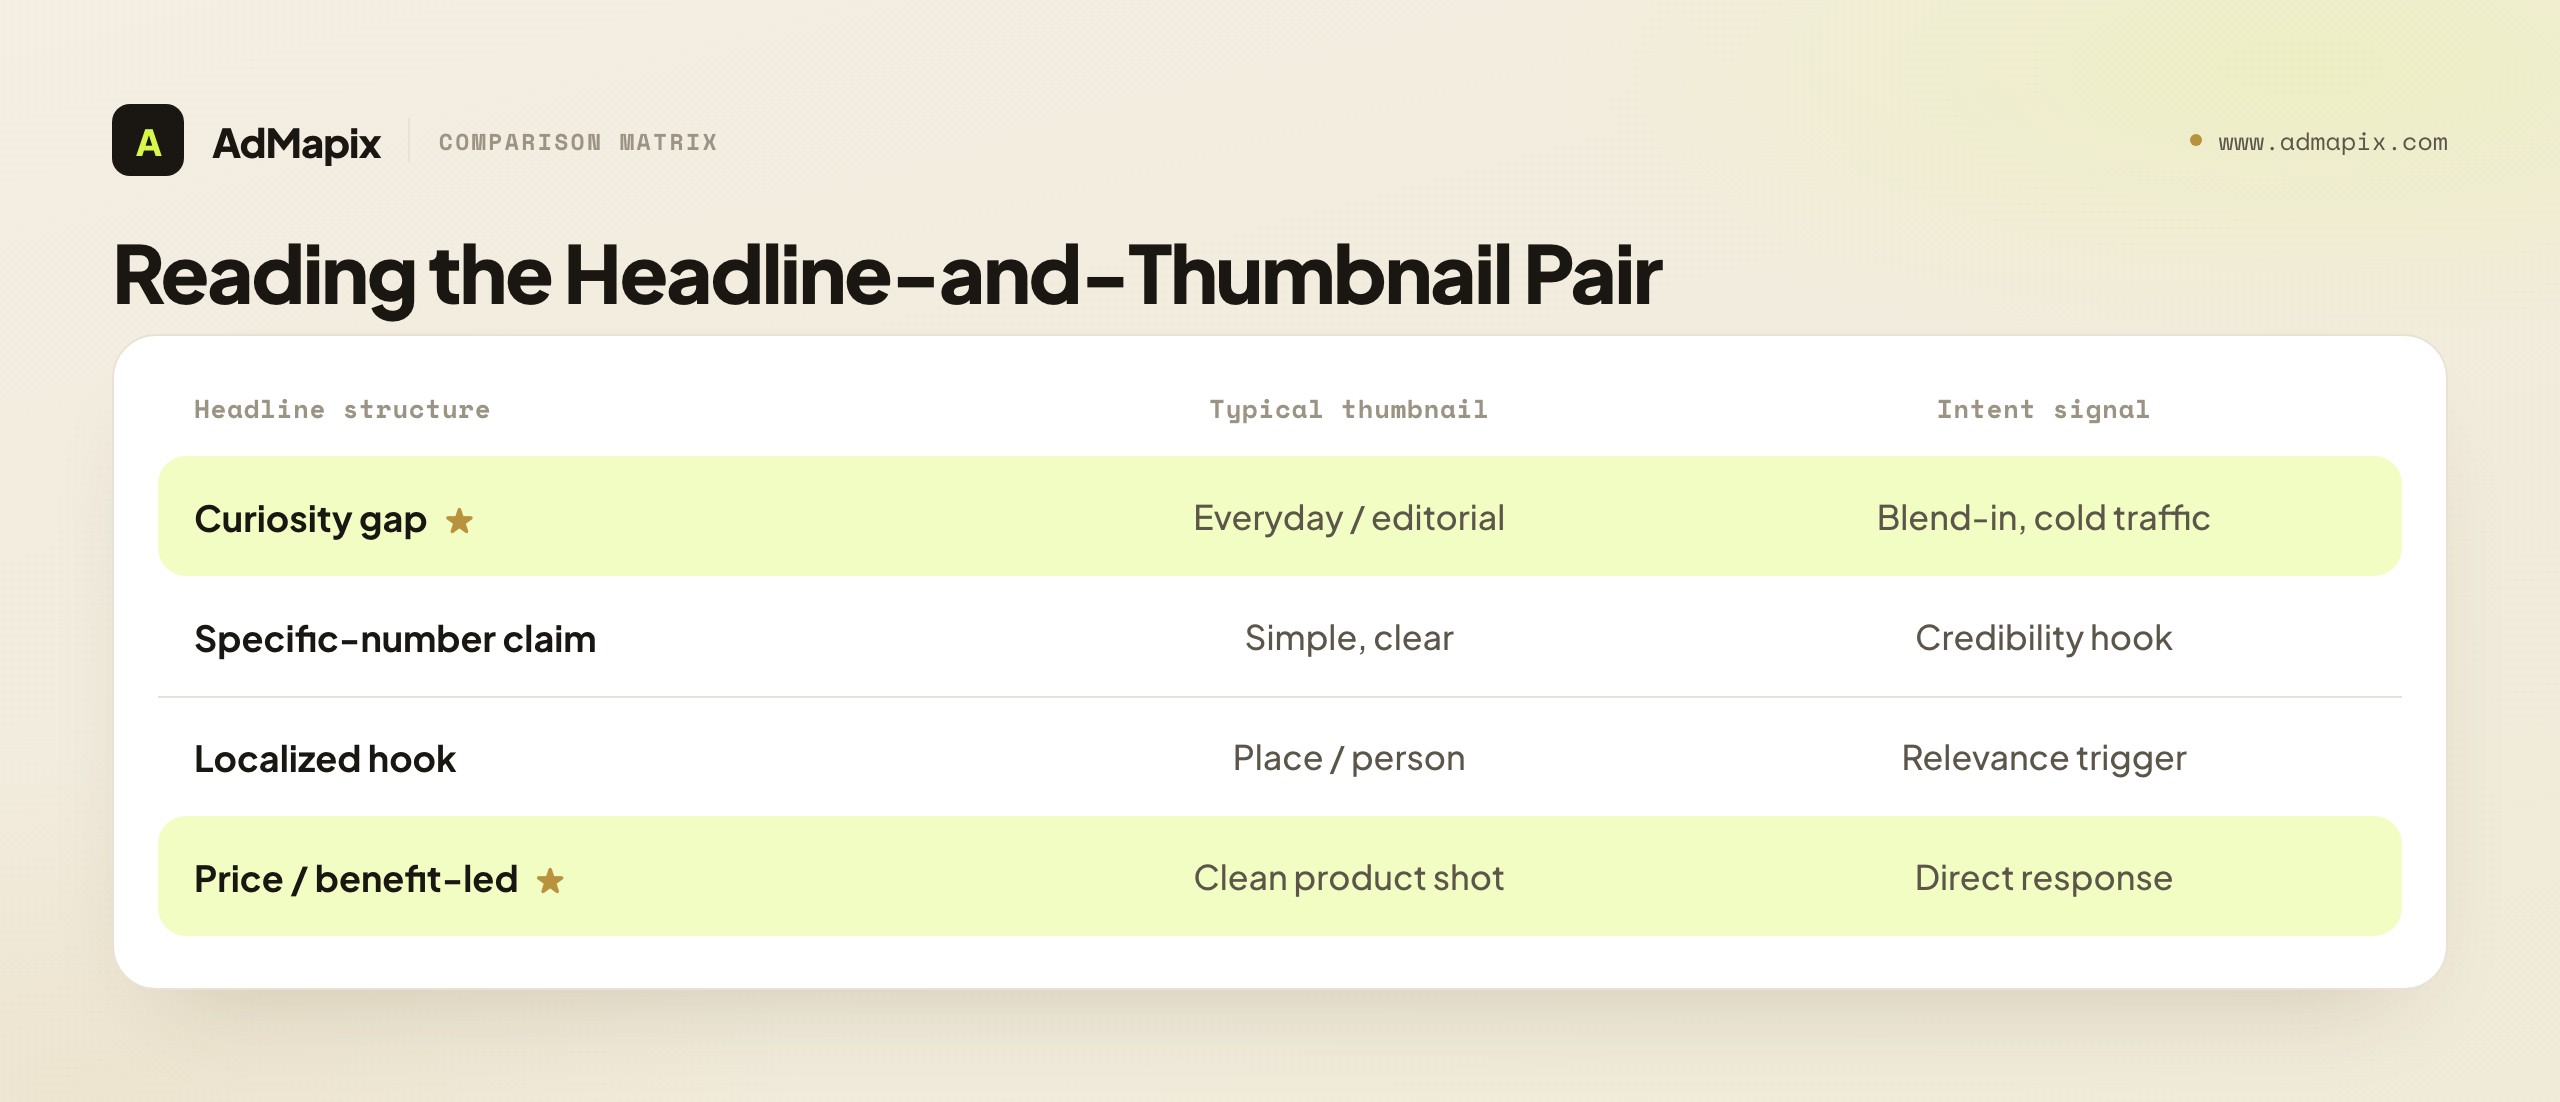
When you collect examples, read the pair as a unit, not as two separate elements. A strong curiosity-gap headline — the "why doctors are quietly switching to…" or "this is what happens when…" pattern — paired with an everyday, almost editorial thumbnail is a common native formula precisely because it mimics the content around it; the ad whispers rather than shouts, which is what works in a reading context. A clean product shot paired with a price-led or benefit-led headline signals a more direct-response intent, aimed at a visitor closer to a buying decision. A shocking or pattern-interrupt image paired with a bold claim is a third archetype, leaning hard on stop-the-scroll over blend-in. The job is to tag what kind of promise the pair makes, not just to describe what it shows — because the promise is the transferable lesson, and the specific image is not.
The compounding value comes from collecting enough pairs to see the formulas behind them. After studying fifty Taboola headlines in a vertical, you stop seeing fifty individual ads and start seeing the half-dozen structures they are built on: the curiosity gap, the specific-number claim ("3 signs you…"), the localized hook ("[City] drivers are stunned…"), the authority transfer ("doctors / experts say…"), the negativity bias ("avoid this common mistake…"), and the benefit-forward direct promise. A headline bank organized by structure, with a note on the offer and landing path behind each, is worth more than any single "winning" headline, because it teaches you the grammar of what works on the channel rather than handing you one sentence to copy. The grammar is what lets you write your own fresh headlines that fit the channel; the copied sentence just makes you the hundredth advertiser running the same line.
There is a reason structure beats copying that is specific to how native auctions and audiences behave. When you copy a competitor's exact headline, you are entering an auction against an advertiser who has likely been running and optimizing that creative for longer than you, against an audience that may already have seen it and gone numb. You inherit their fatigue without their head start. When you instead extract the structure — say, authority-transfer curiosity gap — and write a fresh headline on that frame for your own offer, you get the benefit of a proven pattern without the saturation of a specific line. This is the core reason disciplined native researchers think in formulas, not sentences: the formula is the durable, transferable asset, and the specific wording is the disposable, fatiguing surface. A swipe file full of copied sentences ages badly; a swipe file organized by structure stays useful indefinitely, because structures outlive the individual creatives built on them.
It also helps to read the thumbnail with the same structural eye, because the image is doing more work than it appears to. The native thumbnail competes for attention against genuine editorial images on the same page, which means its job is partly to look native enough to be trusted and partly to be intriguing enough to be clicked — a delicate balance. The archetypes recur: the everyday "could-be-editorial" photo that earns trust through ordinariness, the curiosity-provoking image that raises a question the headline answers, the simple product shot that signals direct-response clarity, and the pattern-interrupt image that trades blend-in for stop-power. Tag the thumbnail archetype alongside the headline structure, and you start to see which combinations recur — a curiosity headline almost always pairs with an editorial-style image, while a benefit headline pairs with a product shot — because the pair is engineered as a unit, and the pairing logic is part of the grammar you are learning. Reading the pair's internal logic, not just its two halves, is what separates surface collection from real native literacy.
The Advertorial and Landing-Path Layer
The destination matters as much as the ad, because on Taboola the click usually lands on an advertorial, a quiz, or a video sales page that does the real converting. Studying the ad without the landing path is like reading a book's cover and skipping the story. This is where a great deal of the actual strategy lives, and it is the part lazy research skips.
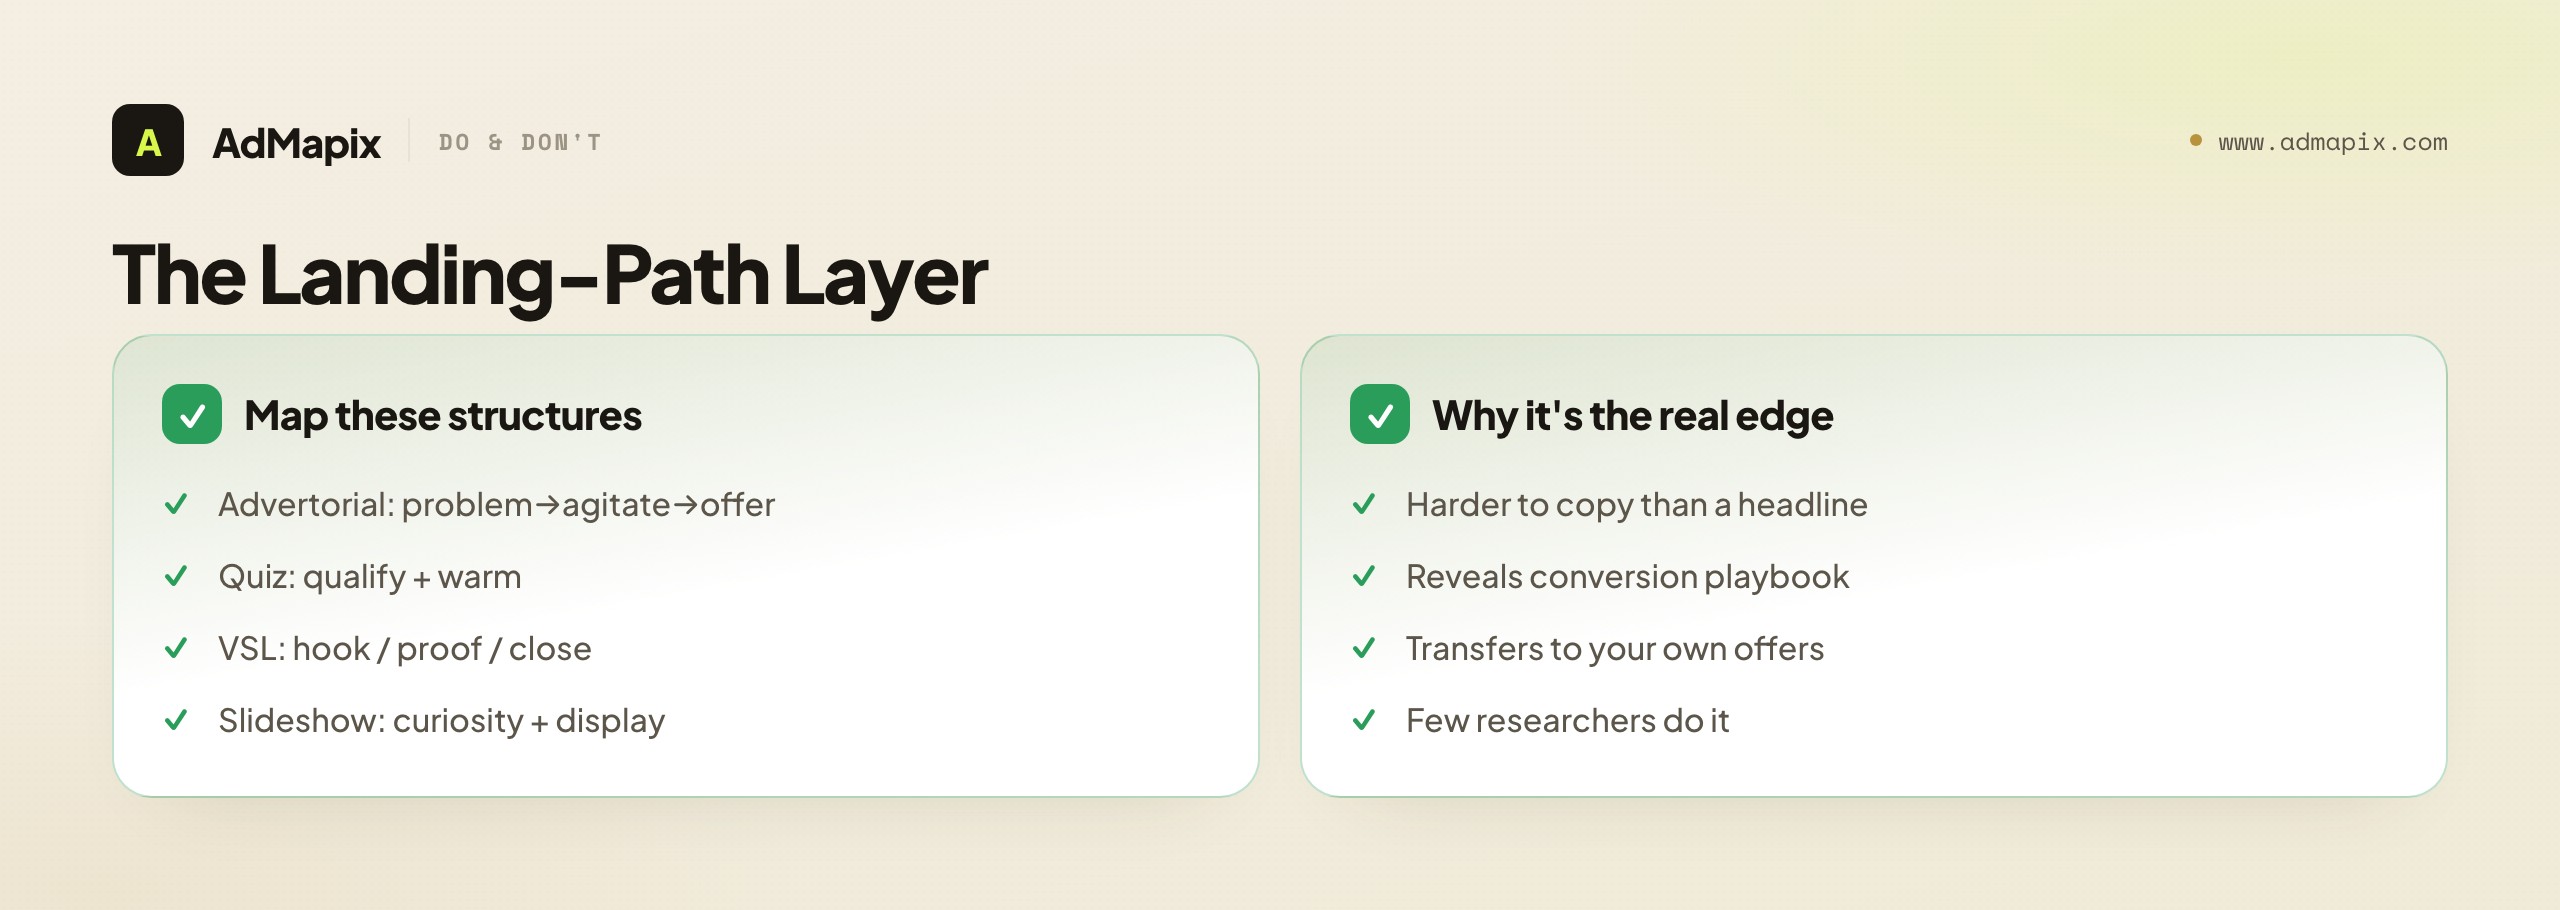
When you follow a Taboola click, map the structure of where it lands. An advertorial is a long-form "story" page — often styled to look like editorial content — that builds a narrative from problem to agitation to solution before introducing the offer. Note its arc: what problem it opens on, how it agitates, where the proof and testimonials land, how it transitions to the product, and what objection it preempts before the call to action. A quiz funnel qualifies and warms the visitor by asking questions, which both segments traffic and increases commitment before the offer; note what it asks and how it uses the answers. A video sales page defers persuasion to a video, which means the structure of that video — the hook, the proof, the close — is the thing to break down. Each of these is a different machine, and recognizing which machine an advertiser is using tells you a great deal about their strategy and sophistication.
The reason this layer is so valuable is that it is where the harder-to-copy intelligence lives. Anyone can screenshot a headline; far fewer researchers do the work of mapping the advertorial structure behind it, which means the teams that do gain a real edge. When you see the same advertorial structure behind multiple winning headlines from the same advertiser, you have learned their conversion playbook, not just their hook — and that playbook is far more transferable to your own offers than any single creative. Build your landing-path map alongside your headline bank, and the two together become a genuine model of how native conversion works in your vertical, rather than a scrapbook of ads.
Reading the Retargeting Trail
One underused source of public evidence is the retargeting trail — what happens after you click a competitor's Taboola ad and browse their funnel. Because retargeting is delivered through ad systems based on your behavior, you can deliberately trigger a competitor's retargeting and observe the sequence of creatives they use to bring a visitor back.
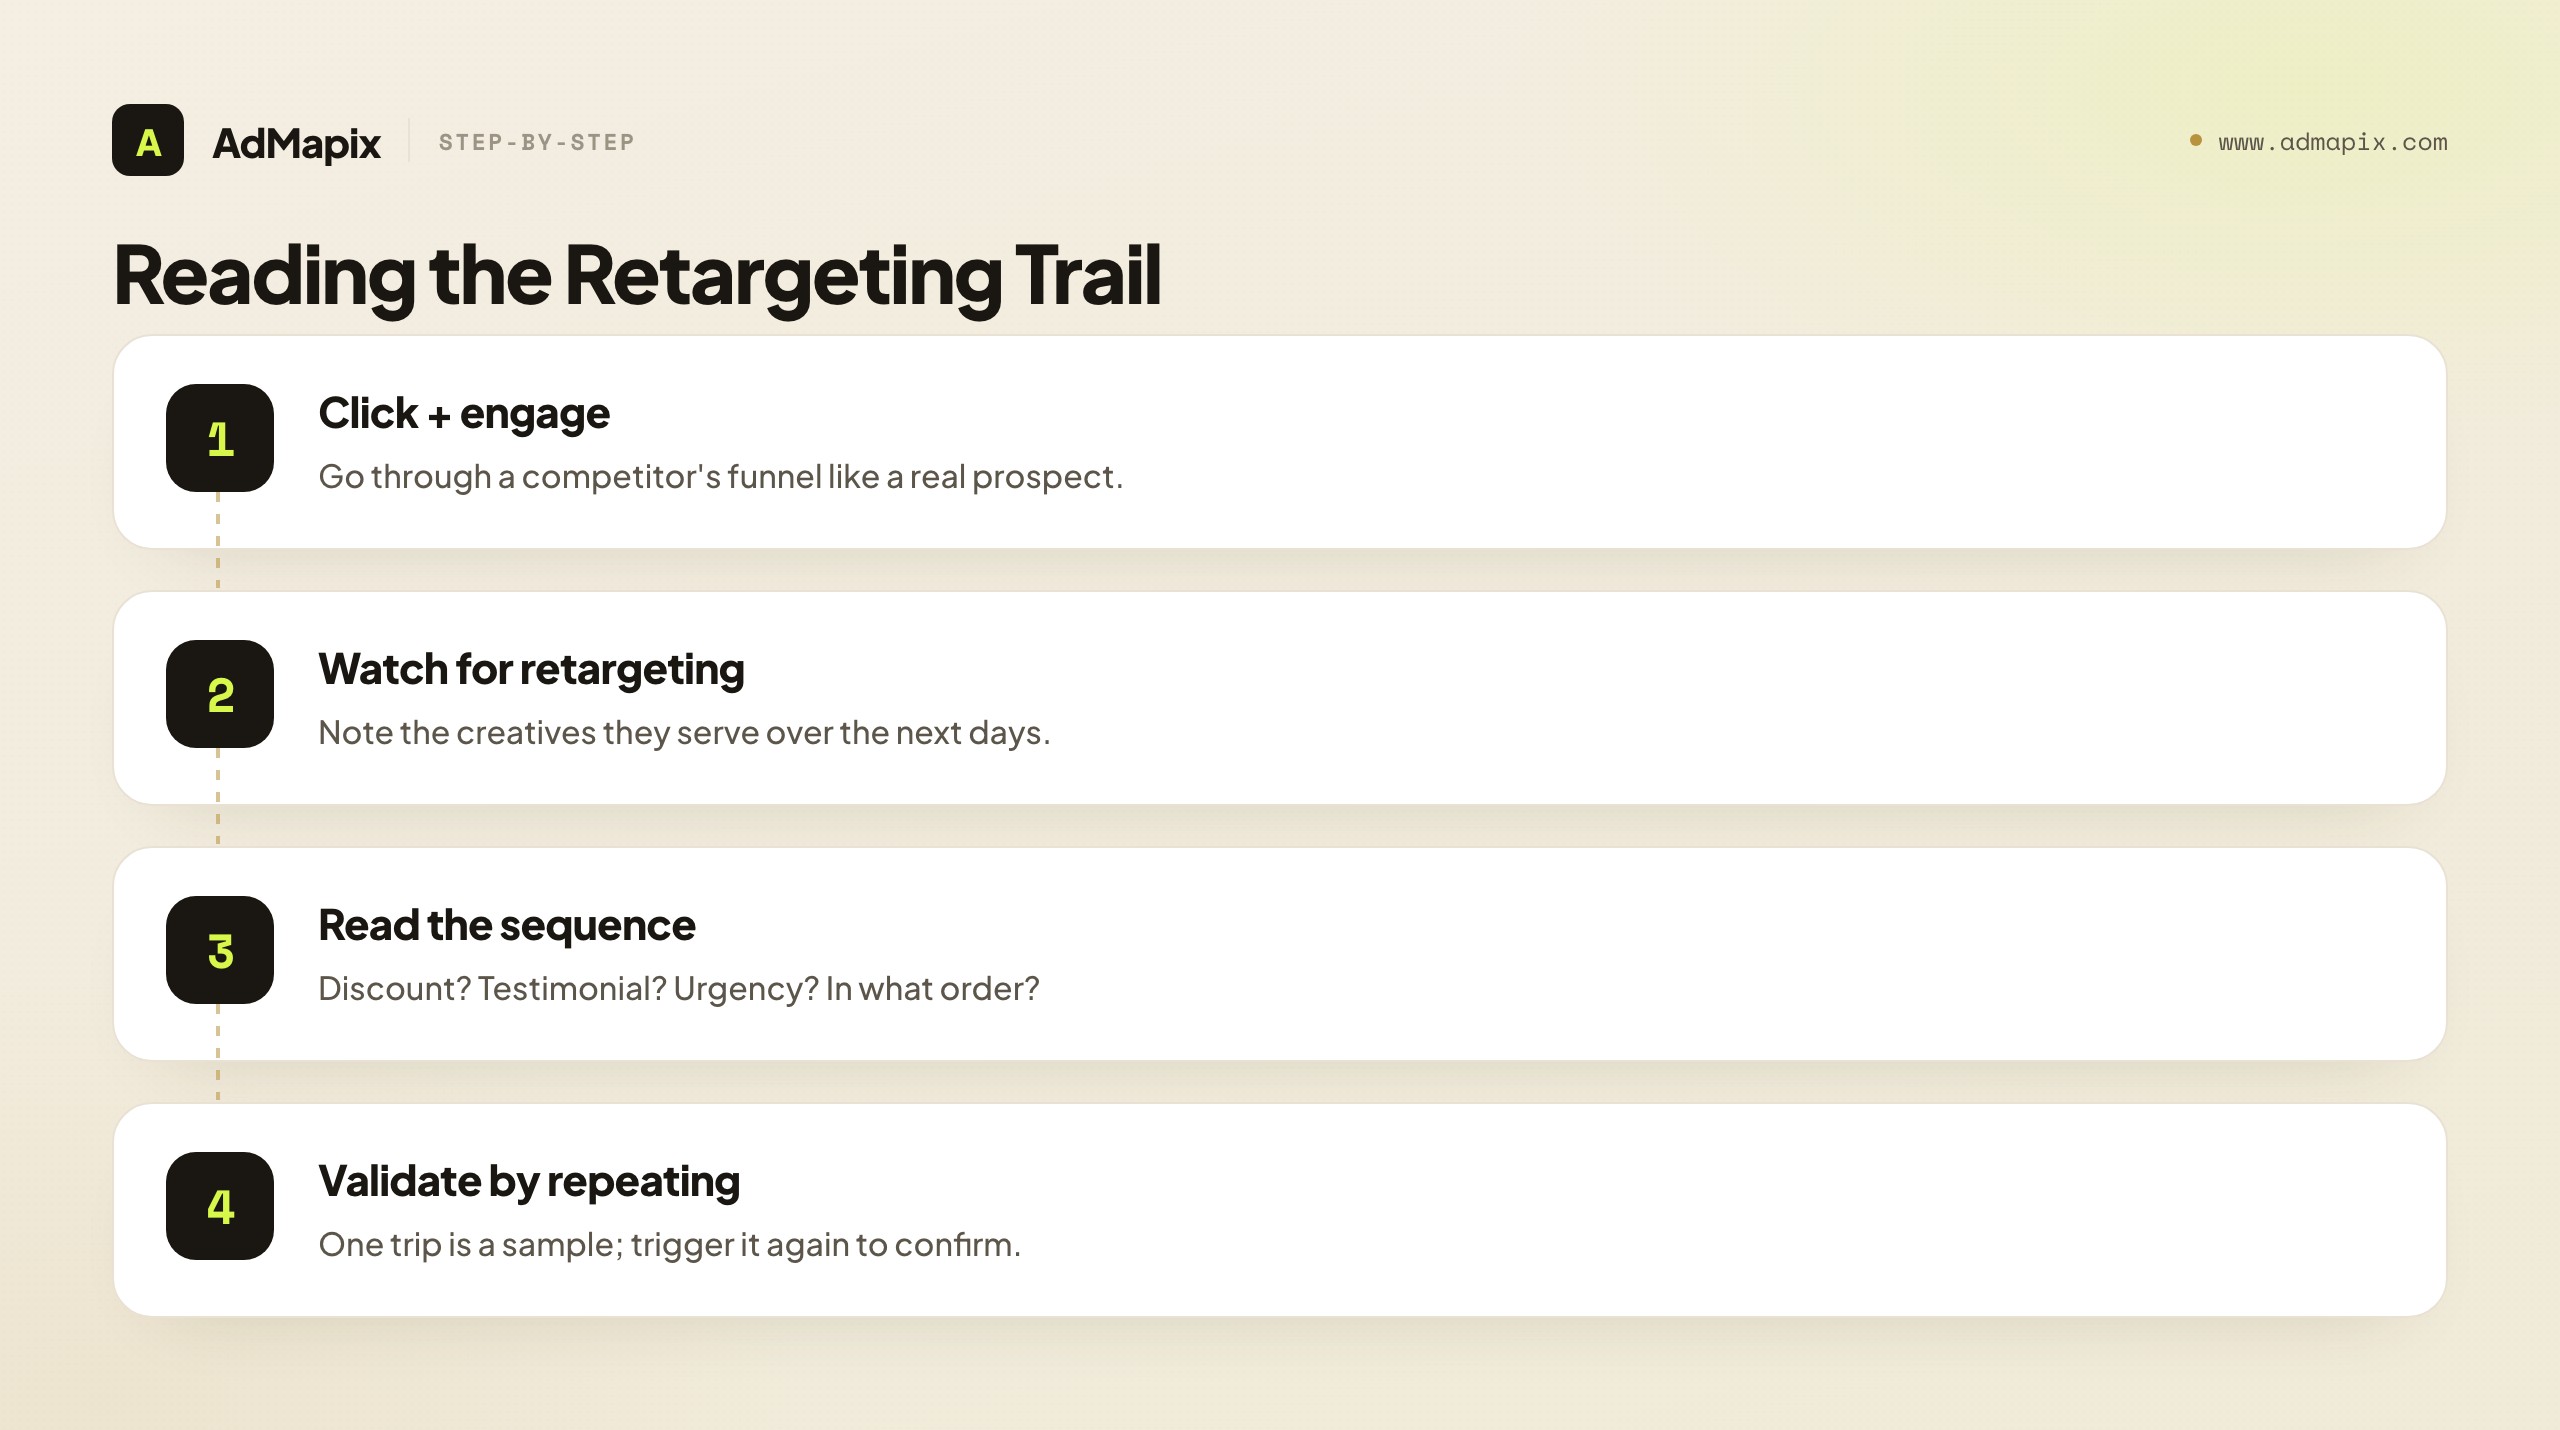
The method is straightforward and entirely based on observing ads served to you: click a competitor's native ad, engage with their advertorial or landing page the way a genuine prospect would, and then watch over the following days for their retargeting ads to appear across the sites and feeds you browse. The sequence reveals strategy you cannot see from the original ad alone — whether they lead retargeting with a discount, a testimonial, an urgency message, or a different angle entirely, and how that sequence is paced. A competitor who retargets with a strong offer after a content-led first touch is running a different playbook than one who retargets with more social proof, and that difference is a real, observable signal about how they think about converting cold-to-warm traffic.
The honest caveats matter here too. You are observing the creative sequence, not the targeting rules — you can see what they retarget with, not the exact conditions that trigger each step or how much they spend on it. And a single trip through a funnel is a sample, not a complete map; the sequence you see may differ for other visitors or segments. Treat the retargeting trail as a rich source of creative-strategy hypotheses — "they seem to lead with proof, then offer" — and validate the pattern by triggering it more than once before you treat it as their settled approach. Used with that discipline, the retargeting trail turns a one-shot ad view into a view of a competitor's whole nurture sequence, which is one of the highest-value things public observation can give you.
A Repeatable Taboola Research Workflow
The fastest path from a native ad to a decision is the same every time. Name the decision first, then collect evidence against it, then turn the evidence into a brief — a tool or a manual process only helps if it ends in a testable next action.
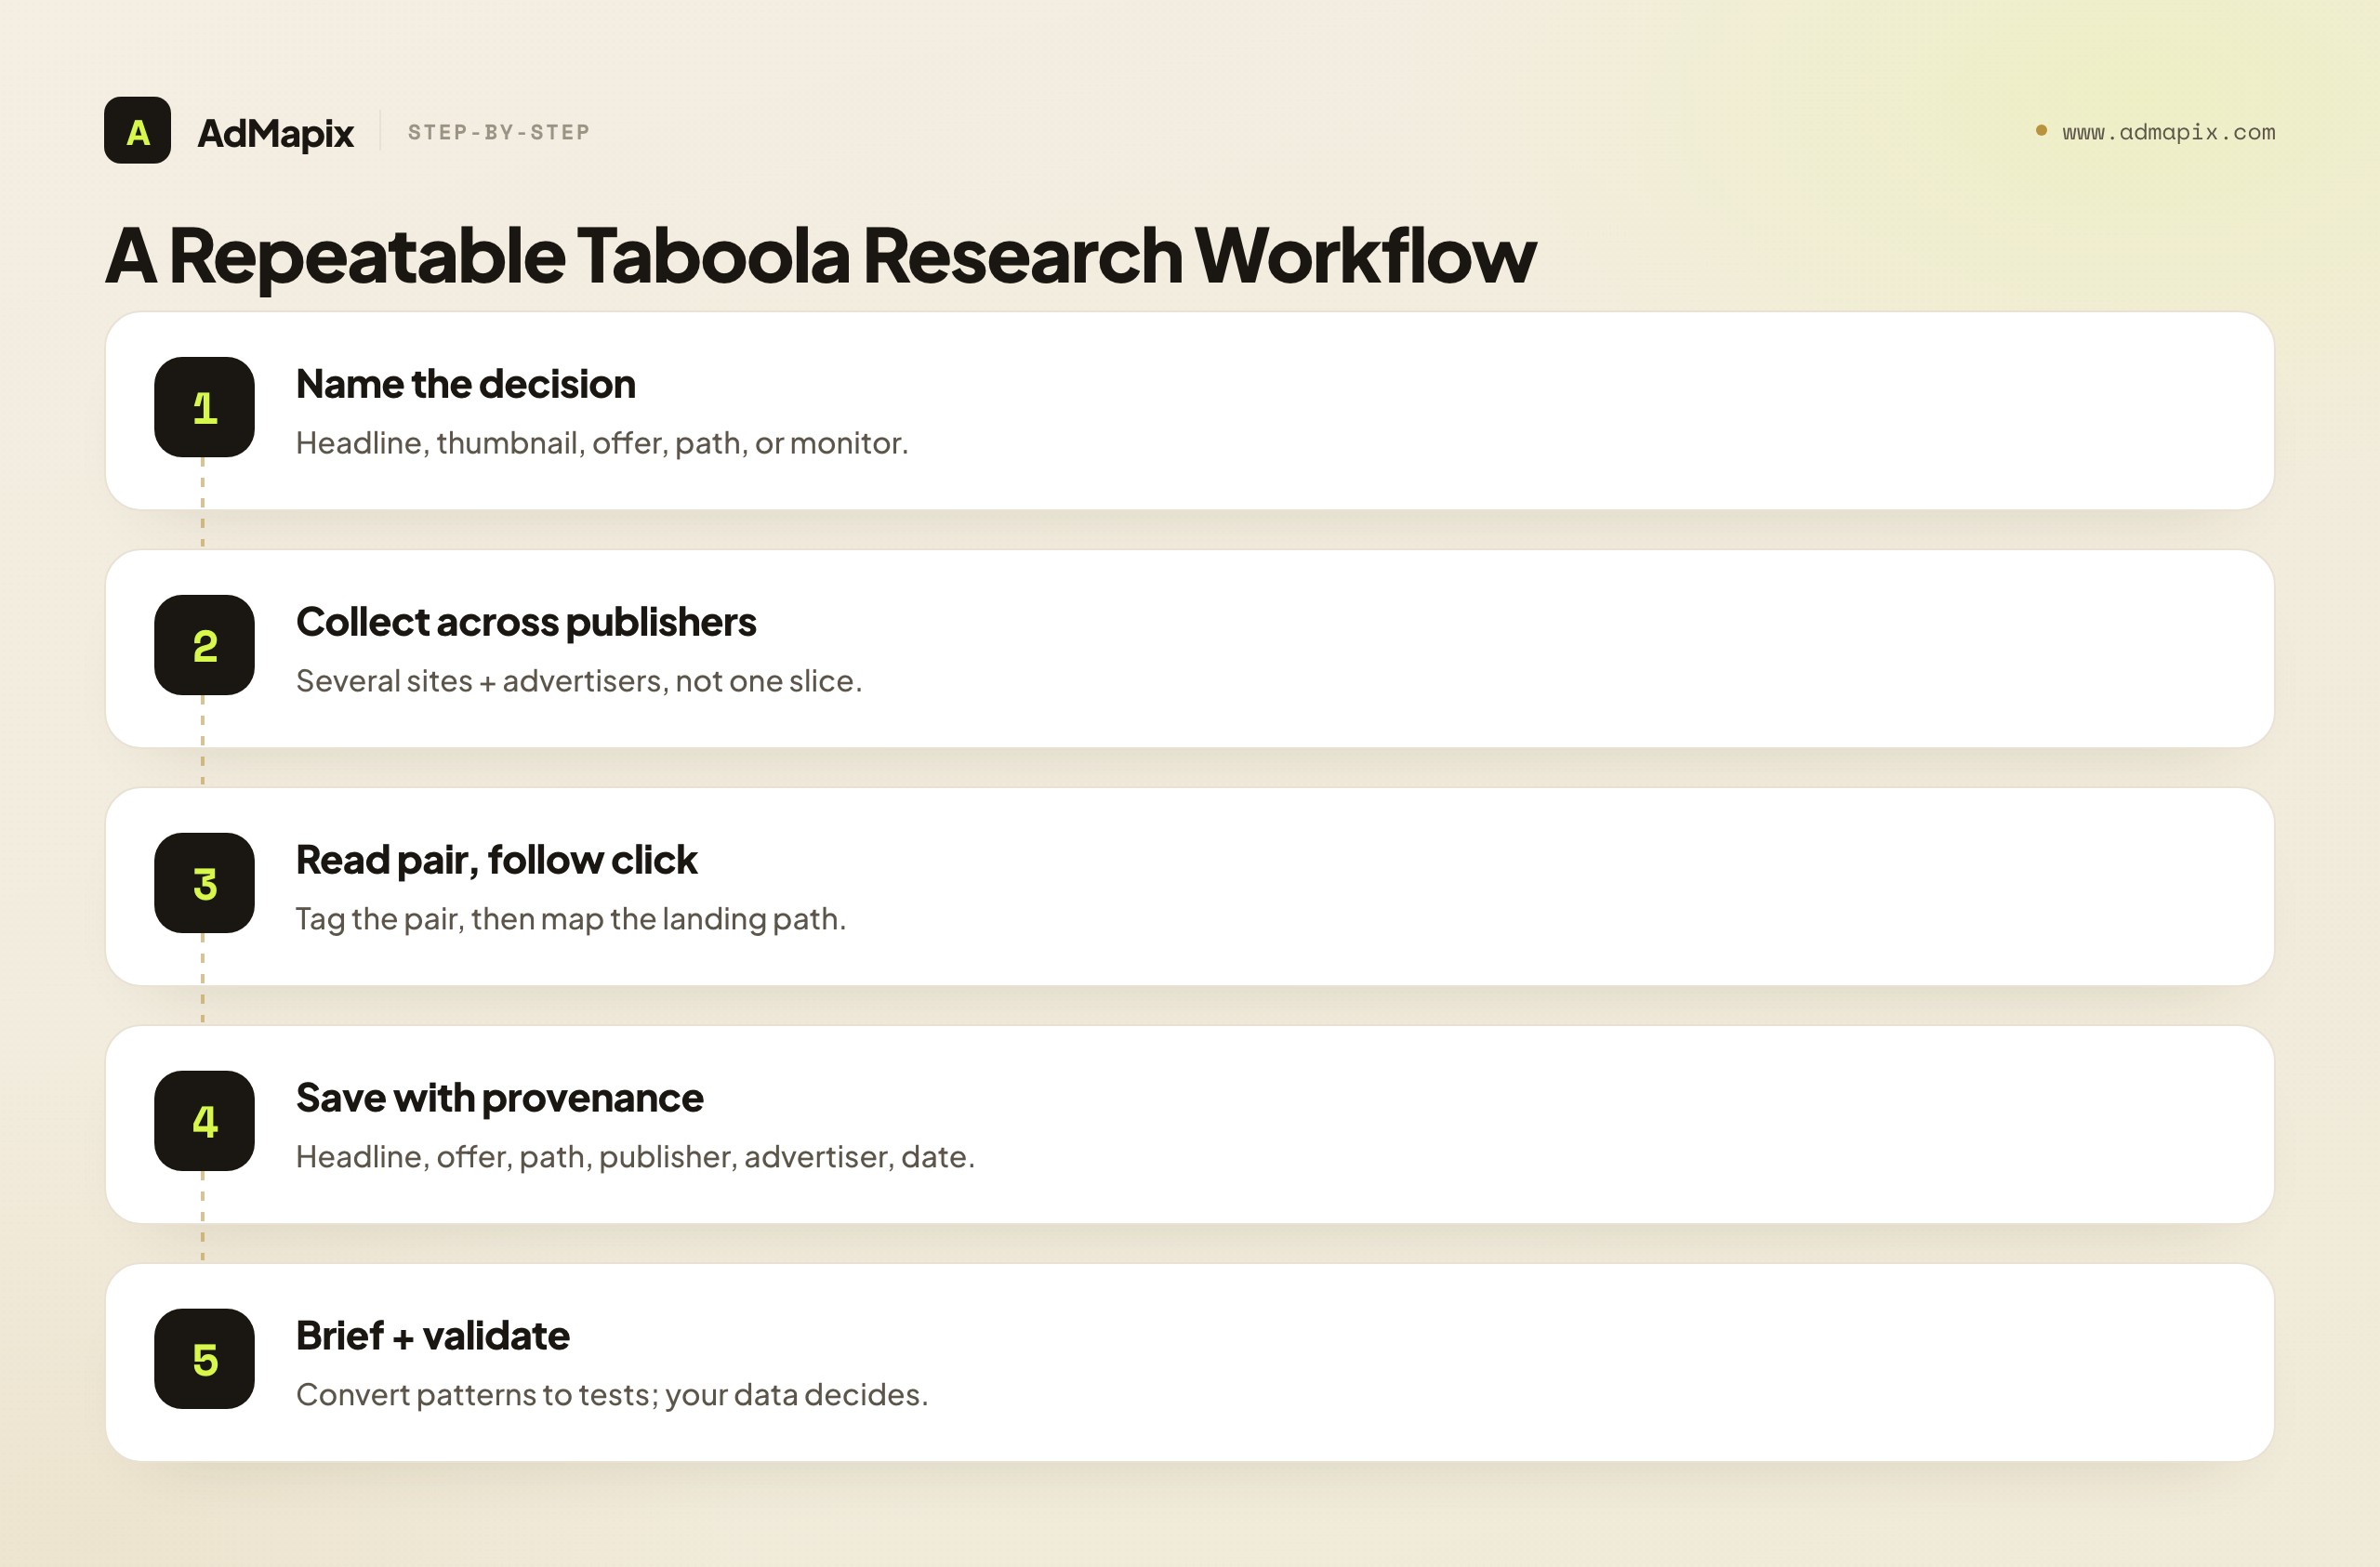
- Name the decision. Headline research, thumbnail research, offer teardown, landing-path mapping, or a competitor monitor are different jobs that need different collection. Write down which one you are doing before you start.
- Collect across publishers, not one site. Native creative is distributed, so gather examples from several publisher contexts and several advertisers in your vertical, so you see patterns rather than one site's slice.
- Read the pair, then follow the click. For each example, tag the headline structure and thumbnail archetype, then follow the click and map the landing path — advertorial, quiz, or VSL.
- Save with provenance. Keep the headline, the thumbnail, the offer, the landing path, the publisher context, the advertiser, the date, and a one-line note on why it matters. Provenance is what makes the evidence comparable next month.
- Convert patterns into a brief, then validate. Turn the repeating structures into a creative test backlog — and remember that your own click and conversion data, not the spy evidence, decide whether a borrowed pattern actually works for you.
The discipline is in steps 3 through 5. Anyone can screenshot native ads; the advertisers who win are the ones who read the full pair-plus-path, save with context, convert patterns into briefs, and validate against their own performance before scaling. Do that and the research compounds into a model of what works on the channel; skip it and you accumulate a folder of headlines you will never reopen.
Provenance — step 4 — is the step most people skip and the one that quietly determines whether the research compounds. A saved Taboola headline with no note on the offer, landing path, publisher, and date is a sentence you will not remember the point of in three weeks. The same headline saved with "supplement offer, advertorial → quiz → VSL, ran on [publisher type], looked early not saturated, June" is a data point you can sort, compare, and build a brief from. Ten seconds of provenance per save is what turns a month of browsing into a dataset. And step 5 — validation — is the boundary that keeps research honest: the evidence generates hypotheses about what converts, but only your own funnel data confirms whether a pattern works for your offer, audience, and economics.
What Public Data Can and Cannot Prove
This deserves its own section because it is the single most misread point in native research, and getting it wrong is what turns a research habit into an expensive way to copy losers. Public Taboola evidence proves what is running, not what is winning.
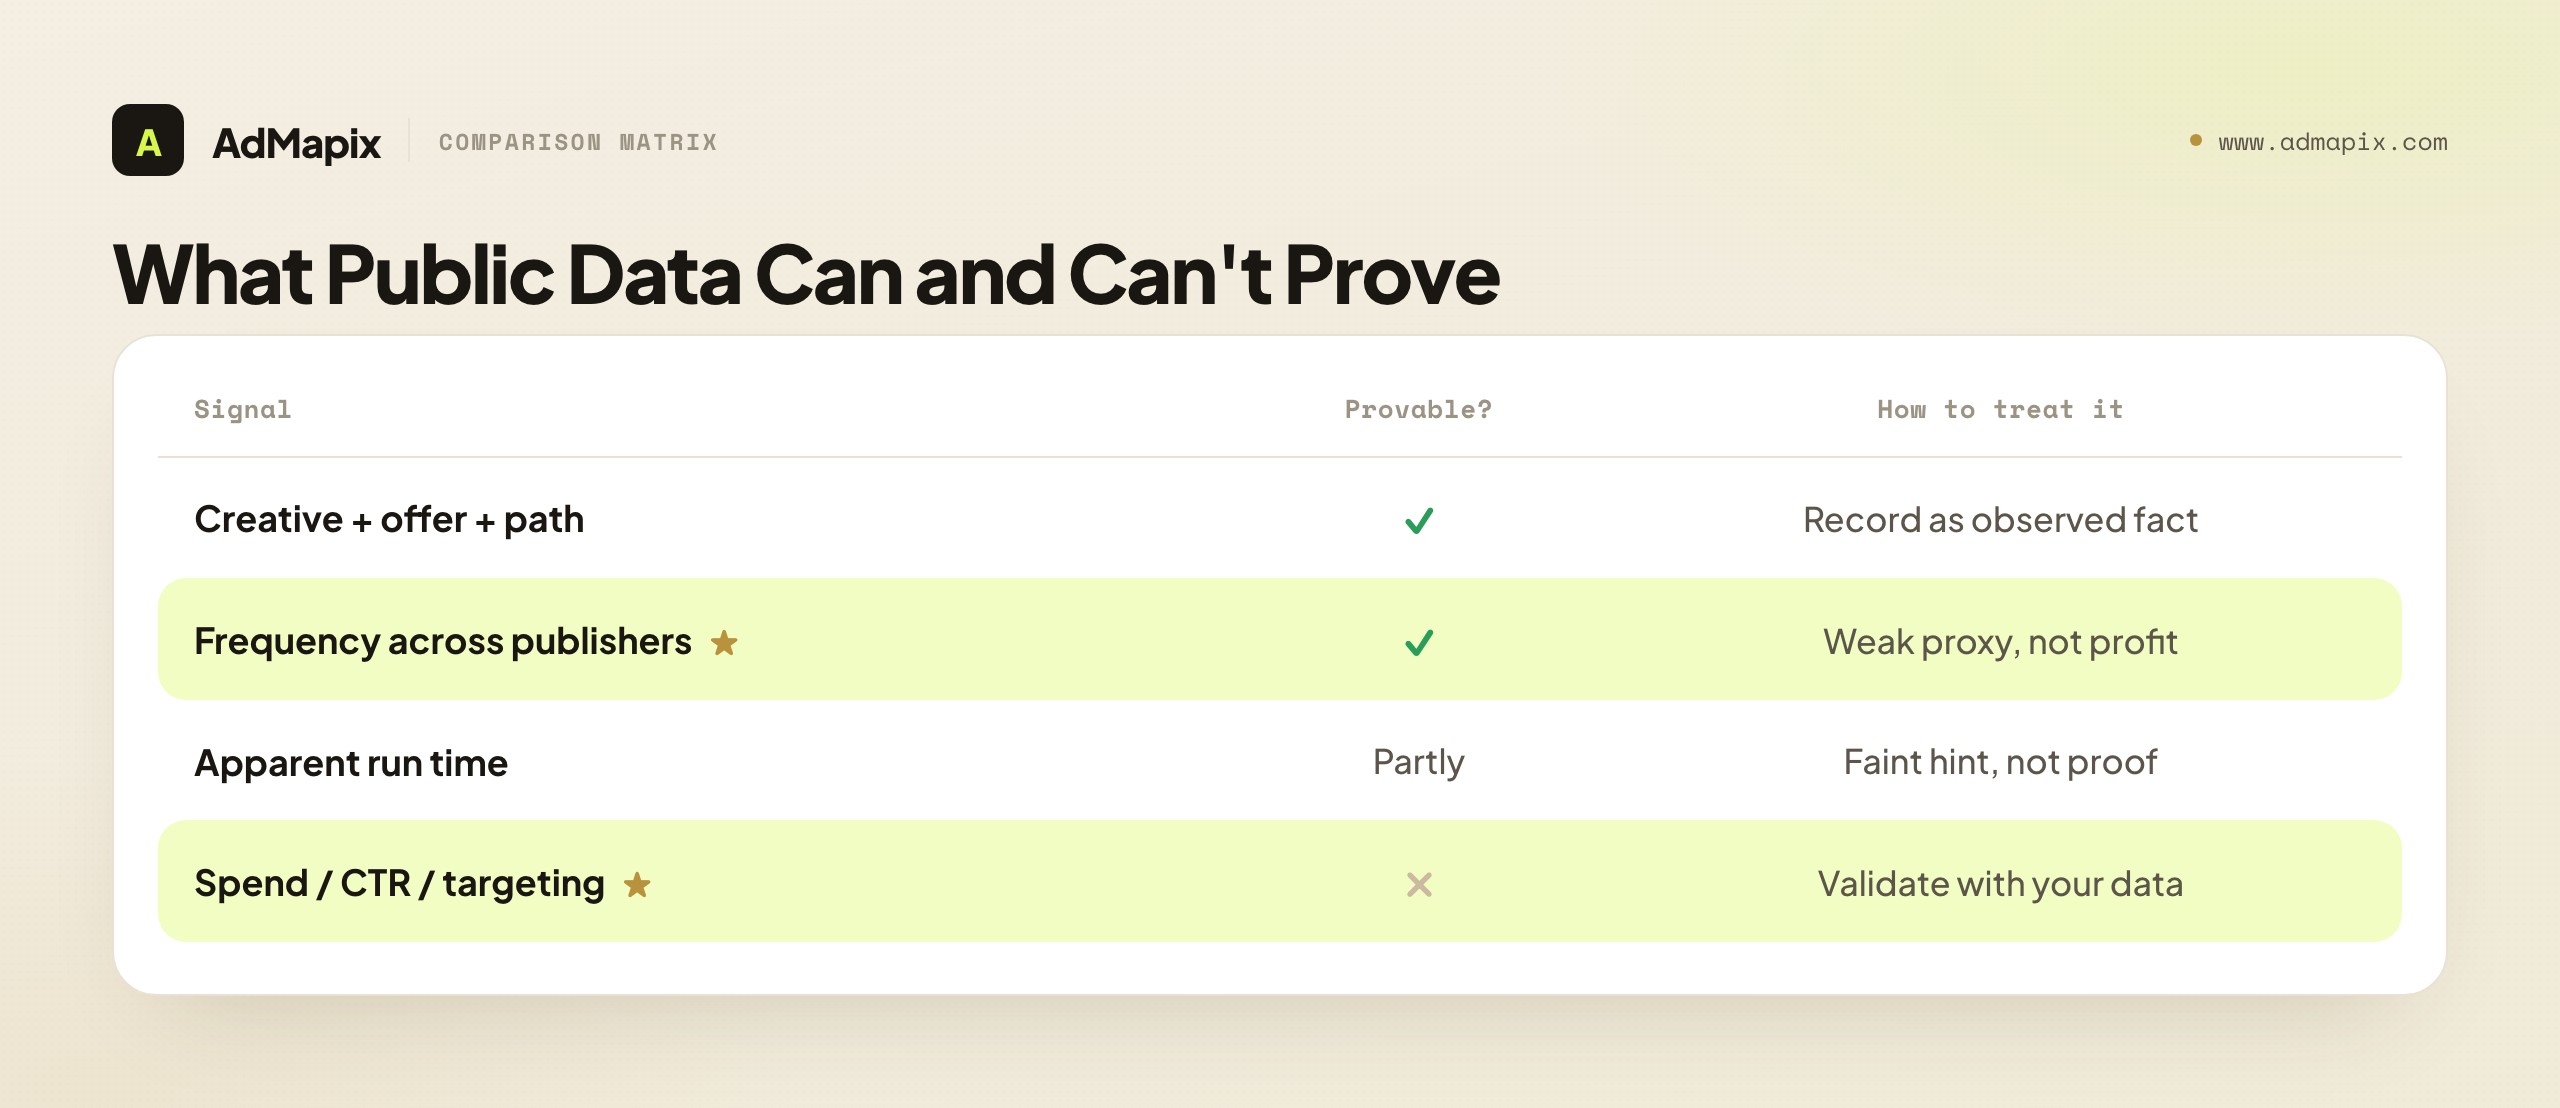
When you see a competitor's Taboola ad, you are seeing that the creative exists and, sometimes, that it appears across multiple publishers. You are not seeing the spend behind it, the click-through rate, the conversion rate, the return on ad spend, or the targeting. A native headline that seems to be everywhere might be a scaled winner — or an advertiser who has not yet figured out it is losing money. Frequency and apparent longevity are weak proxies: an ad can run widely and still be unprofitable, and a quiet ad can be a quiet winner you simply did not sample. There is a specific native version of the longevity trap worth naming — "this advertorial has been running for months, so it must convert." The logic is plausible but the data is unreliable, because you cannot precisely confirm how long it has truly run, whether it was paused and restarted, or at what budget. Use apparent persistence as a faint hint about where to look, never as proof of profit.
So treat every pattern as a hypothesis. "This curiosity-gap structure repeats across five advertisers in my vertical" is a strong, testable idea — strong because the repetition across independent advertisers is a meaningful signal that the structure survives the auction, but still a hypothesis, not a guarantee it will convert for your offer. "This thumbnail style keeps appearing" is worth a test, not a copy-paste. Validate every borrowed pattern against your own click and conversion data before you scale spend behind it. And weight earlier, quieter signals over the loudest ones, because by the time a native angle is unmissable across the whole network, the early advertisers with offer and audience edges have often captured the easy margin, and the late copier inherits a crowded auction and a fatigued audience. In native, speed-with-discipline beats certainty, because certainty only arrives after the opportunity has.
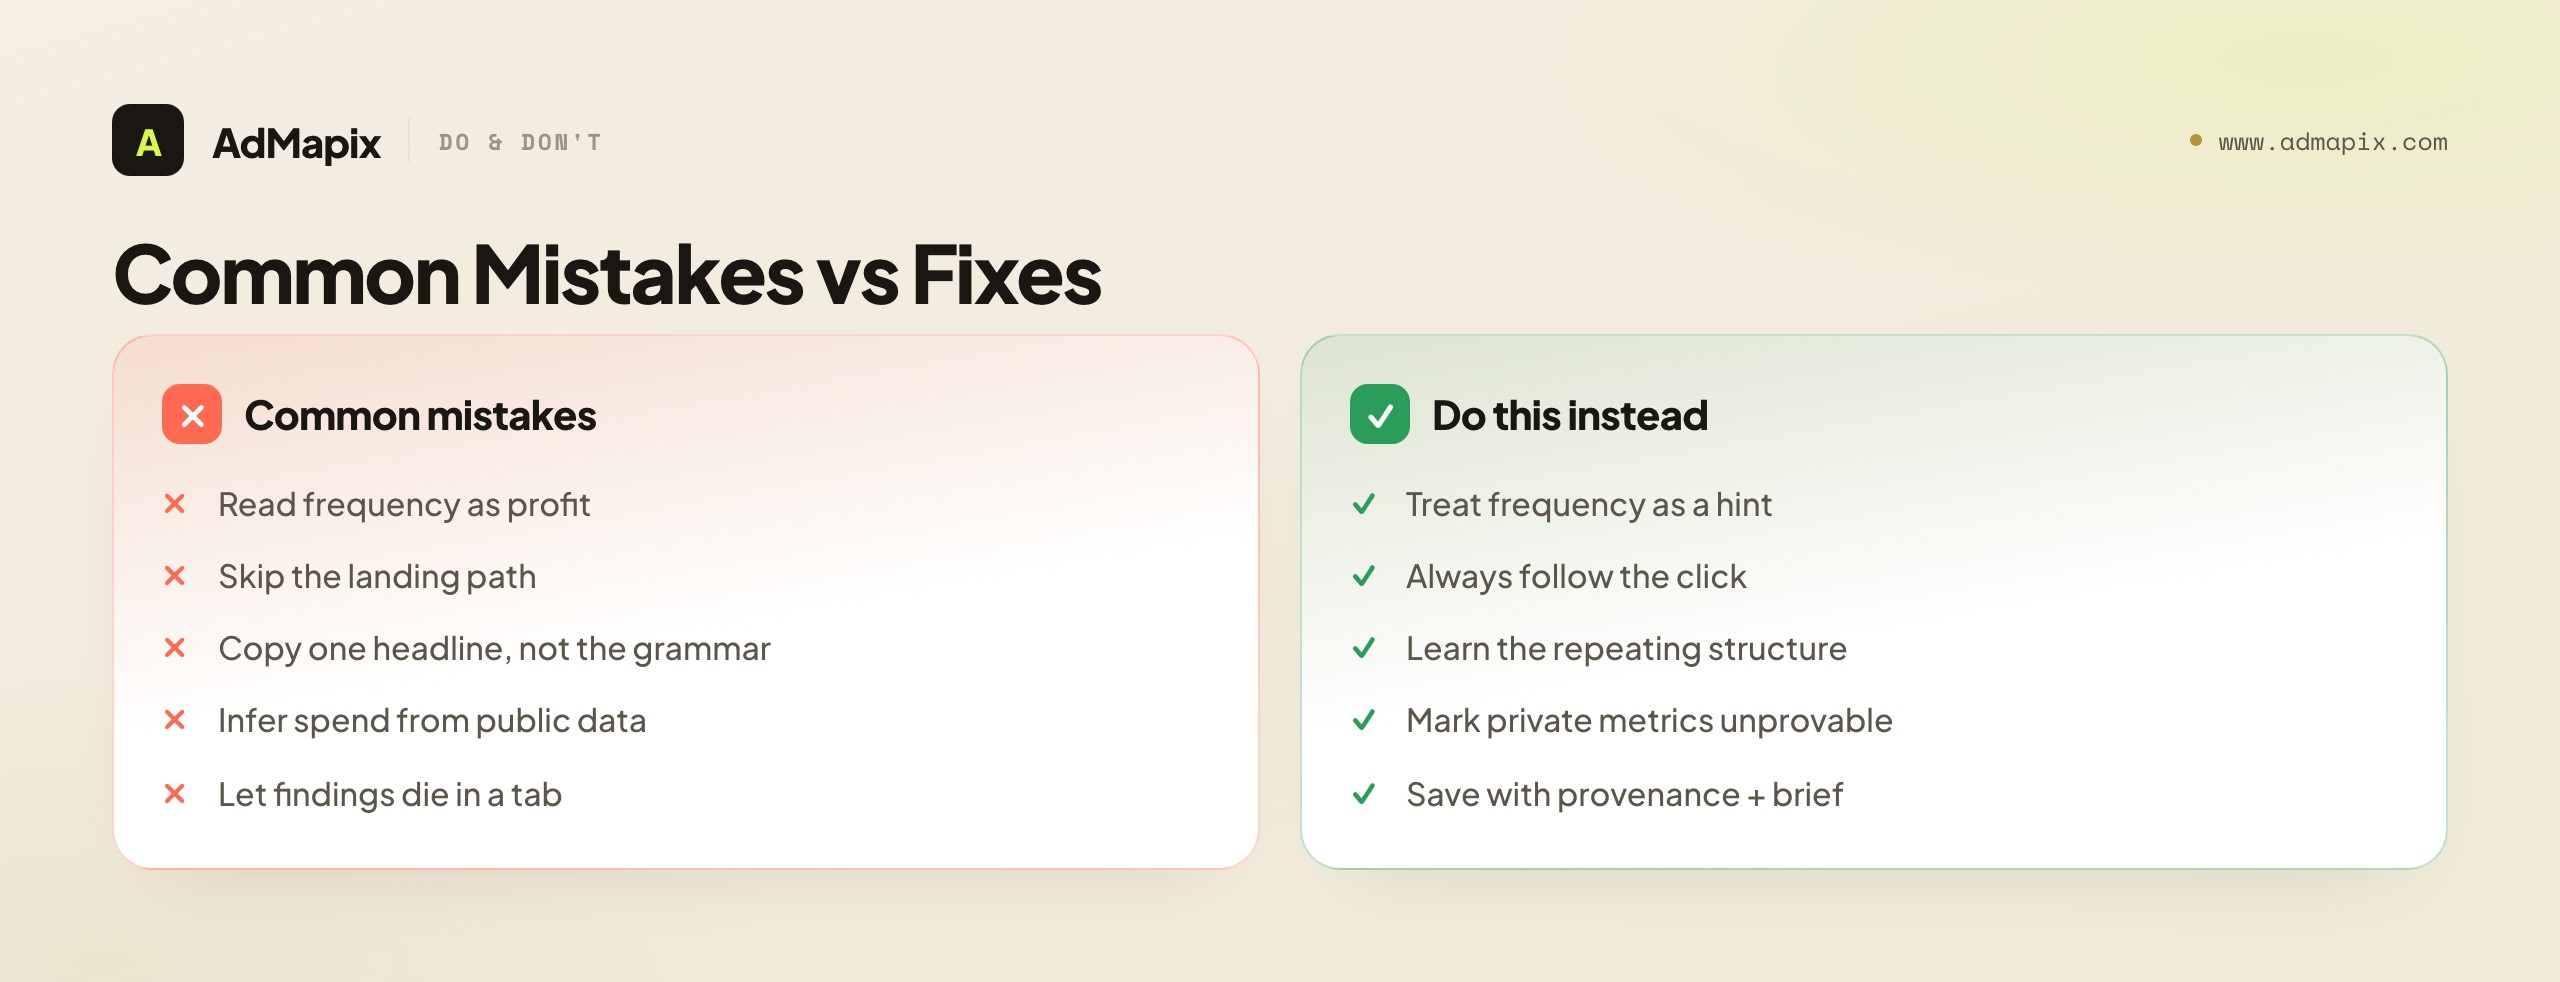
Common Mistakes in Taboola Research
Most wasted effort in Taboola research traces back to a few avoidable errors.
- Treating frequency as proof of profit. A headline appearing everywhere is a hint, not a verdict. Frequency and longevity are weak proxies; only your own conversion data proves a pattern works.
- Studying the ad and skipping the landing path. On Taboola the advertorial or quiz does the real selling. Researching the headline without following the click is reading the cover and skipping the story.
- Copying one headline instead of learning the grammar. The value is in the repeating structure across many ads, not any single line. Copy a structure to adapt, not a sentence to clone.
- Inferring spend, CTR, or targeting from public data. None of those is public on Taboola. Any such number is an estimate or a guess and should be labeled as one, never presented as fact.
- Researching one publisher's slice. Native creative is distributed; one site's recommendations are not the market. Collect across publishers and advertisers to see real patterns.
- Chasing the loudest, most-saturated angle late. By the time an angle is unmissable, the easy margin is usually gone. Weight earlier, quieter signals and move fast on small tests.
- Letting findings die in a browser tab. A native example with no provenance and no next action is decoration. Save with context and convert it into a brief, or the research evaporates.
The two costliest errors are the first and the second: reading frequency as proof, and skipping the landing path. They share a root — mistaking the visible surface for the whole story. The discipline that prevents both is the same: treat visible creative as a hypothesis, always follow the click into the page where the selling happens, and validate every pattern against your own data before you scale. Hold that line and Taboola research makes you sharper; drop it and it makes you a confident copier of other people's losers.
Is There a Public Taboola Ad Library? The Honest State of Native Transparency
A reasonable question, given how much social-ad research now leans on official libraries: is there a Taboola ad library you can search the way you search the Meta Ad Library? The honest answer is that native transparency works very differently from social, and you should not expect a single comprehensive, free, searchable archive of every Taboola ad the way Meta's regulatory-driven library provides for social and political ads.
Native networks like Taboola were not built under the same political-ad transparency mandates that forced social platforms to publish public ad libraries, so the native research landscape is more fragmented. Taboola does surface some public-facing trend and discovery information — its own trend and newsroom-style content gives a directional read on what topics and content are gaining attention — but that is a content-trends signal, not a complete, queryable archive of every advertiser's creatives with run dates and placement detail. The practical consequence is that comprehensive Taboola research is assembled, not looked up: you gather creative evidence from the network in the wild, from third-party native-research tools that index native ads across publishers, and from your own disciplined collection, rather than querying one official source. This is exactly why the workflow above emphasizes collecting across publishers and saving with provenance — in the absence of one authoritative library, your own well-organized swipe file becomes the closest thing you have to a searchable archive of your vertical.
This is also where third-party native ad spy tools earn their place. Because there is no single official Taboola library, tools that crawl and index native creative across many publishers do real work: they aggregate what is otherwise scattered, and they let you search and filter native ads in a way the network itself does not offer publicly. The honest framing is that these tools are aggregators of public creative evidence, not windows into private metrics — they can show you more native creatives, faster, than you would find by hand, but they are bound by the same can't-prove boundary as everything else. They can prove what is running and where; they cannot prove spend, CTR, or targeting, because that data is not theirs to have. Use them for the breadth and speed they genuinely add, and hold their data to the same fact-versus-inference standard you hold your own.
Reading Native Ads by Content Vertical
Native creative does not behave the same across verticals, and reading it well means knowing the conventions of the space you research. The headline-and-thumbnail formulas, the offer types, and the landing-path structures vary enough by vertical that importing a pattern from one into another often misfires.
In health and supplements — one of native's largest categories — the dominant pattern leans on curiosity gaps, authority transfer ("doctors are switching…"), and long advertorials that build a problem-agitation-solution narrative before a video sales page or a subscription offer. The thumbnails tend toward everyday, editorial-looking images rather than slick product shots, because blending in is the point. In finance and personal finance, the hooks lean on specific numbers, localized angles ("[State] residents may qualify…"), and a tone of insider information, with landing paths that often run through quizzes that qualify the visitor before an offer. In ecommerce and direct-to-consumer, native increasingly runs more direct-response creative — clearer product shots, benefit-led headlines, and shorter paths to a product page or a listicle of products. In content arbitrage and "around the web" entertainment, the creative is pure curiosity, and the landing path is often a multi-page slideshow monetized by display ads rather than a single product sale.
The lesson is to research within your vertical's conventions and be cautious about transplanting patterns across them. A curiosity-gap health structure that converts cold traffic may fall flat in direct-response ecommerce, where the visitor expects clarity, not mystery. When you build your headline bank and landing-path map, organize them by vertical, and treat a cross-vertical pattern as an experiment rather than a proven play. Knowing the grammar of your specific native vertical is what separates research that informs good tests from research that produces plausible-looking briefs that do not convert.
A Worked Walkthrough: Researching One Native Advertiser End to End
To make the workflow concrete, here is how a disciplined session researching a single Taboola advertiser actually runs, from first sighting to a testable brief. Suppose you spot a supplement advertiser's native ad in your vertical and want to understand their whole approach.
You start with the pair: you note the headline structure (say, an authority-transfer curiosity gap) and the thumbnail archetype (an everyday, editorial-style image). You record both with provenance — the publisher context, the date, the advertiser. Then you follow the click. It lands on an advertorial, so you map its arc: the problem it opens on, where it agitates, where the testimonials and proof land, how it transitions to the product, and the offer at the end. You notice the advertorial leads to a video sales page, so you break down that video's hook, proof, and close as well. Now you have not just an ad but a model of this advertiser's funnel: hook → advertorial story → VSL → offer.
Next, you broaden. You look for the same advertiser's other native ads across publishers and find three more headlines — all variations on the same authority-transfer structure, all leading to advertorials with the same arc. That repetition is the signal: this is not a one-off test but a structure the advertiser is committed to, which means it is likely surviving the auction. You then trigger their retargeting by engaging with the funnel, and over the next days you observe that they retarget with a testimonial-led creative followed by a discount — telling you how they convert warm traffic. Finally, you convert all of it into a brief: not "copy their headline," but "test an authority-transfer curiosity-gap headline structure, leading to an advertorial with this problem-agitation-solution arc, for our offer, and plan a testimonial-then-discount retarget sequence." That brief is the product of the research — a testable hypothesis grounded in a repeated, observed pattern, with every private-metric assumption explicitly left out. That end-to-end discipline is what separates research that drives good tests from a folder of screenshots.
Building a Native Swipe File That Compounds
A swipe file is only valuable if it is organized to answer future questions, and most are not — they are a chronological dump of screenshots that gets less useful as it grows. A Taboola swipe file built to compound is structured around the things you will actually search for later.
The organizing principle is to file each example by what it teaches, not by when you saved it. Tag each entry with the headline structure (curiosity gap, specific-number, localized, authority transfer, negativity, direct benefit), the thumbnail archetype (editorial, product shot, pattern-interrupt), the offer type, the landing-path structure (advertorial, quiz, VSL, slideshow), the vertical, and the date. With those tags, your swipe file becomes queryable: when you need to brief a finance quiz funnel, you can pull every finance-vertical example with a quiz landing path and study the pattern across them, rather than scrolling a chronological feed hoping to remember the right ones. The tags turn a pile into a database.
The compounding comes from this queryability over time. A swipe file of fifty well-tagged examples is more useful than five hundred untagged ones, because the fifty can answer a specific question in seconds and the five hundred can only be browsed. As the file grows, the patterns sharpen: you start to see which structures recur across many advertisers (strong signals that survive the auction) versus which appear once and vanish (tests that may have failed). That distinction — durable structure versus one-off test — is exactly the intelligence you want, and it only emerges from an organized, growing, well-tagged file. This is also where a creative-intelligence layer that handles the saving, tagging, and searching earns its keep: it turns the swipe file from a manual chore into infrastructure, which is the difference between a swipe file you maintain and one you abandon.
A practical tip on tagging discipline: decide your tag taxonomy once, up front, and apply it consistently, because an inconsistent taxonomy quietly destroys the file's value. If you tag some entries "curiosity gap" and others "curiosity-driven" and others "intrigue hook" for the same structure, your later searches miss matches and the patterns blur. Pick a fixed vocabulary for headline structures, thumbnail archetypes, landing-path types, and verticals, write it down, and use exactly those terms every time. It feels pedantic in the first week and pays off enormously in the third month, when a clean taxonomy lets you pull every example of a given structure-and-path combination in one query. The teams whose swipe files become genuine competitive assets are not the ones who save the most — they are the ones who tag the most consistently, because consistency is what makes a growing file searchable rather than just large.
The final discipline that makes a swipe file compound is periodic review, not just collection. Every month or quarter, read back through what you saved and ask which patterns have proven durable, which advertisers keep appearing (and are therefore worth watching closely), and which of your own tests the file informed and how they performed. That review loop closes the gap between research and results: it turns the swipe file from a one-way archive into a learning system, where your own validated outcomes get folded back in as the strongest signal of all. A pattern you observed and then tested and confirmed for your own offer is worth more than any number of unverified competitor sightings, and a swipe file that records both the observed pattern and your own test result becomes the most valuable native research asset you can own — a private record of what actually works for you, not just what others appear to be running.
Reading Native Creative Fatigue and Rotation
One of the more advanced things you can read from public native evidence is creative rotation — the pace at which an advertiser refreshes headlines and thumbnails — because rotation patterns hint at how they manage creative fatigue, which is a real constraint in native.
Native creative fatigues: a headline-thumbnail pair that performs well will, over time, see declining click-through as the audience grows numb to it, and disciplined advertisers rotate in fresh creative to counter that decay. By observing an advertiser over weeks, you can read their rotation behavior from public evidence alone — do they run the same few pairs for a long time, or do they constantly introduce new headline variations on the same structure? An advertiser who rotates frequently while keeping the underlying structure constant is telling you something useful: the structure works, and they are refreshing the surface to fight fatigue. An advertiser who changes structure entirely is either still testing or responding to a structure that stopped working. Reading rotation turns a series of snapshots into a film of how a competitor manages their creative over time.
The honest caveats apply as always. You are observing that creatives rotated, not the performance data that drove the rotation, so you are inferring fatigue management from behavior, not measuring it. And your observation is a sample — you may not catch every variant. Treat rotation reading as a source of strategic hypotheses ("they seem to refresh thumbnails roughly every couple of weeks while holding the headline structure") rather than precise measurement, and it becomes a genuinely useful lens on a competitor's sophistication. An advertiser with disciplined rotation is usually a more serious operator than one running the same stale pair for months, and knowing which kind of competitor you are studying shapes how much weight to give their patterns.
When You Don't Need a Paid Native Spy Tool
It is worth being honest that not everyone needs a paid Taboola ad spy tool, because for some teams a disciplined manual process covers the job at no cost. Naming when you do and do not need to pay is more useful than assuming a subscription is always the answer.
If you research native occasionally, work in a single vertical, and monitor a small set of competitors, you can get a long way with a manual process: browse publisher sites in your vertical, collect the recommendation units you see, follow the clicks, and maintain a well-tagged swipe file by hand. The honest limit of the free path is breadth and speed — you only see what you happen to browse, you cannot search across the whole network, and the collection is slow. For light, focused research, that is often an acceptable trade, and paying for a tool would be buying breadth you do not use.
You start to need a paid tool — or a creative-intelligence layer — when the manual process stops scaling: when you need to research many advertisers across the whole network rather than the slice you stumble onto, when you need to search and filter native creatives quickly rather than browse, when findings have to be saved, tagged, and turned into reports for a team, or when your research has to span native plus other channels in one place. At that point the manual process becomes the bottleneck, and a tool that aggregates native creative and supports a real research-and-reporting workflow pays for itself in time. The decision, as always, is about the job: light single-vertical research can stay manual; broad, team-based, cross-network research needs tooling. Match the spend to the actual scale of your research, not to a vague sense that you should be paying for something.
A useful signal that you have outgrown the manual process is when you find yourself doing the same tedious work repeatedly by hand — re-finding ads you know you saw, rebuilding context you already gathered, or stitching scattered screenshots into a report for the third time this month. That manual stitching tax is the symptom of having outgrown a free workflow, and it is the moment the time cost of doing it by hand exceeds the cost of a tool. Until you feel that tax, the free path is genuinely fine and paying would be premature; once you feel it weekly, paying is the obvious economy. Let the friction tell you when to upgrade rather than buying a tool on the assumption that serious research requires a subscription — plenty of effective single-vertical native research happens with nothing but a browser, a disciplined eye, and a well-tagged spreadsheet.
When to Use a Creative-Intelligence Layer
Once the missing piece is reusable, cross-network creative research — saving native examples, analyzing landing and video structure, tagging patterns, and turning them into reports — a gap opens that browsing publishers and screenshotting cannot close, and that a single-network tool cannot fully close either.
A creative-intelligence layer like AdMapix fits here. It is built for teams that need to search ad creatives across networks with Search, save the media in Media, break down video and landing structure with Video Analysis — the hook, the proof, the CTA that a static thumbnail cannot show — tag what they find, and turn it into a Report. The reason this is a genuinely separate layer rather than a feature a native tool should bolt on is that the job is different in kind: a native spy tool is organized around finding native creatives, while a creative-intelligence layer is organized around the creative as a reusable research artifact you can search, dissect, tag, and report across networks. For a team whose competitors run native on Taboola and video on social and creative on other surfaces, following an advertiser across all of them in one workbench is the difference between a partial and a complete read. Compare access on Pricing once the workflow repeats, or log in to run your first cross-network search.
It is honestly not the right tool if all you need is to browse Taboola's native recommendations occasionally in one vertical — a disciplined manual process covers that. A creative-intelligence layer earns its place specifically when observed native creatives have to become structured, searchable, shareable evidence with landing and video analysis, across more networks than Taboola alone, for a recurring team workflow. Name the gap first: occasional single-vertical native browsing stays manual, network-wide native aggregation points to a native spy tool, and cross-network reusable research-and-reporting points to a layer like AdMapix.
For the broader native and ad-spy landscape, our Outbrain ad spy tool guide covers the same research discipline for Taboola's closest native peer, the native ad spy tool guide covers the category across networks, and the best ad spy tools of 2026 compares the whole field by price, coverage, and use case. For the honest limits on inferring competitor spend, tracking competitor ad spend goes deeper on what is and is not knowable.
FAQ
What is a Taboola ad spy tool?
A Taboola ad spy tool is any tool or disciplined process for researching the native ads running across Taboola's publisher network — the headlines, thumbnails, offers, and landing paths that are publicly observable. It reveals creative evidence you can study and learn from, not private performance data. The best ones aggregate native creatives across many publishers so you can search and filter them, but all of them are bound by the same limit: they show what is running, not how well it is doing.
Can a Taboola ad spy tool show competitor spend?
No. Taboola does not publish advertiser spend, bids, click-through rates, conversion rates, ROAS, or targeting, and no public tool can infer them reliably. Any "spend" or "CTR" figure you see for a competitor's Taboola ads is a modeled estimate or a guess and should be treated as such, never as fact. What you can prove is the creative, the offer, the publisher context, and the landing path — the observable surface, which is genuinely useful on its own.
Why are the headline and thumbnail the most important things to study?
Because on Taboola the headline plus thumbnail is essentially the entire ad. The native unit blends into publisher content and cannot rely on motion, sound, or a brand frame to interrupt, so it has to earn the click through curiosity, specificity, or a benefit promise compressed into one line and one image. That pair carries almost all the persuasion at the click stage, which makes it the single highest-value thing to research — read as a unit, and tagged by the kind of promise it makes.
How do I know if a native ad is actually working?
You do not, from public evidence alone — and that is the most important thing to internalize. Frequency and apparent longevity are weak proxies: an ad can run widely and lose money, and a quiet one can quietly win. The strongest public signal is a structure repeating across many independent advertisers, which suggests it survives the auction. But even that is a hypothesis. The only way to know if a pattern works is to test a version of it against your own click and conversion data.
Why does the landing page matter so much in native research?
Because on Taboola the click usually lands on an advertorial, quiz, or video sales page that does the real converting — the ad just buys the click. Studying the headline without following the click is reading the cover and skipping the story. Mapping the landing-path structure (the advertorial's arc, the quiz's questions, the VSL's hook-proof-close) reveals the advertiser's conversion playbook, which is harder to copy and far more transferable to your own offers than any single headline.
What is the retargeting trail, and how do I use it?
The retargeting trail is the sequence of ads a competitor serves you after you click their native ad and engage with their funnel. By genuinely engaging with a competitor's landing page and then watching for their retargeting over the following days, you can observe how they bring warm traffic back — discount-led, testimonial-led, urgency-led, and in what order. It reveals nurture strategy you cannot see from the original ad. The caveat: you observe the creative sequence, not the targeting rules or spend, so treat it as a hypothesis and trigger it more than once.
What should I save from each Taboola ad example?
Save the headline, the thumbnail, the offer angle, the landing-path structure, the publisher context, the advertiser, the date, and a one-line note on why it matters. That provenance is what turns a screenshot into a usable data point — it lets you sort, compare, and build a brief from your collection later. A headline saved with no context is a sentence you will not remember the point of; the same headline saved with its offer and landing path is intelligence you can act on.
How is researching Taboola different from spying on Meta or Google ads?
On Meta, the creative is the pitch and you can often judge an ad from the creative alone. On Google, the user has search intent. Taboola native is neither: the user is mid-article, with no query intent and no permission to interrupt, so the ad manufactures interest from a standing start through the headline and thumbnail, and defers the real persuasion to the landing page. That makes the post-click path central to native research in a way it is not for social, and makes the headline-and-thumbnail pair the key creative unit.
Is there a public Taboola ad library I can search?
Not in the way the Meta Ad Library works for social and political ads. Native networks were not built under the same transparency mandates, so there is no single comprehensive, free, queryable archive of every Taboola ad with run dates and placement detail. Taboola surfaces some public trend and content-discovery information, but comprehensive research is assembled — from creative seen in the wild, from third-party native-research tools that index native ads across publishers, and from your own organized collection — rather than looked up in one official source.
Can I research Taboola ads for free?
Yes, for light, focused research. If you work in one vertical and watch a small competitor set, you can browse publisher sites, collect the recommendation units you see, follow the clicks, and maintain a tagged swipe file by hand at no cost. The limits are breadth and speed — you only see what you browse and cannot search the whole network. You start to need a paid native tool or a creative-intelligence layer when you need network-wide search, fast filtering, team reporting, or cross-network research that the manual process cannot scale to.
Key Takeaways
- A Taboola ad spy tool reveals public creative evidence — headlines, thumbnails, offers, publisher context, and landing paths — and proves what is running, never what is winning. Treat every private-metric figure as an estimate or a guess.
- The headline-and-thumbnail pair is the whole ad on Taboola, and the landing path is half the research. Read the pair as a unit, always follow the click, and tag the kind of promise and the conversion structure, not just the surface.
- The win is the repeating pattern, not the single ad. A structure recurring across many independent advertisers is a strong signal it survives the auction; convert it into a testable brief, not a copied sentence.
- Build an organized, well-tagged swipe file filed by what each example teaches, and read rotation and retargeting over time for deeper strategy — a compounding research asset beats a chronological screenshot dump.
- Match the tool to the job. Light single-vertical research can stay manual; network-wide aggregation needs a native spy tool; cross-network reusable research-and-reporting points to a creative-intelligence layer like AdMapix — which complements, never replaces, your own validation against real conversion data.
Sources
- Taboola — native advertising and content-recommendation platform across a large network of open-web publishers (as checked June 2026).
- Taboola for advertisers — native ad formats, targeting, and campaign tools from the platform's own perspective; advertiser-facing, not a public competitor library.
- Taboola Trends / Newsroom — public-facing content-trend and discovery information; a directional content signal, not a comprehensive queryable ad archive.
- Meta Ad Library — referenced as the contrast case for what a regulatory-driven public ad library looks like, which native networks do not provide (as checked June 2026).
Platform features, formats, and public surfaces change often, so confirm current details on Taboola's official pages before relying on them. All links checked as of June 21, 2026. Disclosure: AdMapix is our own product, and its data scope covers cross-network ad creative search, saved media, video and landing analysis, tagging, and reports built on public evidence — separated from claims about Taboola's own platform.
See what competitors are really running
Search 6M+ ad creatives, landing pages, and weekly spend across 200+ countries. No credit card, no commitment.
Related Articles
Ad Hook Examples in 2026: 7 First-3-Second Patterns (with UGC Breakdowns)
A complete 2026 library of ad hook examples organized into seven repeatable patterns — problem, proof, objection, comparison, curiosity, offer, and transformation — with UGC hook breakdowns, platform-by-platform differences for TikTok, Meta, and YouTube, an industry-by-industry hook map, a hook-testing workflow that ships variants, the metrics that actually grade a hook, and a worked teardown that turns a competitor opener into a running test.
Meta Ads API Alternative in 2026: Ad Library API, Marketing API, or a Creative Layer?
A 2026 guide to choosing a Meta ads API alternative — what the Ad Library API, Marketing API, and Graph Ads Archive each actually expose and where they stop, how a creative-intelligence layer fills the saved-media, video-breakdown, and reporting gap, exactly what public Meta data can and cannot prove (creative yes; spend, targeting, and ROAS no), and a decision framework matched to the job you are doing.
Outbrain Ad Spy Tool in 2026: Native Ad Research for the Open Web
How to research Outbrain native ads from public evidence in 2026 — what a spy tool can and cannot prove, how to decode headline-and-thumbnail hooks, advertorial landing paths, retargeting trails, and how to turn patterns into testable native campaigns.