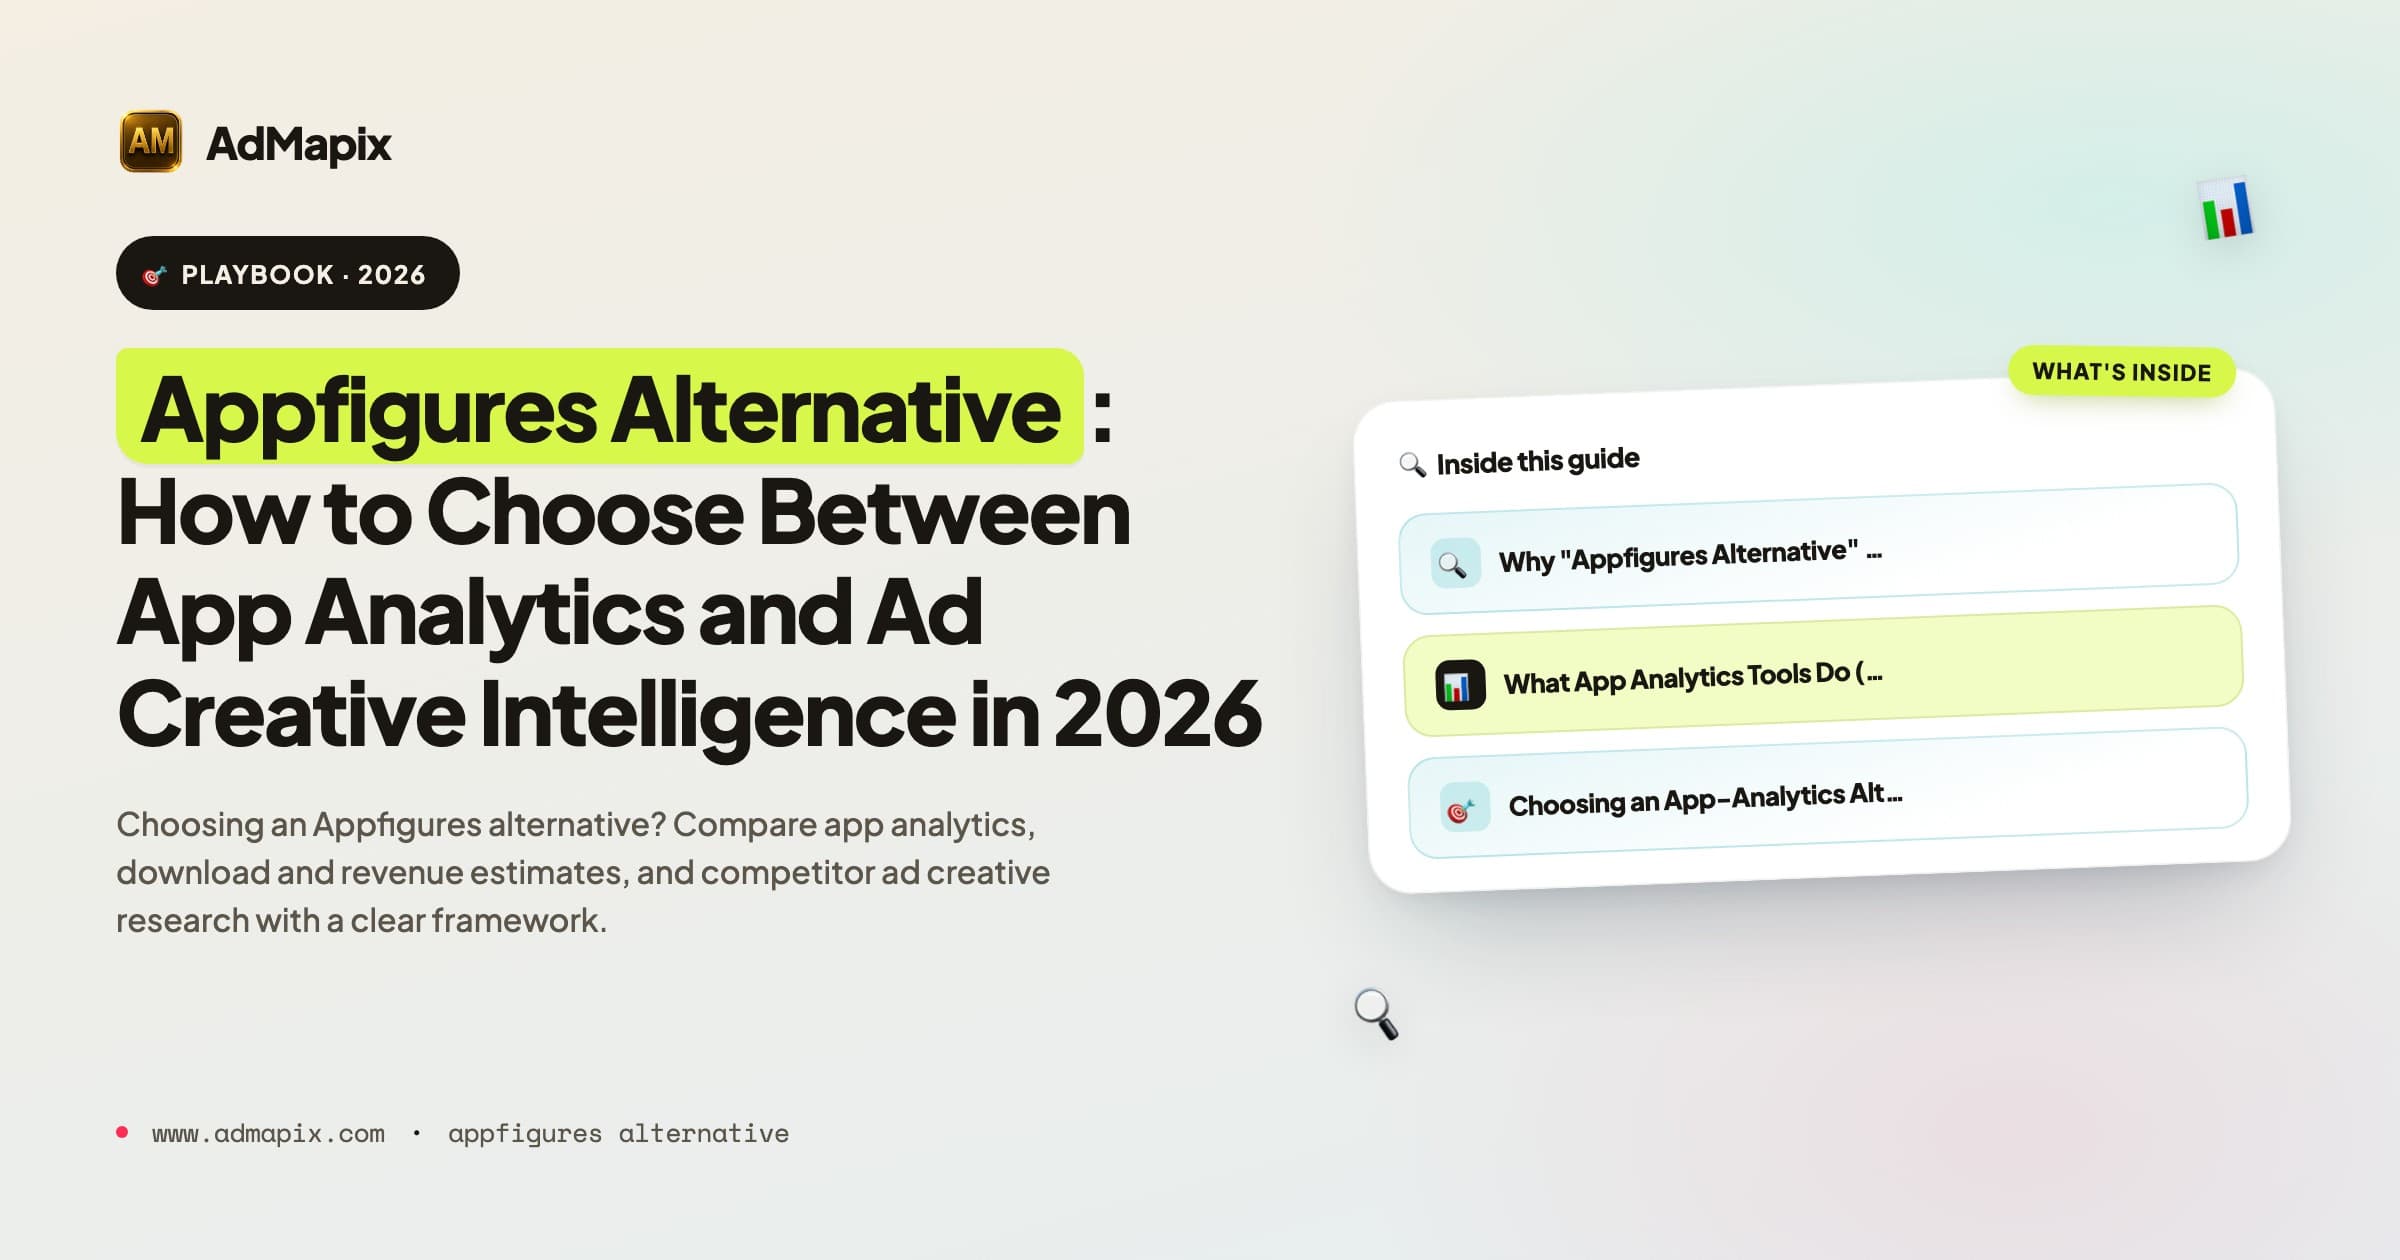
Appfigures Alternative: How to Choose Between App Analytics and Ad Creative Intelligence in 2026
A decision-first guide to picking an Appfigures alternative. Separate owned-app analytics, download and revenue estimates, and ASO reporting from competitor ad creative and video intelligence, with comparison tables and a buying framework.
Appfigures Alternative: How to Choose Between App Analytics and Ad Creative Intelligence in 2026
Updated June 21, 2026.
Most people searching for an Appfigures alternative are solving one of two completely different problems, and treating them as a single category is exactly why so many "best alternative" lists feel useless. Appfigures is built around app analytics, app intelligence, ASO, and store data — downloads and revenue estimates, keyword rankings, review monitoring, and dashboards for the apps you own or track. If that is your job, the real alternatives are other app-analytics platforms, and you should compare them on coverage, estimate transparency, and reporting. But if what you actually need is to see what creatives competitors are running in paid social, AdMapix is in a different category entirely and will not replace Appfigures at all. This guide is for app founders, product and ASO teams, app analysts, agencies, and UA creative teams who need to choose the right layer instead of buying the longest feature list.
TL;DR
- Appfigures is an app-analytics and app-intelligence platform. A true like-for-like alternative is another analytics tool — store data, download and revenue estimates, ASO keyword tracking, review monitoring, and reporting — not a creative ad database.
- "Appfigures alternative" is really two searches. One bucket is owned-and-tracked-app analytics (dashboards, estimates, ASO, reporting). The other is competitor ad creative research. They use different data and serve different teams.
- Pick an analytics alternative when your bottleneck is store performance, keyword rankings, reviews, or reporting on apps you track. Compare on coverage, estimate transparency, ASO depth, export, and pricing.
- Pick ad creative intelligence (such as AdMapix) when your bottleneck is seeing competitor ads, analyzing paid-social video, and producing creative angles before you brief production.
- Estimates are estimates. Download and revenue numbers from any third-party analytics tool are modeled, not metered. Treat them as directional, and never present a competitor's estimated revenue as a fact.
- AdMapix is a complement, not a swap. It covers cross-network ad creative search, video analysis, and recurring creative reports that app-analytics tools do not — and it cannot see a competitor's true downloads, revenue, or ad performance.
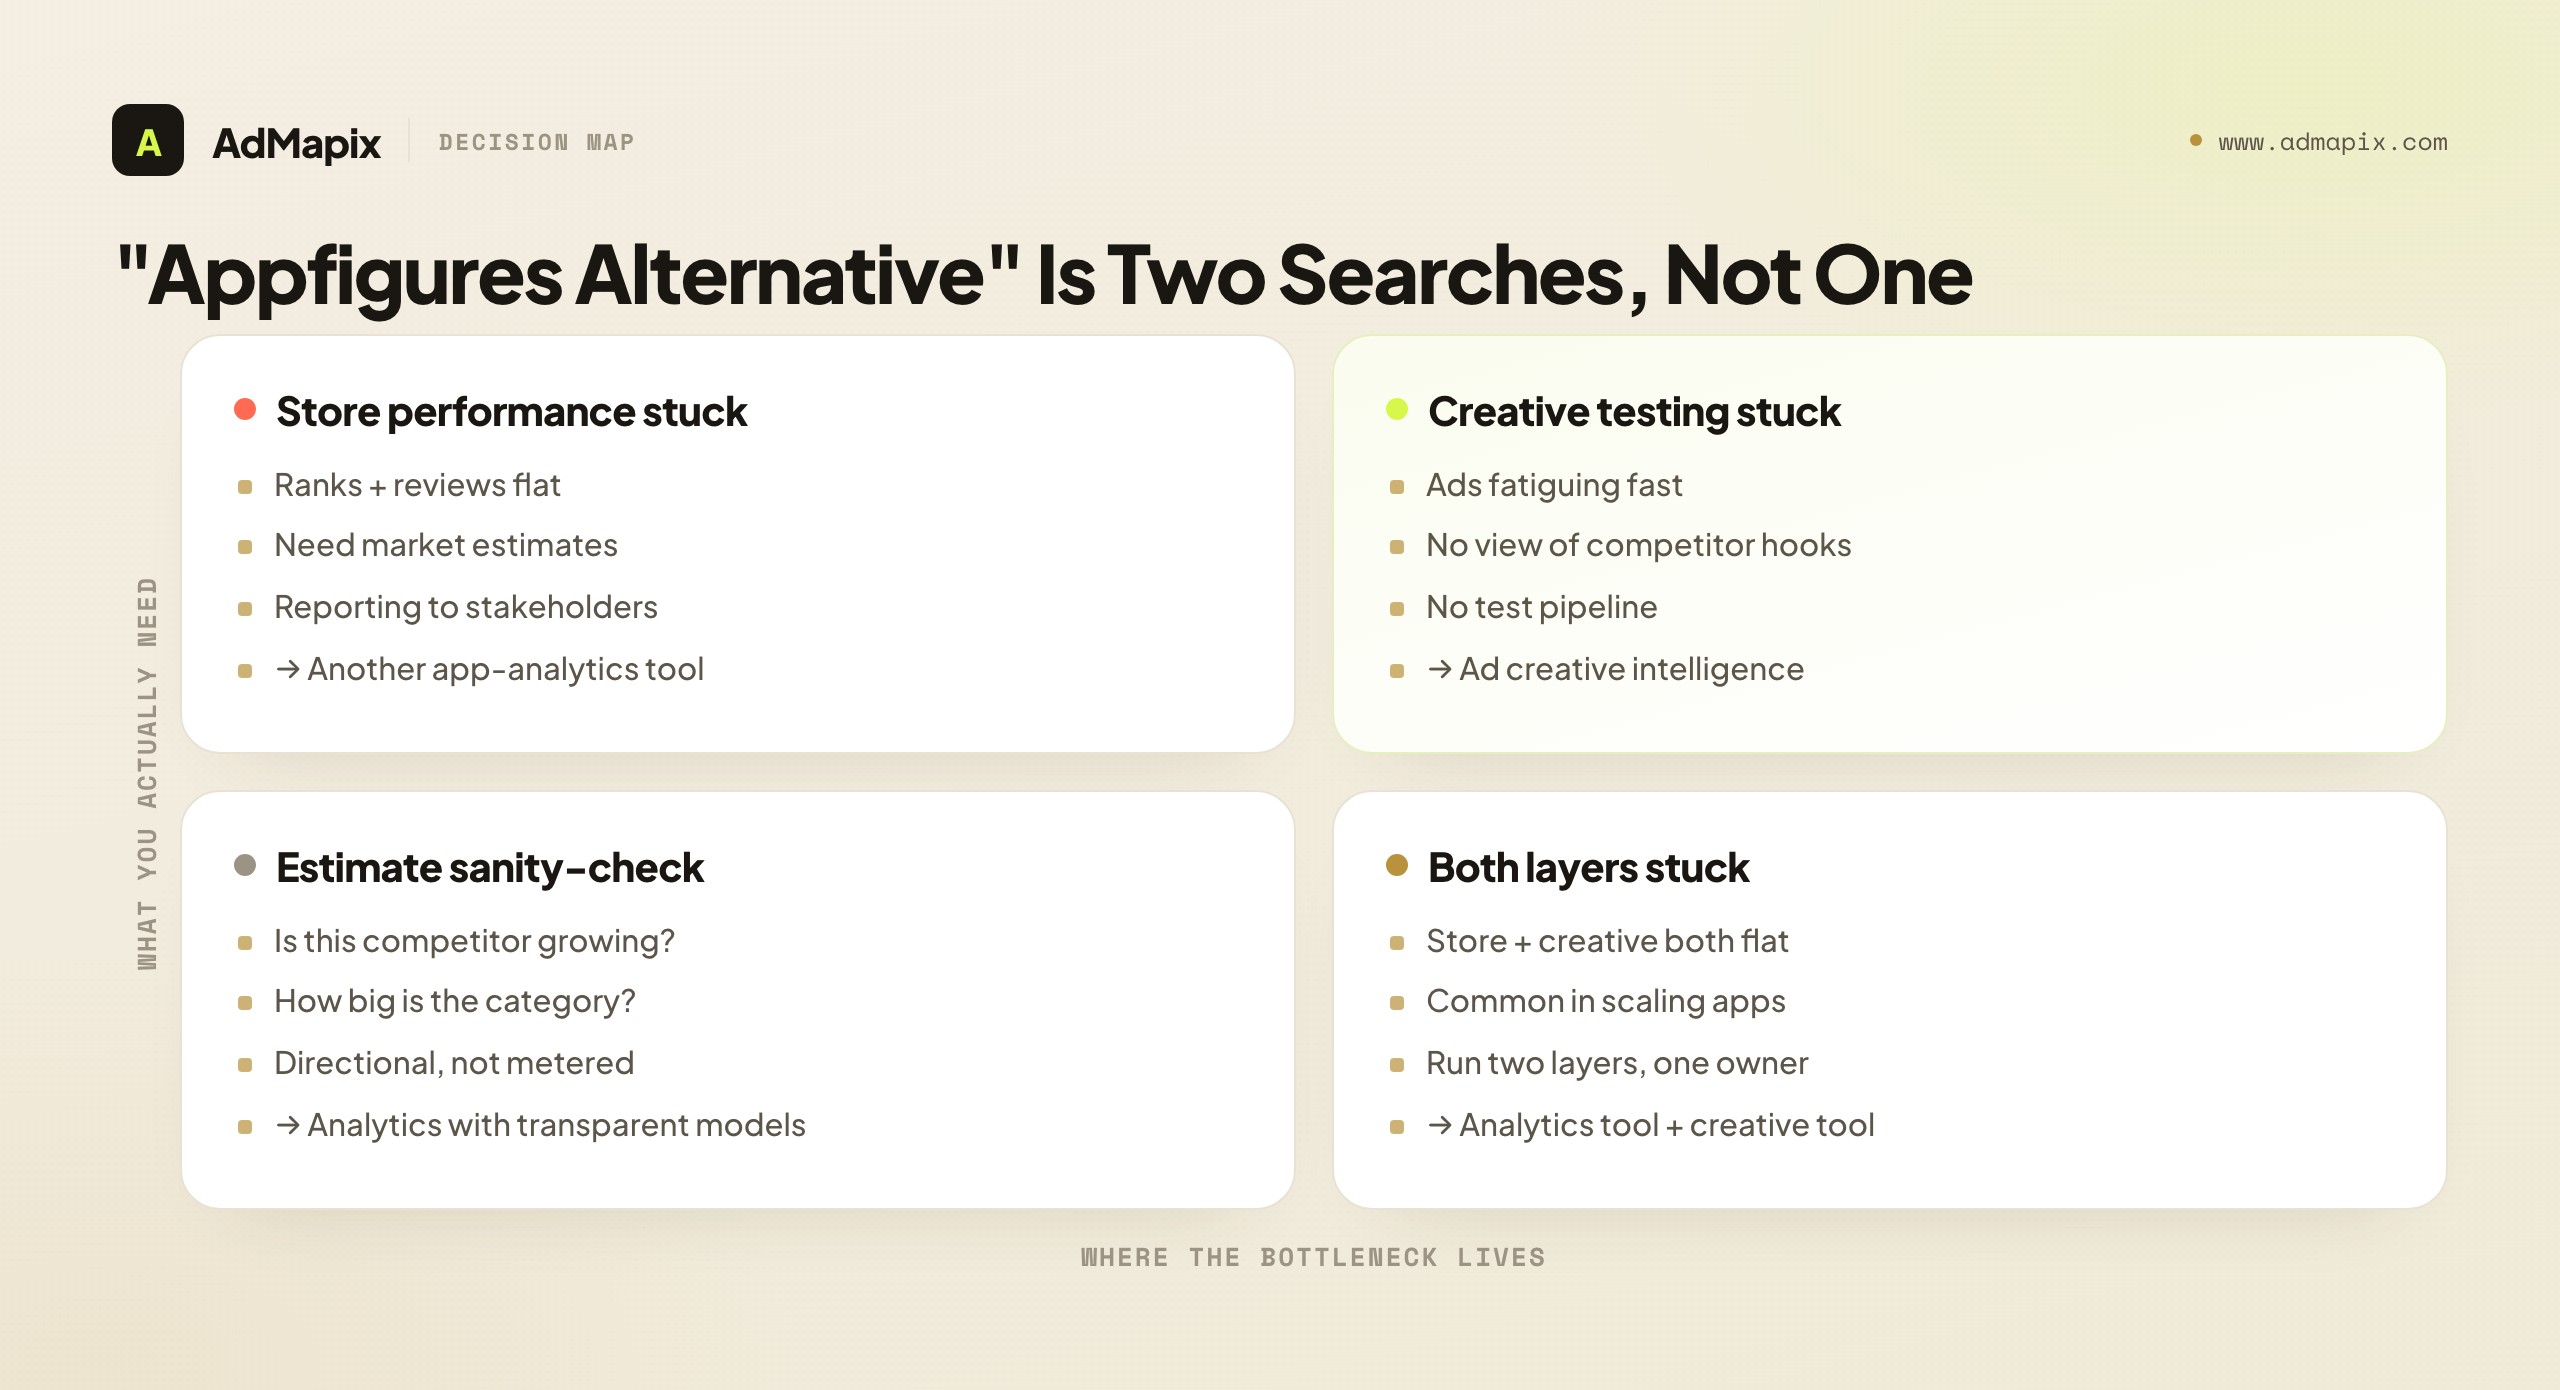
Why "Appfigures Alternative" Is Really Two Searches
The phrase hides two jobs that need different tools, so name your job before you compare anything. Appfigures sits squarely in the app-analytics and app-intelligence space: store data, download and revenue estimates, ASO keyword tracking, review monitoring, and dashboards and reports built around apps. The word "alternative" only becomes meaningful once you decide whether you want a different version of that — a tool that estimates downloads, tracks ranks, and reports store performance — or whether your real gap is competitor advertising creative, which is a separate discipline with separate tooling.
Here is the fastest way to sort yourself. Read each question and notice which bucket your real, current questions fall into.
| If your question is... | The job is | Look at |
|---|---|---|
| "How is my app ranking, and how do competitors trend in the store?" | Owned / tracked app analytics | App-analytics and ASO platforms |
| "Roughly how many downloads and how much revenue does this app pull?" | Market estimates | App-analytics with estimate models |
| "What are competitors running as ads, and which creatives repeat?" | Ad creative research | Ad creative intelligence (AdMapix and ad-library tools) |
| "Why is this competitor's paid-social video working?" | Creative teardown | Video-focused creative intelligence (AdMapix) |
| "How do I report store performance to a client this month?" | Analytics reporting | App-analytics platforms |
If most of your rows land in the top group, you want a true Appfigures-style analytics alternative, and the rest of this guide will steer you toward comparing those well. If your rows land in the bottom group, no analytics tool will answer them no matter how good its dashboards are — you need creative evidence, and that is a different purchase.
The reason this split is easy to miss is that both kinds of tool talk about "apps," "competitors," and "data," so the surface vocabulary overlaps even though the underlying jobs do not. An app-analytics platform answers questions about performance and market position — how an app is doing, roughly how it compares, how it trends. A creative-intelligence tool answers questions about advertising — what ads run, what hooks repeat, what to test next. One is a market-and-store lens; the other is an ad-auction lens. The honest move is to refuse to shortlist anything until you have decided which lens your stuck question needs.
There is a structural reason these two get bundled, and seeing it helps you stop falling for the conflation. App marketing as a field grew up filing everything that touches the App Store under one heading — "app intelligence" or "app growth tools" — so analytics platforms, ASO suites, creative libraries, and attribution tools all ended up in the same mental bucket and the same comparison articles. Vendors then expanded sideways into each other's territory: the analytics tool added a few ad-related features, the ASO tool added some market estimates, the creative tool started indexing app ads. The marketing boundaries blurred even though the underlying data depth did not. The result is that two people with genuinely different problems both type "Appfigures alternative," read the same listicle, and walk away more confused, because the listicle author also failed to separate the jobs. The fix is not a better listicle — it is a better question, asked before you read anyone's ranking.
The cost of getting this wrong is more than a wasted subscription. Hand an analyst who needs creative evidence a better analytics tool and they will conclude, correctly, that it does not solve their problem — and may then distrust the entire idea of competitive tooling, when the real failure was buying the wrong layer. Hand a UA creative lead an analytics dashboard to "find better hooks" and they hit the same wall from the other side. Both walk away thinking "these tools don't work," when in fact each tool works fine for the job it was built for. The diagnosis is what protects you from poisoning the well for a whole category of useful work, and it costs nothing but a few minutes of honesty about which question is actually blocking you.
What App Analytics Tools Do (and What They Don't)
Before you compare alternatives, it is worth being precise about the analytics layer, because its strengths and its hard limits both shape the decision. App-analytics platforms like Appfigures pull together store-level data and modeled estimates to give you a view of performance — your own apps' real numbers (via connected store accounts) and competitor apps' estimated numbers (via models). They track keyword rankings, monitor reviews and ratings, watch category positions, and package it all into dashboards and reports.
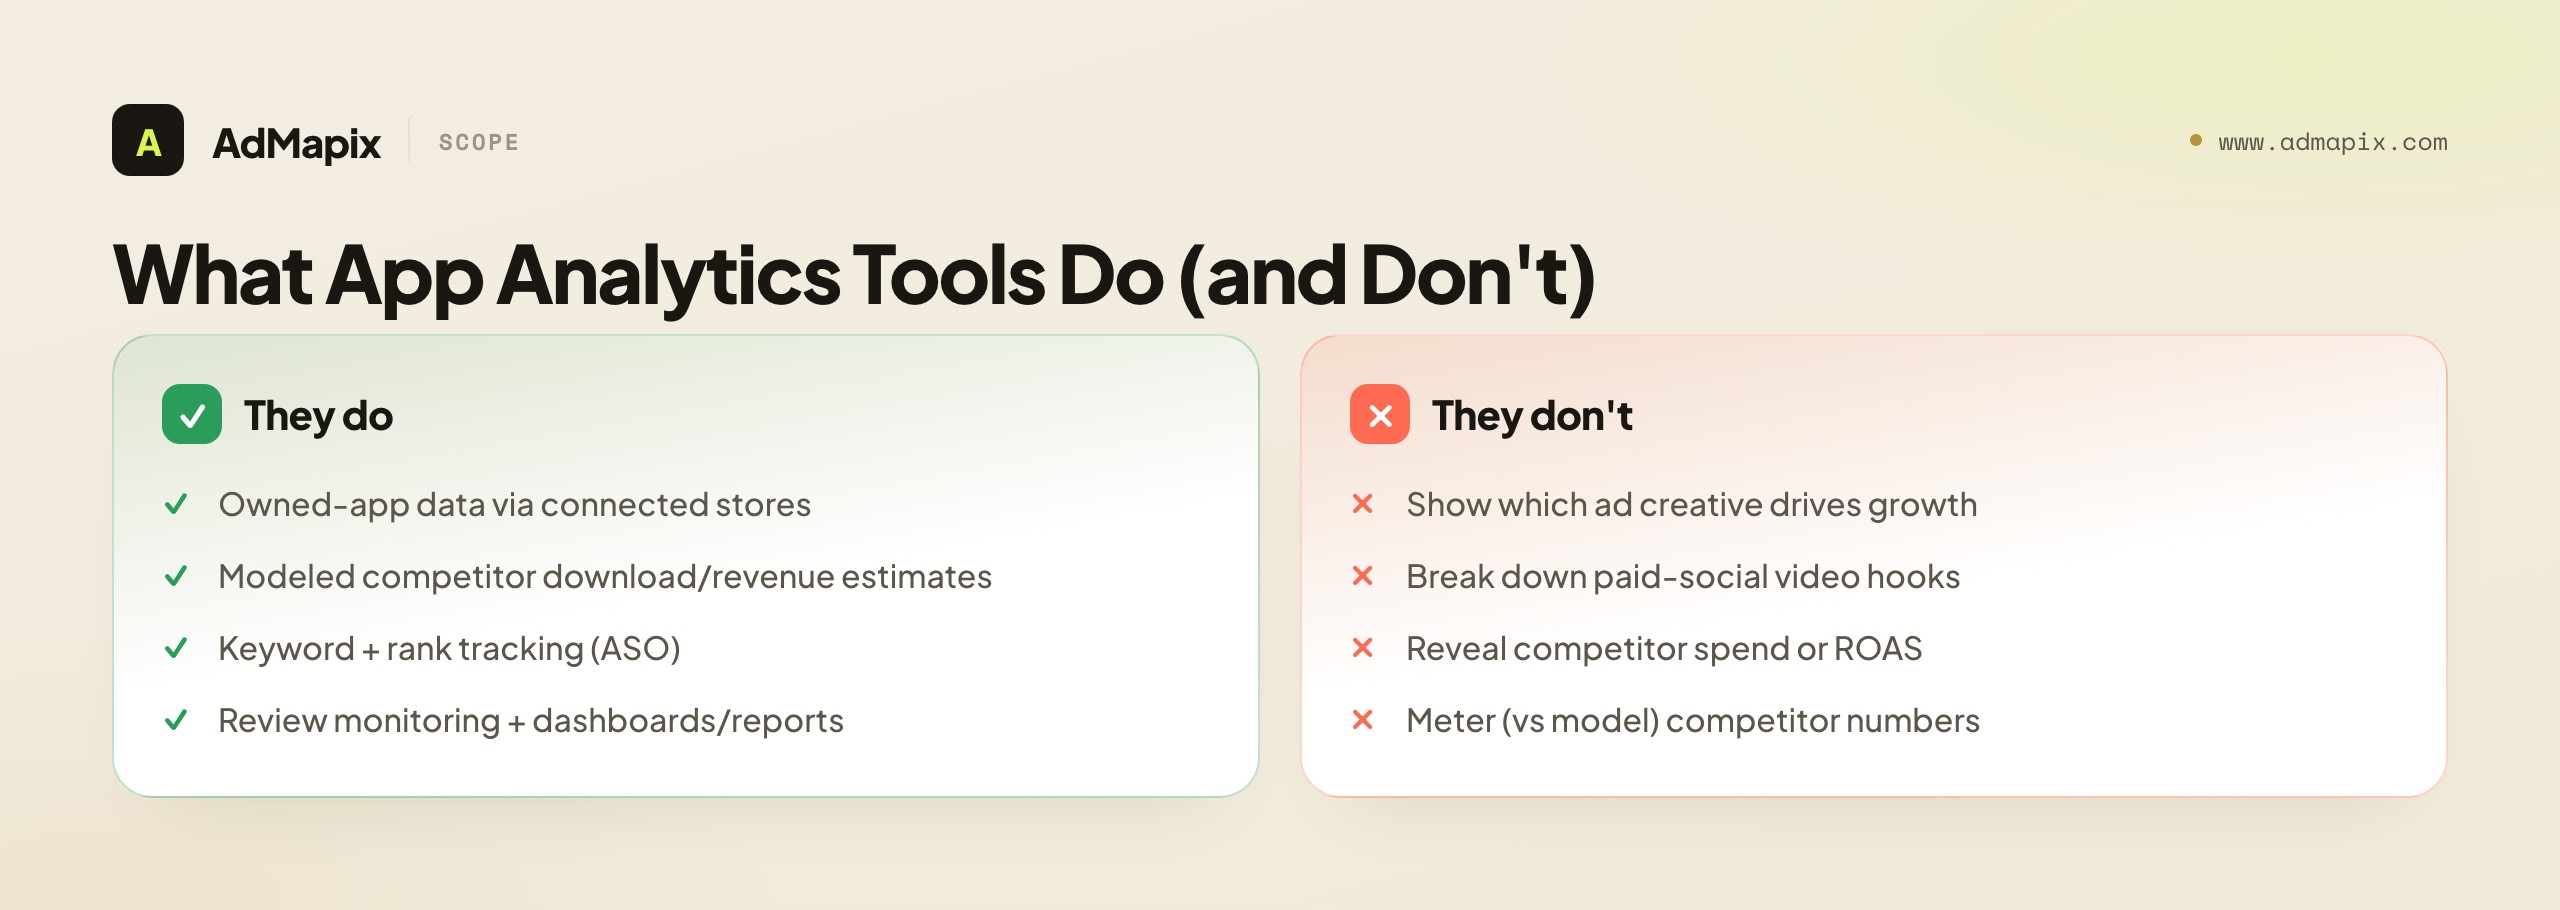
What they do well is give an app team a single, ongoing read on store performance and market position. If you own apps, the connected-account data is real and useful — installs, revenue, conversion, and retention as the stores report them. If you track competitors, the market estimates give you a directional sense of who is growing, who is stalling, and roughly how big the category is. For ASO, the keyword and rank tracking tells you where you stand and where to push. For reporting, the dashboards turn all of that into something a stakeholder or client can read.
It helps to separate the two kinds of data an analytics tool serves, because they have very different reliability and you should treat them differently. The first is first-party data for apps you own and have connected — real installs, real revenue, real funnel metrics straight from the stores. This is metered, not modeled, and it is the most trustworthy data the tool will ever give you; lean on it hard. The second is third-party estimates for apps you do not own — modeled downloads, modeled revenue, inferred trends. This is genuinely useful for direction but is never as solid as your own first-party numbers. A common mistake is to mentally flatten these two into one "the tool says" bucket and treat a competitor's modeled revenue with the same confidence as your own metered revenue. They are not the same kind of number, and the best analytics teams keep that distinction explicit in their heads and their decks — first-party is fact, third-party is estimate, and the line between them is bright.
What they do not do is show you the advertising. An app-analytics tool can tell you that a competitor's downloads appear to be climbing; it cannot tell you which paid-social creative is driving that climb, what hook the creative opens with, or how many variants they are testing. That is a categorically different kind of evidence — it lives in ad libraries and creative-intelligence tools, not in store-data models. So if your question is "why is this competitor winning, and what are they doing in their ads," an analytics tool will show you the what of their store trajectory but never the how of their creative strategy.
The other limit to internalize early is the nature of estimates. Any download or revenue number for an app you do not own is modeled, not metered. The analytics vendor infers it from sampled signals and a model, and the accuracy varies a lot by store, category, country, and how popular the app is. Mid-tier and long-tail apps are estimated less reliably than chart-toppers. This does not make estimates useless — directional market sizing and trend-spotting are genuinely valuable — but it does mean you should never present a competitor's estimated revenue as a fact, and you should weight estimate transparency (does the vendor disclose method and sample?) heavily when you compare alternatives.
It is worth understanding why the estimates work as well as they do, and where they break, because that tells you how to use them responsibly. The stores publish public signals — chart positions, rankings, sometimes review velocity — and analytics vendors combine those with whatever sampled first-party data they can gather (from apps that connect their accounts, from SDKs, from panels) to fit a model that maps public signals to private outcomes. For an app near the top of a chart in a major market, that mapping is well-calibrated, because there is a lot of nearby data to anchor it. For a niche app in a smaller market, the model is extrapolating into a thin region of its training data, and the error bars widen accordingly. That is why two analytics tools can give you meaningfully different numbers for the same competitor: they are different models trained on different samples, and where the signal is thin, the model's assumptions dominate. None of this is a scandal — it is just how modeling works — but it is exactly why "which tool is right" is the wrong question and "which tool is transparent about its method" is the right one.
The practical upshot is a usage rule you can adopt today. Use estimates for direction and comparison, never for absolute precision. "Competitor A appears to be growing faster than Competitor B" is a defensible read. "The category looks like it is expanding" is defensible. "This app makes exactly $X" is not, and dressing a modeled figure in a precise dollar amount gives it a false authority that will eventually burn whoever quoted it. The teams that get the most from analytics tools are the ones who treat the numbers as a compass, not a ruler — good for telling you which way to walk, not for measuring the exact distance.
Choosing an App-Analytics Alternative
If you stay in the analytics lane, compare on the data you actually act on, not on the size of the catalog. App-analytics tools differ most in store coverage, estimate accuracy and transparency, ASO depth, review tooling, export options, and pricing clarity. Use a fixed checklist so two vendors are judged on the same evidence rather than on whichever one had a slicker demo.
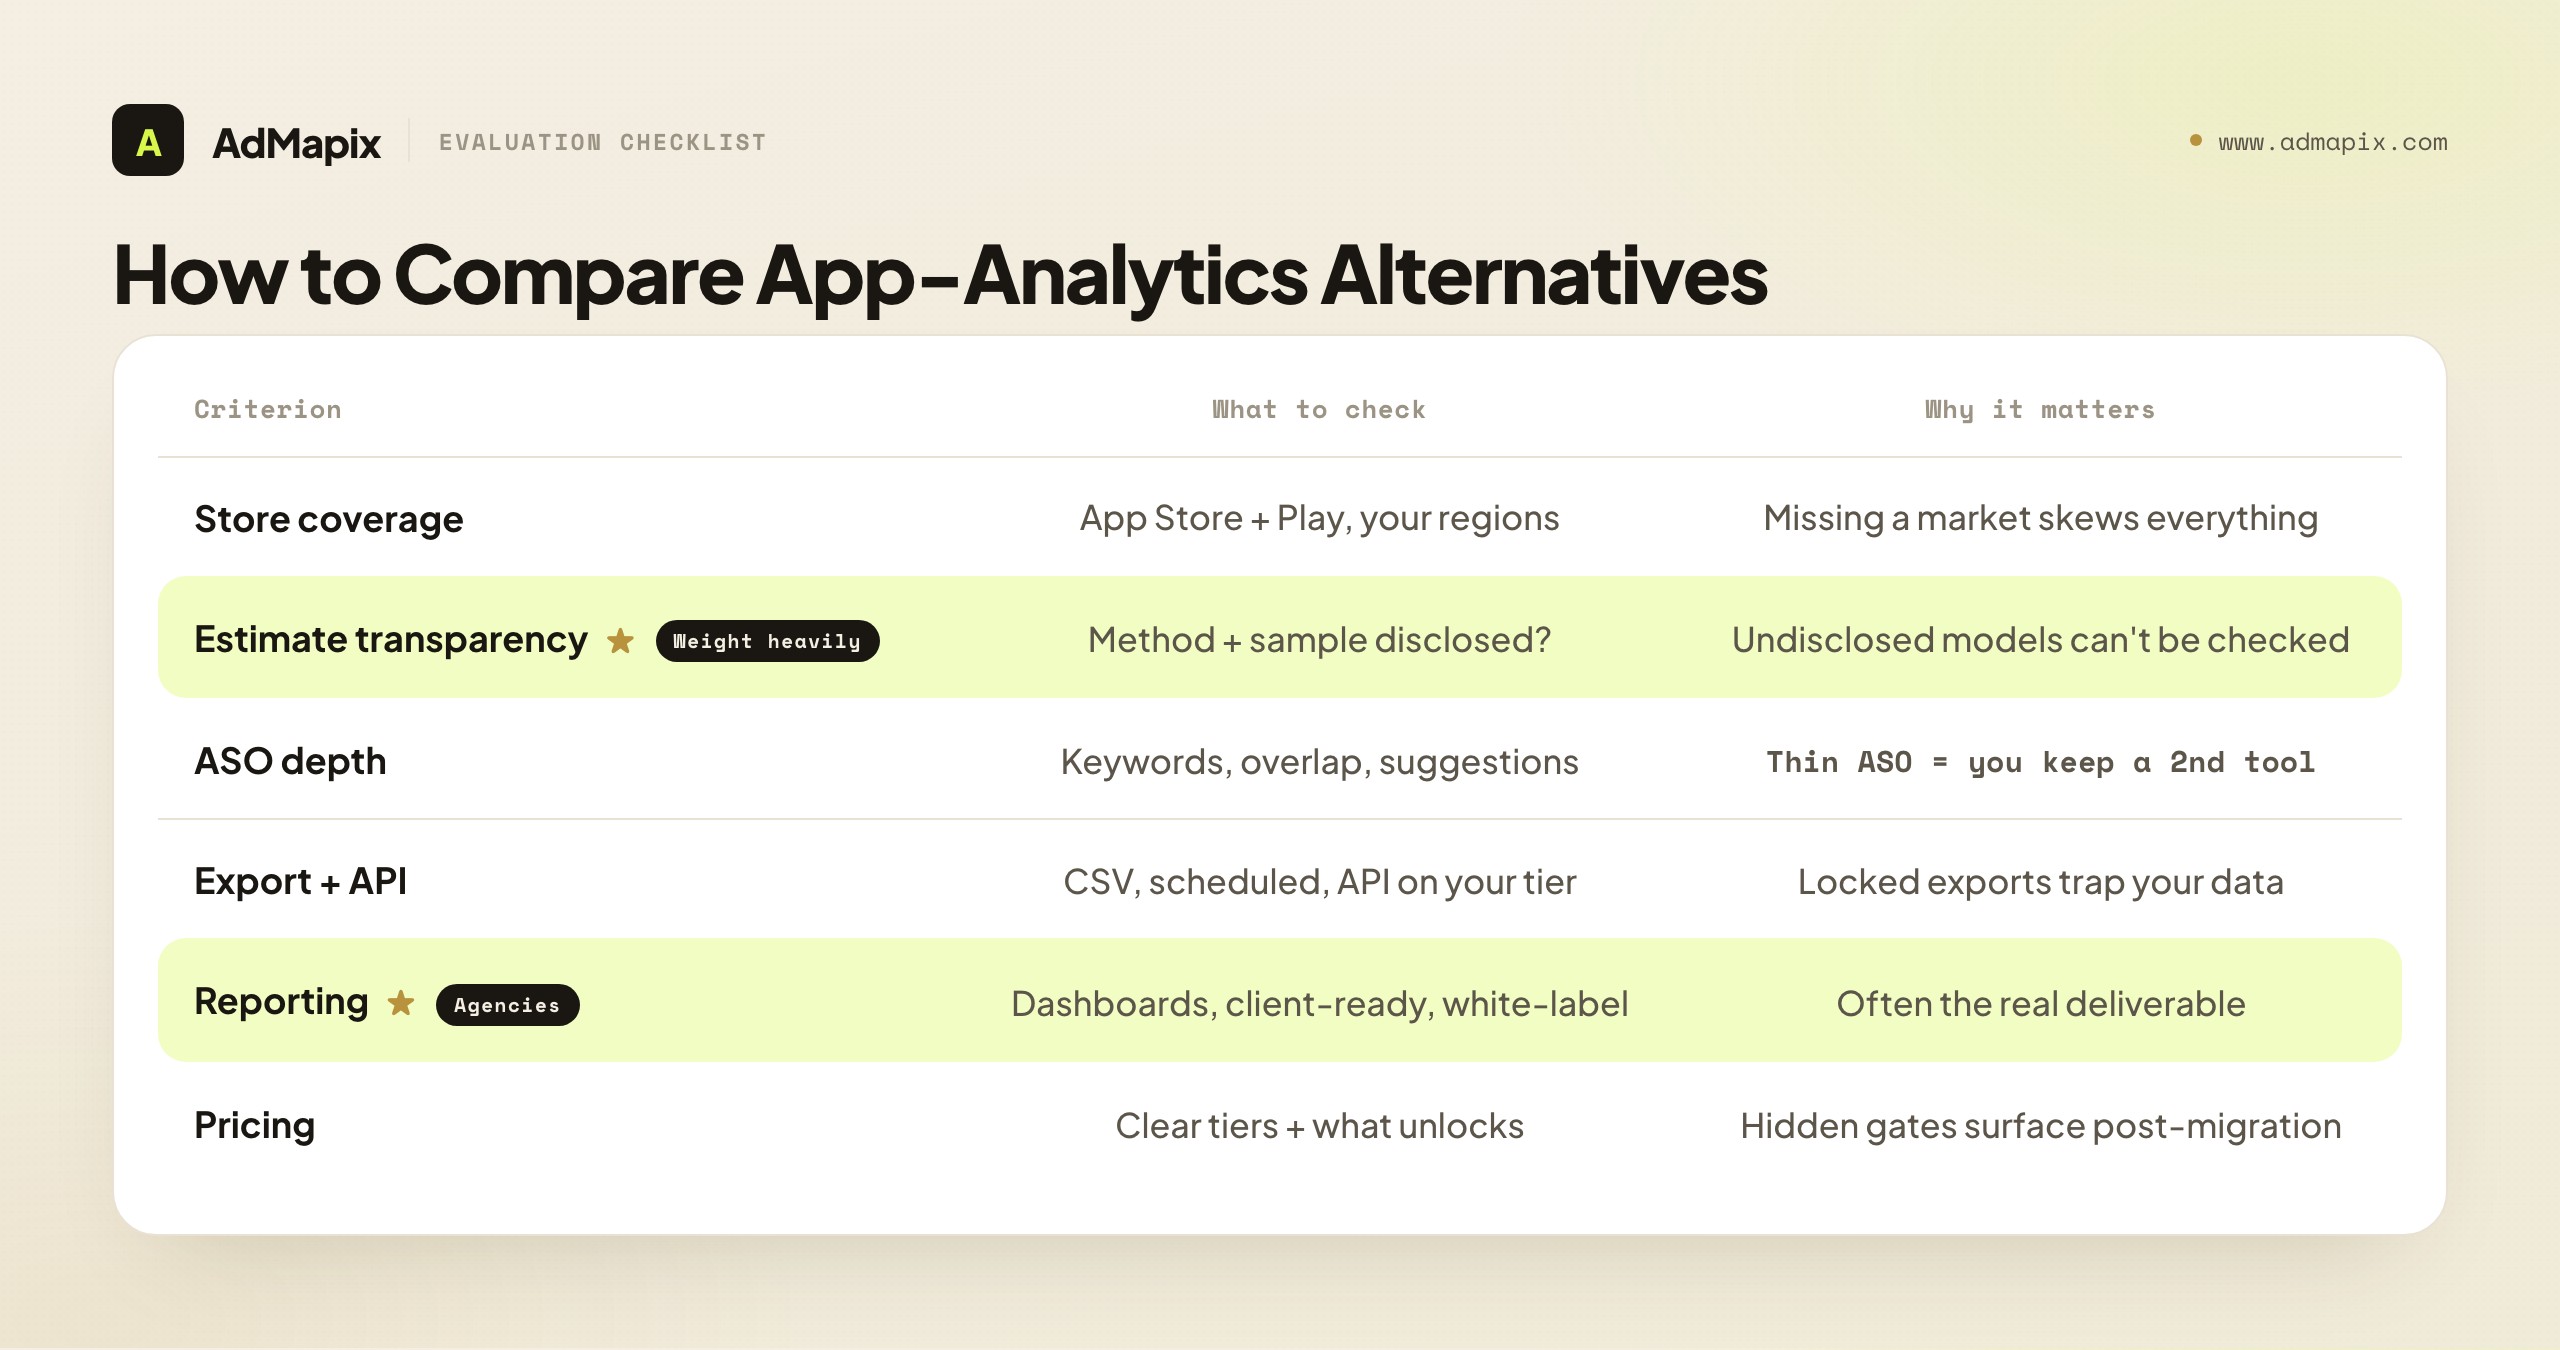
| Criterion | What to check | Why it matters |
|---|---|---|
| Store coverage | App Store + Google Play, the regions you sell in | Missing a market makes estimates and rankings misleading |
| Estimate transparency | Whether method and sample are disclosed | Undisclosed models are impossible to sanity-check |
| ASO depth | Keyword tracking, suggestions, competitor keyword overlap | Thin ASO data means you keep a second tool anyway |
| Review tooling | Review monitoring, sentiment, alerting | Reviews drive conversion and roadmap signals |
| Owned-app data | Quality of connected-account analytics | Real first-party data should be deeper than estimates |
| Export and API | CSV, scheduled exports, API access on your tier | Locked exports trap your data inside the tool |
| Reporting | Dashboards, client-ready reports, white-label | This is often the real deliverable for agencies |
| Pricing transparency | Clear tiers, what each unlocks, seat costs | Hidden gates surface after you have migrated |
The way to use this is not to score every box equally — it is to weight the rows that map to your actual job. An agency whose deliverable is a monthly store-performance report should weight reporting, export, and white-label heavily. An ASO-focused team should weight ASO depth and keyword overlap. A founder doing competitive market sizing should weight estimate transparency above almost everything, because an estimate you cannot sanity-check is a number you cannot responsibly act on.
The evaluation method matters as much as the checklist. The temptation is to run the longest-feature-list tool through a quick demo, be impressed, and buy. The better method is to define the deliverable you actually produce — a monthly client report, a weekly ASO standup input, a quarterly market-sizing memo — and then time how long each candidate takes to produce that exact deliverable, end to end, on your real data. A tool with fifty features that takes three hours to assemble your monthly report loses to one with twenty features that gets you there in forty minutes, because the report is the job and everything else is noise. Score time-to-deliverable, not feature count, and you will consistently pick the tool that actually fits the way your team works rather than the one that demos best.
One more thing teams underestimate when switching analytics tools: the migration cost of state. Your current tool holds tracked apps, saved keyword sets, competitor lists, historical reports, and tags you built up over months. None of that comes with you automatically. Before you switch, inventory the state you genuinely rely on and budget the time to recreate it in the new tool, or the first month will feel slow and you will wrongly blame the new platform for a cost you carried over from the old one. The smoothest migrations are the ones where someone explicitly listed "rebuild these 30 tracked apps and these 5 saved reports" as a task, rather than discovering the gap piecemeal while trying to ship the first real deliverable.
And as with any tool switch, verify current coverage and pricing before you migrate. Store coverage, the markets included on a given tier, export limits, and prices all change, and the plan that fit last quarter may not today. Confirm the live plan includes the stores, regions, and export paths you need on the seat count you will actually buy.
A few evaluation traps deserve a specific warning, because they pass a quick trial and then bite in month two. The demo-data trap: vendor demos are tuned to look great on a hand-picked, popular category in a major market, which is precisely where estimates are most accurate. Run your trial on your category and your primary country, even if it is smaller and messier, because that is where the model's accuracy actually matters to you. The single-report trap: you generate one beautiful report, it looks complete, you buy — but the value is in the recurring monthly report, so test the full cycle at least twice and confirm it stays fast and the data stays current. The export trap: the data looks complete inside the tool until you try to get it into a deck or sheet for a client and discover the export is gated to a higher tier or drops the fields you needed. Test the round trip — track, report, export, share — not just the dashboard view. And the champion trap: one enthusiastic person drives the trial, learns the tool's quirks, and the team buys it, only for adoption to collapse because nobody else can extract value. Have at least two intended users run the same job during the trial; the strongest predictor of post-purchase adoption is a second, less-invested teammate independently reaching a useful answer quickly.
When the Real Gap Is Competitor Ad Creative
Here is the situation a lot of people are actually in when they search "Appfigures alternative," even if they do not phrase it this way. Their analytics are fine. They can see, roughly, that a competitor is growing. What they cannot see — and what is genuinely blocking them — is what the competitor is doing in their ads to drive that growth. They are losing on creative, and no amount of better store estimates will fix it, because the answer does not live in the store data at all.
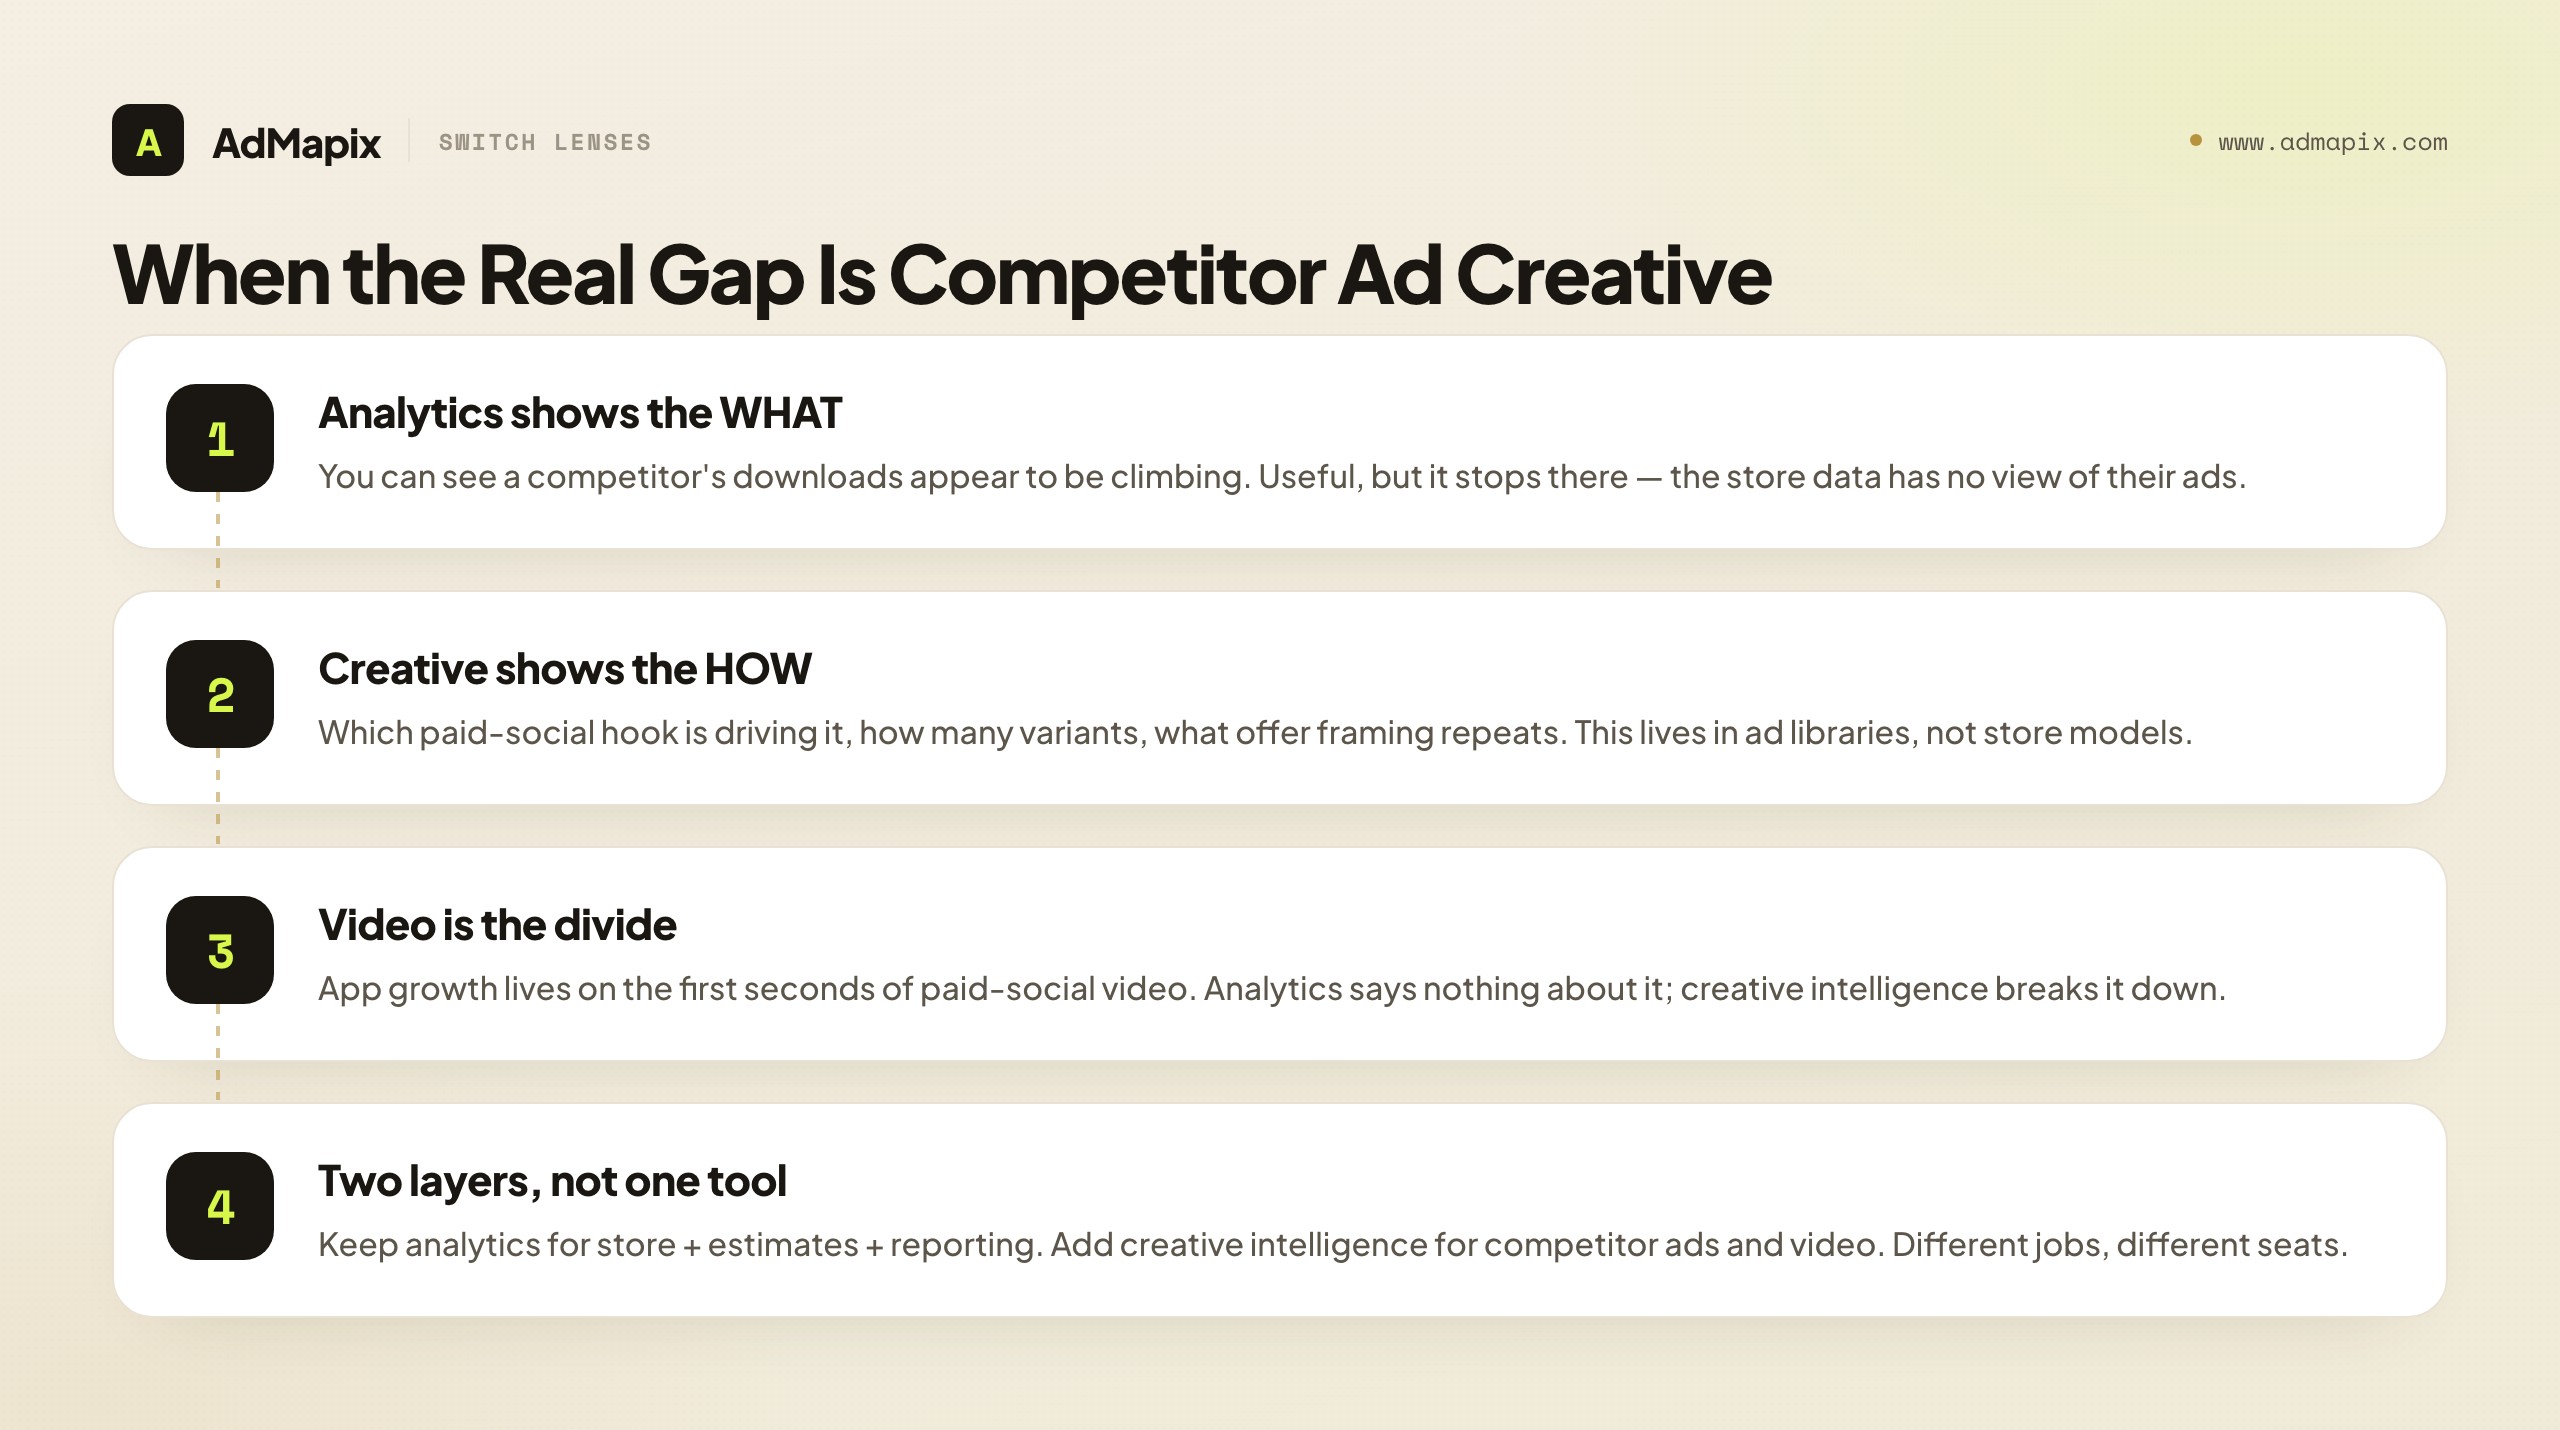
This is the moment to switch lenses entirely. If your bottleneck is creative — your own ads fatigue, your hooks stop converting, you have no systematic way to see what is working in your category's paid social — then your "Appfigures alternative" is not an analytics tool. It is ad creative intelligence: the ability to search competitor ads across networks, save the strongest examples, break down the videos, and turn patterns into briefs. An analytics platform and a creative-intelligence tool are not competitors for your budget; they answer different questions for different seats.
The distinction is sharpest around video. App growth lives and dies on paid-social creative, and paid-social creative lives and dies on the first few seconds of video — the hook, the pacing, the offer framing. An analytics tool has nothing to say about any of that; it was never built to. A creative-intelligence tool that breaks video down is the only thing that turns "this competitor is growing" into "here is the specific hook they are running, here is how many variants, here is the angle we should test." That translation — from market trajectory to testable creative idea — is the entire job, and it is a job no analytics dashboard can do.
A concrete example makes the gap unmistakable. Imagine your analytics tool shows a competitor in your category climbing the download charts over six weeks. That is a clear signal that something is working — but it is a closed box. Is it a new feature driving word of mouth? A price change? A seasonal tailwind? Or, most often in app growth, a paid-social creative that has found a hook and is scaling? The analytics data cannot distinguish between these, because all of them produce the same upward download curve. The only way to open the box on the creative explanation is to look at what the competitor is actually running in their ads — and that is a different tool entirely. When you do open it and find, say, a single UGC-style testimonial video running in forty variants across multiple networks for the entire six-week window, the story snaps into focus and, crucially, becomes testable for you. The download chart was the symptom; the creative was the cause you can act on.
If you recognize yourself in this, the cleanest mental model is two layers, not one tool. Keep your analytics layer for store performance, estimates, ASO, and reporting. Add a creative-intelligence layer for the competitor-ad and video work. We map the same split for two neighboring tools whose searchers face the identical confusion: the AppTweak alternative guide (AppTweak leans toward ASO and Apple Search Ads) and the MobileAction alternative guide (MobileAction leans toward ASO intelligence plus ad intelligence). All three are different tools, but the cross-cutting lesson repeats: separate the store-and-analytics job from the creative-evidence job, and buy each layer for what it actually does.
It is worth being explicit about who, on a real team, sits in the creative layer rather than the analytics layer, because the role tells you the tool. The analyst, the founder doing market sizing, and the agency producing store-performance reports live in the analytics layer — their KPIs are about position and trajectory. The UA lead, the creative strategist, and the performance marketer who actually buys media live in the creative layer — their KPIs are cost per install, cost per action, and ROAS, all of which are decided far more by creative than by store estimates once traffic arrives. When a creative-layer person reaches for an analytics tool, it is usually because the org only bought one tool and that was the one it bought. The fix is not to make the analytics tool do creative work it cannot do; it is to recognize that the creative-layer person needs a creative-layer tool, and to budget for the second layer rather than forcing one tool to be both.
What Public Ad Data Can and Cannot Prove
This is the most important section in the guide, because misreading public data is the costliest mistake in the whole category — and it applies to both layers, in mirror-image ways. On the analytics side, the trap is treating a modeled estimate as a measured fact. On the creative side, the trap is treating a competitor's heavily-run ad as proof that the ad is profitable. Both are seductive, both are wrong, and both can be avoided with the same discipline: know the difference between evidence and proof.
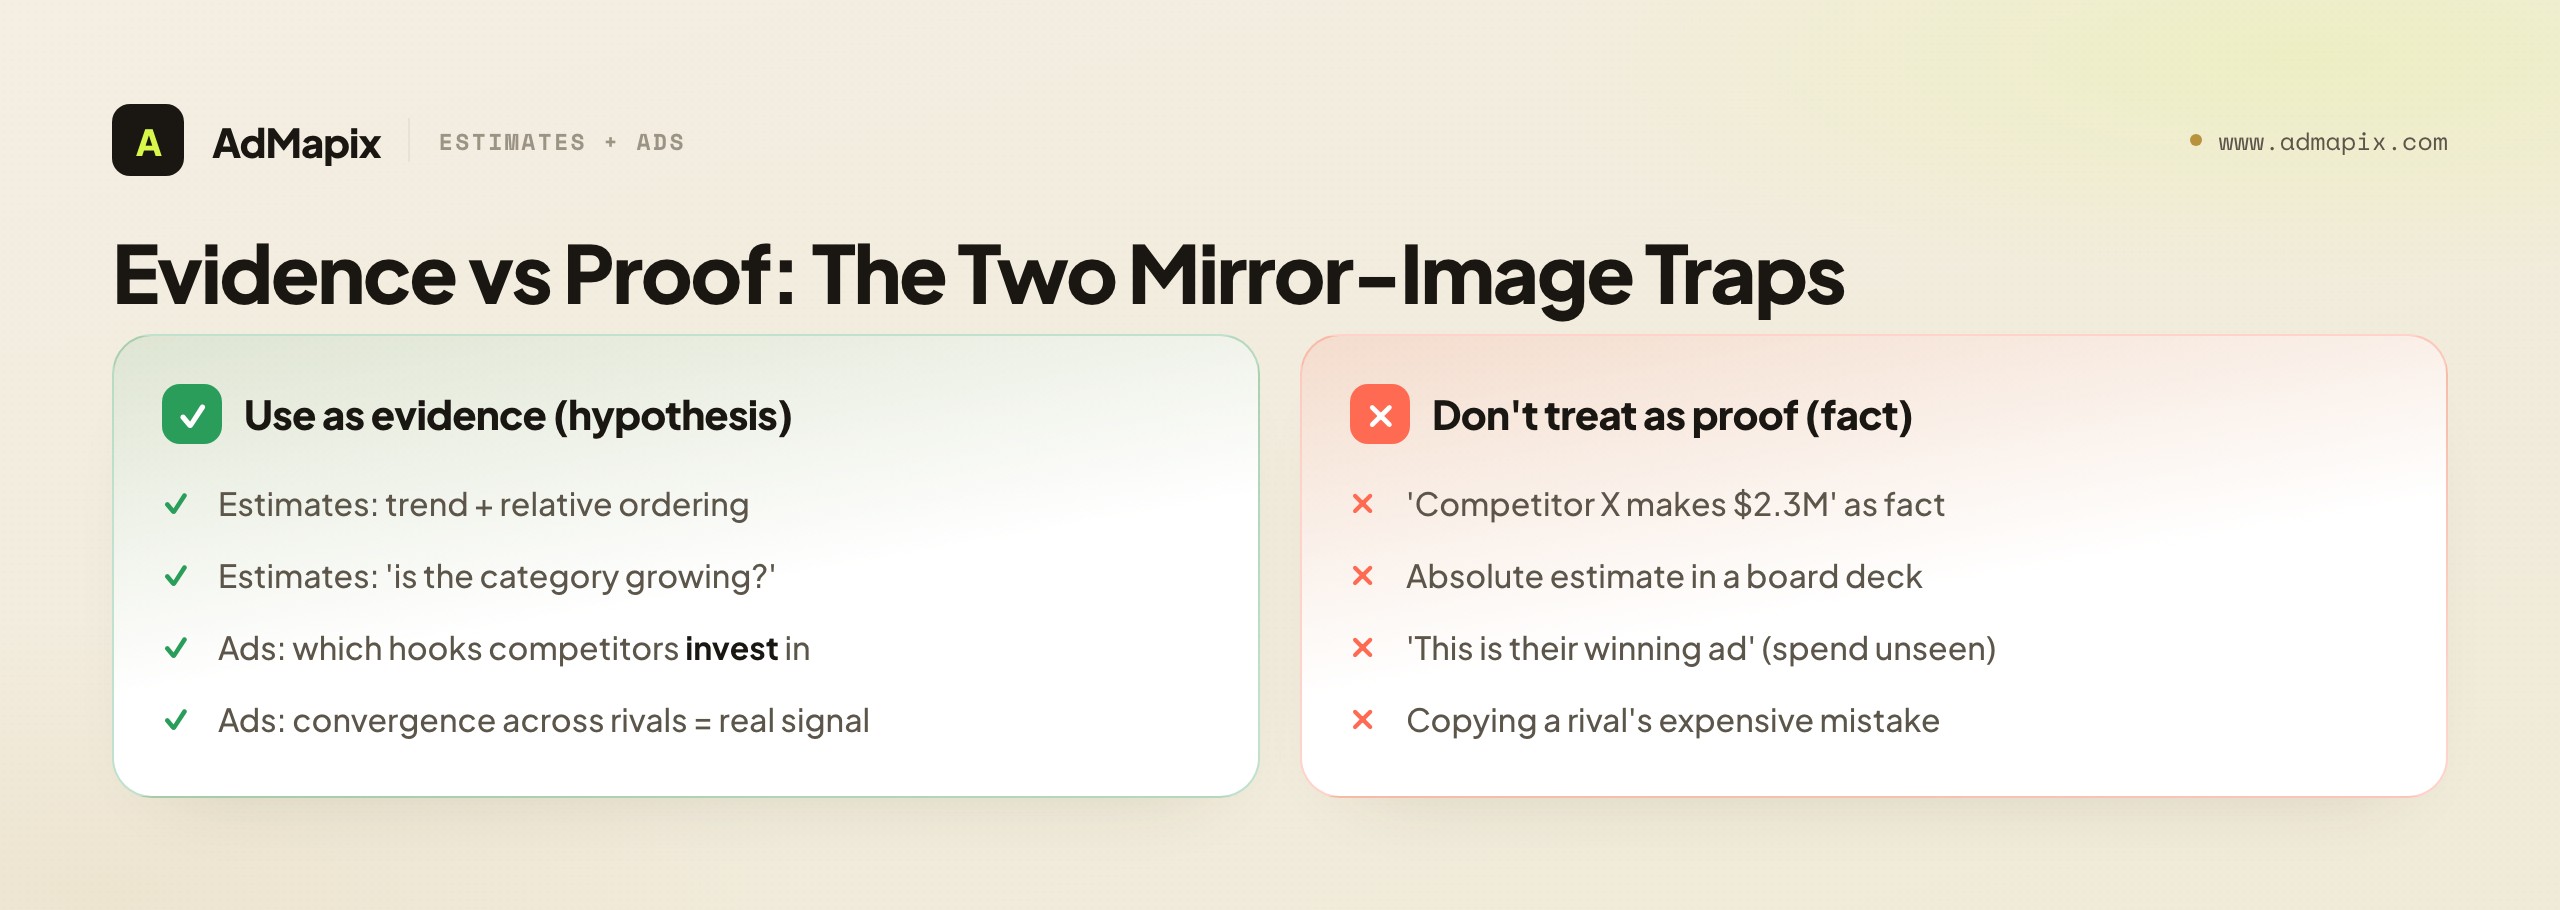
Start with estimates. A download or revenue estimate for an app you do not own is a model's best guess from sampled signals. It is often directionally right — useful for "is this category growing," "is this competitor bigger than that one," "is this app accelerating or stalling" — and often materially off in absolute terms, especially for anything outside the top charts. The correct use is comparative and trend-based: read the shape of the curve and the relative ordering, not the precise dollar figure. The incorrect use is quoting "Competitor X makes $2.3M a year" in a board deck as if it were their P&L. It is not, and the model's authors would be the first to say so.
Now the creative side. When you find a competitor running a specific video hook across many variants, sustained over weeks, that is strong evidence they are investing in it and likely iterating. It is not proof of performance. The public data does not reveal their spend, conversion rate, ROAS, or whether the campaign is actually profitable — a competitor can run a creative heavily for reasons that have nothing to do with it converting well. No public tool, AdMapix included, can see a competitor's internal performance data. Anyone claiming a tool surfaces "winning ads" from public data alone is overselling what the data can structurally support.
There is a useful asymmetry to exploit on the creative side, too. Public ad data is far better at telling you what not to miss than at telling you what to copy. If three of your four main competitors have all shifted to a particular video format or offer framing in the past month, that convergence is near-certain evidence you should at least test that direction — and convergence across independent advertisers is much harder to fake than any single advertiser's choices. Use the data defensively first (am I the last team in my category to notice this shift?) and offensively second (which specific angle should I borrow?). The defensive read is the more reliable one, and it is where a lot of the underrated value of creative intelligence actually lives: never being surprised by a format your whole category has already moved to.
The unifying practice is the same on both sides: use the public data to form hypotheses, then validate with data you actually own. An estimate suggests where to look; your own connected-account analytics confirm reality. A competitor ad suggests an angle to test; your own campaign results confirm whether it works for your audience. Keep that line crisp — evidence in, proof from your own numbers — and you extract nearly all the value of both layers while sidestepping the expensive mistakes. We go deeper on this discipline in our competitive analysis for paid advertising guide.
This is also the honesty test to apply to any vendor in either layer, ours included. To an analytics vendor: "How do you generate competitor estimates, and what is the accuracy for an app like mine in my market?" A good answer discloses the method and is candid about where accuracy drops. To a creative-intelligence vendor: "Can your tool tell me how a competitor's specific ad actually performed?" The correct answer is no, with an explanation of what it can show — run frequency, variant count, format, longevity, cross-network spread. If an analytics vendor implies their estimates are exact, or a creative vendor claims to surface "winning ads" from public data, you are being sold a story the data cannot back, and that is reason enough to keep looking.
Common Mistakes When Replacing Appfigures
The failure modes here are predictable, which means they are avoidable. Here are the ones that cost teams the most.
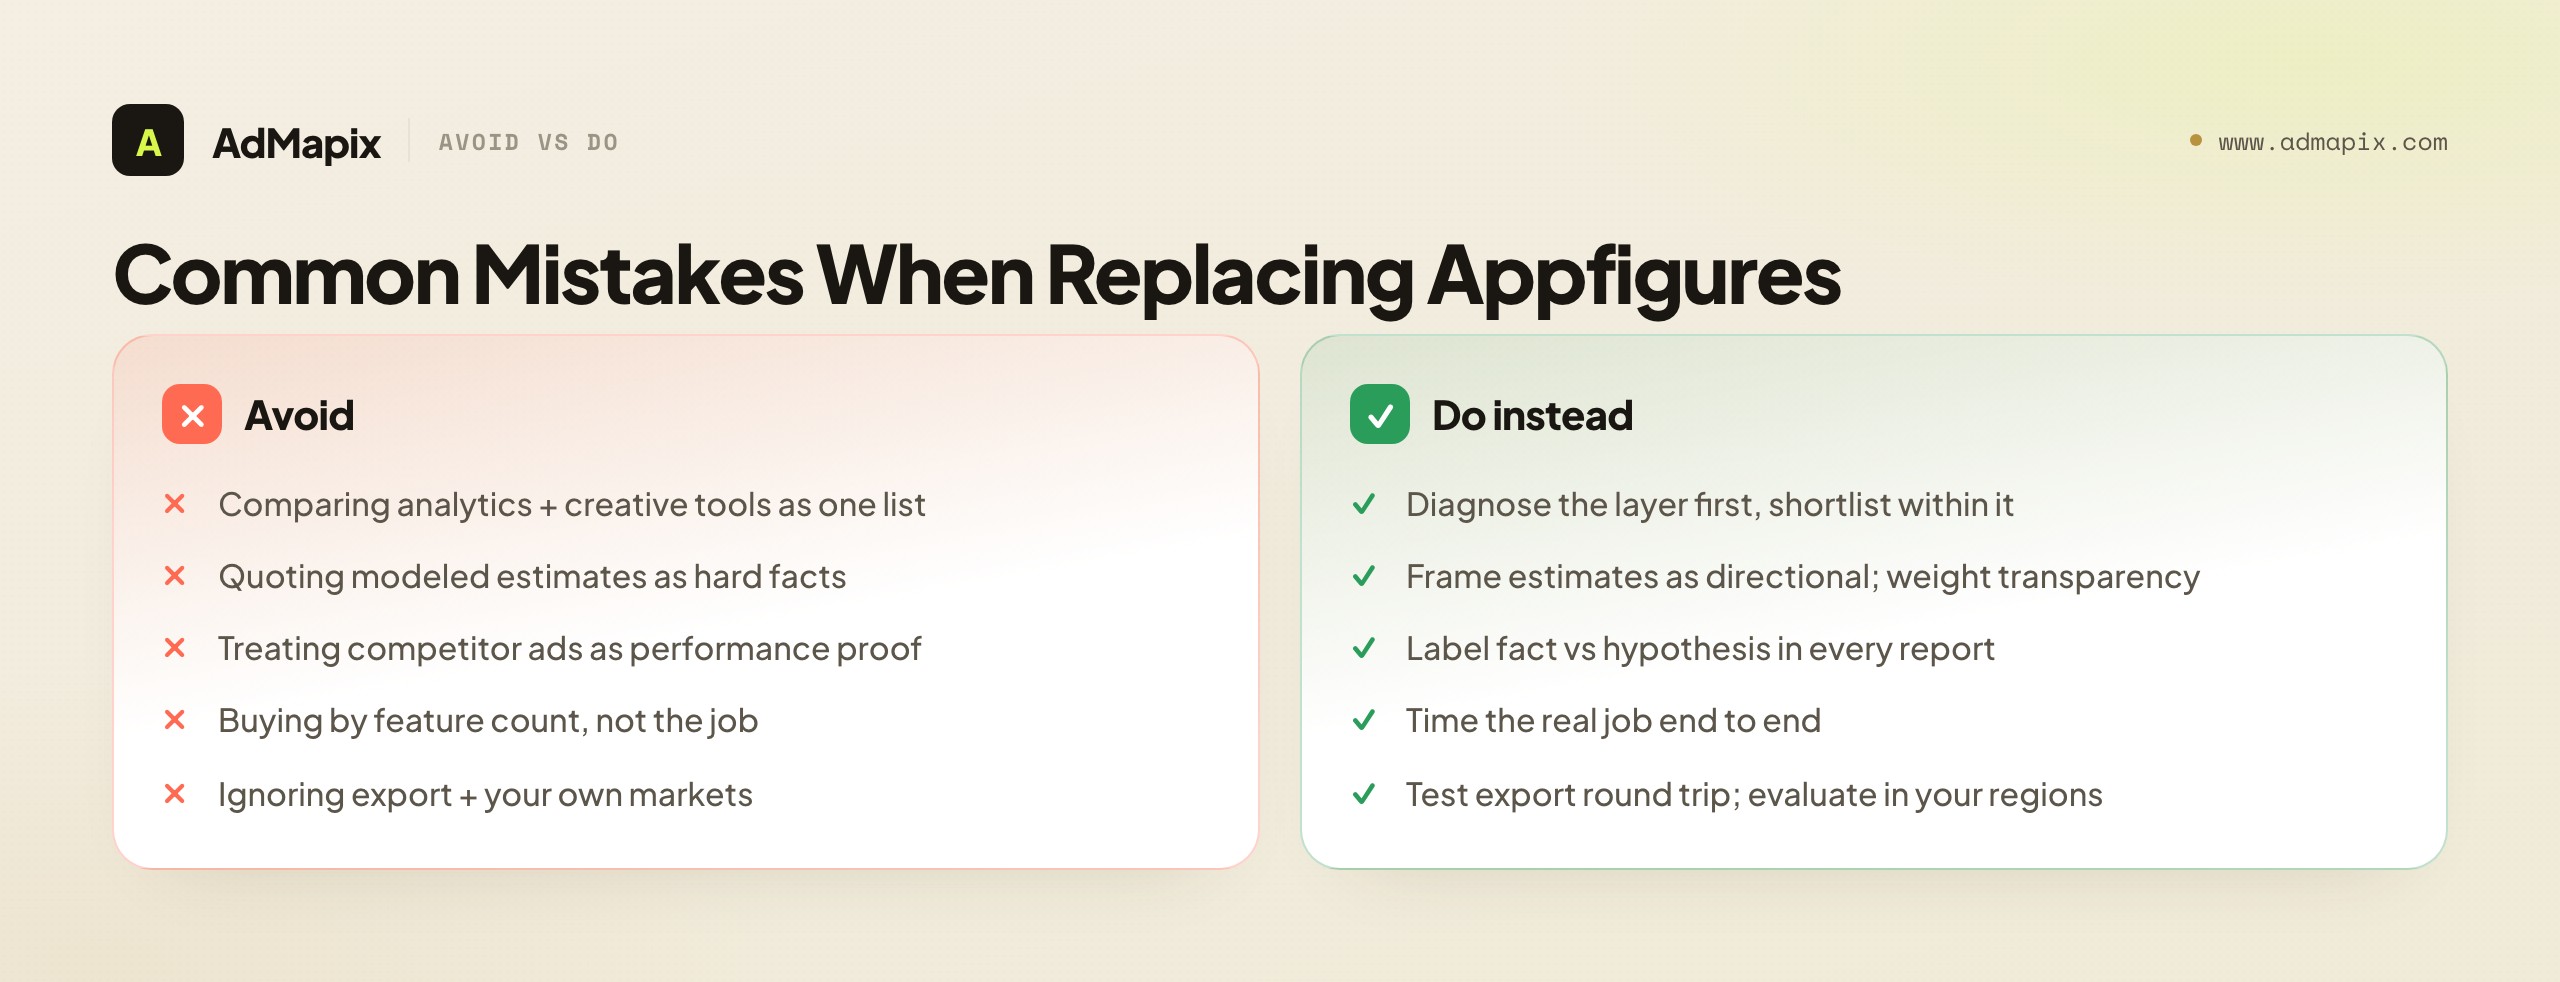
Comparing analytics tools against creative tools as one list. This is the root mistake. The two categories solve different jobs; a single "best Appfigures alternatives" list hides that and steers you to the wrong purchase. Diagnose your layer first, then shortlist within that layer only.
Quoting estimates as facts. Modeled download and revenue numbers are directional, not metered. Presenting a competitor's estimated revenue as a hard fact — to a board, a client, or yourself — is how confident decisions get built on sand. Always frame estimates as estimates, and weight estimate transparency when you choose a tool.
Treating competitor ads as performance proof. The mirror-image error on the creative side: repeated creatives suggest investment, not validated ROAS. Your own data validates. Build the fact-versus-hypothesis distinction into your reporting so it survives staff turnover and stakeholder pressure.
Buying for feature count instead of the job. A longer feature list is a weak proxy for value. The tool that gets you from question to a decision you would act on — fastest, repeatedly — wins on a one-year view even with fewer boxes ticked. Time the real job, not the spec sheet.
Ignoring export and ownership of your data. Analytics tools accumulate state — tracked apps, saved keyword sets, historical reports. If export is locked to a higher tier or strips fields, your data is trapped. Test the full round trip (track, report, export, share) before you commit, and budget time to recreate state when you switch.
Forgetting the markets you actually sell in. Store coverage and estimate accuracy vary enormously by country and store. Evaluate any analytics alternative in your primary markets, not the US English default that every demo opens with.
Optimizing the tool instead of the decision. The subtlest mistake is falling in love with the tool as an artifact — perfecting dashboards, tracking ever more apps, generating ever more reports — while the number of decisions the data actually drives stays flat. A tool that produces beautiful reports and zero changed actions is a hobby, not a growth lever. Tie every reporting cycle to a decision. If a month of diligent analytics did not change a single roadmap call, ASO push, pricing move, or creative test, the problem is not the data; it is that the output never reached a decision-maker who acted on it.
When (and When Not) to Use AdMapix
We will be precise about where AdMapix fits, because the whole point of this guide is to keep the layers honest. AdMapix is ad creative intelligence. It is the right tool when your analytics are already handled and your real gap is competitor ad creative evidence: searching ads across networks, saving the strongest examples, breaking down videos, and turning patterns into reports and briefs. It is built for UA teams, creative strategists, and agencies who brief and ship paid-social tests on a cadence.
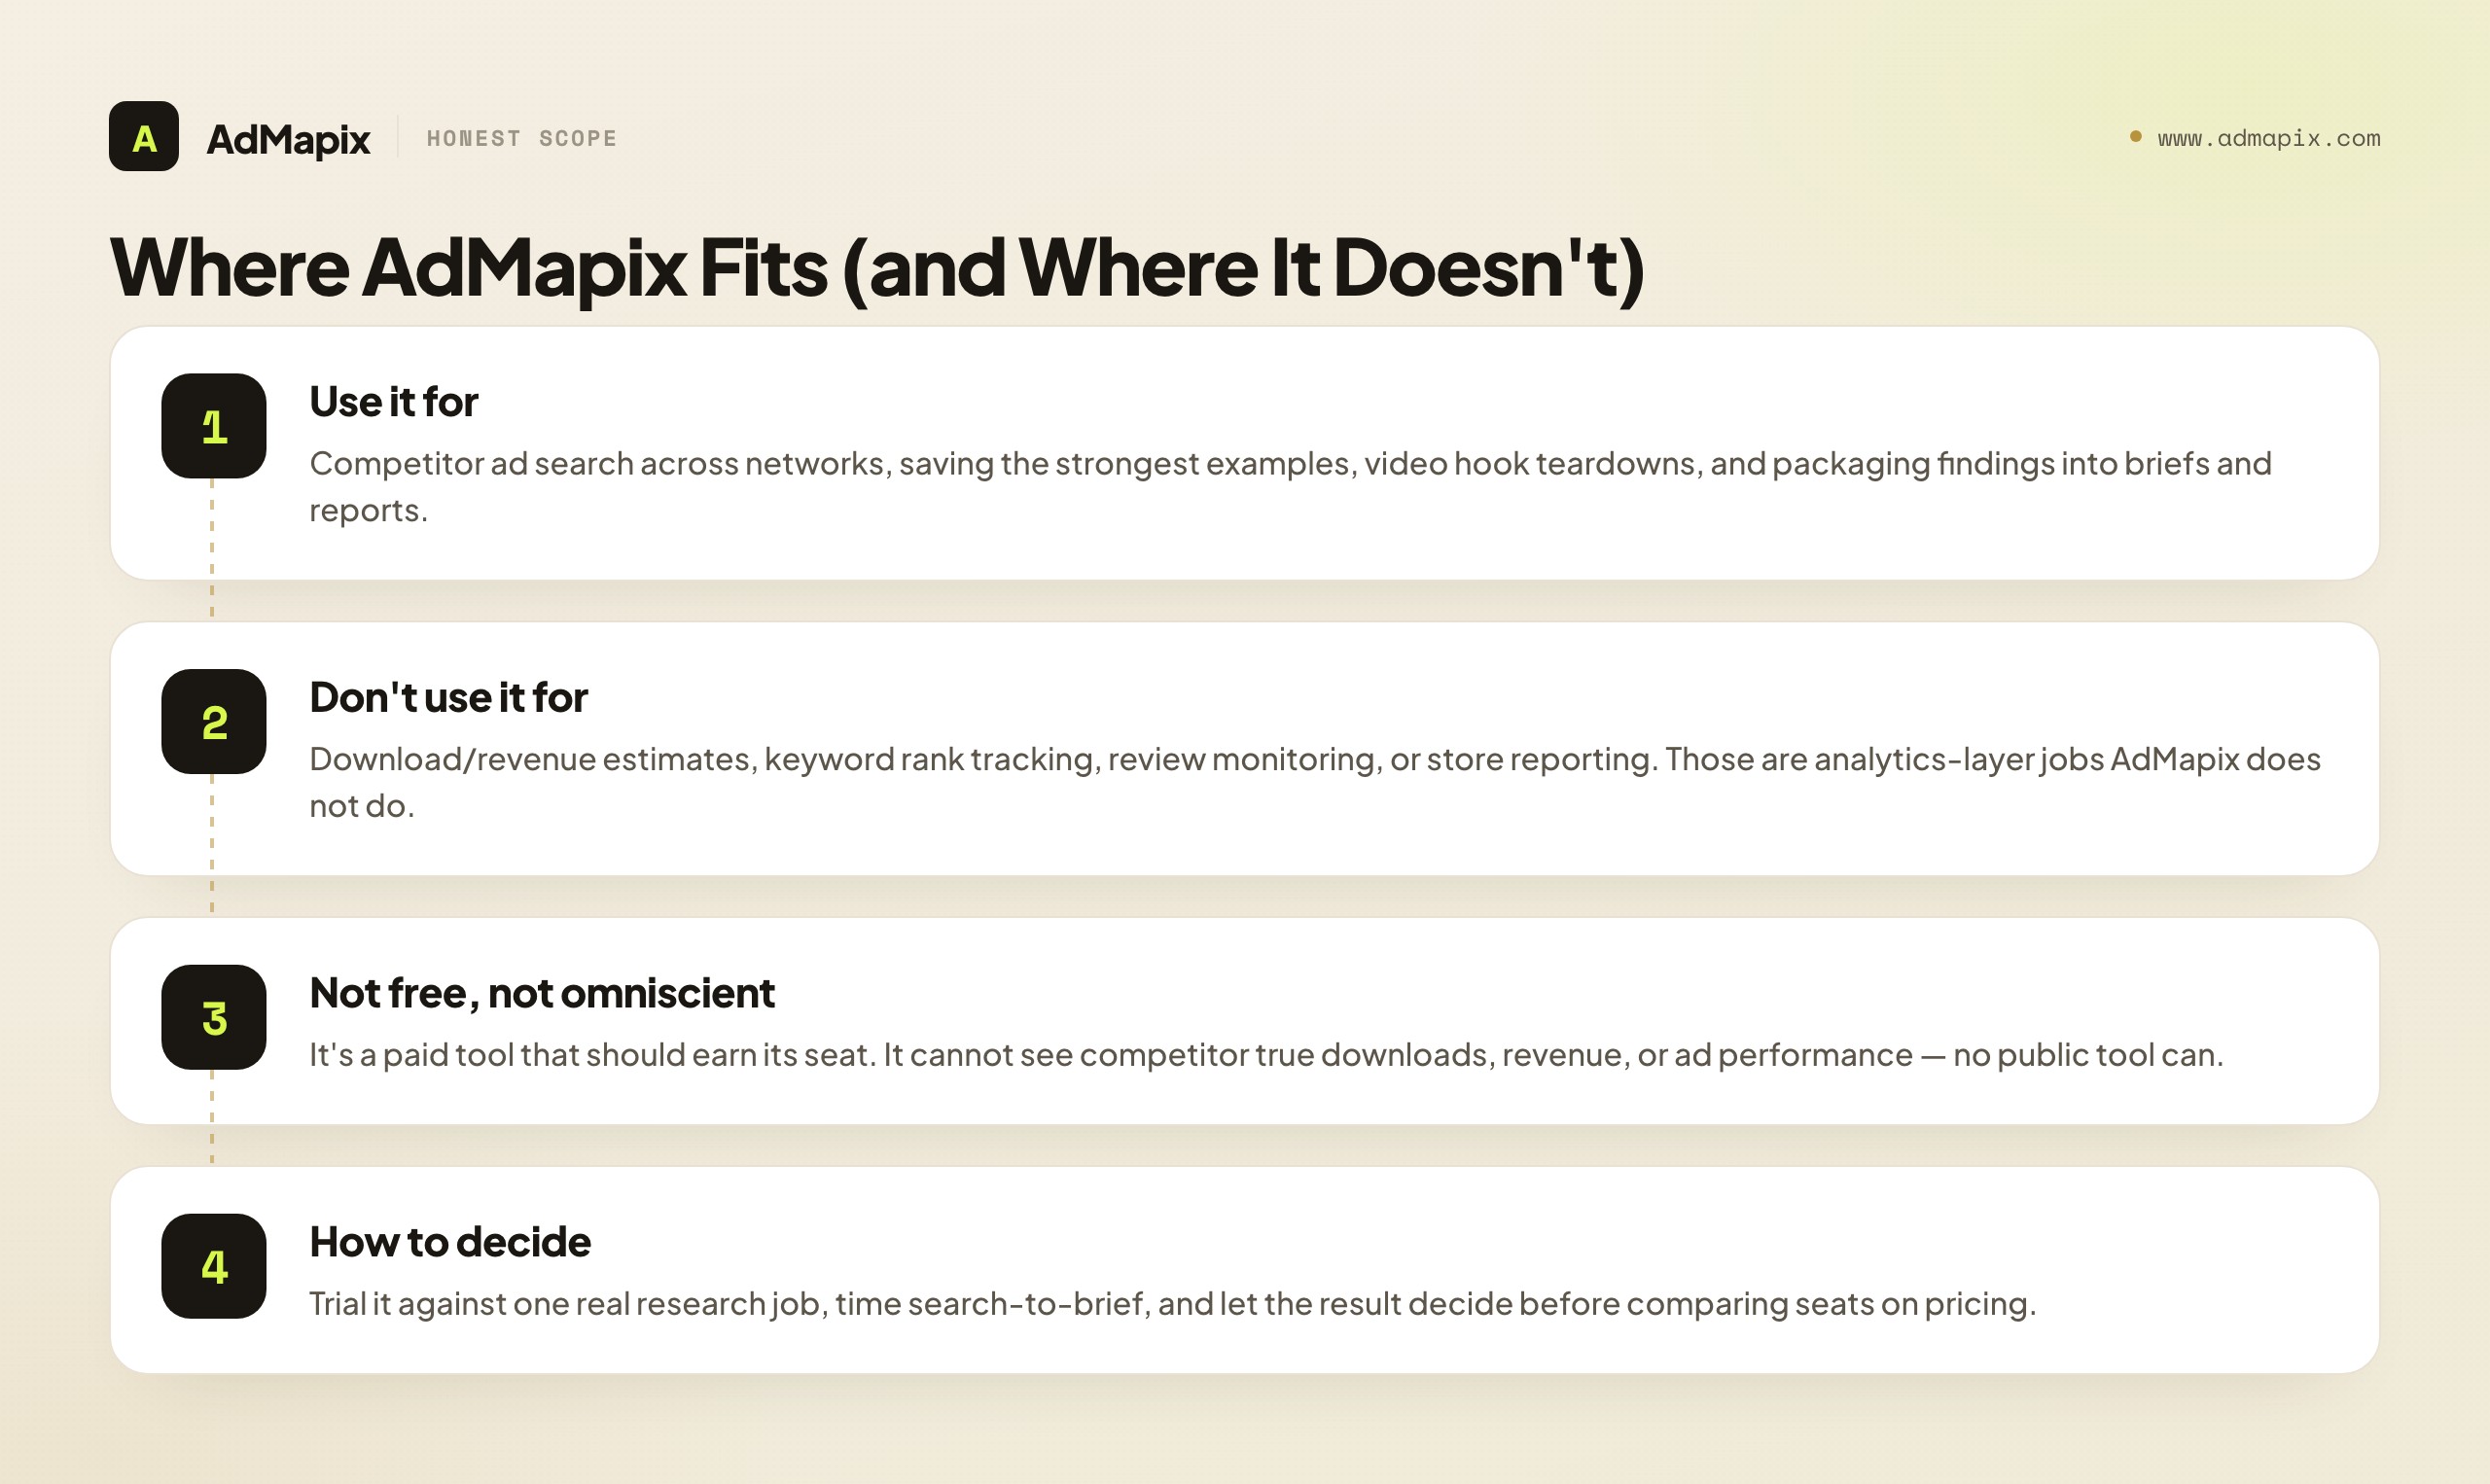
It is not an app-analytics tool. AdMapix does not estimate downloads or revenue, does not track keyword rankings, does not monitor reviews, and does not report store performance. For those jobs, keep or replace your analytics platform — AdMapix does not do them and we are not going to pretend it does. It also cannot see a competitor's true downloads, revenue, or ad performance, because no public tool can. And we are not going to call it "free"; it is a paid product that should earn its seat against the job it actually does. If your only bottleneck is store analytics and reporting, AdMapix is not your Appfigures alternative, and we would rather tell you that than sell you a mismatch. The clearest way to hold the line: if your question starts with "how many" or "how much" or "where do we rank," that is an analytics question and AdMapix is the wrong tool. If your question starts with "what are they running" or "what should we test," that is a creative question and AdMapix is built for it. The first word of your question tells you the layer.
Where it earns its place is the creative-research loop. A practical stack keeps your analytics tool for store data, estimates, ASO, and reporting, then uses Search AdMapix for cross-network creative discovery, Media to save the evidence worth keeping so you are not re-finding the same competitor ads every week, Video Analysis to break down hooks and first-screen structure, and Reports to package findings for the team or the client. A concrete weekly loop: take the competitor set your analytics flagged as growing, run it once in Search AdMapix to see what they are actually running in paid, save the strongest creatives in Media, break the two or three most consequential videos down in Video Analysis, and write a short brief in Reports naming the one angle you will test and the metric you will judge it by. That loop turns a market signal from your analytics tool into a testable creative decision — the exact handoff an analytics tool alone can never complete.
The reason this handoff is worth building deliberately is that it closes a loop your analytics tool opens but cannot finish. Analytics raises the question — "why is this competitor pulling ahead?" — and then goes silent, because the answer is not in store data. The creative layer is what supplies the answer and, more importantly, converts it into something you can do on Monday. Without the creative layer, every interesting analytics signal dead-ends in curiosity; with it, the same signal becomes a test. That conversion — from "huh, interesting" to "here is the experiment we are running this week" — is the entire economic justification for adding the second layer, and it is why a team that has outgrown pure analytics so often finds that the missing piece was never a better analytics tool but a creative-intelligence tool sitting next to it.
Once the creative workflow earns its place — once it is shaving real time off your weekly research and producing briefs your team acts on — compare seats on Pricing or create an account from Login. Until then, trial it against a real research job, time it, and let the result decide. We also cover the broader discipline of turning competitor signals into recurring decisions in our ad tracking and competitive research guide.
Building a Two-Layer Stack That Actually Works
For the many teams whose honest answer is "we need both," the goal is not to find one tool that does analytics and creative work adequately. It is to run two specialized layers with a clean handoff, so each does what it is best at and nothing falls between them.
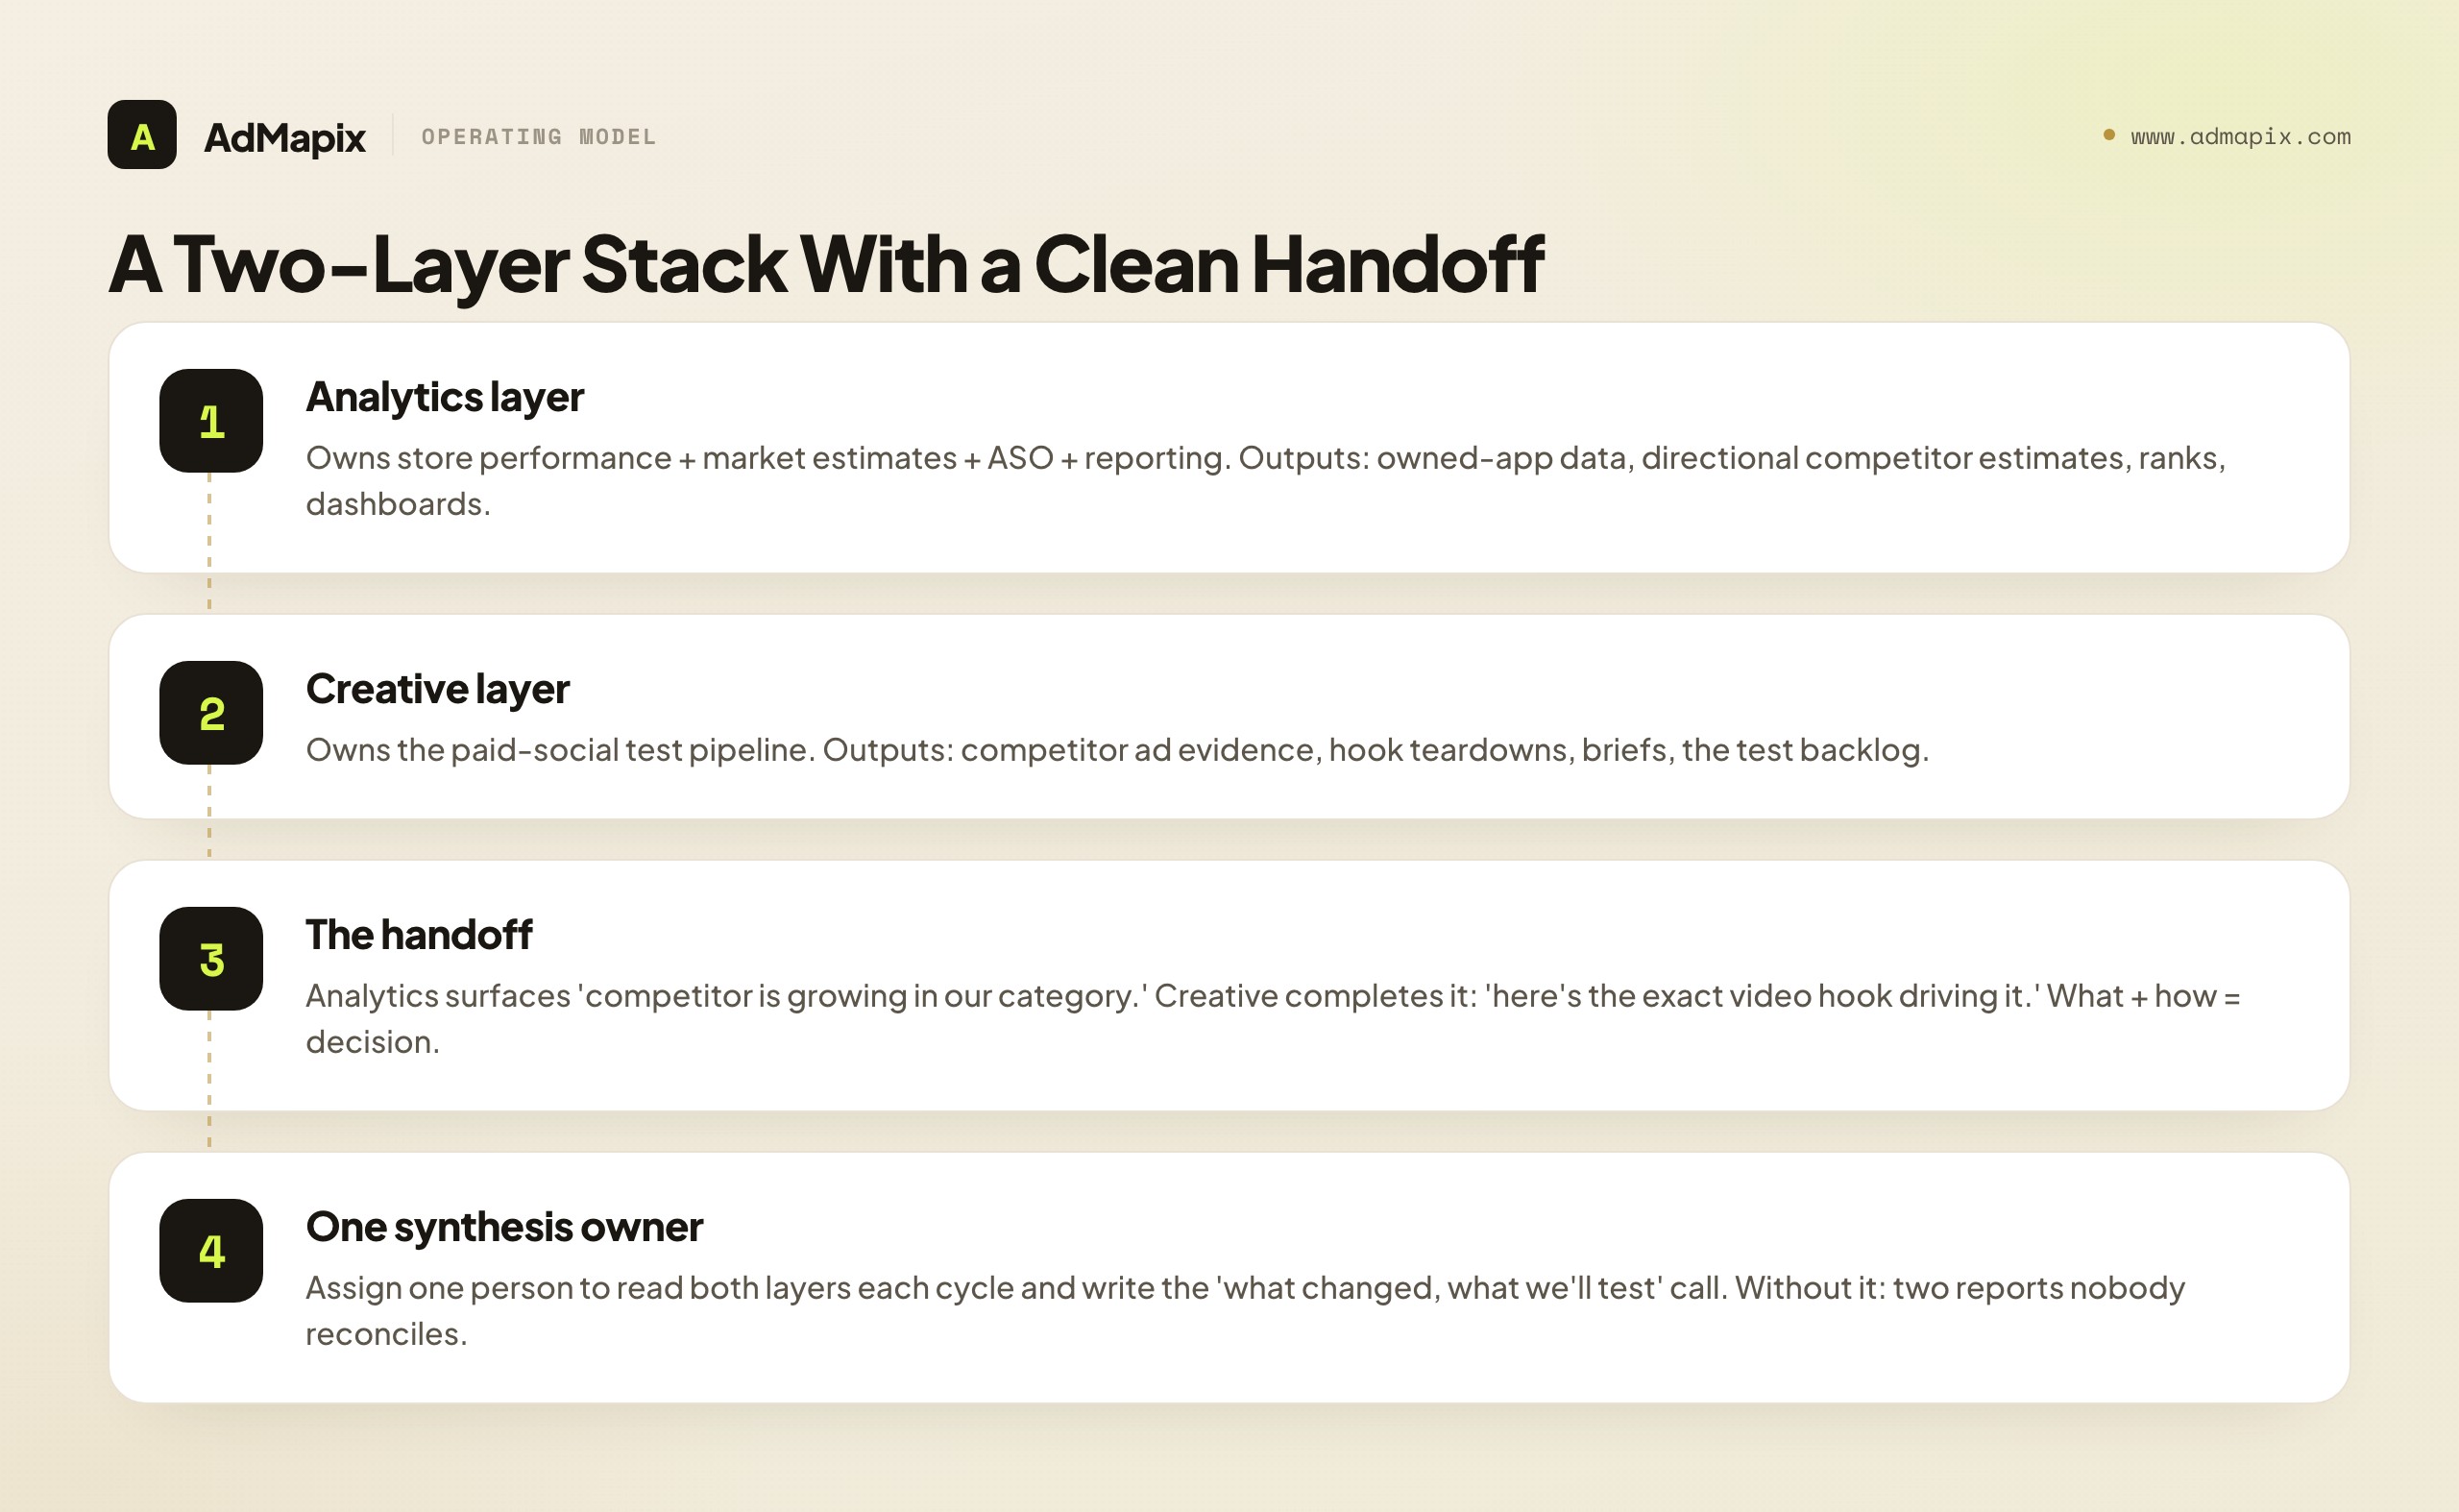
The analytics layer — your Appfigures-class app-analytics platform — owns store performance, market estimates, ASO tracking, and reporting. Its outputs are first-party performance data for your own apps, directional market estimates for competitors, keyword and rank positions, and the dashboards stakeholders read. Its job is to tell you what is happening in the store and the market: who is growing, where you stand, how the category is moving. Think of it as the instrument panel — it tells you your altitude, your speed, and roughly where the other aircraft are, which is exactly what you need to know your position but says nothing about what to do next at the controls.
The creative layer — your ad creative intelligence tool — owns the paid-social testing pipeline. Its outputs are competitor ad evidence, hook teardowns, creative briefs, and the test backlog. Its job is to tell you what to do about it on the creative side: which angles competitors are amplifying, what is fresh versus fatigued, and what your next test should be. Continuing the analogy, this is the hands on the controls — given your position from the instruments, it decides the maneuver. Instruments without a pilot is just awareness; a pilot without instruments is flying blind. You want both, wired together, with one person reading the panel and flying the plane.
The handoff is where the value compounds. The analytics layer surfaces a signal — "this competitor's downloads are climbing in our category." On its own, that is interesting but not actionable. The creative layer completes it — "and here is the specific UGC-style video hook they have flooded paid social with, in dozens of variants, for three weeks." Now you have a coherent story (this competitor is growing and here is the creative engine likely driving it) and a clear response (test that angle, framed for our audience). The analytics layer is the what; the creative layer is the how; the synthesis is the decision.
The organizational discipline that makes this work is a single synthesis owner. In a small team that is often the founder or head of growth reading both layers and writing the recommendation. In a larger team it is the analyst and the UA lead trading one headline each in a short recurring meeting and jointly deciding the next move. What does not work is leaving the connection to chance — assuming that because the analyst sees estimates and the UA lead sees creatives, the joined-up insight will emerge on its own. It will not. Connected insight is a job; give it an owner and a cadence, and the two-layer stack pays off. Leave it implicit, and you have two tools producing two reports nobody reconciles.
There is one more failure mode specific to two-layer stacks that is worth guarding against: optimizing each layer in isolation until they drift apart. The analytics layer starts tracking a sprawling list of apps "just in case"; the creative layer accumulates saved ads nobody ever revisits. Both feel productive and neither drives decisions. The antidote is to anchor both layers to the same competitor set and the same cadence. Track the apps you will actually act on, save the creatives you will actually reference, and review both on the same weekly or biweekly rhythm so the signals line up in time. When a download trend and a creative shift point at the same competitor in the same week, that alignment is the highest-confidence input you will get — and you only see it if both layers are watching the same set on the same clock. A stack that is disciplined about scope and cadence produces sharp, aligned decisions; one that lets each layer wander produces two growing piles of data and a vague feeling of being well-informed while nothing changes.
A Practical Decision Path
If you remember nothing else, remember the order of operations. The tool is the last decision, not the first.
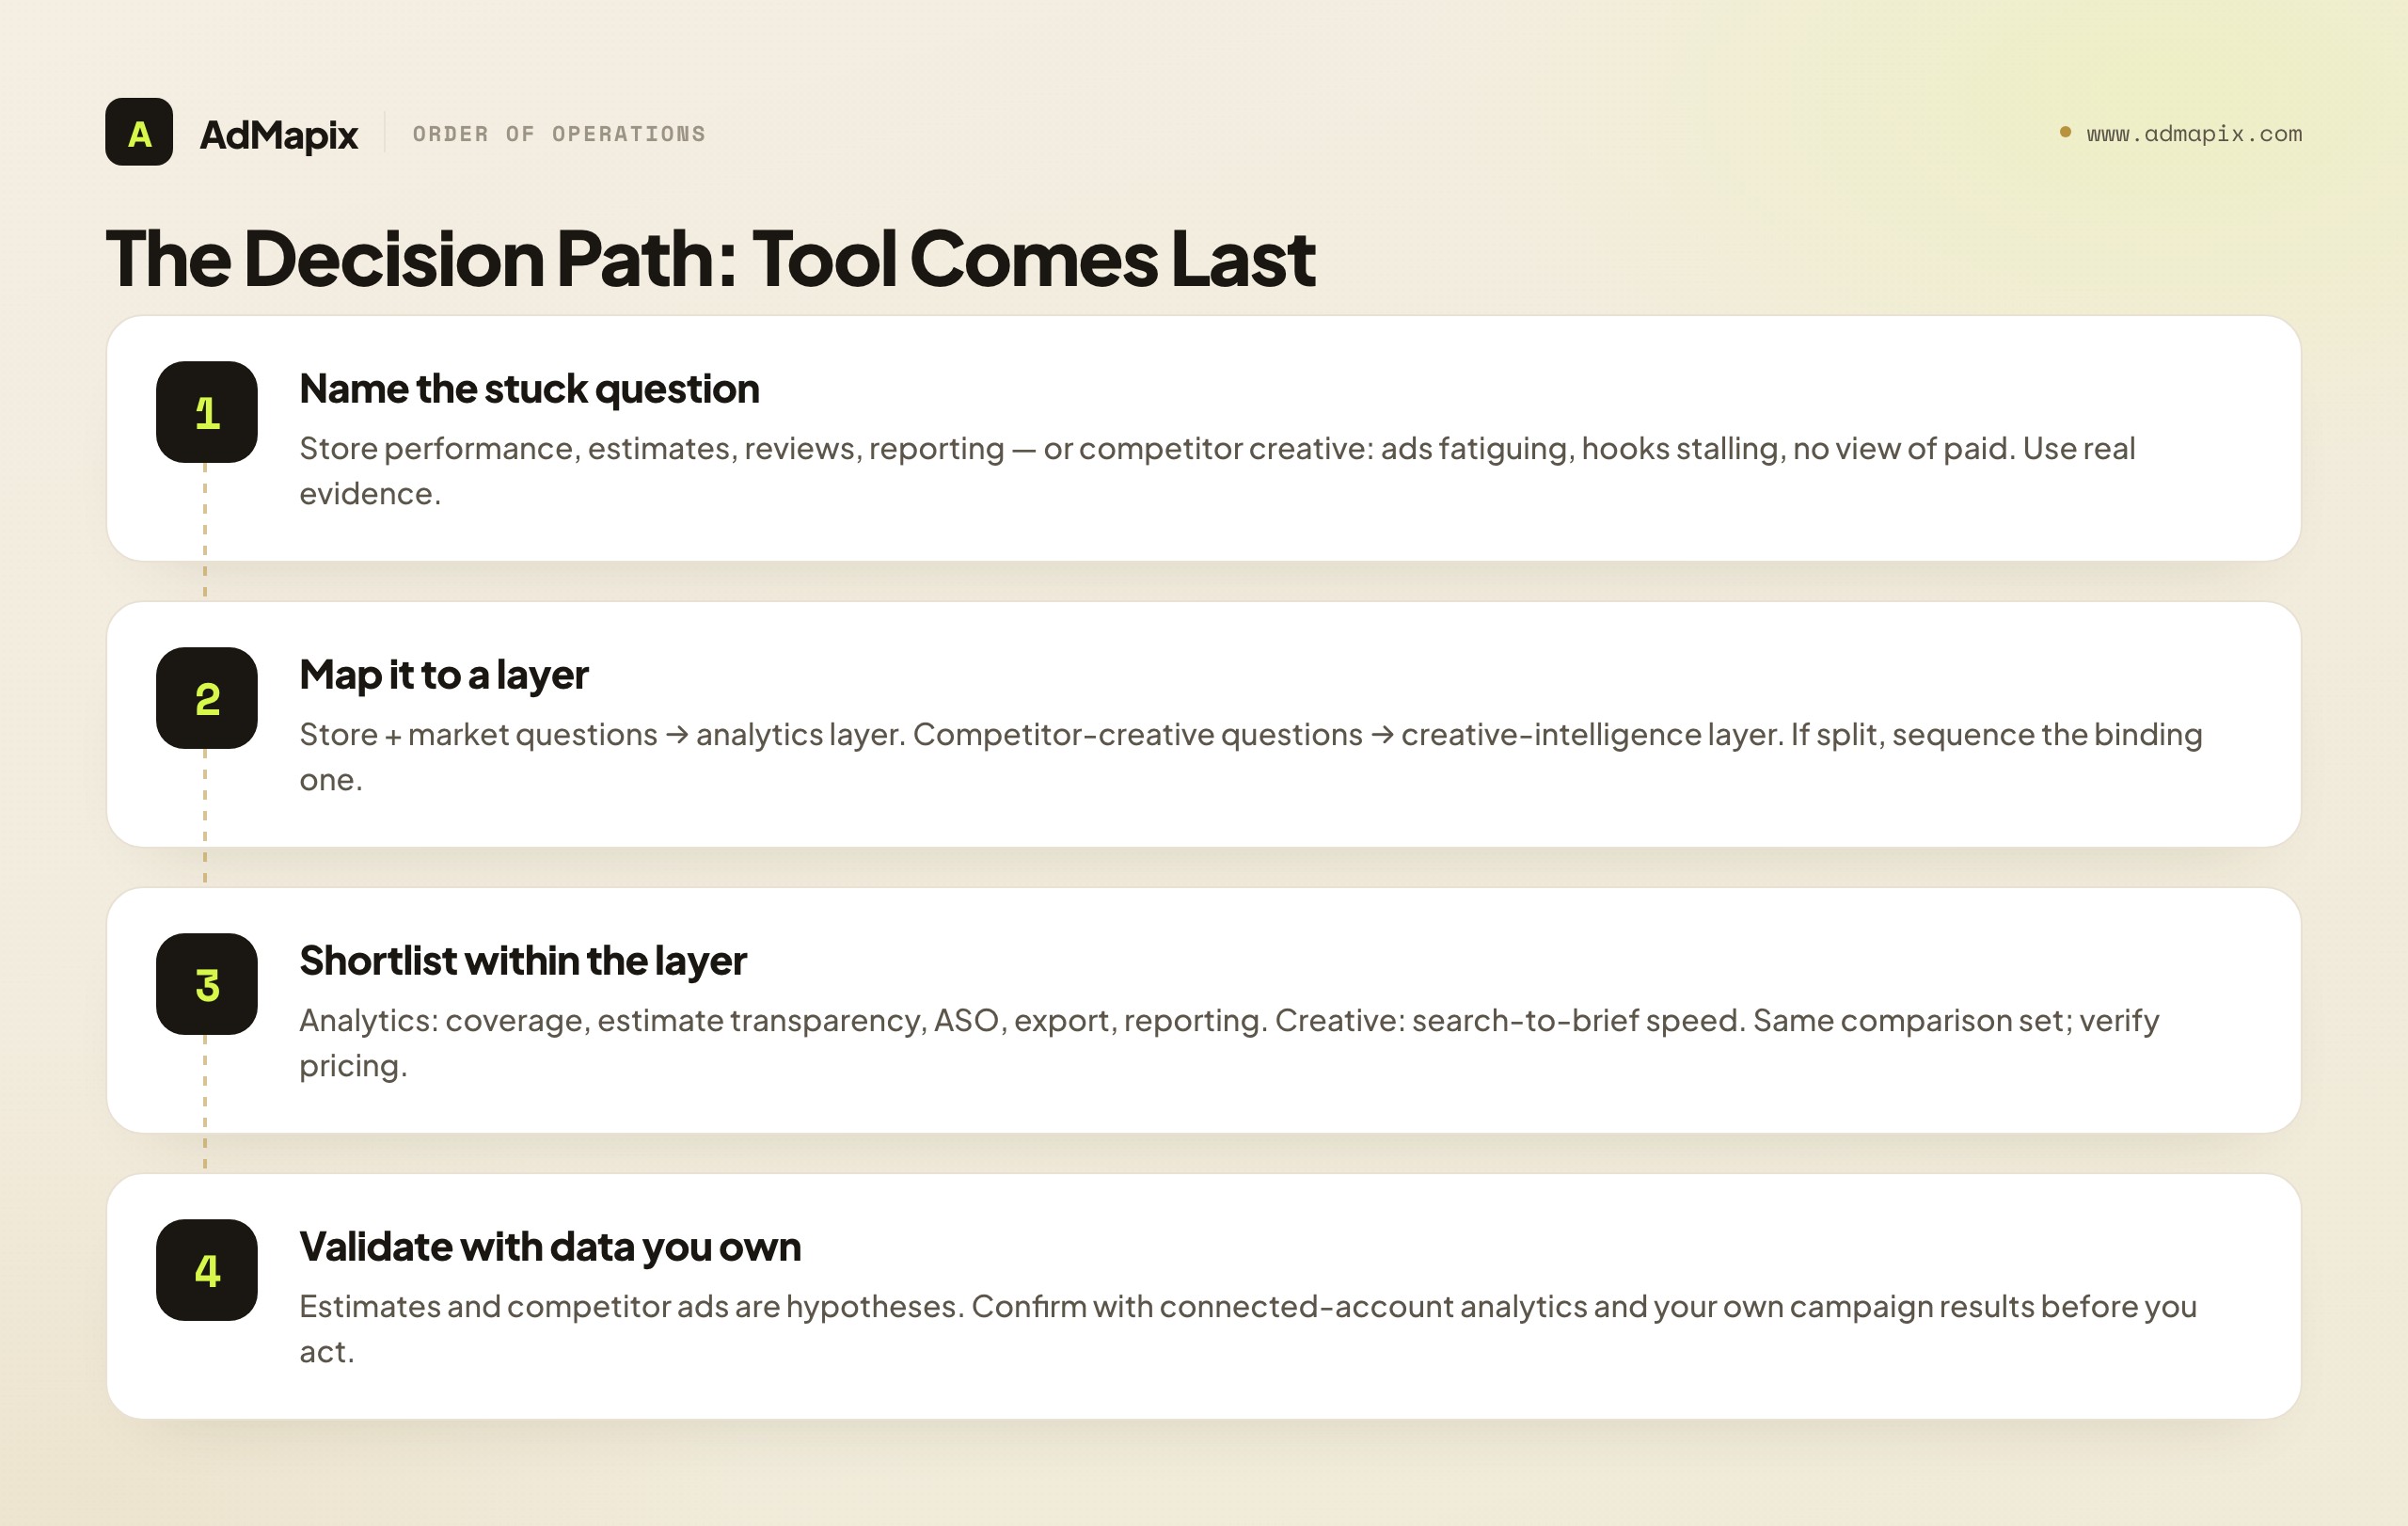
Start by naming the metric or question that is actually stuck. Is it store performance, keyword visibility, review sentiment, or how you report all of that to a stakeholder? Or is it competitor creative — your ads fatiguing, your hooks stalling, no view into what your category is testing in paid? Be honest, and use real evidence, not a vague sense that you "need more data."
Then map that question to its layer. Store-and-market questions live in the analytics layer; competitor-creative questions live in the creative-intelligence layer. If your needs are genuinely split across both, you are a two-layer team — plan for both, but sequence them: start with whichever layer's question is the more binding constraint this quarter.
Next, shortlist within that layer only. For analytics, compare coverage, estimate transparency, ASO depth, export, and reporting against your real deliverable. For creative, time how fast you go from search to a saved set of strong ads to a usable test brief. In both cases, run the same comparison set through every candidate, verify current coverage and pricing, and score time-to-decision rather than feature count. Resist the pull of the tool with the most features; the winner is the one that produces your deliverable fastest on your data in your markets, repeated across more than one trial run so you are measuring the tool and not a lucky first result.
A small but powerful habit ties this together: before you start any trial, write down the single sentence that the trial is meant to answer. "Can this tool produce my monthly client store-performance report in under an hour?" Or "Can this tool take me from a competitor name to a usable creative test brief in fifteen minutes?" A trial with a written success sentence ends in a clear yes or no; a trial without one ends in a vague impression and a purchase you half-regret. The sentence is free and it makes every later decision crisper, because you are no longer asking "is this a good tool" in the abstract — you are asking "did it do the one job I needed," which is the only question that matters.
Finally, treat every estimate and every competitor ad as a hypothesis, not a verdict, and validate with data you own. That single discipline protects you from the two most expensive mistakes in the category — quoting estimates as facts and treating competitor ads as proof — regardless of which tools you choose. Do that, and "Appfigures alternative" stops being one confusing search and becomes two clear, answerable questions, each with a tool category that genuinely fits.
The deeper lesson underneath all of this is that tooling decisions are downstream of an honest read of your own constraints. The teams that waste the least are not the ones with the biggest tool budgets — they are the ones who slow down for a few minutes to name the exact question that is blocking them before they ever open a vendor's pricing page. Most wasted spend in app marketing is not a bad tool; it is a perfectly good tool bought for the wrong job because nobody named the constraint first. Spend the diagnostic minutes. They are the cheapest, highest-leverage minutes in the whole process, and they make every dollar you spend afterward land where it actually moves a number — whether that number lives in the store charts or in the ad auction.
FAQ
What is the best Appfigures alternative?
There is no single best one, because it depends on the job. If you need app analytics, download and revenue estimates, ASO tracking, or store reporting, your alternatives are other app-analytics platforms, and you should compare them on coverage, estimate transparency, ASO depth, export, and pricing. If you need competitor ad creative research and video analysis, a creative-intelligence tool such as AdMapix fits a different layer entirely. Diagnose which job you are doing before you shortlist — that decision matters far more than any feature comparison.
Can AdMapix replace Appfigures?
No. AdMapix does not estimate downloads or revenue, track keyword rankings, monitor reviews, or report store performance. It covers cross-network ad creative search, saved media, video analysis, tagging, and reports. It complements an app-analytics tool rather than replacing it. If your bottleneck is store analytics and reporting, keep or replace your analytics platform; AdMapix is the wrong layer for that job, and we would rather say so than sell you a mismatch.
How accurate are Appfigures-style download and revenue estimates?
For apps you do not own, the numbers are modeled from sampled signals, not metered, so accuracy varies a lot by store, category, country, and how popular the app is. Top-chart apps are estimated more reliably than mid-tier and long-tail ones. Use estimates comparatively and for trends — who is growing, who is bigger, is the category expanding — rather than as precise dollar figures, and never present a competitor's estimated revenue as a hard fact.
Should app teams use both an analytics tool and a creative tool?
Usually yes, if both store performance and creative testing are live problems. They are separate problems with separate evidence. Many teams keep an analytics platform for store data, estimates, ASO, and reporting, then add creative intelligence to research competitor ads and brief paid-social tests. The key is to assign one owner to synthesize both layers into decisions each cycle, otherwise you have two data sources and no actions.
Does competitor ad data show how well an ad performed?
No. Public ad data shows what is running and how often it is varied, which signals investment and iteration. It does not reveal spend, conversion rate, or ROAS. A competitor can run a creative heavily and still lose money on it. Use the data to form hypotheses about what to test, then validate performance with your own campaign and business metrics. Any tool claiming to show competitor "winners" from public data alone is overselling what the data can support.
Is Appfigures an analytics tool or an ASO tool?
Appfigures is primarily an app-analytics and app-intelligence platform — store data, download and revenue estimates, dashboards, and reporting — with ASO keyword and ranking features included. Its center of gravity is analytics and market intelligence, so a like-for-like alternative is another analytics-led platform. If you specifically want deep, video-level competitor ad creative intelligence, that is a different product category that you should evaluate on its own terms.
What is the difference between app analytics and ad creative intelligence?
App analytics tells you about performance and market position: how apps are doing, roughly how they compare via estimates, how they trend, and how to report that. Ad creative intelligence tells you about advertising: which competitor ads are live, what hooks and offers they use, and what you should test next. Analytics is a store-and-market lens; creative intelligence is an ad-auction lens. Different data, different workflow, different owner — and neither replaces the other.
Do I still need an ASO tool if I use Appfigures?
Appfigures includes ASO keyword and ranking features, so for many teams it covers the ASO basics within the analytics layer. Whether you need a dedicated ASO tool on top depends on how deep your keyword work goes — competitor keyword overlap, large-scale rank tracking, and ASA workflows can push you toward a more ASO-focused platform. Either way, that is still the analytics-and-store layer; it is separate from the creative-intelligence layer that handles competitor ads.
How is Appfigures different from AppTweak or MobileAction?
All three are app-marketing tools with different centers of gravity. Appfigures leans toward app analytics, downloads, and revenue estimates. AppTweak leans toward ASO and Apple Search Ads. MobileAction leans toward ASO intelligence plus ad intelligence for mobile. Because they overlap, searchers for each face the same analytics-or-creative split this guide describes. See our AppTweak alternative and MobileAction alternative guides for the tool-specific versions.
How often should I review competitor ad creative?
A weekly or biweekly cadence works for most teams, matched to your creative production rhythm. The goal is to catch format shifts and new angles early enough to test them before they are exhausted, not to watch competitors constantly. Save the strongest evidence so each review builds on the last instead of starting from scratch, and end every review with a concrete test recommendation. Cadence plus a saved evidence base is what turns ad-watching into a compounding advantage rather than busywork.
Key Takeaways
- Decide whether your bottleneck is store performance and reporting (analytics) or competitor creative (ad intelligence) before you shortlist any tool.
- For downloads, revenue estimates, ASO tracking, reviews, and reporting, compare other app-analytics platforms — not creative databases.
- For competitor ads, video hooks, and creative briefs, use creative intelligence such as AdMapix. It complements an analytics tool; it does not replace one.
- Treat estimates and competitor ads as hypotheses. Modeled estimates are directional, not metered; public ad data proves intent, not performance.
- Validate both with data you own — connected-account analytics for estimates, your own campaign results for creative.
- If you need both layers, run them deliberately with one owner synthesizing them into decisions each cycle.
Sources
Official pages checked as of June 21, 2026. Pricing, product names, and availability can change, so verify the current plan before purchase or migration.
- Appfigures — positions itself as an app analytics and app intelligence platform covering store data, downloads and revenue estimates, ASO, and reporting.
- Appfigures app intelligence overview — describes its app and market exploration features for downloads, revenue, and rankings.
- Appfigures ASO and keyword features — focuses on keyword tracking, suggestions, and app store optimization within the analytics platform.
- Apple App Store and Google Play — the underlying stores whose public surfaces analytics tools model estimates from.
Disclosure: AdMapix is our product. We include it where the job is competitor ad creative research and video analysis, and we separate that clearly from the app-analytics and reporting workflows it does not cover. We do not describe it as free, and we do not claim it can see competitor downloads, revenue, or ad performance, because no public tool can.
See what competitors are really running
Search 6M+ ad creatives, landing pages, and weekly spend across 200+ countries. No credit card, no commitment.
Related Articles
Semrush Ad Intelligence Alternative in 2026: PPC Research or Creative Evidence?
A 2026 decision framework for choosing a Semrush ad intelligence alternative — when PPC keyword and spend research wins, when competitor creative and video evidence wins, how AdClarity fits, a fair-trial method, and how to build a two-layer stack.
Moat Alternative in 2026: Ad Verification vs. Creative Intelligence
A complete 2026 buyer's guide to choosing a Moat alternative — why teams look past Oracle Moat, what Moat actually does (viewability, invalid traffic, brand safety), the critical split between the ad-verification layer and the creative-intelligence layer, a layered comparison across coverage and fit, who should choose which, a practical migration plan, the honest limits of public creative data, and where a creative-research tool like AdMapix fits.
Pathmatics Alternative in 2026: Ad Spend Intelligence vs. Creative Workflow
A complete 2026 buyer's guide to choosing a Pathmatics alternative — why teams look past Pathmatics (now Sensor Tower), what it actually measures, a layered comparison of spend-intelligence suites versus creative-workflow tools across coverage, data type, price, and fit, who should choose which, a practical migration plan, the honest limits of estimated spend, and where a lighter cross-network creative tool like AdMapix fits.