Mobile Ad Market by Region 2026: APAC vs US vs EU Spending, Formats, and Trends
A data-driven breakdown of the 2026 mobile ad market across North America, Europe, APAC, Latin America, and the Middle East & Africa — covering regional ad spend, format dominance, CPM economics, platform mix, and the regulatory shifts that now force separate media plans per region instead of one global strategy.
By the AdMapix Research Team — Updated June 21, 2026
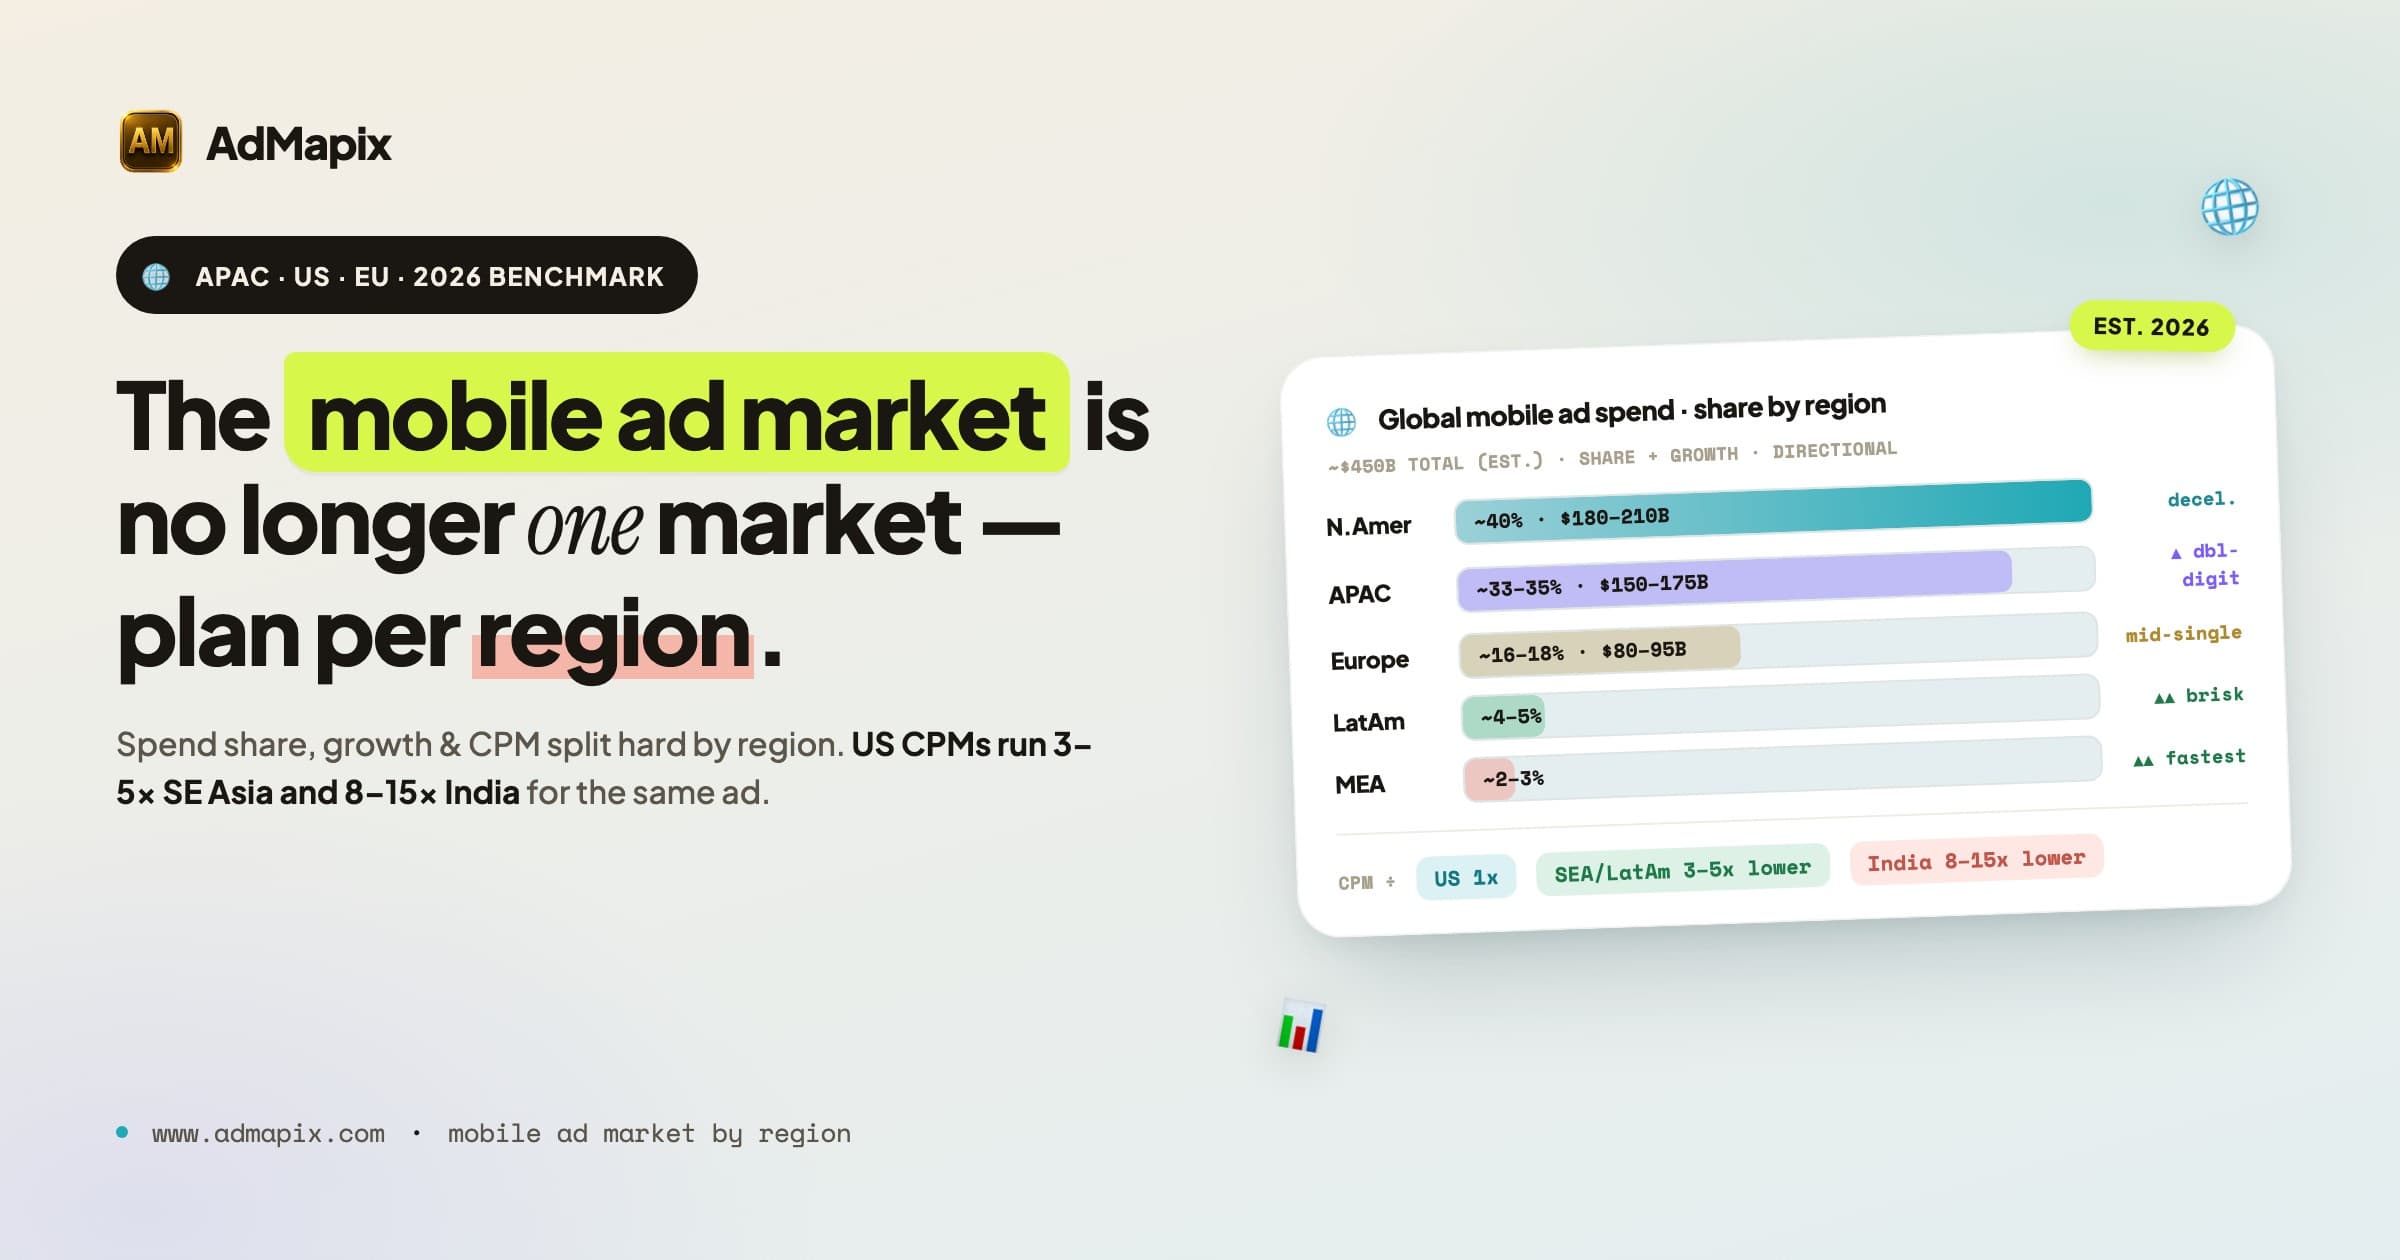
The mobile ad market is no longer one market. In 2024 and 2025, a single global media plan — same platforms, same creative formats, same targeting logic, lightly localized at the edges — could still produce acceptable results across the US, Western Europe, and the more developed parts of APAC. In 2026 that approach is breaking down. Regulatory regimes are diverging faster than at any point in the last decade, platform availability is being shaped by politics rather than product, and the gap between a saturated short-form-video market and one still absorbing the format has widened into a chasm. This article breaks the 2026 mobile ad market down by region — North America, Europe, APAC, Latin America, and the Middle East & Africa — on the five dimensions that actually move a media plan: spend volume, format dominance, CPM economics, platform mix, and regulatory constraint.
We track competitor ad creatives across channels and regions for a living, and the single most consistent pattern we see is teams treating "global" as a setting in an ad account rather than a strategy. They duplicate a US campaign into ten countries, watch the blended CPA stay flat, and conclude the channel is "tapped out." It isn't. The campaign is averaging a high-CPM, high-LTV market against a low-CPM, low-LTV one and reporting the mean as if it were a finding. The teams that win across regions in 2026 don't have the biggest budgets — they have the clearest map of where each dollar behaves differently. This is that map.
TL;DR — The 2026 Regional Mobile Ad Market in One Screen
- There is no global mobile ad strategy in 2026. There are regional strategies that share a brand and diverge on platform, format, CPM economics, and compliance. Plan per region or accept blended averages that hide both your best and worst markets.
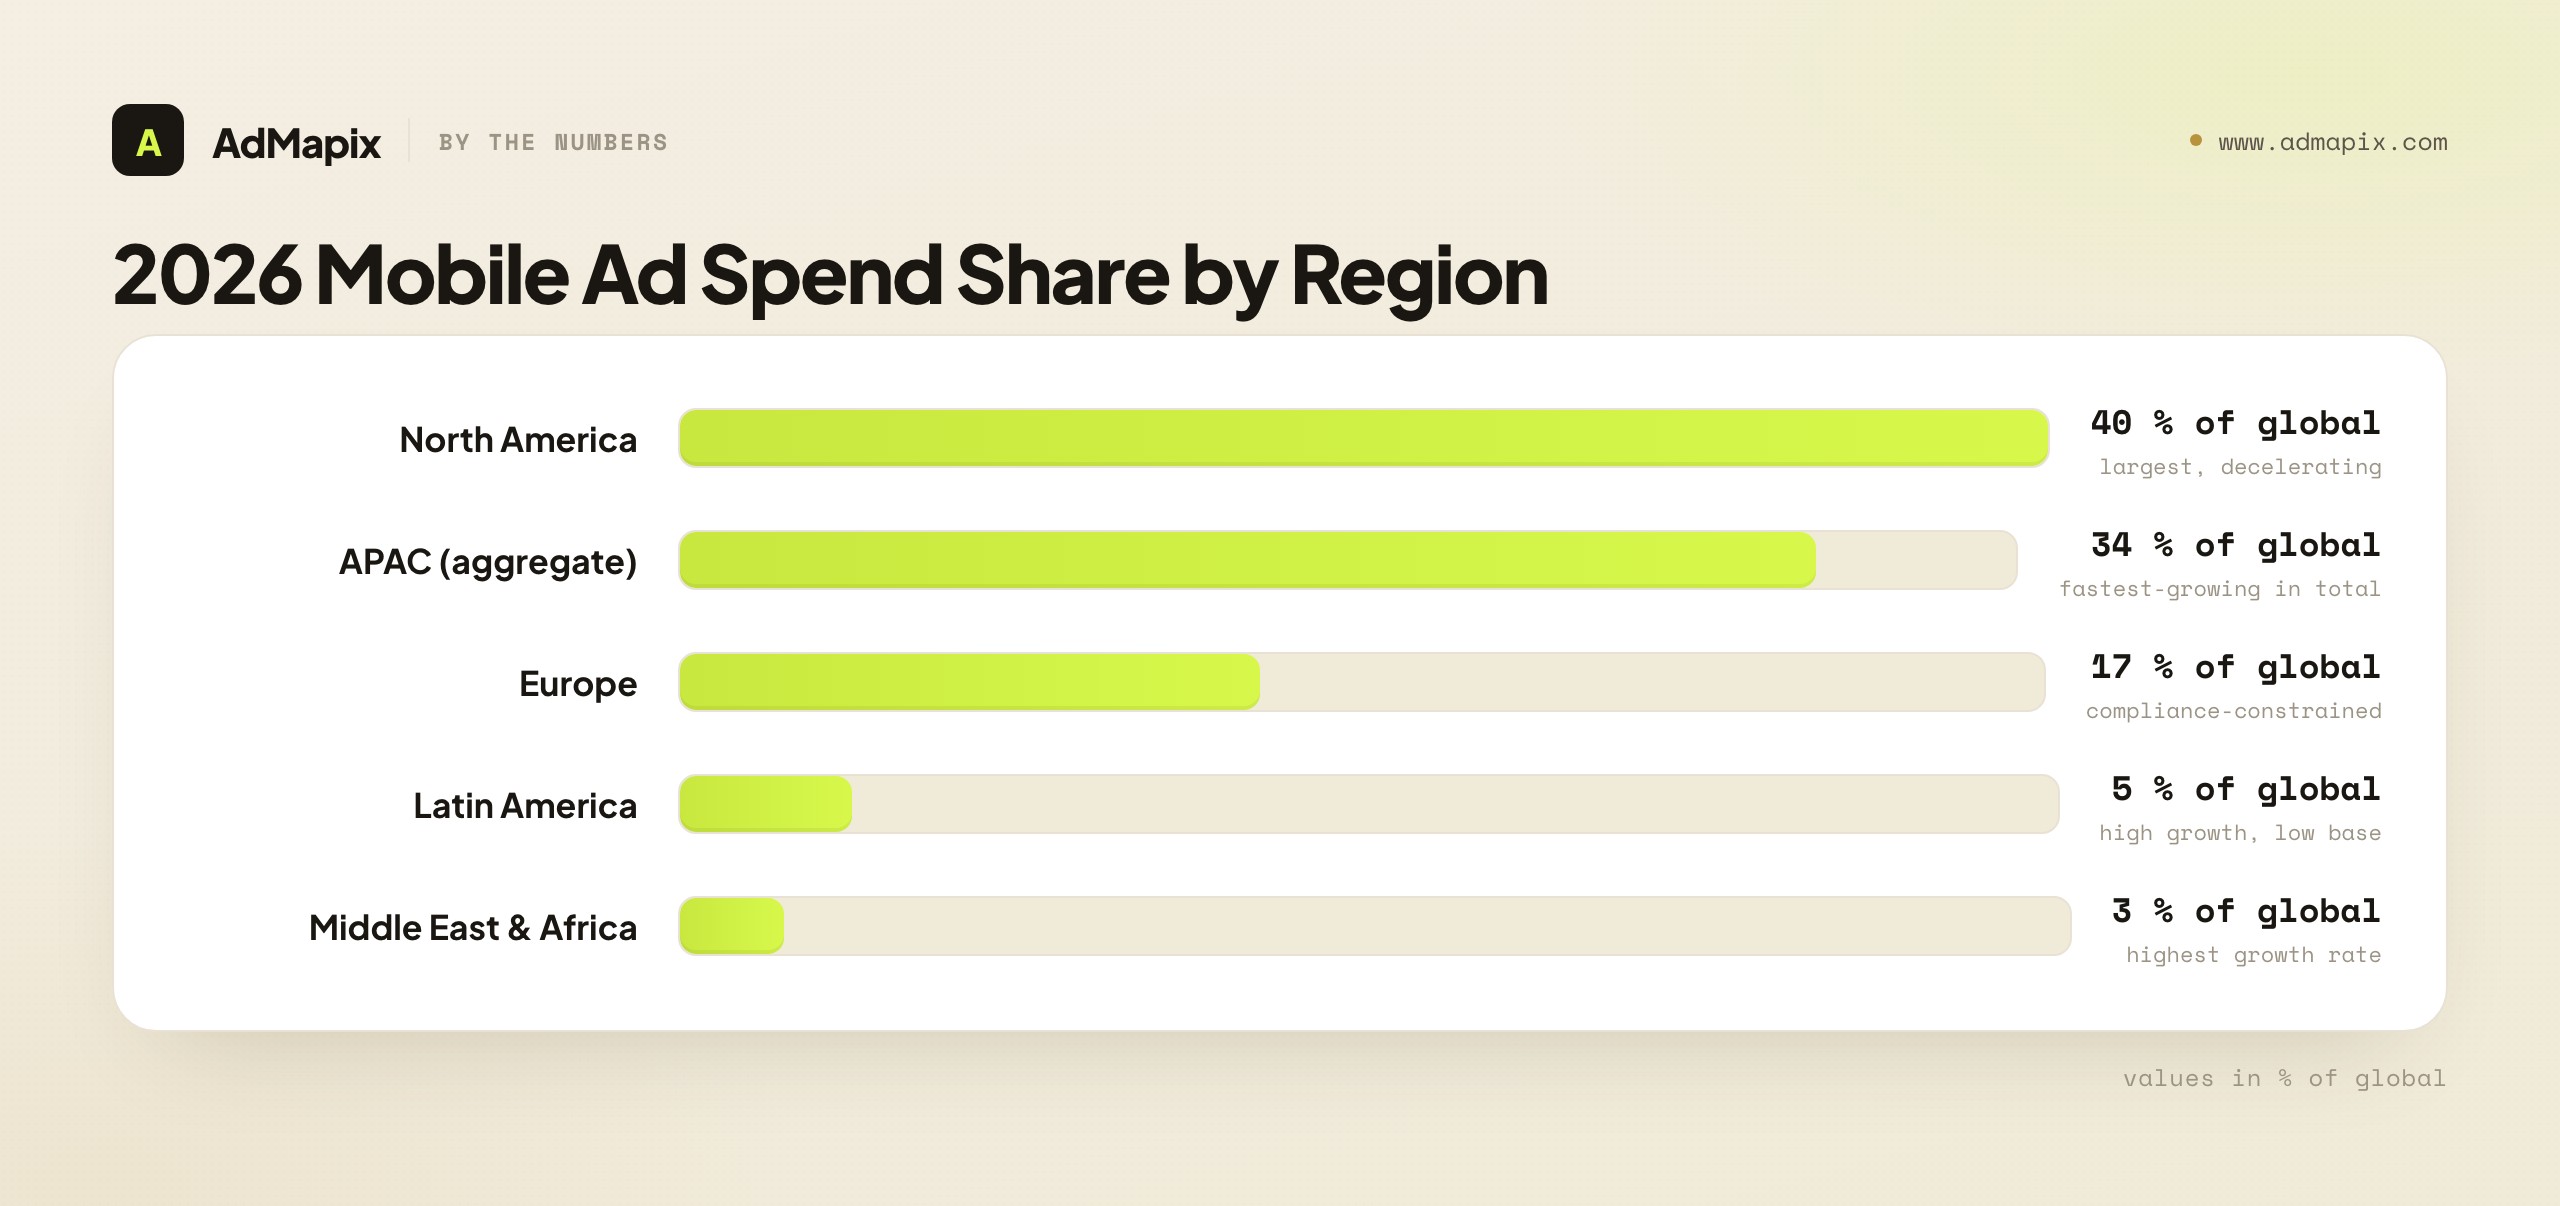
- North America still commands roughly 40% of global mobile ad spend but growth is decelerating into the high single digits as budgets rotate from the Meta–Google duopoly toward TikTok, Amazon Ads, and retail media networks.
- APAC is the largest and fastest-growing region in aggregate (~35% and double-digit growth) — but it is not a single market. China is a closed ecosystem, India is mobile-first and price-sensitive, Japan and Korea behave like compliance-heavy Tier 1 markets, and Southeast Asia is the closest thing to a true growth frontier.
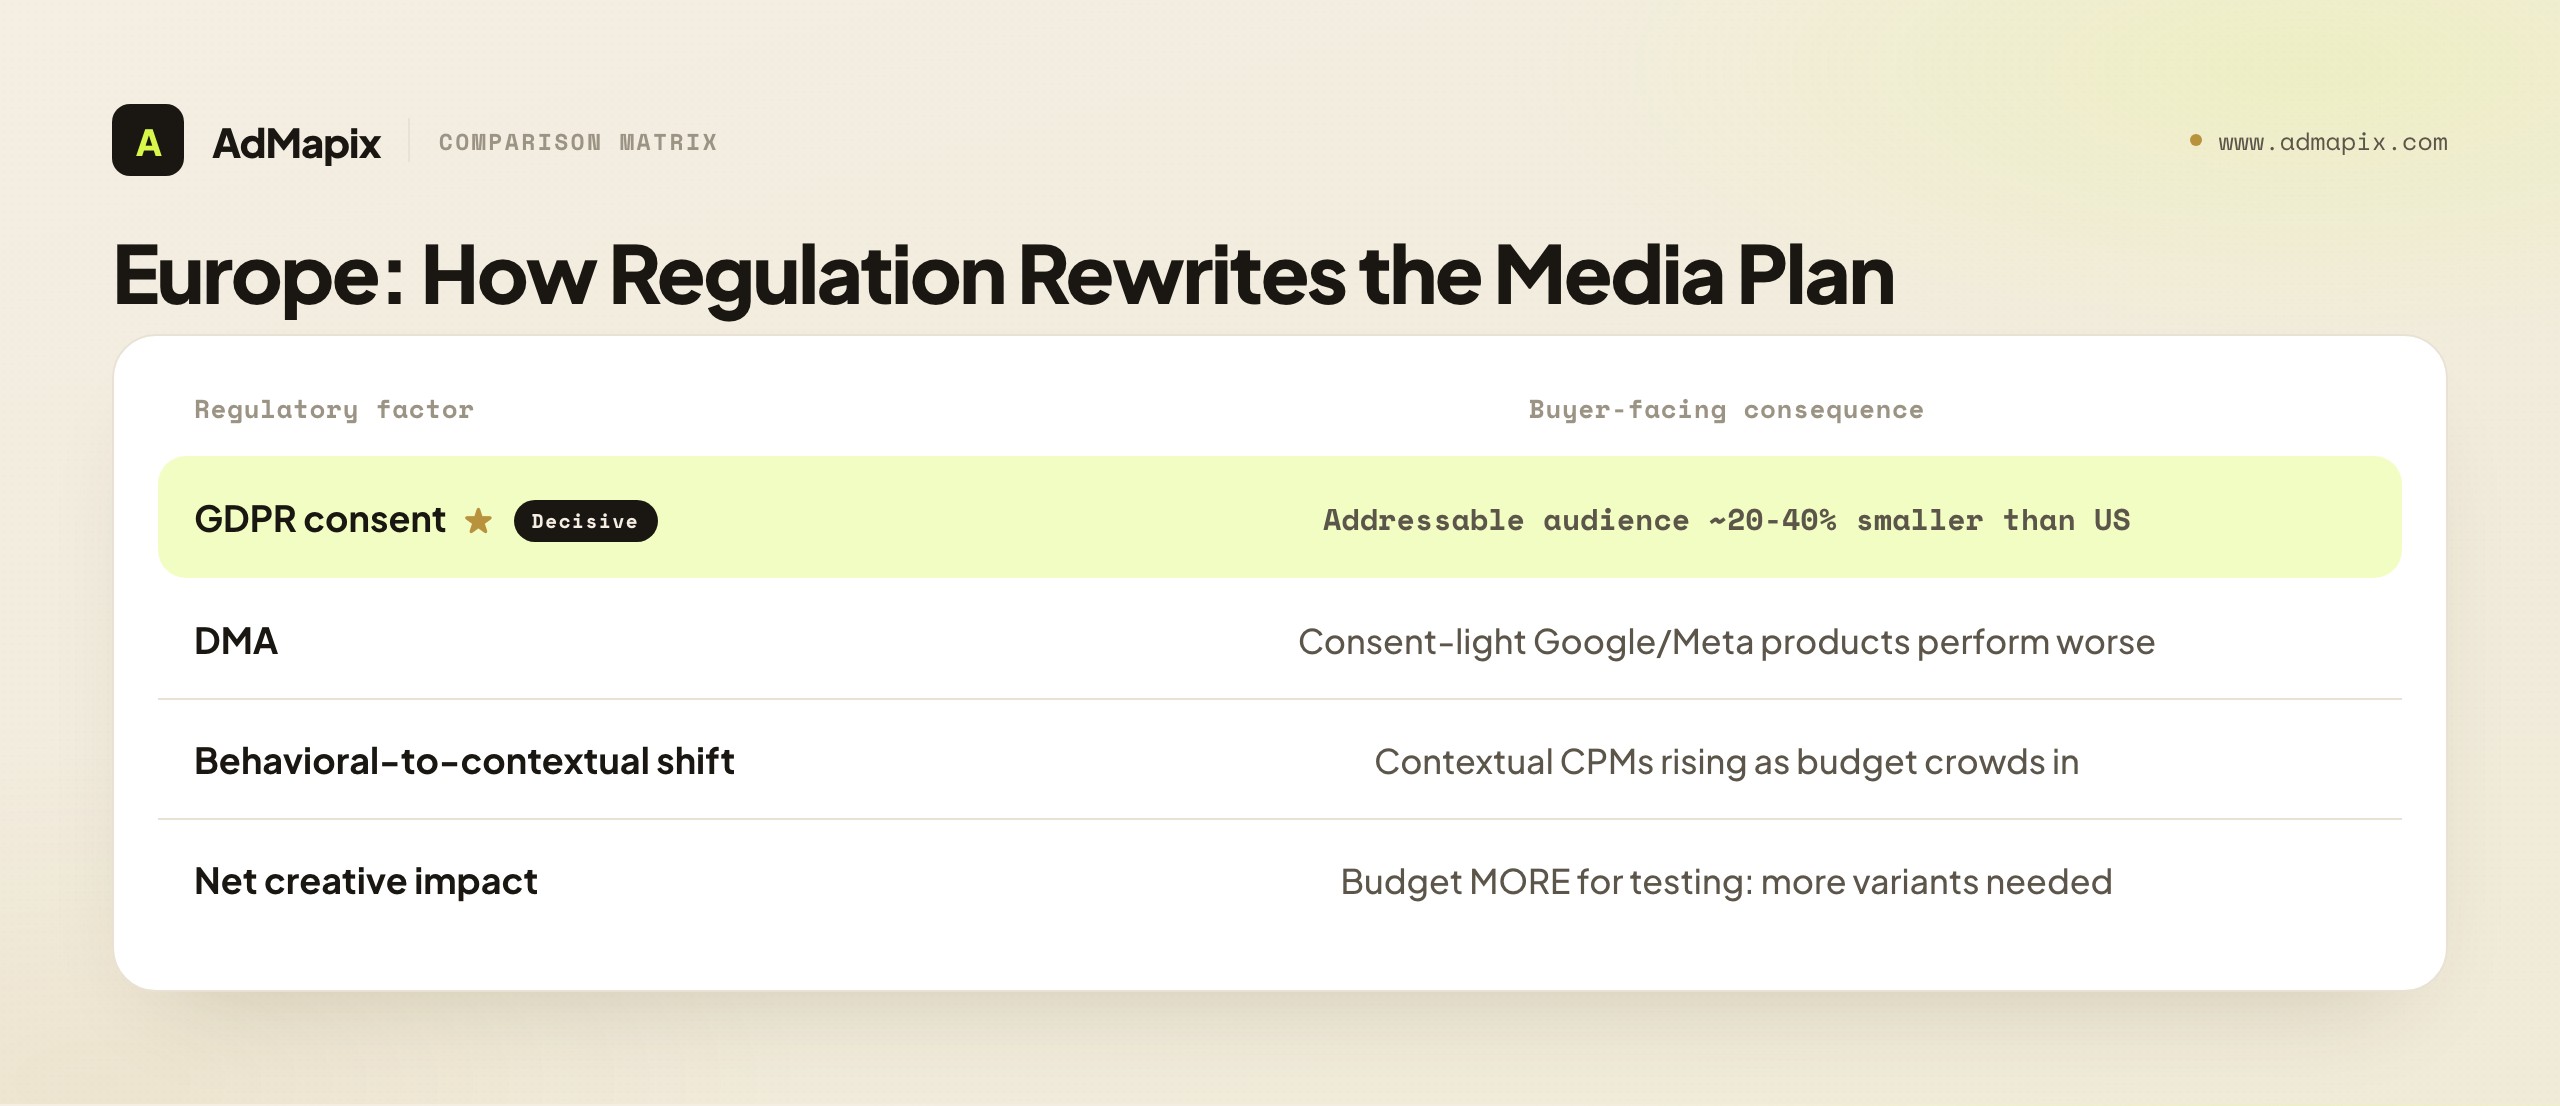
- Europe's growth is constrained by compliance, not demand. DMA, DSA, and GDPR enforcement push budgets toward contextual targeting and shrink addressable audiences by an estimated 20–40% versus US benchmarks.
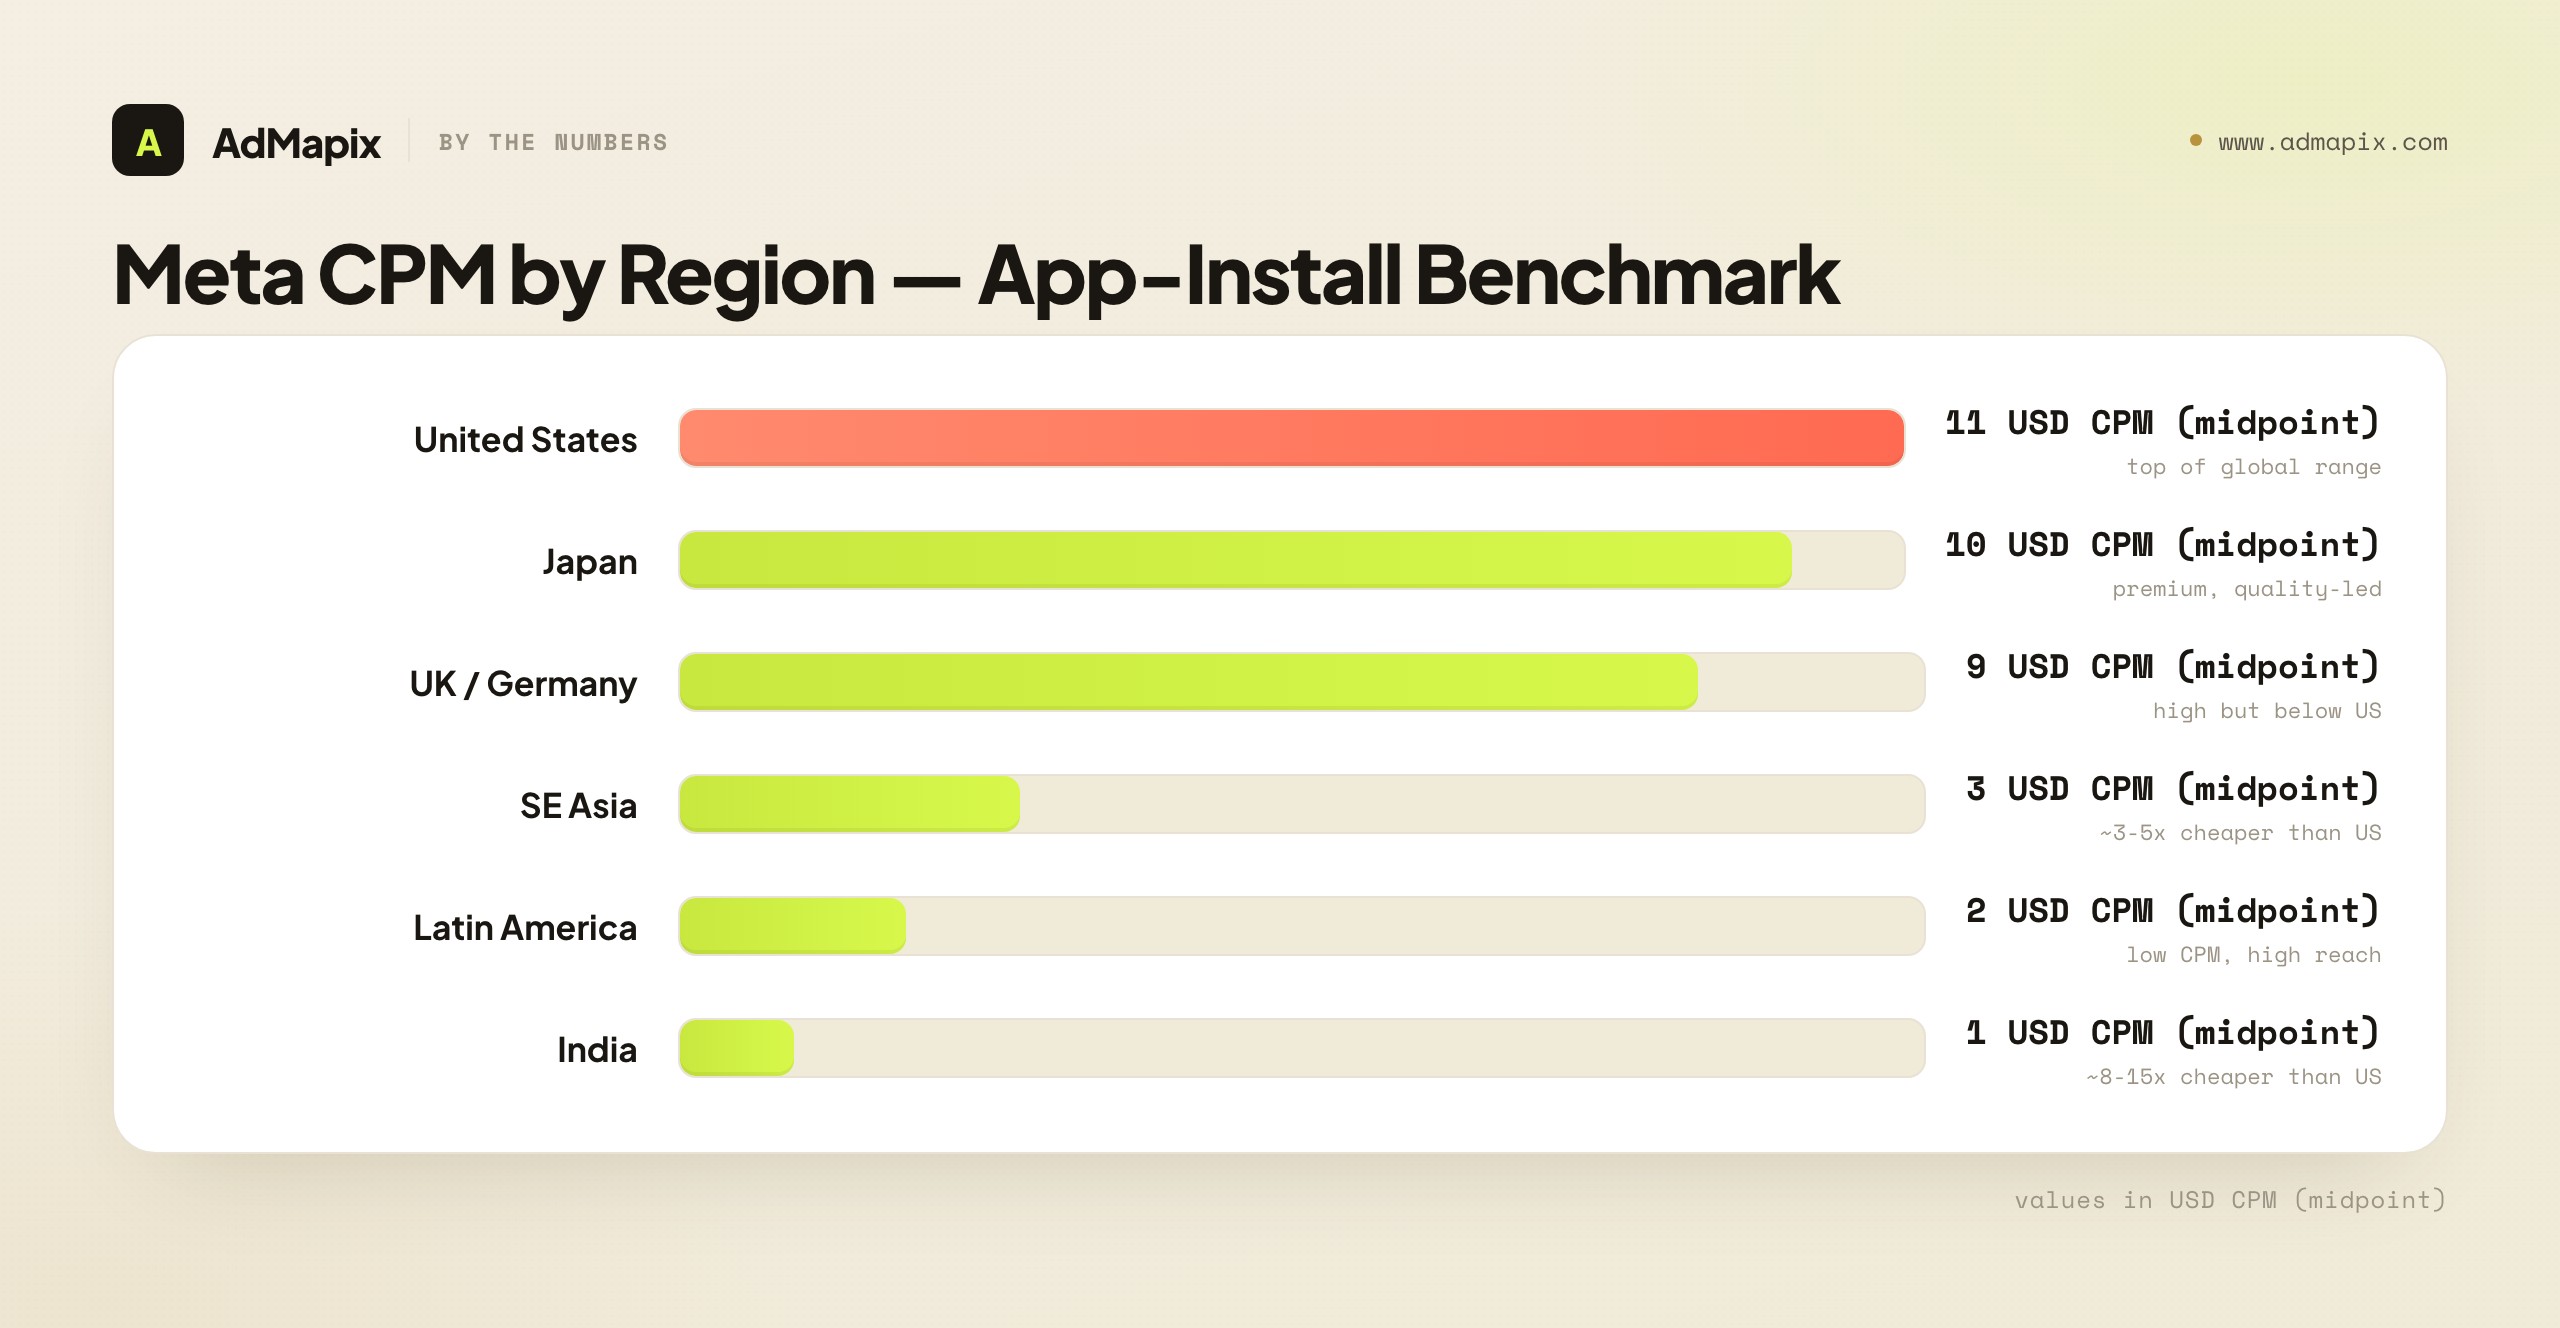
- CPMs vary more by region than by platform. US CPMs run roughly 3–5x Southeast Asian and 8–15x Indian CPMs for the same platform and format, which makes regional diversification an efficiency play, not just a growth one.
- Format maturity is regional. Short-form video is the closest thing to a universal format, but playable ads remain a US and China phenomenon, livestream commerce is mature only in China and Southeast Asia, and static image still earns its keep in Eastern Europe and price-sensitive markets.
- Competitive creative intelligence is the cross-region equalizer. A rival's US creative playbook is usually nothing like its APAC one — tracking both reveals the full strategy, which is where AdMapix fits in.
Why Regional Mobile Ad Market Analysis Matters in 2026
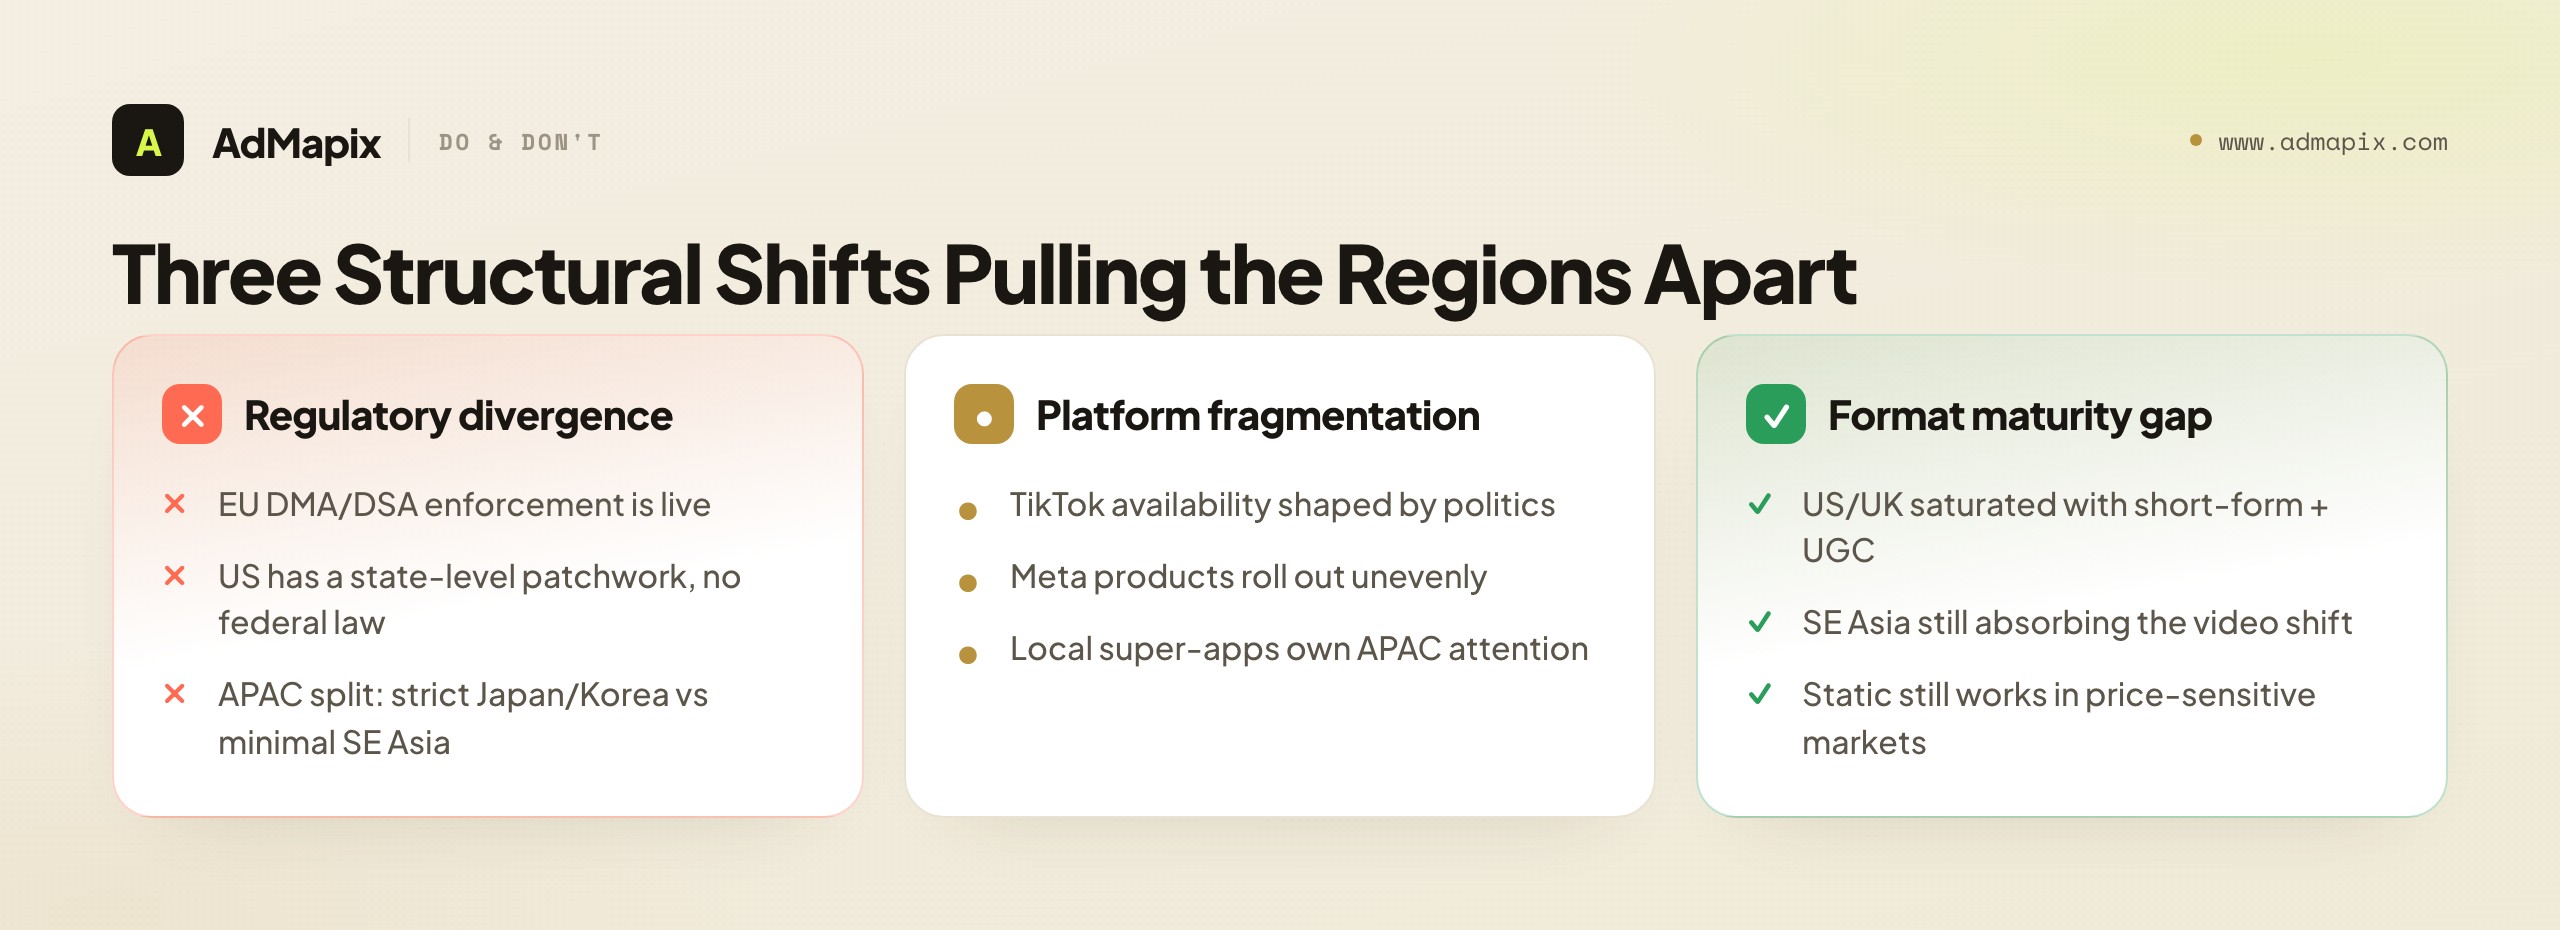
For most of the post-2020 era, "global media buying" was a defensible simplification. The major platforms — Meta, Google, and later TikTok — had near-universal reach, the iOS privacy changes hit every market at once, and creative trends propagated globally within a quarter. You could centralize strategy, localize language, and call it a regional plan. In 2026, three structural shifts have pulled the regions apart far enough that the simplification now costs money.
The first shift is regulatory divergence. The EU's Digital Markets Act and Digital Services Act are no longer prospective — enforcement is live, and it is reshaping how ads can be targeted, measured, and attributed inside the bloc. The US, by contrast, still has no federal privacy law as of early 2026, only a patchwork of state regimes that vary in scope and enforcement intensity. APAC is split down the middle: Japan and South Korea operate GDPR-comparable regimes, while much of Southeast Asia runs with minimal restriction. A targeting strategy that is standard practice in Jakarta can be non-compliant in Frankfurt and merely risky in California.
The second shift is platform fragmentation driven by politics, not product. TikTok's availability and regulatory standing now vary by political climate rather than by where the product is ready to ship. Meta's newer ad products roll out unevenly across markets for reasons that have nothing to do with demand. And in large swaths of APAC, local super-apps — WeChat, LINE, KakaoTalk, Naver, Kakao — own the attention that a "global" Meta-Google-TikTok setup never even bids on.
The third shift is a widening format-maturity gap. US and UK feeds are saturated with short-form video and UGC; the marginal creative there has to clear a very high bar. Several Southeast Asian markets are still in the middle of the short-form transition, where a competently produced video ad still feels novel. Parts of Europe continue to reward static and editorial-style formats that would underperform badly in a US auction. The same creative brief produces different outcomes depending on which feed it lands in.
Put together, these shifts mean the unit of planning has changed. In 2024 the unit was "global, localized." In 2026 it is "regional, with a shared brand." The rest of this article works through what that looks like region by region.
Mobile Ad Spend by Region: The Numbers That Matter
Global mobile ad spend crossed an estimated $400 billion in 2025 and is on track for $450 billion or more in 2026 on industry-benchmark trajectories. But the headline number is the least useful figure in the entire market, because the growth is anything but evenly distributed. The interesting question is not how big the pie is — it is which slices are growing, which are maturing, and which are constrained.
Use the figures below as order-of-magnitude estimates and directional shares rather than precise audited totals; the analyst houses disagree on exact numbers, but the relative magnitudes and growth directions are consistent across sources.
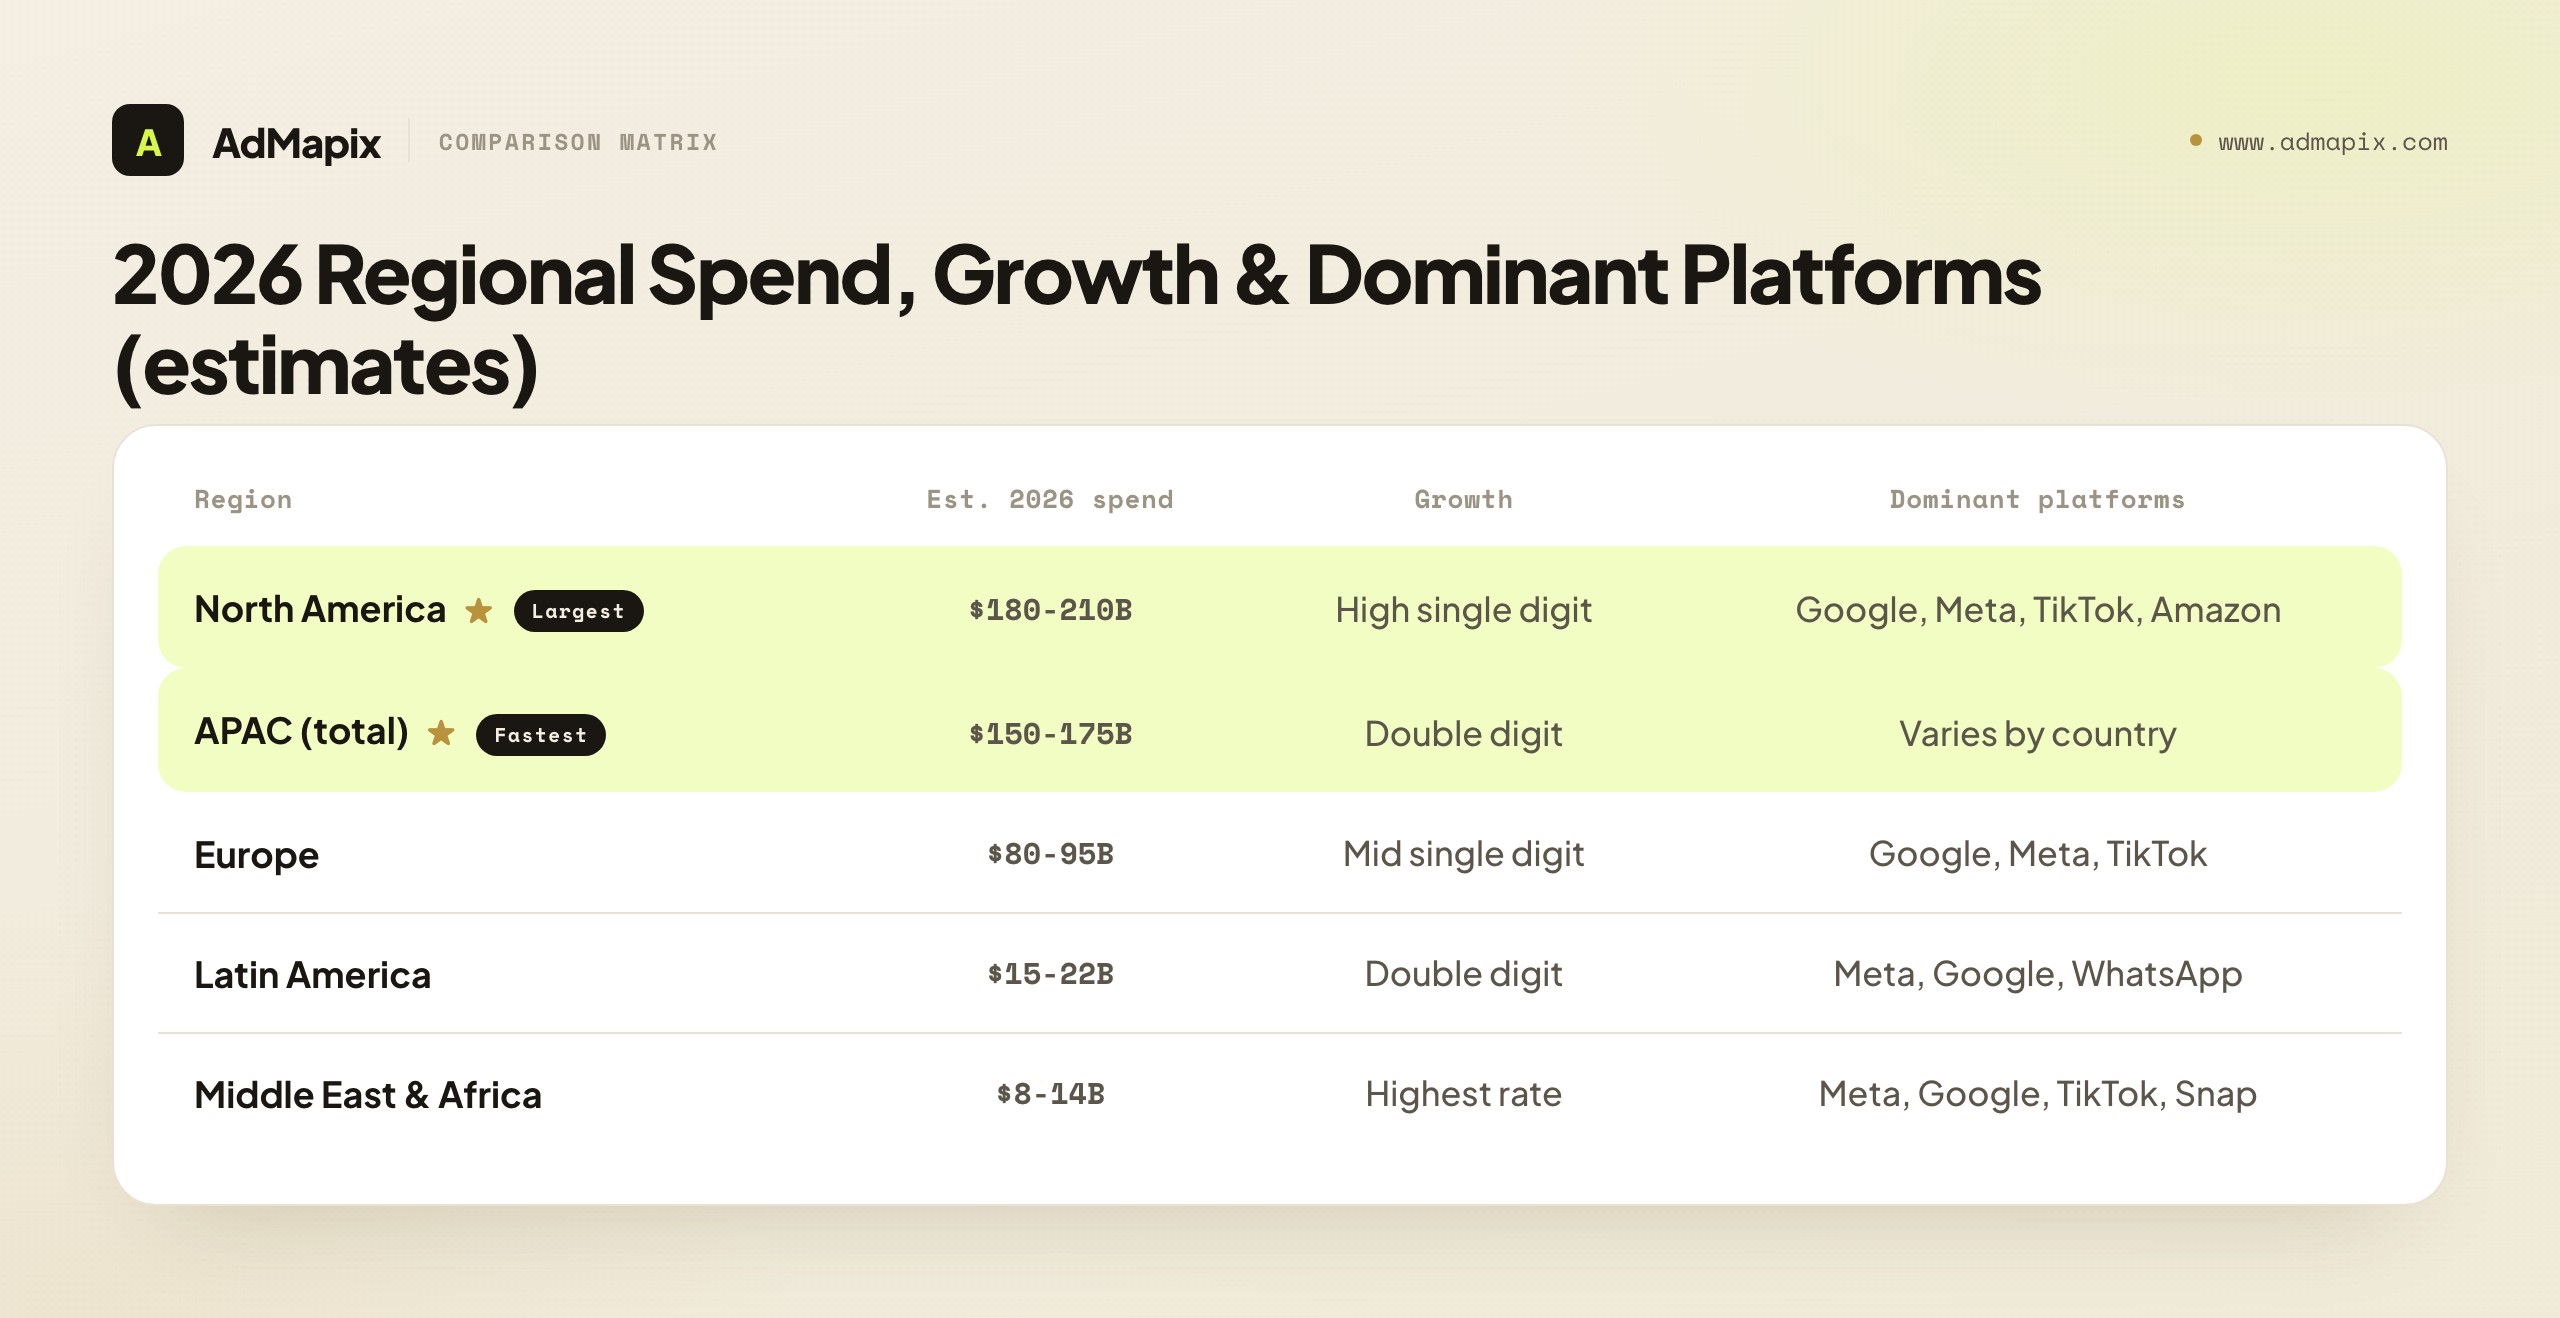
North America (roughly 40% of global mobile ad spend). Estimated 2026 mobile ad spend in the region sits in the $180–210 billion range, growing at a high-single-digit to low-double-digit pace — a meaningful deceleration from the low-teens growth of 2023–2024. The dominant platforms remain Google (search plus YouTube), Meta (Facebook plus Instagram), TikTok, and Amazon. The defining dynamic is rotation: incremental spend is shifting out of the mature Meta–Google base and into TikTok, Amazon Ads, and the rapidly expanding universe of retail media networks. North America is where budgets are largest and audiences most contested, which keeps it the highest-CPM region in the world.
Europe (roughly 16–18% of global). Estimated 2026 spend lands in the $80–95 billion range, with growth in the mid-single digits — the slowest of any major region, and slow primarily because of compliance drag rather than weak demand. Google and Meta dominate; TikTok is growing but operating into persistent regulatory headwinds. The key dynamic is the forced migration from behavioral to contextual targeting under GDPR and DMA pressure, which is simultaneously raising CPMs for high-quality contextual inventory and shrinking the addressable behavioral audience.
APAC (roughly 33–35% of global, and the most internally fragmented region on earth). Estimated 2026 spend is in the $150–175 billion range, growing at a double-digit pace that makes it the fastest-growing region in aggregate. But "APAC growth" is a misleading aggregate. The growth is concentrated in Southeast Asia and India; China is a large but separate ecosystem with its own platforms and rules; and Japan and South Korea are mature, slow-growing, compliance-heavy markets that have more in common with Western Europe than with their geographic neighbors.
Latin America (roughly 4–5% of global, with outsized growth). Estimated 2026 spend is in the $15–22 billion range, growing at a brisk double-digit clip off a smaller base. Brazil and Mexico dominate the region's spend; Meta and Google are the primary platforms, with TikTok growing aggressively and WhatsApp serving as a uniquely central commerce and messaging surface. CPMs are low, mobile penetration is high, and creative localization (especially Brazilian Portuguese versus Spanish) matters more than buyers expect.
Middle East & Africa (roughly 2–3% of global, highest growth rate, lowest base). Estimated 2026 spend is in the $8–14 billion range. The Gulf states (UAE, Saudi Arabia) skew toward premium, high-CPM inventory and brand spend, while Sub-Saharan Africa is a high-growth, low-CPM, mobile-and-data-cost-sensitive market where lightweight formats and Android-first targeting dominate.
The practical reading of these numbers: North America and APAC together are roughly three-quarters of the global mobile ad market, but they are mirror images. North America is large, mature, expensive, and decelerating. APAC is large, young, cheap on average, and accelerating — but only if you can navigate its internal fragmentation. Europe is the compliance-bound middle. Latin America and MEA are the high-growth frontiers where today's spend is small but the trajectory is steep.
North America: The Mature, High-CPM Anchor
North America — overwhelmingly the United States, with Canada as a smaller, structurally similar adjunct — is the market every other region gets benchmarked against, and for good reason. It is the largest by spend, the most platform-consolidated among the open markets, and the most permissive among developed economies on targeting. If you only learn one region's economics deeply, learn this one, because it sets the reference points for everything else.
Spend and growth. The region's growth is decelerating, but from a very high base, so absolute dollar growth remains enormous. The story underneath the slowing top-line is rotation rather than contraction. Retail media networks — Amazon Ads first, then Walmart Connect, Instacart, and a long tail of retailer-owned inventory — are absorbing budget that used to flow to the Meta–Google duopoly. TikTok continues to take share of attention and spend despite recurring political uncertainty. The net effect is that "where the spend is going" inside North America is a more interesting question than "how fast it's growing."
Format landscape. North America is the most format-saturated market in the world. Short-form video and UGC-style creative are not differentiators here — they are table stakes, and the creative-fatigue cycle is brutal, with effective ad lifespans on Meta frequently measured in single-digit days. Playable and interactive ads are a genuine North American strength, especially for gaming and apps, in a way that has no parallel in most of Europe. The implication for creative teams is uncomfortable but clear: you need more variants, refreshed faster, than in any other region.
Platform mix. This is a Google–Meta–TikTok–Amazon market, with retail media as the rising fifth force. Unlike APAC, there is no meaningful "local platform" layer to discover — the consolidation is the point. That consolidation makes North America operationally simple (a handful of ad accounts cover most of the reach) but financially demanding (everyone is bidding into the same auctions, which is why CPMs sit at the top of the global range).
Regulatory reality. North America remains the most permissive major market for ad targeting, and this is a strategic asset that should be exploited deliberately while it lasts. The US operates a state-level patchwork — California's CPRA, plus active regimes in Virginia, Colorado, Connecticut, and a growing list of others — but enforcement is inconsistent and there is no federal privacy law as of early 2026. The one structural risk worth a contingency plan is TikTok's ongoing political uncertainty; teams with material TikTok spend should know in advance where that budget reallocates if availability changes.
Europe: Compliance-Bound, Contextual-First
Europe is the region where demand is healthy but the operating environment is the most constrained, and understanding it requires separating Western from Eastern Europe, which behave quite differently despite sharing a regulatory umbrella.
Spend and growth. Europe's mid-single-digit growth is the slowest among major regions, and the cause is compliance overhead rather than soft demand. The DMA and DSA compliance burden raises the cost of operating in the bloc, and GDPR consent requirements structurally shrink addressable audiences. Western Europe — the UK, Germany, France, the Nordics — carries the bulk of the spend and the highest CPMs. Eastern Europe (Poland, Romania, the Baltics, and beyond) runs at materially lower CPMs and, notably, still rewards static and lower-production-cost formats that have largely aged out in the West.
Format landscape. Western Europe is short-form-video-forward but not as saturated as North America, leaving more headroom for competently produced video to perform. Eastern Europe is where static image creative remains genuinely viable — video production economics don't always pencil out against the lower CPMs, and audiences are less fatigued on static. Playable ads are niche-to-rare across most of Europe outside specific gaming pockets, and livestream commerce barely registers. UGC is growing but on a delay relative to the US.
Platform mix. Europe is a Google–Meta market with TikTok as a growing-but-headwind-facing third. There is no local-super-app layer comparable to APAC's; the European wildcard is regulatory rather than platform-based. The platforms themselves are the same as North America's — what changes is what you're allowed to do with them.
Regulatory reality — the decisive dimension. This is the region where regulation directly rewrites the media plan. Consent requirements are the strictest globally, which is why addressable audiences run an estimated 20–40% smaller than equivalent US audiences. The DMA forces Google and Meta to offer consent-light ad products that simply perform worse than their behavioral counterparts. The fastest-growing alternative is contextual targeting, and CPMs for quality contextual inventory are rising as budget crowds into it. The strategic consequence for creative teams: budget more for creative testing in Europe, not less. With smaller addressable audiences and weaker behavioral signal, you need more creative variants and broader targeting to hit the same performance — the creative does work the algorithm used to do.
APAC: Five Markets Wearing One Name
APAC is the region most likely to wreck a "global" media plan, because the word "APAC" in an ad account implies a coherence that does not exist on the ground. It is more accurate to think of it as five distinct markets that happen to share a continent: China, India, Japan, South Korea, and Southeast Asia. Each has different platforms, different economics, and different rules.
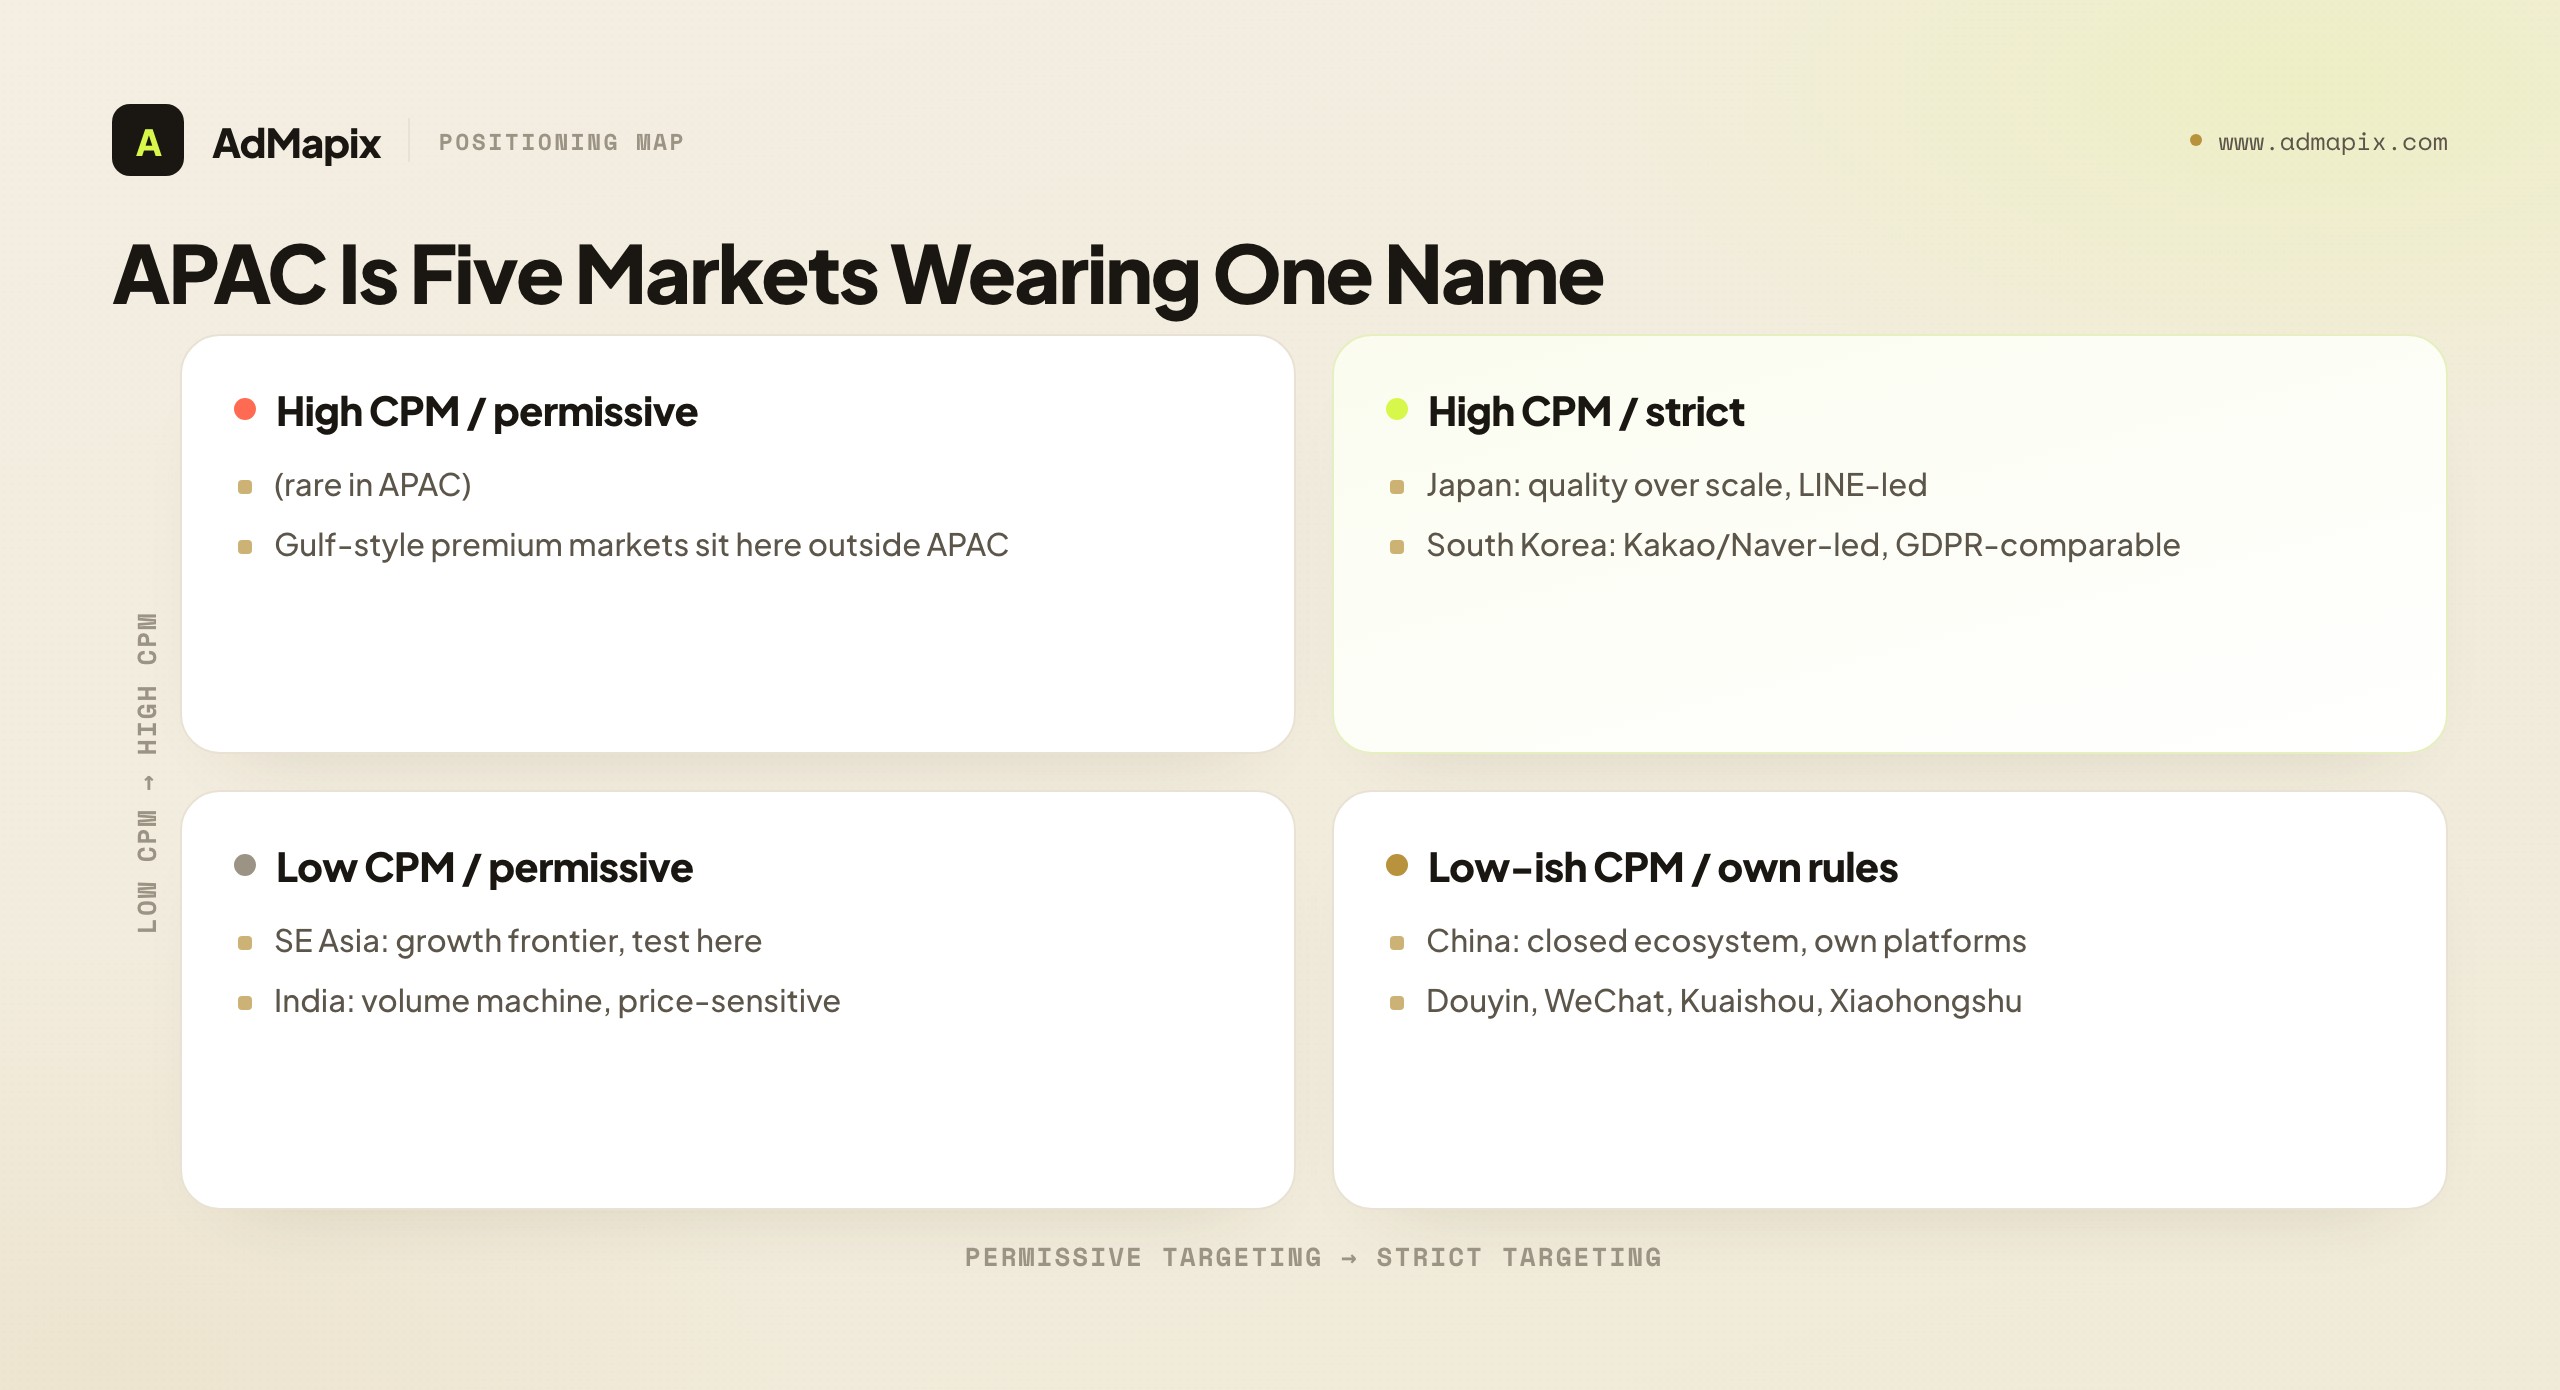
China — the closed ecosystem. China is effectively a separate internet. The dominant ad platforms are ByteDance (Douyin and Toutiao), Tencent (WeChat), Kuaishou, and a supporting cast including Baidu and Xiaohongshu. None of the "global" platforms in your account reach the Chinese mainland market in any meaningful way. China is also the most format-mature market in the world for several formats: livestream commerce, KOL-driven UGC, and playable/interactive ads are all mature here, often ahead of the US. If China is a target market, it is a wholly separate operation requiring local entities, local platforms, and local creative norms — not a line item in a global plan.
India — mobile-first and price-sensitive. India is the highest-volume, lowest-CPM major market on earth. Meta and Google (with YouTube) lead, with a vibrant local layer including ShareChat and Moj. The economics are extreme: CPMs an estimated order of magnitude below US benchmarks, which makes India a volume machine and a testing ground, but with correspondingly lower purchasing power per acquired user. The metric that matters in India is never CPM — it is CPA relative to a realistic, India-specific LTV. India's data protection law exists on the books but implementation has been slow, so the targeting environment remains relatively permissive in practice.
Japan — quality over scale. Japan behaves like a Tier 1 Western market wearing an APAC label: GDPR-comparable privacy expectations, high CPMs, and an audience that prizes production quality and polish over raw volume. The platform mix is distinctive — Google leads, Meta is strong, but LINE is a primary acquisition channel that a global setup simply omits, and Twitter/X is unusually strong relative to other markets. Japan is also exceptional for mobile gaming revenue, which is why it is a must-win market for game studios despite its compliance overhead.
South Korea — local platforms first. South Korea pairs strict, GDPR-comparable privacy with a platform landscape dominated by local players. KakaoTalk and Naver are central acquisition surfaces that have no analog in a global Meta-Google-TikTok plan. Google and Meta participate, but a Korea strategy that ignores Kakao and Naver is missing the primary channels. Like Japan, Korea is a mature, high-quality, slow-growing market that should be treated like Western Europe for both compliance and creative-quality expectations.
Southeast Asia — the growth frontier. Indonesia, Thailand, the Philippines, Vietnam, and Malaysia together form the closest thing to a genuine growth market for mobile ads in 2026. CPMs are low (an estimated 3–5x below US), regulation is minimal, mobile penetration is high, and the short-form-video transition is still in progress — which means creative that feels stale in the US can feel fresh here. Meta leads across most of the region, with TikTok a strong and fast-growing second and Google third. Local commerce platforms (Shopee, and increasingly TikTok Shop) matter, and LINE is significant in Thailand. Southeast Asia is the ideal place to validate creative cheaply before scaling winners into expensive Tier 1 markets.
The unifying lesson: do not run "APAC" as a region. Pick your top two or three APAC markets, treat each as its own plan with its own platform shortlist, and resist the temptation to bid the same global setup across all of them.
Latin America: High Growth, Low CPM, WhatsApp at the Center
Latin America is the region most likely to be underweighted in a US-centric media plan and most likely to reward attention. Brazil and Mexico together dominate regional spend, with Argentina, Colombia, and Chile forming a meaningful second tier.
Spend and growth. LatAm is growing at a brisk double-digit pace off a relatively small base. Mobile penetration is high, smartphones are the primary internet device for most users, and the audience is young — a structurally favorable demographic for app and mobile-commerce advertising.
Format and platform landscape. Meta is the anchor platform across the region, with Google strong and TikTok growing aggressively. The genuinely distinctive feature of LatAm is the centrality of WhatsApp — not just as a messaging app but as a commerce, support, and conversational-marketing surface that is woven into the buying journey far more deeply than in North America. Click-to-WhatsApp ad flows and conversational commerce are not edge cases here; they are mainstream. Short-form video performs well, and creative localization carries unusual weight: Brazilian Portuguese is a separate creative track from Latin American Spanish, and treating them as one is a common, costly mistake.
CPM economics. LatAm CPMs are low — well below US and Western Europe, comparable in places to Southeast Asia — which makes the region an efficient source of installs and reach. As with India and Southeast Asia, the discipline is to optimize CPA against a region-appropriate LTV rather than chasing the low CPM as an end in itself.
Regulatory reality. Brazil's LGPD is a GDPR-influenced framework and the most developed privacy regime in the region, so Brazil sits somewhere between the permissive markets and the strict ones. The rest of the region is generally more permissive, closer to the US patchwork than to the EU model.
Middle East & Africa: Two Markets, Opposite Profiles
MEA is the smallest region by spend but the fastest-growing by rate, and it splits cleanly into two profiles that share almost nothing except a continent boundary.
The Gulf — premium and high-CPM. The UAE and Saudi Arabia anchor a high-income, high-CPM, brand-heavy market. Spend per user is high, premium inventory is in demand, and the audience expectations skew toward polished, often bilingual (Arabic and English) creative. Video performs strongly, and the major global platforms — Meta, Google, TikTok, Snap (which is notably strong in the Gulf) — all participate. This is closer in economics to a Tier 1 Western market than to the rest of the region.
Sub-Saharan Africa — high-growth, low-CPM, data-cost-sensitive. Nigeria, Kenya, South Africa, and a fast-growing set of others form a market defined by extremely low CPMs, Android-first device profiles, and acute sensitivity to data costs. Lightweight formats win — heavy video burns user data and loses audiences, so static and short, efficiently encoded video outperform. Meta and Google dominate, with TikTok growing fast. This is a market where creative weight and load economics are a targeting variable, not an afterthought.
The MEA lesson mirrors APAC's at smaller scale: do not average the Gulf against Sub-Saharan Africa. They are opposite ends of the CPM and creative-weight spectrum sharing a single regional label.
Format Dominance by Region
What works in one region routinely flops in another, and the format matrix is where that becomes concrete. The table below maps the major mobile ad formats against the regions and sub-regions that matter, so you can see at a glance where a given creative approach is dominant, viable, or a waste of budget.
| Format | US | EU (West) | EU (East) | SE Asia | Japan/Korea | China | LatAm | MEA |
|---|---|---|---|---|---|---|---|---|
| Short-form video | Dominant | Strong | Growing | Growing fast | Strong | Dominant | Strong | Growing |
| Static image | Declining | Still viable | Strong | Strong | Viable | Declining | Viable | Strong |
| Playable / interactive | Growing | Niche | Rare | Niche | Growing | Mature | Niche | Rare |
| UGC-style | Dominant | Growing | Emerging | Growing | Niche | Dominant | Growing | Emerging |
| Livestream commerce | Emerging | Rare | Rare | Growing | Mature | Mature | Emerging | Rare |
| Native / content | Stable | Stable | Stable | Dominant | Stable | Declining | Stable | Stable |
| Click-to-message | Niche | Niche | Niche | Growing | Niche | Mature | Dominant | Growing |
Key takeaways for media buyers:
- Short-form video is the closest thing to a universal format — but execution must be localized. The format travels; the specific hooks, pacing, on-screen text, and casting do not. A US UGC ad re-subtitled for Indonesia underperforms a natively conceived Indonesian one.
- Static image still earns its keep in Eastern Europe, price-sensitive APAC markets, MEA, and anywhere video production economics don't clear the CPM bar. Declaring static "dead" is a US-centric error.
- Playable ads are a US and China phenomenon in 2026. Other markets haven't adopted them at scale, so a playables-heavy strategy is a North America and China play, not a global one.
- UGC means different things in different markets. Polished, almost-broadcast UGC in Japan; raw, phone-shot UGC in the US; KOL-driven UGC in China; creator-led UGC growing in Southeast Asia and LatAm. "Make UGC" is not a portable brief.
- Click-to-message and conversational commerce are LatAm and China strengths (WhatsApp and WeChat respectively) that barely register in North America — a structural channel difference, not a tactical one.
The direction of the format mix, in share terms. The regional matrix above is a snapshot; the underlying motion is a steady, multi-year reallocation of budget share from static and feed-text formats into short-form and interactive video. Directionally, across the open markets, short-form vertical video has been climbing from roughly a quarter of format spend a couple of years ago toward the mid-thirties percent and rising, while static image has slid from around a third toward the low twenties, and classic native/feed text has compressed into single digits. Playable and interactive formats are growing off a smaller base (high single digits toward the mid-teens), concentrated in gaming, fintech, and any category with a demonstrable in-app loop. Treat these as trend directions, not a rate card — the exact percentages diverge by source, vertical, and how each analyst defines a "format" — but the ordering is robust and consistent: video share up, interactive share up, static and plain-native share down. The planning consequence is concrete: a creative pipeline still anchored on static image is fighting a shrinking share pool, and the safest reallocation is a deliberate, staged shift of budget out of static into short-form video for the markets where the audience has already made that transition (the US, Western Europe, China, Japan/Korea) while keeping static alive where it still earns its keep (Eastern Europe, MEA, price-sensitive APAC).
CPM Ranges by Region and Platform
CPMs vary more by region than by platform in 2026 — a fact that should reshape how budgets are allocated. The ranges below are rough, directional benchmarks for mobile app-install campaigns; treat them as order-of-magnitude guides rather than rate cards, because vertical, objective, audience, and season all move them substantially.
| Platform | US | UK/Germany | SE Asia | India | Japan | LatAm |
|---|---|---|---|---|---|---|
| Meta | $8–15 | $6–12 | $2–5 | $0.50–2 | $7–14 | $1.50–4 |
| Google (UAC) | $6–14 | $5–10 | $1–4 | $0.30–1.50 | $6–12 | $1–3 |
| TikTok | $5–12 | $4–9 | $1–4 | $0.40–1.50 | $5–10 | $1–3 |
| Programmatic | $3–8 | $2–6 | $0.50–3 | $0.20–1 | $3–7 | $0.40–2 |
The pattern that survives all the caveats is the regional multiplier: US CPMs run roughly 3–5x Southeast Asian and LatAm CPMs and an estimated 8–15x Indian CPMs for the same platform and format. Verticals shift the absolute numbers — gaming, fintech, and ecommerce all have their own curves, and a purchase objective costs far more than an install objective — but the relative ordering of regions is remarkably stable.
The budget-allocation implication is concrete: a $50,000 monthly budget buys roughly one campaign's worth of reach in the US, or two-to-three campaigns' worth across Southeast Asian and Latin American markets. For teams with fixed budgets, regional diversification is not only a growth strategy — it is an efficiency play that buys more learning and more reach per dollar, provided you hold yourself to CPA-against-LTV discipline rather than chasing low CPMs into low-value audiences.
Platform Mix: It's Not Just Meta and Google
The reflex to set up "global" campaigns on Meta, Google, and TikTok works fine in North America and Europe, where those platforms genuinely are the market. It quietly fails across much of APAC and parts of LatAm, where the primary acquisition channel is a platform that never appears in a default global setup. The table below maps the platform hierarchy in the markets where the local layer matters most.
| Country | #1 Platform | #2 | #3 | Local wildcard |
|---|---|---|---|---|
| China | ByteDance (Douyin/Toutiao) | Tencent (WeChat) | Kuaishou | Baidu, Xiaohongshu |
| Japan | Meta | LINE | Twitter/X (unusually strong) | |
| South Korea | KakaoTalk | Meta | Naver | |
| India | Meta | Google/YouTube | TikTok-successors | ShareChat, Moj |
| Indonesia | Meta | TikTok | Shopee (in-app) | |
| Thailand | Meta | TikTok | LINE | |
| Brazil | Meta | TikTok | WhatsApp (click-to-chat) | |
| Mexico | Meta | TikTok | WhatsApp (click-to-chat) | |
| Saudi/UAE | Meta | TikTok | Snap (Gulf-strong) |
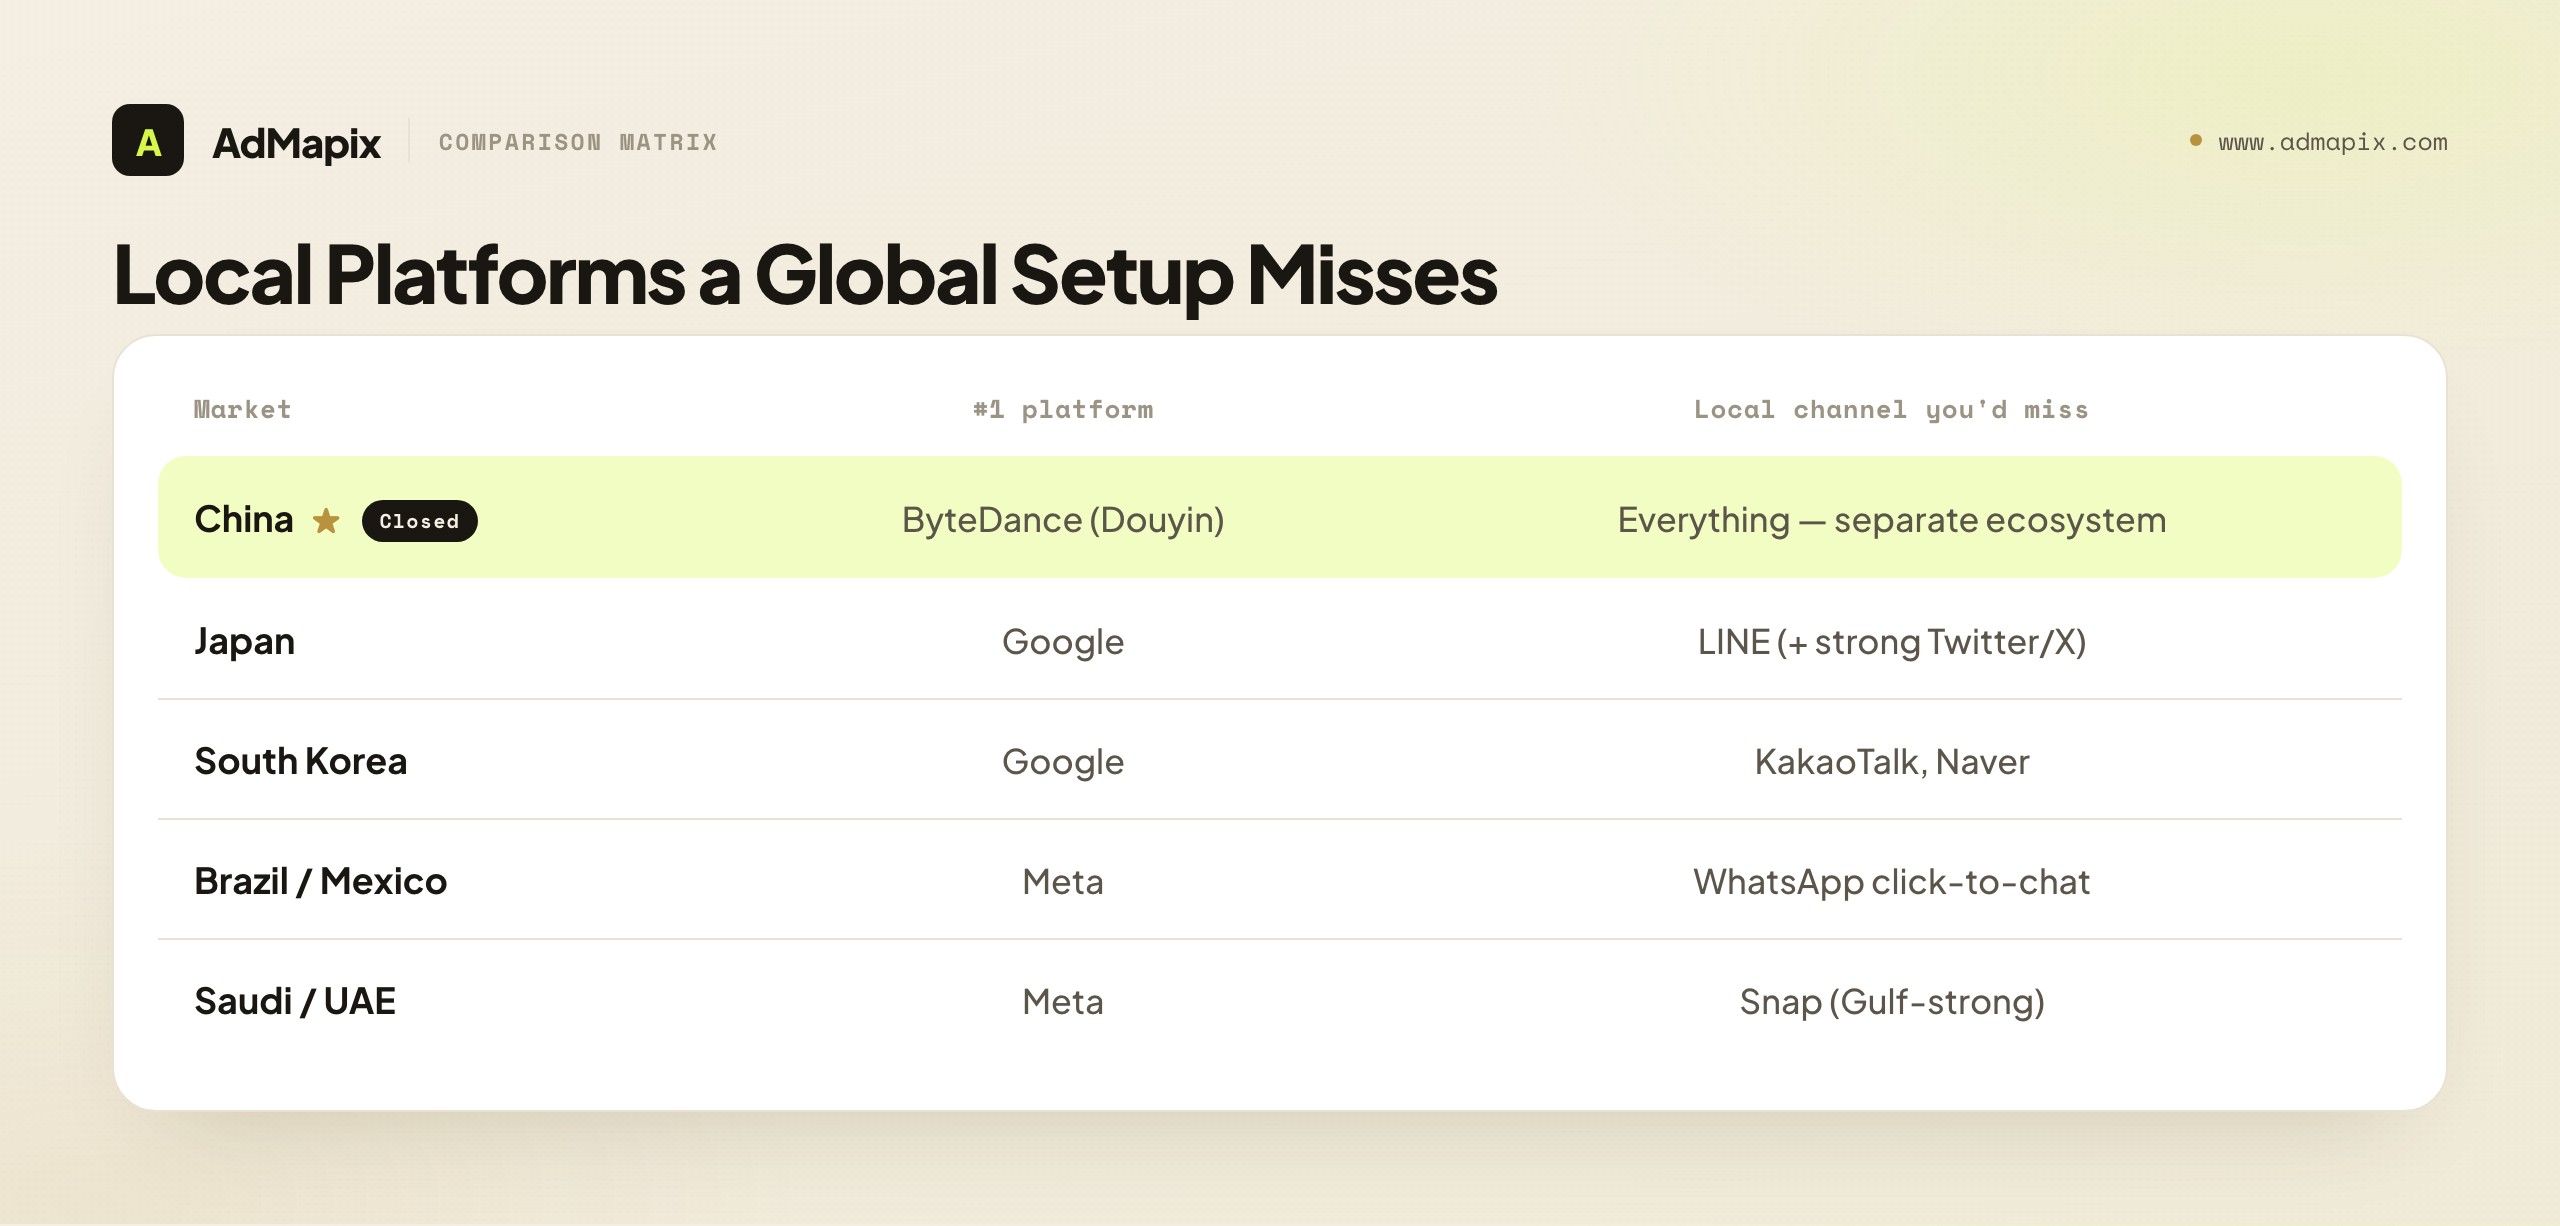
If you run mobile app-install campaigns across APAC with a setup that only includes Meta, Google, and TikTok, you miss the primary acquisition channel in Japan (LINE), South Korea (KakaoTalk and Naver), and China (effectively everything). In LatAm you miss the conversational layer (WhatsApp) that increasingly anchors the buying journey. In the Gulf you underweight Snap, which punches well above its global weight there.
The practical advice is not "run on every local platform" — that path leads to operational sprawl and thin spend everywhere. It is: pick your top two or three non-Western markets, identify the single dominant local platform in each, and run one well-resourced test there before deciding whether to expand. One serious LINE test in Japan teaches you more than ten under-funded campaigns scattered across local platforms you'll never optimize.
Regulatory Landscape: What Media Buyers Actually Need to Know
You don't need to be a privacy lawyer to plan media well, but you do need to internalize the handful of regulatory differences that directly change what you can do in each region. The framing that matters for a buyer is not the legal detail — it is the operational consequence.
Europe (DMA + DSA + GDPR). Consent requirements are the strictest in the world, and the buyer-facing consequence is a smaller addressable audience — an estimated 20–40% below equivalent US reach. The DMA forces Google and Meta to offer consent-light ad products that perform worse than their behavioral equivalents. Contextual targeting is the fastest-growing alternative, and CPMs for quality contextual inventory are rising as a result. The operational takeaway: budget more for creative testing in Europe, because with weaker behavioral signal and smaller audiences you need more variants and broader targeting to maintain performance.
United States (state-level patchwork). California (CPRA), Virginia, Colorado, Connecticut, and a lengthening list of states have active privacy laws, but enforcement is inconsistent and there is no federal law as of early 2026. The operational takeaway: the US remains the most permissive major market for targeting — exploit that advantage deliberately, and keep a contingency plan for TikTok's political uncertainty.
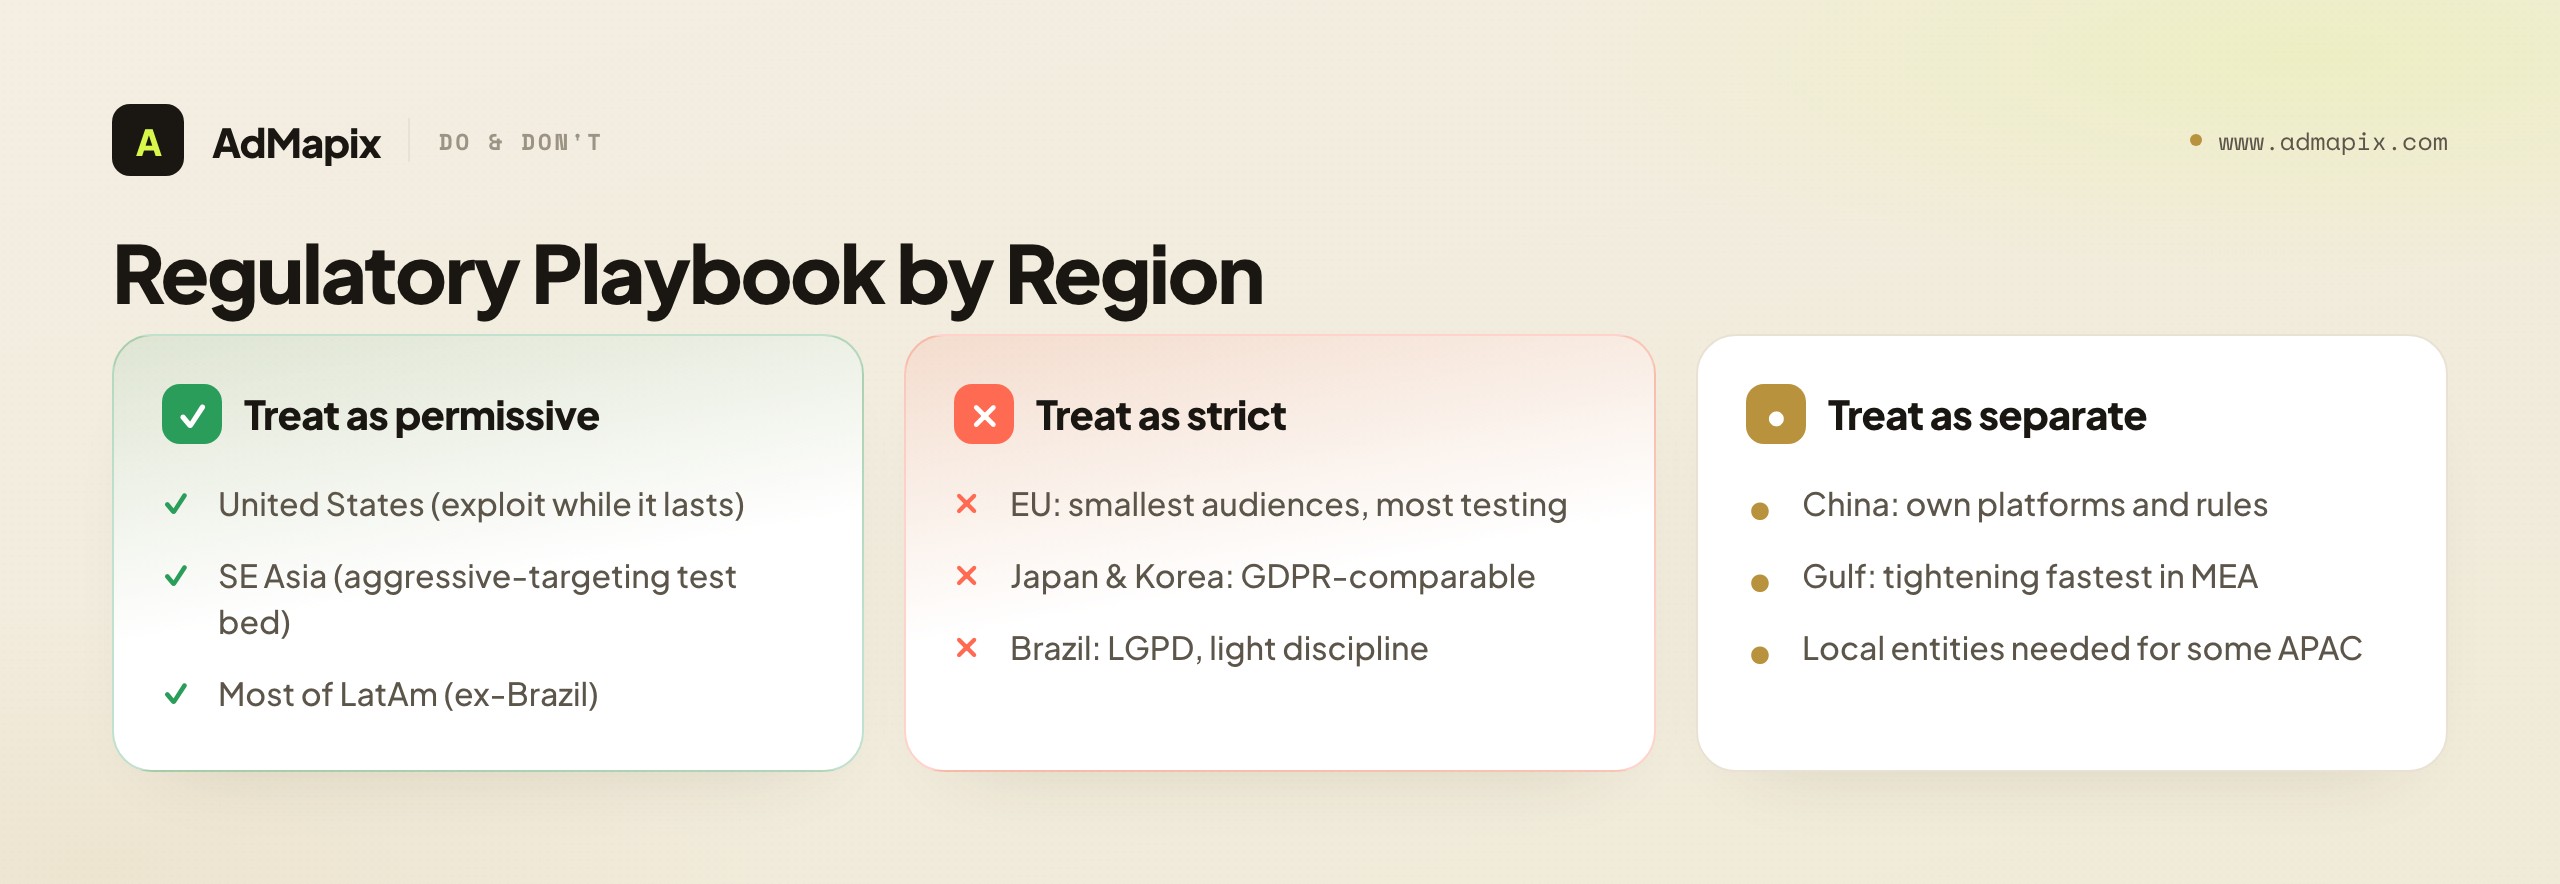
APAC (split regime). Japan and South Korea run GDPR-comparable regimes; Southeast Asia operates with minimal restriction; India has a data-protection law on the books with slow implementation; China is a walled ecosystem with its own rules entirely. The operational takeaway: treat Southeast Asia as your aggressive-targeting testing ground, and treat Japan and Korea like EU markets for compliance and creative-quality purposes.
Latin America. Brazil's LGPD is the region's most developed regime, GDPR-influenced but more permissive in practice; the rest of the region is closer to the US patchwork. The operational takeaway: Brazil needs light compliance discipline; the rest of LatAm can be treated as relatively permissive.
Middle East & Africa. Frameworks vary widely and are generally less mature than the EU's, with the Gulf states moving fastest toward formal data-protection regimes. The operational takeaway: compliance overhead is currently low, but expect the Gulf to tighten first.
The Platform-Level Privacy Layer: SKAdNetwork and Privacy Sandbox
The regional regimes above govern what you can target; a second, platform-level privacy layer governs what you can measure — and unlike GDPR or CPRA, it applies globally, the same way in Jakarta as in Frankfurt, because it is enforced by Apple and Google rather than by governments. For mobile specifically, two mechanisms now define the measurement floor in every region, so they belong in the planning conversation alongside the geographic regulation.
Apple's SKAdNetwork (SKAN), now at version 5+, is the iOS attribution backbone. Since App Tracking Transparency made the device-level IDFA effectively unavailable for most users, SKAN postbacks — privacy-preserving, aggregated, delayed conversion signals — are how iOS app-install performance is measured at all. The practical consequences are the same everywhere iOS has meaningful share (highest in North America, Japan, the Gulf, and Western Europe; lower in India, Southeast Asia, and Africa, where Android dominates): attribution is coarser, conversion windows are delayed and aggregated rather than real-time, and multi-touch clarity is limited. SKAN 5+ improved the situation with better postback windows and more usable conversion values, but the direction of travel is unchanged — iOS measurement is modeled and aggregated, not deterministic. This is why the regional bias toward cleaner-looking US numbers (discussed in the attribution section below) coexists with iOS being the hardest platform to attribute precisely: the US looks clean because its stacks are mature, not because SKAN is generous.
Google's Privacy Sandbox is doing the same thing to Android, on a longer timeline. Its Topics API (interest-based cohorts computed on-device) and Protected Audience API (formerly FLEDGE, for on-device remarketing auctions) are designed to support targeting and remarketing without cross-app identifiers. Rollout has been gradual and the performance signal is still uneven, but the strategic implication for the markets where Android is dominant — India, Southeast Asia, Latin America, Sub-Saharan Africa — is that the same shift toward contextual signals, on-device cohorting, and modeled measurement that hit iOS first is now arriving on Android. Teams that built first-party data, server-side events, and incrementality testing for the iOS transition are already equipped for the Android one; teams still leaning on deterministic cross-app tracking are not. The takeaway for a 2026 regional plan: budget the measurement adaptation by operating-system mix per region, not just by geographic regulation — a heavily-iOS Tier 1 market and a heavily-Android growth market need different measurement plumbing even before you reach their local privacy laws.
Vertical-by-Region Nuances Most Plans Miss
Region sets the baseline, but the interaction between vertical and region is where the most expensive surprises hide. A few patterns are worth holding in mind, because they override the generic regional advice above for specific app categories.
Gaming is the clearest case of region-vertical interaction. The US, Japan, and South Korea concentrate the overwhelming majority of mobile-game revenue, so a revenue-led gaming plan looks almost nothing like a generic "lead with low-CPM markets" plan. Yet creative iteration still belongs in Southeast Asia, because the cost of testing a new playable or UGC concept in Indonesia is a fraction of testing it in a US auction. The winning gaming workflow is therefore explicitly two-region: iterate cheap in Southeast Asia, monetize expensive in US/Japan/Korea. Treating it as one blended global plan wastes Tier 1 budget on unvalidated creative.
Fintech inverts some of the usual logic. The strict-regulation markets — Western Europe, Japan, Korea — are often the most valuable for fintech because regulatory trust correlates with the kind of high-LTV financial behavior fintech apps monetize. The compliance overhead that makes Europe slow for a casual game is less of a deterrent for a fintech product whose users expect, and reward, a compliant experience. Meanwhile, fintech in Southeast Asia, India, and Africa is a genuine growth story but a different product — wallets and micro-lending rather than brokerage and wealth — with its own creative language entirely.
Ecommerce and DTC live or die on the conversational and commerce-platform layer, which is exactly the layer that varies most by region. In LatAm, click-to-WhatsApp is frequently the highest-converting flow. In Southeast Asia and China, the action is on-platform inside Shopee, TikTok Shop, and the Chinese commerce ecosystem rather than on a standalone storefront. In the US and Western Europe, the standalone Shopify-style storefront plus retail-media combination still dominates. An ecommerce brand that ports its US storefront-funnel everywhere will badly underperform a brand that meets each region's commerce surface where it already is.
Subscription apps track the LTV map almost perfectly: lead with the US and Western Europe, where willingness to pay recurring fees is highest, and treat low-CPM markets as reach-and-awareness rather than direct subscription drivers unless the price point is localized aggressively downward. A flat global price tag is the single most common subscription mistake in price-sensitive regions.
Attribution and Measurement Differ by Region Too
Most regional planning conversations stop at spend, format, and CPM and never reach the part that quietly distorts every cross-region comparison: measurement. The same campaign measured in two regions is not measuring the same thing, because the attribution environment underneath the numbers is regionally specific.
In Europe, consent gating means a meaningful share of conversions are never observed at all. Users who decline tracking still convert, but those conversions land in the gap between modeled and measured — so reported ROAS in the EU systematically understates true performance unless you correct for it. Teams that compare a "measured" EU ROAS against a "measured" US ROAS and conclude Europe is weaker are often comparing a partially blind number against a clearer one. The fix is to lean on platform-side modeled conversions and incrementality testing in the EU rather than treating click-and-view attribution as ground truth, and to benchmark EU performance against EU history rather than against US numbers.
In APAC, the measurement challenge is fragmentation rather than consent. When a meaningful slice of your acquisition runs through LINE, KakaoTalk, Naver, or the Chinese platforms, those conversions live outside the Meta-and-Google attribution stack that anchors your Western reporting. Stitching them into a single view requires an MMP (mobile measurement partner) configured for those local SDKs, and even then the data quality varies. The practical consequence is that APAC blended numbers are often less complete than they look, and the local-platform contribution is frequently undercounted in dashboards built for the global platforms.
In the US, attribution is the cleanest of the major regions in practice — not because privacy regulation is absent, but because enforcement is inconsistent and the platform attribution stacks are mature. This is part of why US numbers feel more trustworthy and why teams over-index on them: the measurement is better, so the region looks better-behaved, which reinforces the bias toward US-centric planning. The discipline is to remember that cleaner measurement is not the same as better performance — it just looks that way on a dashboard.
In Latin America, the wrinkle is the WhatsApp and click-to-message layer, where a large share of the actual conversion happens inside a conversation that standard attribution can't see end to end. A click-to-WhatsApp campaign can look mediocre on cost-per-click and excellent on actual closed business, and the two numbers can diverge wildly. Measuring LatAm well means instrumenting the conversational layer, not just the ad click.
The cross-region takeaway is simple and easy to get wrong: never rank regions on a single blended efficiency metric pulled from one attribution stack. Benchmark each region against its own history and its own measurement reality, and use incrementality testing — not last-click attribution — whenever you need to compare regions against each other for budget decisions.
Seasonality and the Regional Ad Calendar
Auction costs and audience receptivity swing on a calendar, and that calendar is regional. Planning a global campaign on a single seasonal curve — usually the US holiday curve — overpays in some markets and underspends in others at exactly the wrong moments.
The US and Western Europe share the familiar Q4 spike: CPMs climb steeply from late October through December as ecommerce and retail flood the auctions around Black Friday, Cyber Monday, and the holidays, then drop sharply in January. If your product isn't seasonal, Q4 is the most expensive and least efficient time to acquire in these markets, and January is frequently the cheapest. Many app advertisers should be doing the opposite of retail — pulling back in the Q4 auction crush and leaning into the January reset.
APAC runs on different peaks entirely. China's calendar centers on Singles' Day (11.11), the largest shopping event in the world, plus the 6.18 mid-year festival and Chinese New Year — none of which align with the Western Q4. Singles' Day has spread across Southeast Asia as a regional shopping moment, and the double-date sales (9.9, 10.10, 11.11, 12.12) on Shopee and TikTok Shop create a cadence of cost spikes that a Western seasonal model completely misses. In Indonesia, Malaysia, and other Muslim-majority Southeast Asian markets, Ramadan and the Eid period reshape both auction costs and audience behavior for weeks, with a pronounced surge in mobile usage and commerce that rewards advertisers who plan around it.
Latin America layers its own moments on top: Brazil's Carnival, regional independence days, and a Black Friday that has grown into a major event but behaves differently from the US version, often with a longer, more skeptical buildup. The Gulf states see their largest commerce and engagement swings around Ramadan and Eid, similar to Muslim-majority Southeast Asia, plus white-label shopping festivals tied to local retail.
The planning takeaway is to maintain a per-region seasonal calendar rather than a global one, and to set CPM expectations and budget pacing against each market's own peaks. The same dollar buys very different efficiency depending on whether it lands during a region's auction crush or its quiet stretch — and the crushes don't line up across regions, which is itself an opportunity for a team disciplined enough to rotate budget toward whichever region is currently in its off-peak.
Regional Media Strategy: A Decision Framework
All of the above converges on a single planning question: given your KPI, your product, and your budget, where should the money go and in what order? The framework below turns the regional analysis into allocation decisions.
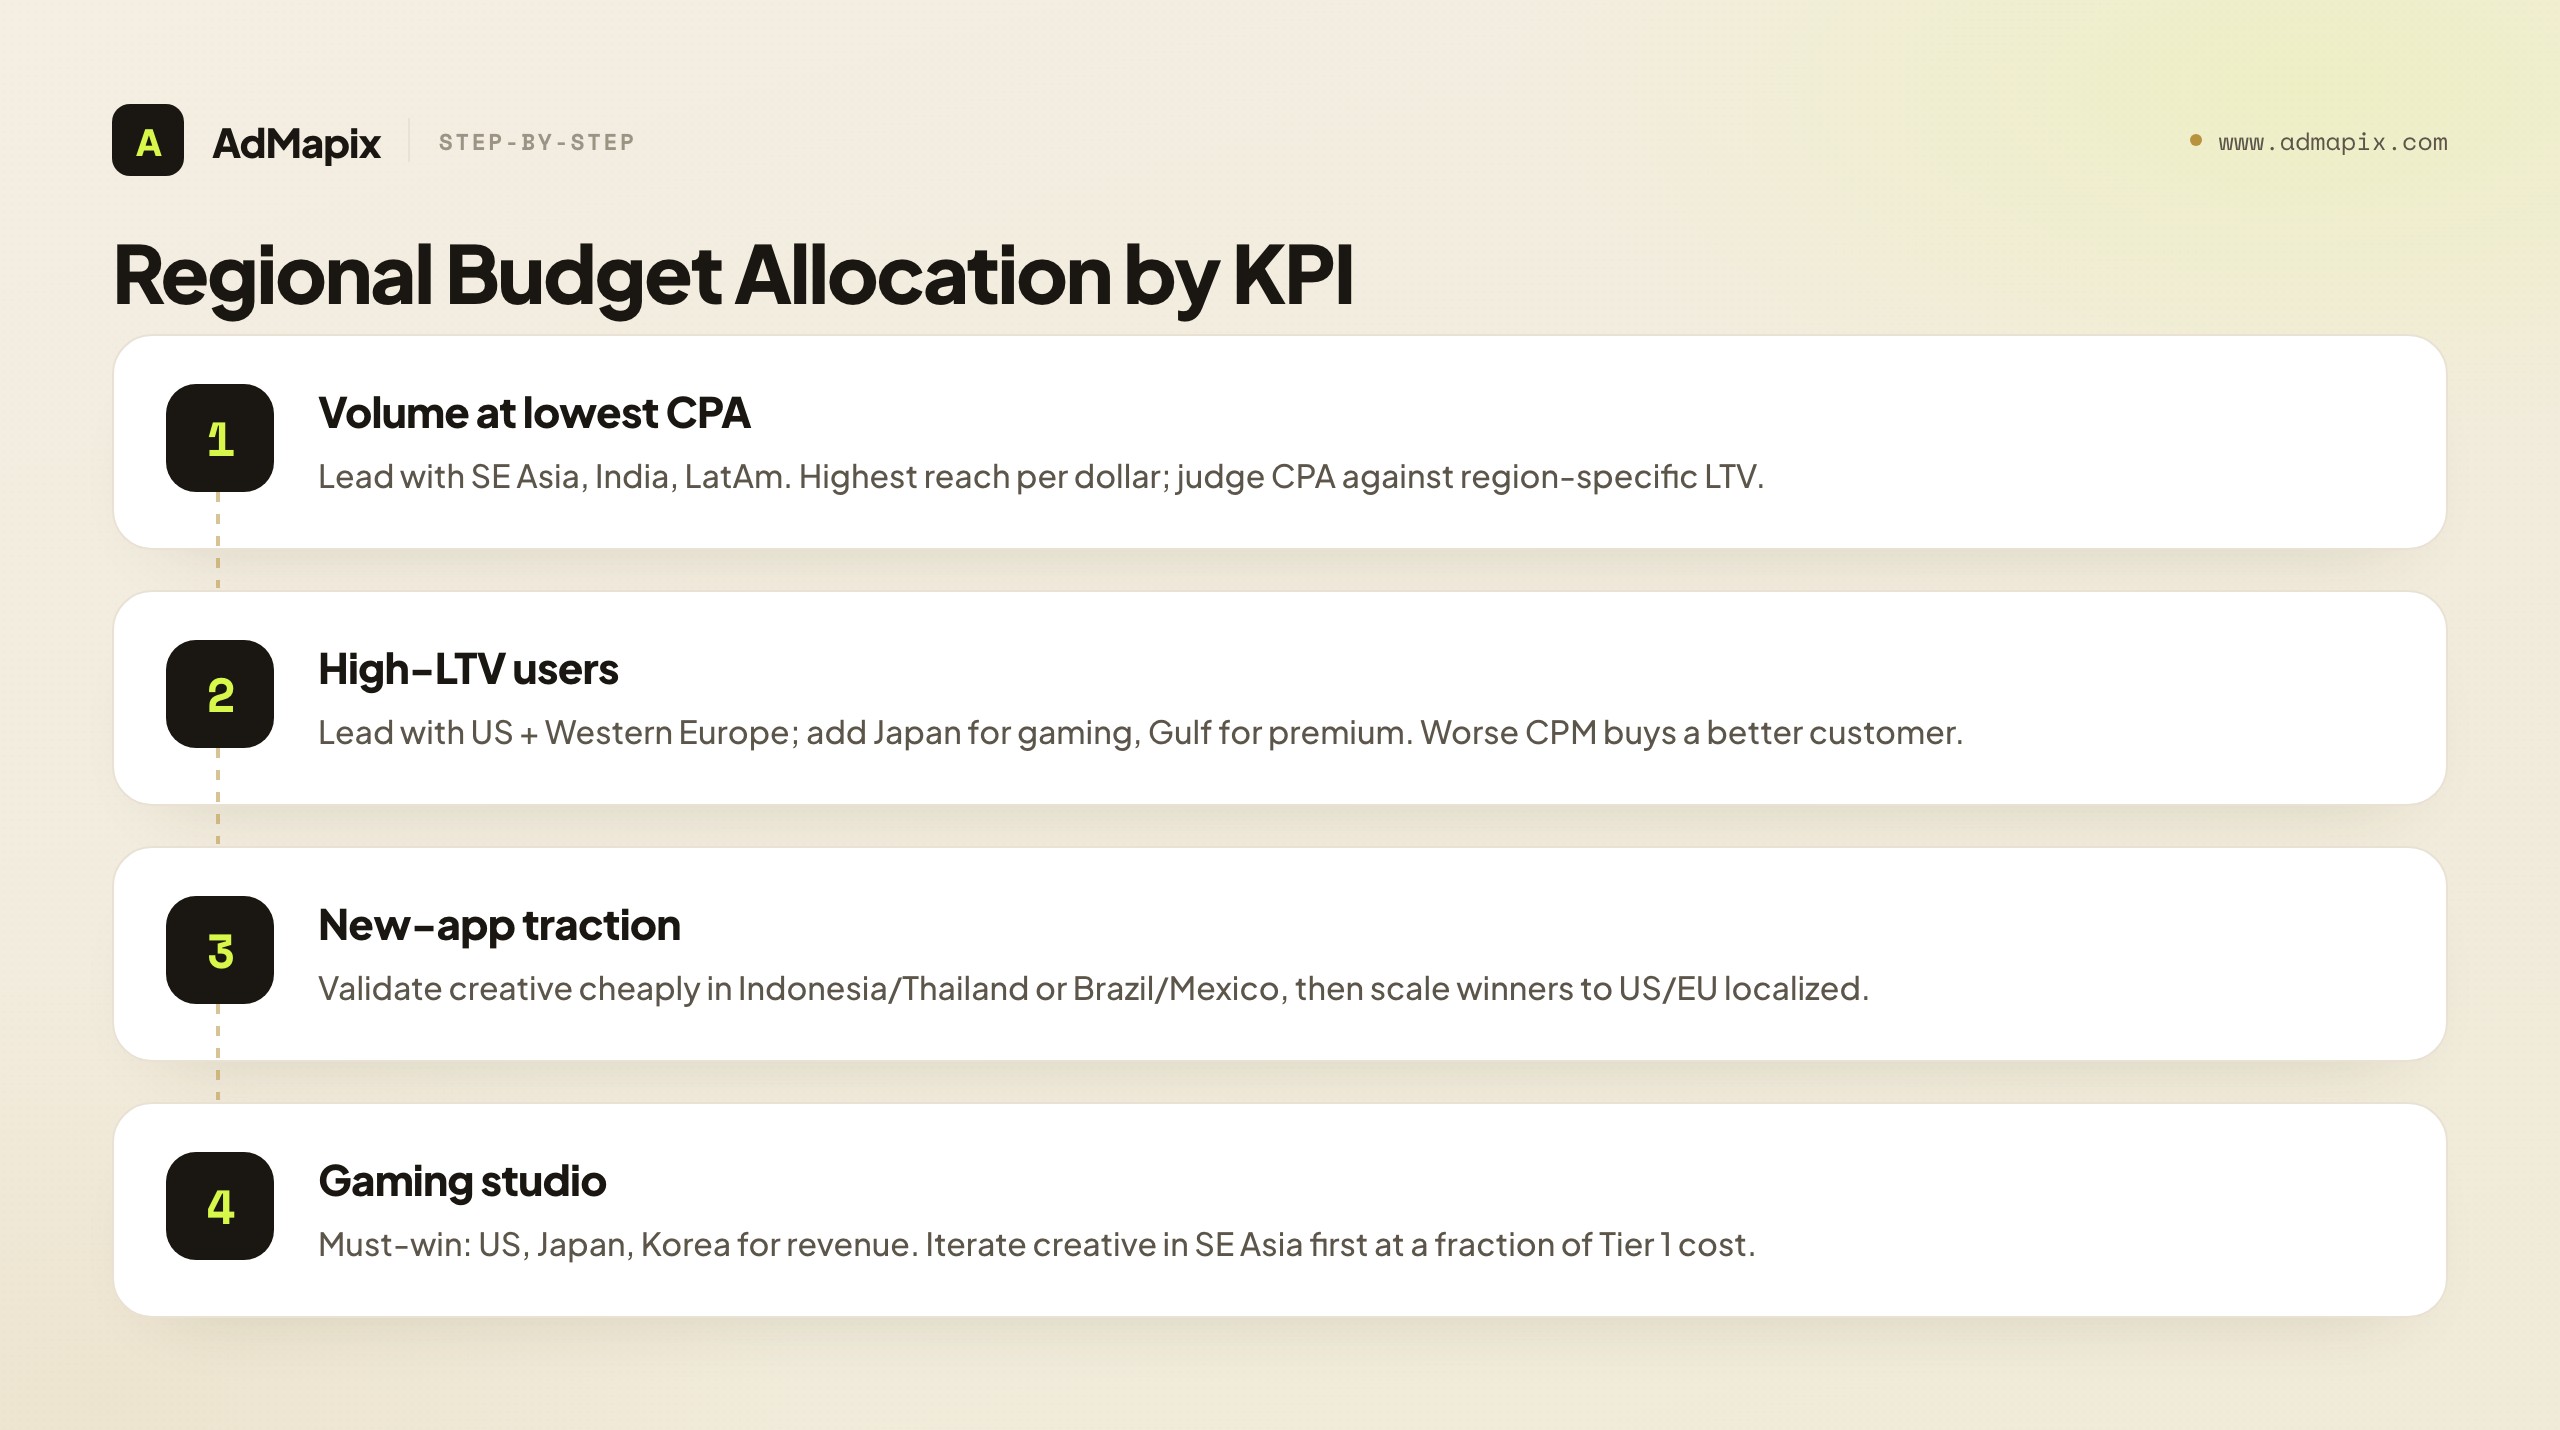
If your primary KPI is volume (installs/downloads) at the lowest CPA: Lead with Southeast Asia, India, and LatAm. These are the highest-volume-per-dollar regions in the world. Accept lower per-user LTV in exchange for reach and learning velocity, and hold yourself to CPA-against-region-specific-LTV rather than absolute CPA.
If your primary KPI is high-LTV users (subscriptions, in-app purchases): Lead with North America and Western Europe, where CPAs are higher but per-user LTV runs an estimated 3–5x higher. Add Japan for gaming and the Gulf for premium consumer categories. These are the markets where a worse CPM buys a better customer.
If you're launching a new app and need initial traction: Test in one Southeast Asian market (Indonesia or Thailand) or one LatAm market (Brazil or Mexico) to validate creative and messaging cheaply. Low CPMs make iteration inexpensive; scale the winners into the US and EU with properly localized creative rather than re-subtitled versions.
If you're a B2B app: Lead with the US, then the UK, Germany, Australia, and Singapore. LinkedIn is uniquely strong in these markets, and the buying audience concentrates there. Skip consumer-heavy APAC and LatAm markets until you have B2B product-market fit.
If you're a gaming studio: The US, Japan, and South Korea are the three must-win markets for mobile game revenue. But run creative iteration in Southeast Asia first, where the cost of testing is a fraction of Tier 1 economics, then scale validated creative into the high-revenue markets.
How Competitive Creative Intelligence Closes the Regional Gap
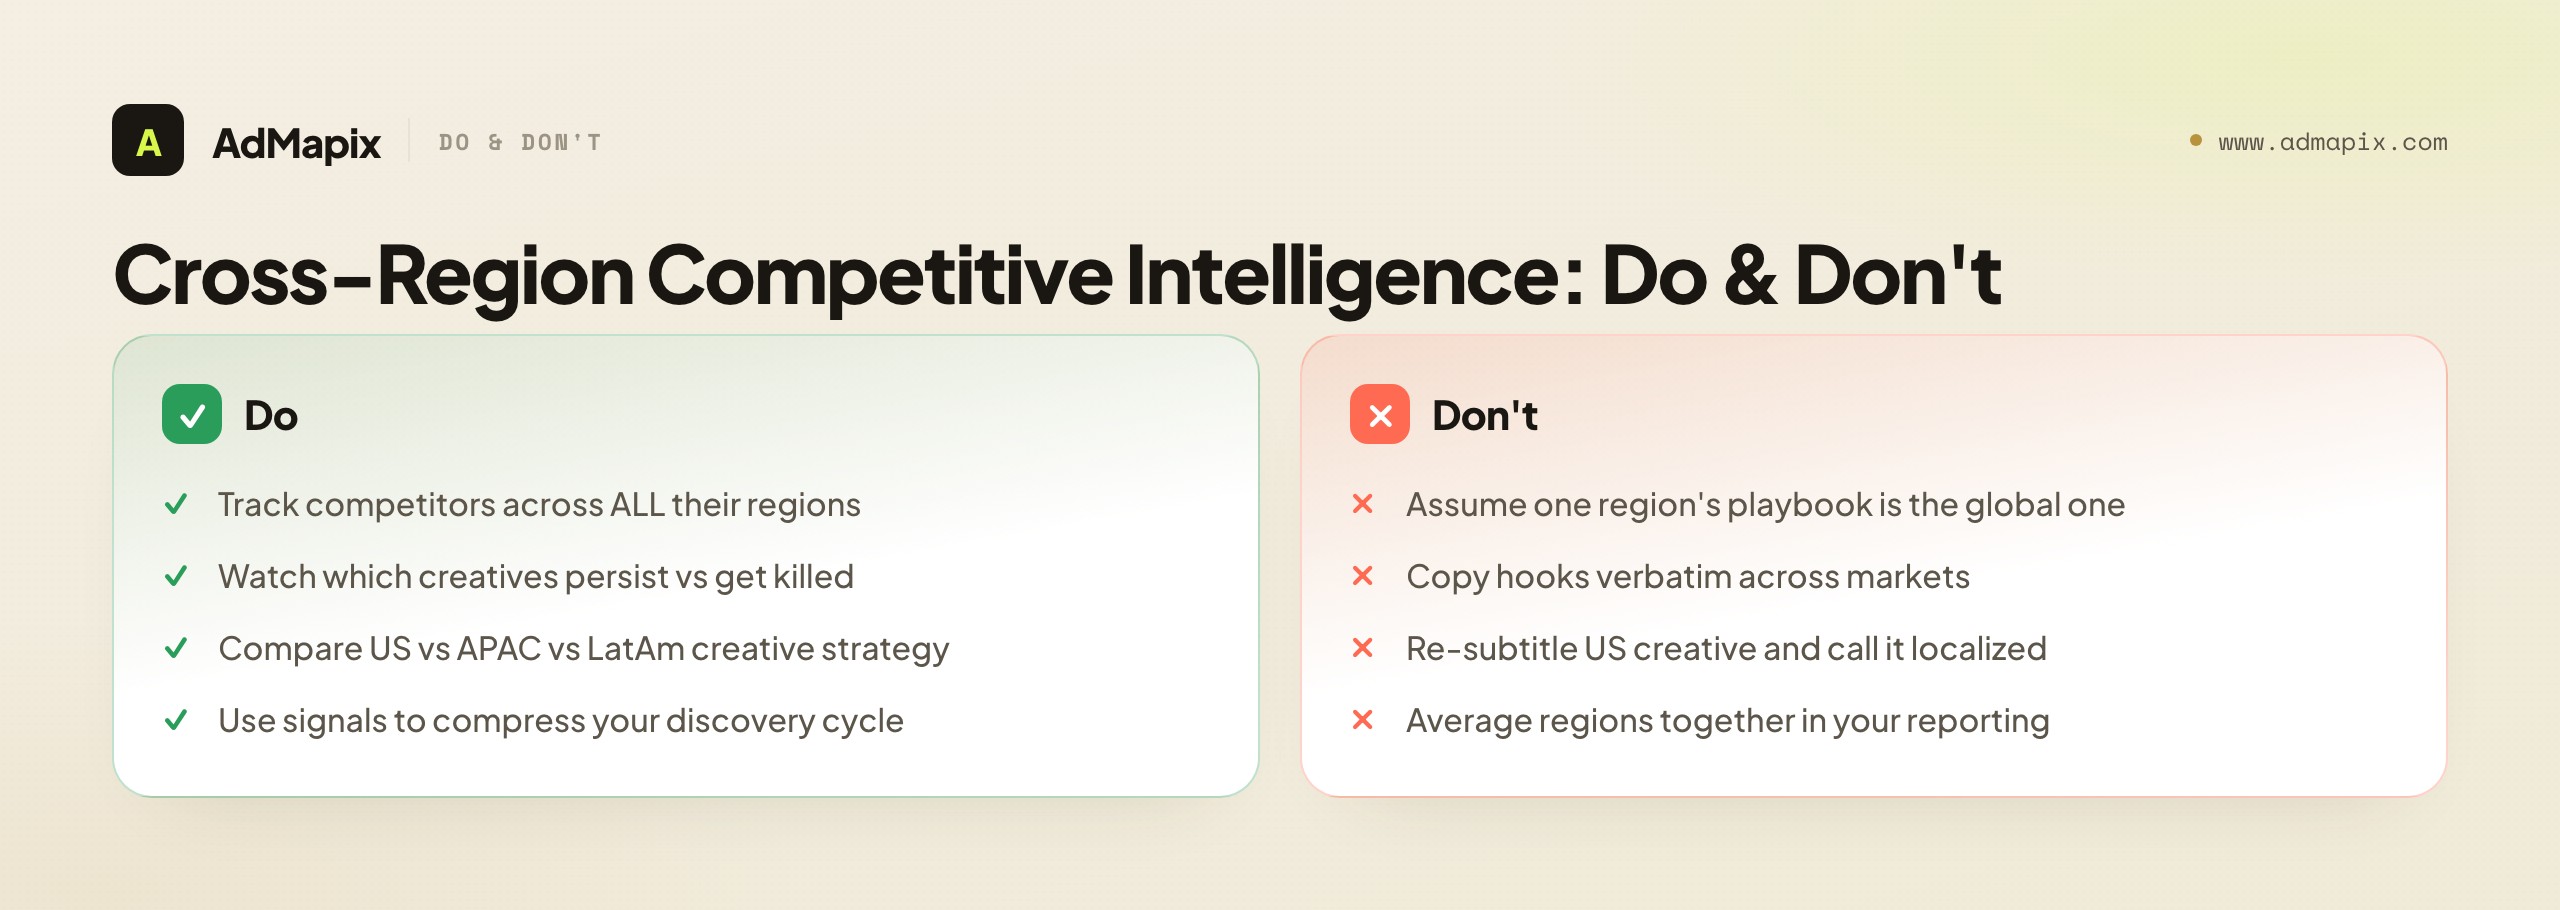
The hardest part of regional planning is not the macro data — it is knowing what actually works, creatively and tactically, inside a market you don't operate in yet. That is precisely where competitive intelligence earns its place. A competitor's US creative strategy is almost never the same as its APAC or LatAm one: different hooks, different formats, different platform emphasis, different localization depth. A team that only watches a rival's US ads sees one frame of a multi-region movie.
Tracking competitor ads across channels and regions reveals the full strategy — including the parts a competitor has figured out in markets you're about to enter. If a rival has been running a specific UGC format on TikTok in Indonesia for three months while killing variants weekly, that persistence is a signal you can act on before spending a dollar of your own discovery budget. If their Brazil creative leans entirely on click-to-WhatsApp flows while their US creative never touches messaging, that contrast tells you something structural about how they think the two markets convert.
This is where AdMapix fits into the regional workflow: cross-region competitive creative intelligence, so you can see how competitors localize — or fail to localize — across the exact markets in this article before you commit budget. You can browse reports or review pricing to see how it maps onto a regional plan. The goal is not to copy a competitor's ads; it is to compress your own per-region discovery cycle by learning from theirs.
FAQ
Which region has the lowest mobile ad costs in 2026?
India and Southeast Asia (Indonesia, the Philippines, Vietnam) have the lowest CPMs in the world, often an estimated 80–90% below US benchmarks, with Latin America and Sub-Saharan Africa close behind. But low CPMs come with lower purchasing power per acquired user, so the metric to optimize is never CPM in isolation — it is CPA relative to a realistic, region-specific LTV. A $0.50 CPM that buys a user who will never spend is more expensive than a $10 CPM that buys a subscriber.
Is the EU mobile ad market still worth investing in despite the regulation?
Yes, for the right verticals. Gaming, fintech, and subscription apps still show strong returns in Western Europe. The regulatory overhead is real but manageable if you build compliance into your creative and consent workflow from day one rather than bolting it on. The bigger practical challenge is audience size: consent requirements shrink addressable reach by an estimated 20–40%, so you need more creative variants and broader targeting to maintain the performance you'd get from a comparable US audience.
How fast is the APAC mobile ad market actually growing?
In aggregate, APAC is the fastest-growing major region at a double-digit pace — but that growth is concentrated in Southeast Asia and India. Japan and South Korea are mature markets growing at a low-single-digit rate, more comparable to Western Europe, and China grows on its own separate trajectory inside a closed ecosystem. Quoting a single "APAC growth rate" hides more than it reveals; plan at the market level, not the regional one.
Do I need separate ad accounts for different regions?
For Meta and Google, a single ad account can target multiple regions, so a global plus localized structure works for the open-market platforms. For local APAC platforms (LINE, KakaoTalk, Naver, WeChat) and for some commerce surfaces, you will need separate accounts — often requiring local business entities or partners. Factor that operational and legal overhead into your regional expansion timeline, because it is frequently the real bottleneck, not creative or budget.
Why are US CPMs so much higher than APAC or LatAm CPMs?
Three reinforcing factors: auction density (the largest advertisers in the world all bid into the same US inventory), high purchasing power (advertisers will pay more for a US user because that user is worth more), and platform consolidation (a small number of platforms control most of the reach, so there's no cheap alternative inventory to escape into). The combination keeps US CPMs at the top of the global range — an estimated 3–5x Southeast Asia and LatAm and 8–15x India for the same platform and format.
Should I run the same creative across all regions to save on production?
No — at least not without localization beyond translation. Short-form video is the closest thing to a portable format, but the hooks, pacing, casting, on-screen text, and cultural references that make a creative work do not travel. A natively conceived local creative reliably outperforms a re-subtitled global one. The efficient pattern is to develop and validate creative concepts cheaply in low-CPM markets, then properly localize the winners for expensive Tier 1 markets rather than porting them verbatim.
Which region is best for testing new creative before a global launch?
Southeast Asia (Indonesia, Thailand) and Latin America (Brazil, Mexico) are the best testing grounds because low CPMs make iteration cheap and the audiences are still receptive to formats that feel stale in saturated markets. Validate the concept, messaging, and format there, then scale the proven creative into the US and EU with full localization. You get more learning per dollar in the testing phase and reduce the risk of burning expensive Tier 1 budget on unvalidated creative.
How do I handle TikTok's regional uncertainty in a 2026 media plan?
Treat TikTok as a high-value channel with a known political risk, and plan for the risk rather than ignoring it. Concretely: keep a documented contingency that specifies where TikTok budget reallocates by market if availability changes, maintain creative that can move to Reels and Shorts without a full rebuild, and avoid letting any single market become so TikTok-dependent that an availability shift would crater your acquisition. The goal is resilience, not avoidance — TikTok is too effective in most markets to skip on principle.
What's the single biggest mistake teams make with regional media buying?
Averaging. They run one global campaign across a dozen countries, watch the blended CPA, and treat the mean as a finding — which silently averages a high-CPM, high-LTV market against a low-CPM, low-LTV one and hides both the best and worst performers. The fix is to plan, budget, and report at the regional (often the market) level, so you can see that your "flat" blended number is actually a great US result dragging up a poor Southeast Asia execution, or vice versa.
Related Reading
- Competitor Ad Spend: How to Estimate It — methods for sizing a rival's budget, which pairs directly with the regional CPM economics here.
- Paid User Acquisition: A 2026 Playbook — the channel-and-funnel layer that sits underneath regional allocation.
- Mobile Game Marketing Strategy — the gaming-specific lens on the must-win US/Japan/Korea markets discussed above.
- Playable Ads Guide — a deep dive on the format that's a US and China strength but niche elsewhere.
- TikTok Ads Research Guide — for navigating the platform whose regional availability shapes so much of this analysis.
- Competitor Ad Analysis Framework — the 5-dimension system for turning cross-region competitor data into testable hypotheses.
Authoritative Sources
- eMarketer (EMARKETER) — global and regional ad spend forecasts
- Statista — mobile advertising market data by region
- data.ai / Sensor Tower — mobile app and ad market intelligence
- IAB Europe — European digital advertising and DMA/DSA guidance
- European Commission — Digital Markets Act overview
- WARC — global advertising trends and regional benchmarks
The figures in this article are directional, industry-benchmark estimates drawn from public forecasts and our own cross-region creative-tracking data. Exact totals vary by source and methodology; use them to size relative magnitudes and growth directions, not as audited line items.
See what competitors are really running
Search 6M+ ad creatives, landing pages, and weekly spend across 200+ countries. No credit card, no commitment.
Related Articles

Mobile Game Ad Spend by Platform: A 2026 UA Budget Guide (Meta, Google, TikTok, DSP)
A practitioner's guide to mobile game ad spend by platform: how UA budgets really split across Meta, Google, TikTok, and DSPs; the mechanism behind each platform's role; how privacy-era measurement, creative systems, and genre fit change the split; a budget-allocation framework; a reallocation cadence; and the honest limits of what competitor spend data can and cannot tell you.

2026 H2 Ad Market Outlook: Platform Shifts, AI Buying, and Budget Strategy
A compressed, decision-ready H2 2026 advertising outlook: platform share shifts, AI buying defaults, privacy pressure, format economics, regional budget moves, and a Q4 operating plan.

2026 Mobile Advertising Market Trends: Formats, Policies, Spend
A 2026-ready guide to mobile ad shifts: new formats, platform policies, spend trends, and emerging markets with actionable playbooks.